Abstract
The purpose of this paper is to develop a modified method of measuring VAIC for small and medium-sized farms and to determine the relationship of this measure on farm area. The main objective will be implemented through the following specific objectives: (1) indication of the generating variables VA, VC, HC and SC, (2) determination of synthetic measures of VA, VC, HC and SC, (3) determination of CEE, HCE, SCE and VAIC and (4) to determine the relationship between the values obtained in objective 2 and 3 and the area of the farm. The analyses were carried out on data obtained from 2980 small and medium-sized farms from Lithuania, Poland, Romania, Moldova and Serbia. The determination of VAIC was carried out on the basis of synthetic measures determined by the TOPSIS-CRITIC method. VAIC was determined in accordance with the scheme proposed by Pulic. All data were converted to one hectare of farm area. The analysed farms were divided into four classes depending on the area. A contrast analysis was carried out between the designated classes. Analyses were conducted for each of the five countries separately. The alternative VAIC measurement method presented needs to be refined in terms of the selection of classified variables to create synthetic measures. The analysis indicates that it is feasible to measure VAIC through the use of alternative measures in the form of synthetic measures while at the same time preserving the principles resulting from the VAIC concept. The uniqueness of the method lies in the use of synthetic measures to determine VAIC in companies that do not possess complete accounting information. In addition, failures in the proposed method have been eliminated in terms of the method’s compatibility with human capital theory. The methodology used is an original approach to measuring the value of intellectual capital. In addition, it should contribute to the re-verification of the VAIC.
1. Introduction
Research on the value of human capital in agriculture is very rarely conducted. This phenomenon is probably due to the lack of a methodology adjusted to the specificity of farms. The two problems mentioned sparked interest in addressing the challenge of trying to provide a method for measuring VAIC.
Statistical analyses of farms in the countries of the European Union indicate that approximately half of farms are farms with an area of up to 2 ha, and approximately a further 22% are farms with 2–5 ha of agricultural area [1]. Such a significant number of such business entities should not be ignored; hence, actions should be taken to support every aspect of their economic activity.
It is widely believed that small and medium-sized farms provide food for the local market, play a significant role for the environment and contribute to building social bonds [2,3]. Certainly, these measures can be more effective with a high level of involvement of the intellectual capital held on these farms [4]. Especially in rural areas, there is a need for a significant commitment to intellectual capital, which will enable the successful implementation of environmental and climate objectives that will, in the long term, play an important role in the sustainable development not only of rural areas but also of the economy as a whole. Recently, considerable attention has also been paid to the role of digitalisation in agriculture, leading to a limitation of the use of chemicals in agriculture. Implementing such an initiative is difficult to imagine without adequate intellectual capital resources on the farm.
VAIC (Value Added Intellectual Coefficient) is primarily intended for use in knowledge-based economic sectors, but unfortunately, the analysis of VAIC in small and medium-sized agricultural holdings does not meet this condition; certainly, agriculture cannot be considered a knowledge-based economic sector [5]. Despite this, there are publications on VAIC measurement results in large agricultural enterprises, characterised by keeping accounts similar to those of large companies [4,6,7,8]. The issues of VAIC measurement have also been analysed in Chinese agricultural companies listed on stock exchanges. Human capital has been divided into executive and non-executive in these analyses [9,10,11]. Precisely the lack of use of appropriate accounting arrangements is the main obstacle to measuring VAIC on small and medium-sized farms. Small and medium-sized farms have a limited amount of agricultural land resources at their disposal, most often deprived of the possibility to increase their area due to the land deficit. In this situation, intellectual capital may contribute to intensive agricultural production requiring this capital. The paper also accepts the main criticism of VAIC related to the strictly financial valuation of VAIC components [12]. Given the above concerns about the financial expression of VAIC components, a method for measuring this quantity based on synthetic measures is proposed.
The above considerations led to the aim of this paper to develop a modified VAIC measurement method for small and medium-sized farms and determine the relationship of this measure on farm area. The main objective was implemented through the following specific objectives:
- (1)
- Identification of the variables generating VA (value added), VC (net asset value), HC (human capital) and SC (structural capital);
- (2)
- Determining synthetic measures of VA, VC, HC and SC;
- (3)
- Determination on the basis of the model used with the use of synthetic measures CEE (structural capital efficiency), HCE (human capital efficiency), SCE (structural capital efficiency) and VAIC;
- (4)
- To determine the relationship between the values obtained for objectives 2 and 3 and the area of the farm.
The aim of the study indicated above should enable verification of the following research hypothesis: the analysed values of VA, VC, HC and SC and the efficiencies of CEE, HCE, SCE and VAIC calculated on their basis differ depending on the area of a farm.
2. Literature Review
Intellectual capital is generally understood as an important factor in stimulating improved firm competitiveness and value generation in a knowledge-based economy [13,14]. Traditional methods of measuring economic performance do not represent good metrics in relation to the knowledge economy. These measures do not reveal the relationship between intellectual capital and value added created [15]. Therefore, the use of added value in connection with the knowledge economy is the right line of analysis. The primary role of VAIC is to demonstrate the stimulation of economic growth both at the microeconomic level and at the macroeconomic level in relation to the value added generated by referring to intellectual capital. At the microeconomic level, professional skills, work experience, professional training, customer and stakeholder relationships, a brand of products, signed contracts with partners, company culture, work environment and intangible rights are most often classified as intellectual capital [12]. In calculating the National Intellectual Capital Index (NICI)—this measure captures the macroeconomic level of VAIC—a modified Edvinsson and Malone algorithm is used [16]. The NICI calculation uses the National Human Capital Index (NHCPI) determined through literacy rate, number of tertiary schools per capita, percentage of primary teachers with required qualifications, number of tertiary students per capita, cumulative tertiary graduates per capita, percentage of male grade 1 net intake and percentage of female grade 1 net intake. The second index used in the NICI is the National Process Capital Index (NPCI) which was calculated using telephone mainlines per capita, personal computers per capita, Internet hosts per capita, Internet users per capita, mobile phones per capita, radio receivers per capita, television sets per capita and newspaper circulation per capita. Another index used to determine the NICI is the National Market Capital Index (NMCI), which is calculated using high-technology exports as a percentage of GDP, number of patents granted per capita and number of meetings hosted per capita. However, the National Renewal Capital Index (NRCI) used in the calculation of the NICI is determined by considering the following values: book imports as a percentage of GDP, periodical imports as a percentage of GDP, total R&D expenditures as a percentage of GDP, number of ministry employees in R&D per capita, number of university employees in R&D per capita and tertiary expenditure as a percentage of public education funding. Furthermore, also used in determining the value of NICI, National Financial Capital (NFC) is represented by national financial capital, GDP per capita [17].
Value Added Intellectual Coefficient (VAIC) is a widely used tool for measuring intellectual capital (IC). However, recently, this measure has come under criticism [18]. Some modern literature has questioned the measurement of structural and physical capital [19]. In criticism of the VAIC method, it is described that the way VAIC is calculated does not give reason to speak of intellectual capital because the variables used in this index are financial values indicating labour productivity [12].
The Pulic model [15] considers intellectual capital as an investment, which would be correct if this investment were treated in the same way as an investment, i.e., by taking account of its amortisation, and not simply as a company’s expenditure on its workforce, understood as wages and investment in its workforce over the period analysed in the VAIC calculation.
With the financial method of calculating VAIC, we encounter situations where the structural capital is zero or negative, in which case VAIC can take on zero or negative values [12].
Some studies indicate that VAIC demonstrates the efficiency of a company’s labour and capital investment, and this is supposed to show that it has nothing to do with intellectual capital. It is also pointed out that the VAIC calculation method uses overlapping variables which leads to numerous mistakes. It is also pointed out that there is no significant correlation of VAIC with a company’s stock market value. Mistakes in the calculation of structural capital and misinterpretation of the concept of intellectual capital are cited as the main reason for the criticisms mentioned [12].
It is often mentioned in the literature that off-balance sheet resources (not presented in the financial statements) are referred to as intellectual capital [20].
Some research shows that the components indicating structural capital efficiency (SC) and structural capital efficiency (SCE) do not affect a firm’s VAIC [13]. There is also well-known research that shows that the efficiency of the use of structural capital and the stock of human capital have the greatest influence on the level of VAIC [20].
Analysing the literature, we can find extended models (MVAIC); in these models, additional components are used, and they can include R&D and advertising expenses [21].
We also encounter a modified version of VAIC referred to as AVAIC. There are two changes in the AVAIC model; the first is that value added (VA) is adjusted for retrospective R&D expenditure, and the second is that R&D costs replace structural capital [22]. However, this model only applies to companies that perform research and development activities.
Regression analyses in research on Korean firms reveal that physical capital is the most important factor affecting business performance. Human capital was seen as a productivity booster, structural capital had no significant effect on business performance and innovation and relational capital affected firms’ profitability [8,13].
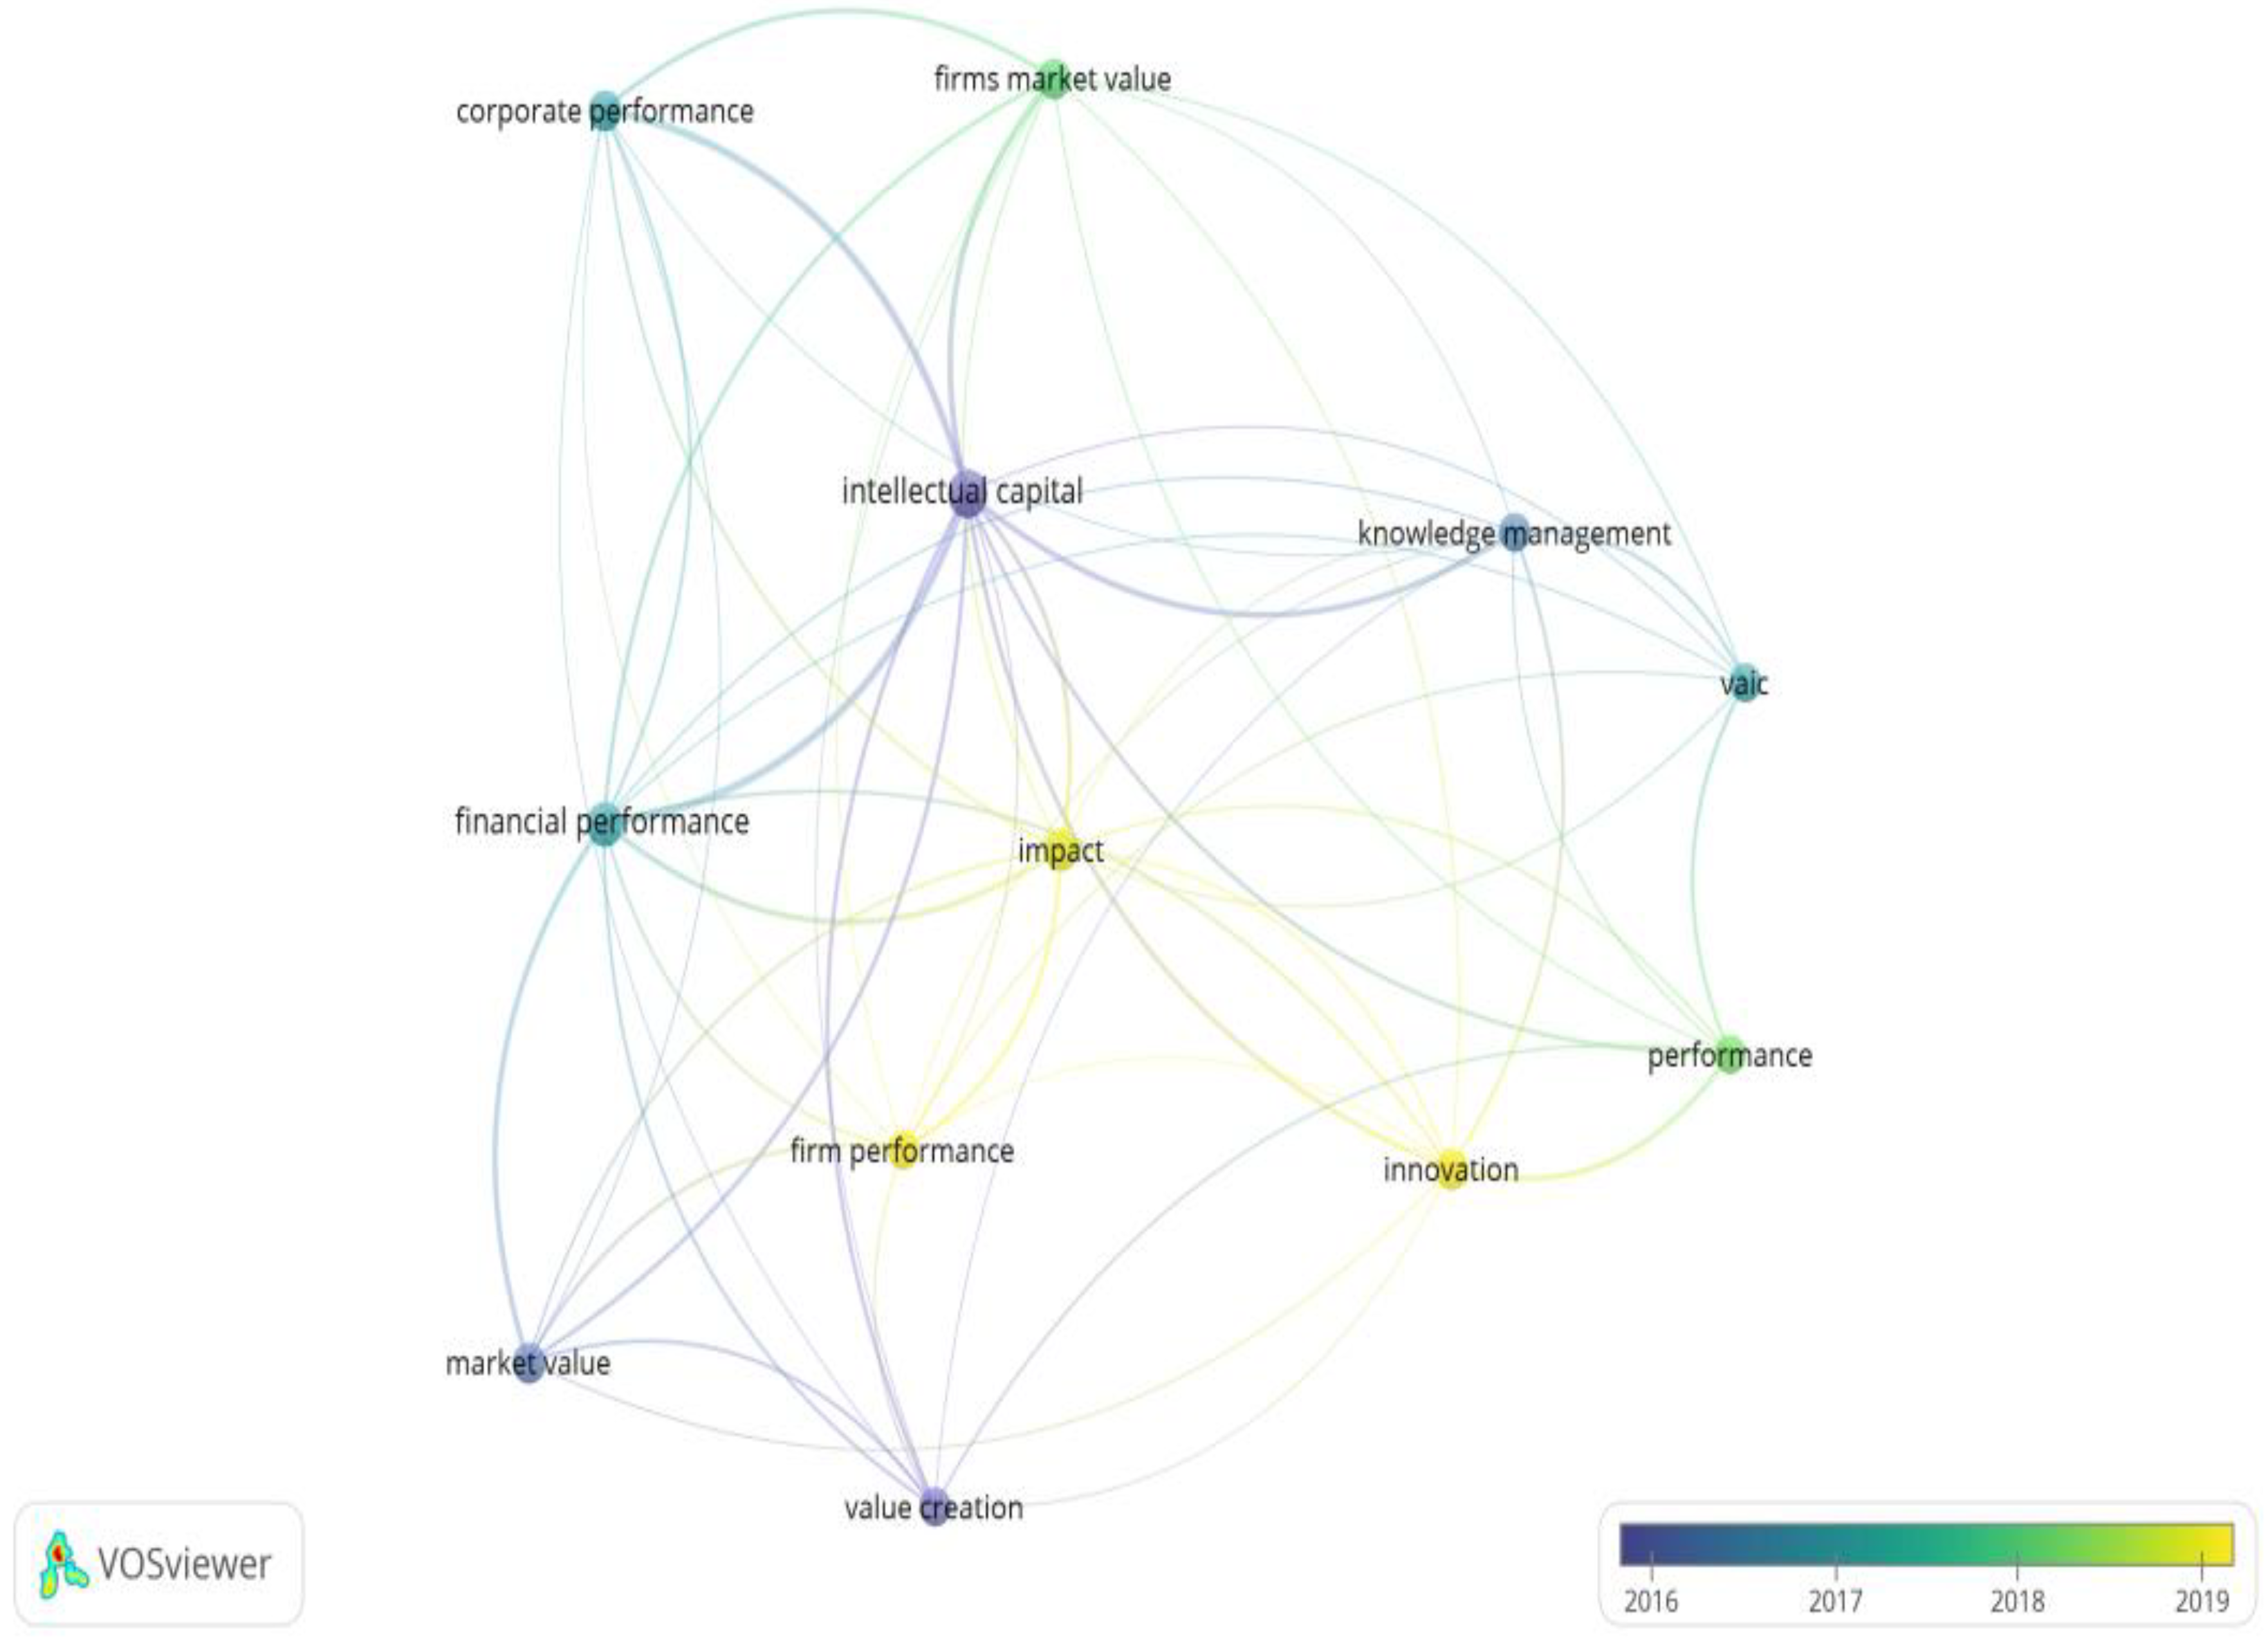
The VOSviewer text mining function used allowed the main links of intellectual capital to be visualised. The research was conducted through analysis of the literature included in the Clarivate database between 2016 and 2022 (January). Figure 1 shows three clusters with a total link strength of 54. Further analysis identifies the factors that impact intellectual capital. The first cluster involves the concepts of financial performance, firm performance, impact, market value and value creation. Cluster two covers the concepts innovation, knowledge management, performance and VAIC, and the third cluster, corporate performance, firms market value and intellectual capital.
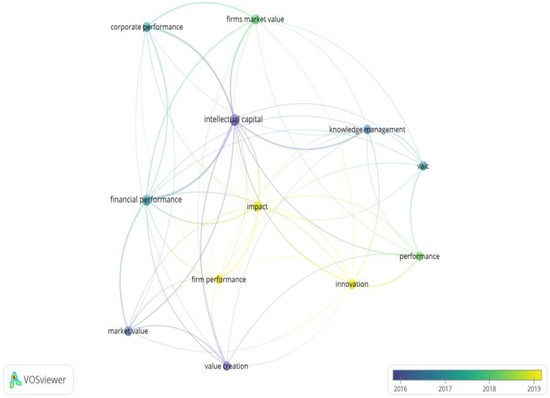
Figure 1.
The network map of bibliometric analyses concerning intellectual capital (based on the Clarivate data, January 2022).
Table 1 presents the most important co-occurrence of keywords in the overall scope of the literature on the determinants of intellectual capital. Therefore, it can be assumed that “financial performance” and “corporate performance” were considered the main drivers of intellectual capital.

Table 1.
The most important co-occurrence of keywords in the overall literature on the determinants of intellectual capital.
3. Research Methodology
Family small and medium-sized farms from Lithuania, Moldova, Poland, Romania and Serbia were analysed. The countries selected for analysis have a similar history related to the period of socialism. In a similar way, socialism shaped the situation of small and medium-sized farms, influencing mainly the level of agricultural fragmentation and economic conditions. Analysing the variety of definitions, the qualification criteria for the group of small and medium-sized agricultural farms were an area of the farm up to 20 ha or the value of standard output up to EUR 25,000 and the share of own labour involved in agriculture at a minimum of 75% [19,23].
The sources of empirical data were the results of surveys conducted within the framework of the National Agency for Academic Exchange’s project entitled “The role of small farms in sustainable development of the food sector in Central and Eastern European countries”, project number PPI/APM/2018/1/00011. The positive aspect of the data collected is that it covers as many as 5 countries. Analyses were conducted on a sample of 928 farms from Lithuania, 444 farms from Moldova, 448 farms from Poland, 784 farms from Romania and 376 farms from Serbia. Therefore, in total, the sample comprised 2980 farms. A drawback of the data collected is that it relates to only one year, that is, 2019. Data that deviated significantly from the sample and incomplete data were eliminated from the research sample before calculation.
Data were collected through face-to-face interviews by farm advisors or specialised companies. During the interview, a structured questionnaire contained four thematic blocks of questions: economic and social sustainability, environmental sustainability, market connections and general farm characteristics. To ensure the accuracy of data collection, the main study was preceded by a pilot study. The pilot study included several interviews in selected farms to verify the correctness and clarity of the survey questions. As a result of the pilot studies, unintelligible questions were removed or corrected, and appropriate comments were added to the remaining questions.
The determination of VAIC based on information from company accounting systems is widely described and discussed in the literature [16]. This approach is criticised because the variables used in VAIC are financial values indicating labour productivity [6]. Considering this aspect, it seems reasonable to use synthetic measures that partly reflect the physical values of the variables analysed.
The method used in this paper simply follows the VAIC algorithm; however, through the generated measures it synthetically measures the actual human capital rather than the financial inputs incurred in the creation of human capital, as it takes into account physical measures such as education level, work experience, professional qualifications, participation in continued education and social and cultural events.
Similar assumptions were applied to the other factors used in the calculation of VAIC in this paper. In the traditional method of VAIC calculation, human capital is synonymous with inputs incurred in the remuneration of employees (which may be more indicative of the financial value of this capital made by the market). Therefore, the adoption of a synthetic measure is more appropriate since an employee has, throughout the entire period of his activity, previously acquired education, professional skills and experience, and these values do not change over time, which occurs in the case of determining this value through financial inputs incurred for employees in the period under analysis.
A similar problem as with intellectual capital occurs in the financial formulation of structural capital [9,14]. While agreeing with this claim, it is therefore more reasonable to provide this measure through synthetic measures.
Since the farms analysed did not keep accounting records that would allow VAIC to be determined by any means known to date, synthetic measures were used for value added (VA), net asset value (VC), human capital (HC) and structural capital (SC). The values of all variables used to determine the synthetic measures were calculated per 1 hectare of farm area, which will allow for an accurate comparison of the values obtained between farms. The variables selected to determine the synthetic measures were divided into stimulants and destimulants. Variables classified as stimulants were subjected to zero unitisation as per the Formula (1).
where
- mini{xij}—the minimum value of function j;
- maxi {xik}—the maximum value of function j;
- i—the object (in the case analysed, a farm).
Variables classified as stimulants were subjected to zero unitisation as per the Formula (2).
where
- mini{xij}—the minimum value of function j;
- maxi {xik}—the maximum value of function j;
- i—the object (in the case analysed, a farm).
In the next step, the weights for the selected variables were determined using the TOPSIS-CRITIC method. In the TOPSIS-CRITIC method, weights are determined by standard deviations and correlations between variables. Correlation was assessed using the matrix of correlations between variables and analysis of the diagonal elements of the inverse matrix. Values exceeding ten were found to determine an inappropriate value in the correlation and thus an excessive correlation of a specific variable with other variables. A characteristic feature of the TOPSIS-CRITIC method is that it assigns relatively higher weights to features with a high coefficient of variation but low correlation with other features [24]. The weights of the variables were determined by the following formulas [25]:
where
- cj—the measure of the information capacity of feature j;
- sj(z)—the standard deviation calculated from the normalised values of feature j;
- rij—the correlation coefficient between features j and k.
The next step was to multiply the determined normalised values of the variables by the appropriate weighting factors. Using the values of the variables after the weighting process, the Euclidean distances of the different units from the development model and anti-model were calculated according to the following formulas:
where
At the next stage, the value of the synthetic feature q1 was determined according to the following formula:
Table 2 presents the list of variables and the weights used in the TOPISIS-CRITIC analysis.
Table 2.
List of variables used to create synthetic measures and their weights * (the data used for the calculation were converted into hectares of the area of the farm).
As a person grows older, their ability to perform their job and, above all, their productivity change. Between the ages of 35 and 55, both women and men reach their highest productivity and make the most significant contribution to society [26]. The literature on how the ability to perform work tasks changes with age states that it increases during the first 10 years of working life due to general education and learning through the practice and reaches a maximum between the age of 30 and 35. It then stabilises until the age of about 50, at which point it starts to decline. The process of productivity loss is rather slow and strongly depends on both personal and professional features [27]. Research has shown that there is a pattern in labour productivity indices in different age groups, starting from a low of around 20% in the group aged 15–19 and rising to about 80% in the group aged 25–55 to fall below 20% at around the age of 65 [28].
Taking into account the above literature, work experience was determined by assuming that agriculture represents a work task. Therefore, it was considered that from the ages of 20 to 35, work efficiency increases and is stable between the ages of 36 and 50, then decreases until retirement at the age of 67 (this age was used to determine the lowest coefficient).
In view of the above assumption, the following coefficients were used:
- -
- Age of up to 25—a coefficient of 0.6;
- -
- Age 26–30—0.8;
- -
- Age 31–35—0.9;
- -
- Age 36–50—1.0;
- -
- Age 51–55—0.9;
- -
- Age 56–60—0.8;
- -
- Age 61–65—0.7;
- -
- Age 66 and older—0.6.
In the next step, the farmer’s age was multiplied by an appropriate index to obtain the farmer’s work experience index.
The number of distribution channels used by the farmer when making commercial transactions was obtained by summarising the values obtained from the questionnaires: purchase, local warehouse, local shop, intermediary, street markets, bazaars, retail chains, processing plants, direct sales from the farm, fairs, online sales. Each distribution channel was previously assigned a value of 1. It was assumed that a greater number of distribution channels is beneficial due to the diversification of recipients.
The market relationship index for sales of food or agricultural products was determined by taking the following index values:
- -
- A 1 for sales without an agreement;
- -
- A 2 for sales on the basis of an informal (verbal) agreement;
- -
- A 3 for sales based on short-term agreements;
- -
- A 4 for sales based on long-term agreements;
- -
- A 5 for sales within producer or cooperative groups. All the listed activities were summarised into a single value to obtain the market relationship index.
The market position index—sales was determined by summarising the farmers’ statements on market position after the indices were previously assigned:
- -
- A 3 in the case of an affirmative answer to the question—I primarily determine the terms of the agreement;
- -
- A 2 in the case of an affirmative answer to the question—both parties equally agree on the terms of the agreement;
- -
- A 1 in the case of an affirmative answer to the question—the terms of the agreement are determined primarily by the buyers.
The market position index—purchase was determined by summarising the farmers’ statements on market position after the coefficients had previously been assigned:
- -
- A 3 in the case of an affirmative answer to the question—I primarily determine the terms of the agreement;
- -
- A 2 in the case of an affirmative answer to the question—both parties equally agree on the terms of the agreement;
- -
- A 1 in the case of an affirmative answer to the question—the terms of the agreement are determined primarily by the buyers.
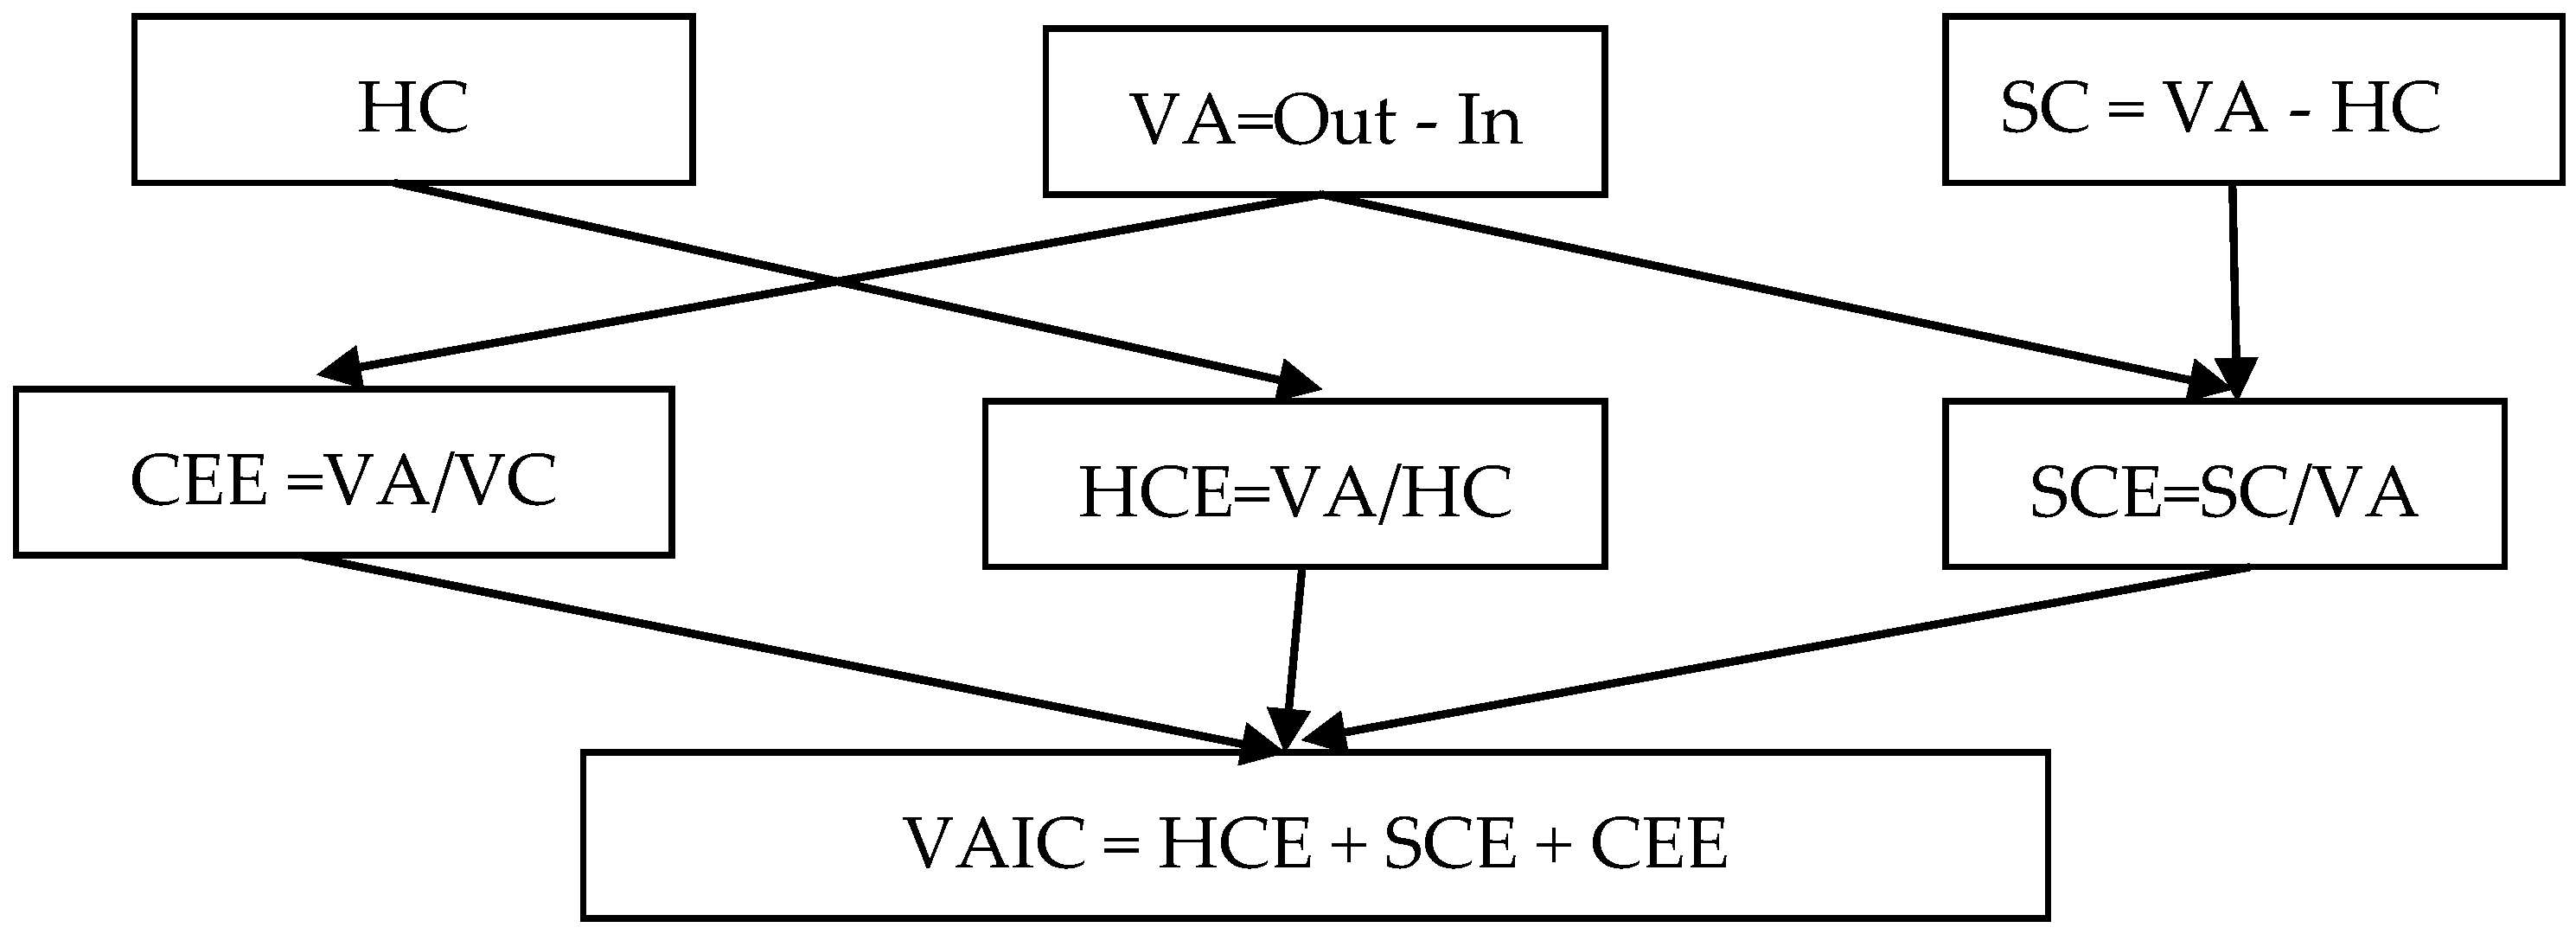
Value added intellectual capital (VAIC) was determined according to the procedure algorithm presented in Figure 2.
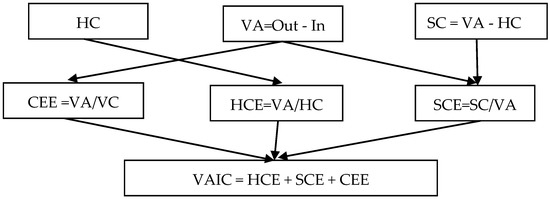
Figure 2.
Algorithm for determining the added value of intellectual capital. Key: HC—human capital, VA—value added, VC—net asset value, SC—structural capital, CEE—capital employed efficiency, HCE—human capital efficiency, SCE—structural capital efficiency, VAIC—intellectual capital value added. Source: study based on [3,4,7].
In the next step, each of the 5 analysed sets (countries) was divided into 4 quartiles, according to the farm area criterion and a contrast analysis was performed using a multiple comparison procedure (one-way analysis of variance (ANOVA)).
The variability for which the contrast is responsible was determined using Formula (7) [29].
where
- SSL—the variability for which the contrast is responsible;
- —contrast value (assessment) from the sample;
- n—number of measurements per group (replications);
- c—contrast value, e.g., for (−1; 0; 0; 1) the value is 2.
4. Results
As the analysis indicates, in the case of three countries (Moldova, Romania, Serbia), the same correlations in terms of the variation of value added were observed (Table 3, Table 4, Table 5, Table 6, Table 7 and Table 8). Significant differences in terms of variation in group averages were found between class A (farms with the lowest average area) and class D (farms with the highest average area) and between class A and B. It follows that differences between the area of farms cause changes in the volume of the synthetic measure of value added. Differences between these classes, depending on the country, are explained by 57–83% (Table 4, Table 5, Table 6, Table 7 and Table 8). The change in the area size in class B (4.24 ha–4.74 ha) already shows significant differences in terms of group averages of value added between class A and class B; these differences are explained by a range of 42–63% depending on the country (Table 4, Table 5, Table 6, Table 7 and Table 8). The differences between the area of farms in class A and class D in Romania, Moldova and Serbia are not as significant as between class A and class D in Poland and Lithuania. Yet, the significantly more significant difference in the average area of these classes did not result in a significant difference in the average value added in the observations from Poland and Lithuania. An opposite effect was obtained because, based on Lithuanian and Polish observations, no significant differences between average values in the analysed classes were found (Table 3, Table 4 and Table 6).
Table 3.
Farm characteristics by area classes *.
Table 4.
Contrasts assessment—Lithuania *.
Table 5.
Contrasts assessment—Moldavia *.
Table 6.
Contrasts assessment—Poland *.
Table 7.
Contrasts assessment—Romania *.
Table 8.
Contrasts assessment—Serbia *.
The observed differences in the behaviour of the net asset value measure (VC) in relation to farm area are not clear. In all analysed countries, significant differences between average VC values were identified between class A (farms with the smallest area) and class D (farms with the largest area), while in four countries (except Poland) also between class A and B (Table 4, Table 5, Table 6, Table 7 and Table 8). At the same time, the synthetic asset value measure is generally higher in class A with the lowest farm area and its value varies with increasing farm area (this regularity does not apply to observations from Poland) (Table 3).
The next measure analysed is the synthetic measure of human capital (HC). This measure shows the same regularity in all countries analysed. In each of the five countries analysed, significant differences were identified between the average values of the synthetic measure of human capital in classes A (smallest farm area) and D (largest farm area). Furthermore, these differences are explained by a range of 62–97% depending on the country. It is also worth noting that in every country analysed, the value of the synthetic measure of human capital in class A was lower than the value observed in class D (Table 3, Table 4, Table 5, Table 6, Table 7 and Table 8). In addition, for Lithuania and Serbia, significant differences were identified between classes B and D (explained by country ranging from 42 to 66%) and C and D (explained by country ranging from 24 to 84%) (Table 4 and Table 8). This regularity indicates a certain tendency indicating a higher level of education, professional experience and social activity of farm owners.
The structural capital (SC) analysis did not reveal significant differences between the classes in Moldova and Poland (Table 5 and Table 6). In each of the three remaining countries, i.e., Lithuania, Romania and Serbia, significant differences were found between the structural capital averages in classes A and D. These differences are explained by a range of 41–97% depending on the country. However, the value of the synthetic measure of structural capital in these classes does not demonstrate the same direction of change. In the case of the observations from Lithuania, the value of the synthetic measure of structural capital in class A is higher than in class D. In contrast, the opposite relationship was found in Romania and Serbia (Table 7 and Table 8). The observed differences in the area of structural capital indicate a different number of distribution channels, in both the analysed classes of farms, and we observe these differences between countries.
Analysis of the human capital efficiency (HCE) index indicates no significant differences between all classes of this measure in the analysed data from Poland and Romania (Table 6 and Table 7). The relationship identified shows the absence of a mutually significant relationship between value added and human capital. This could indicate that there is no significant impact of human capital on value added creation, but such a finding is not consistent with human capital theory [30].
HCE indicates how much value added represented by the synthetic measure is created by a farm through one unit of the synthetic measure of human capital. For Lithuania, Moldova and Serbia, significant differences were identified between class A (farms with the smallest land area) and class D (farms with the largest land area). Furthermore, these differences are explained by a range of 66–98% depending on the country (Table 4, Table 5 and Table 8). In these classes, we also observe a higher synthetic HCE in class A than in class D, which may indicate that the farm’s human capital resources are not fully exploited (Table 3).
The analyses carried out do not entitle to clear statements regarding the differentiation of the structural capital efficiency index (SCE) between classes. This may indicate a different number of distribution channels, market relationships and market positions, as these variables were used to construct a synthetic measure of structural capital. However, it should be noted that in Serbia, significant differences were identified between classes A and D, B and D, C and D and A and B. The difference between class A and D was explained by up to 99%, while for the other classes, the differences in average values were explained in a range from 22 to 28% (Table 8). Furthermore, it should be noted that the value of the SCE index increased with increasing farm area, ranging from 1.083 to 1.34 (Table 3). The analyses for Lithuania revealed significant differences between classes A and D (40% explanation of variation), C and D (77% explanation of variation), A and B (23% explanation of variation) and B and C (52% explanation of variation) (Table 4). The analysis of the value of SCE in each class does not increase in a regular way as in the case of the observations in Serbia (Table 3). For the sake of order, it should be added that in Poland significant differences in SCE values were found only between class A and D (explaining 41% of the variation) and between class C and D (explaining 52% of the variation) (Table 6).
The efficiency of the use of working capital employed shows how much capital expressed in the case under consideration a company may create with one unit of value added expressed by a synthetic measure. In all countries analysed, a significant difference was identified between classes A and D; the level of explained variation between these classes varied between the countries analysed and ranged from 42% to 90% (Table 4, Table 5, Table 6, Table 7 and Table 8). For the other contrasts, no clear pattern was found. Romania was an exception in the analyses presented; in this country, significant differences were found between all contrasts, but the level of explained variability ranged from 2 to 90% (Table 7).
The key analysis is the analysis of VAIC value; no significant differences are noted between most of the contrasts analysed. This is probably due to the very creation of VAIC, as it is the sum of previously calculated indices and these in turn also gather imperfections in the synthetic measures of the previously determined indices (Figure 2). It is also difficult to observe regularities in VAIC values between contrasts in the observed countries (Table 3).
5. Conclusions
Despite the great effort in the search for relationships that are characteristic for VAIC, it has to be critically stated that the accepted goal of this article has been achieved to a limited extent. This paper presents a methodology for dealing with the determination of synthetic measures, but further research is required into the processes of selecting the variables that form synthetic measures. However, it should be noted that the proposed synthetic measure is more in line with human capital theory.
The process of selecting variables for analysis should in the future focus on the analysis of data in individual countries, as specific political-economic conditions may lead to distortions in the interaction between variables.
The conducted analyses contributed to the confirmation of the hypothesis that the analysed indicators differ depending on the farm size. Although, the observed trend in the direction of the variables of the analysed indicators is not clear.
Although the values of the sub-indices VA, VC, HC and SC are differentiated between the analysed classes, it is difficult to notice an unambiguous regularity indicating an increase or decrease in these values in connection with the farm area. However, we can identify a differentiation of synthetic measures between the farms with the smallest area (class A) and the farms with the largest area (class D). The following conclusions may be drawn with regard to this relationship:
- -
- The value of VA demonstrates a moderate declining trend with increasing farm area in Lithuania, Moldova and Serbia, while the opposite trend is observed in Poland and Romania;
- -
- The value of VA demonstrates a moderate declining trend with increasing farm area (except Moldavia);
- -
- The value of HC tends to increase with the increase in the farm area;
- -
- The value of SC in two countries indicates an increasing trend (Moldova and Romania) and in three countries shows a reverse trend (Lithuania, Poland, Serbia).
Further indices calculated including those described above demonstrate the following trends:
- -
- The value of the HCE index observed only as a difference between the smallest and the largest farms shows a declining trend understood as a decrease in the value of the synthetic measure as the farm size increases. This relationship was observed in each of the countries analysed.
- -
- The value of SCE showed a decreasing trend with increasing farm size in two countries, Poland and Lithuania, while an opposite trend was observed in Serbia, Romania and Moldova (the analysis only covers differences between the smallest and the largest farms).
- -
- A similar relationship analysis for the CEE index shows that this index is higher in the class of farms with the lowest area than in the farms with the largest area. This relationship applies to Lithuania, Moldova and Romania. In the other two countries, Poland and Serbia, the opposite relationship was found.
A derivative of the use of the above indices is the synthetic VAIC measure—in two countries, this measure is highest in the class of farms with the largest area (Lithuania and Romania), while for the other three countries an opposite relationship is found.
As stated earlier, it is difficult to determine a clear trend on the basis of the analyses carried out. However, in the author’s opinion, the analyses carried out provide good initial material for further analyses leading to the development of a model for determining VAIC on the basis of synthetic measures.
The analyses also did not verify the connection of VAIC indices with the market (stock exchange) value of the analysed farms. The reason for the lack of such analyses was an insufficient amount of reliable data.
The article presented should be regarded as a methodological proposal for VAIC construction applied to small and medium-sized farms. The construction of the synthetic measures used in these analyses certainly still requires a long process of improvement (see Table 1). The author’s idea was to propose an alternative yet relatively simple measure of VAIC.
Despite its many shortcomings, this paper contributes to the development of methods for measuring intellectual capital. It also addresses the complex issue of measuring VAIC in agriculture. Measuring intellectual capital in agriculture is a little-known issue, so this paper should contribute to the development of creative discussions in this area. Especially as today there are many opposing discussions about the very method of VAIC measurement
Funding
This research was funded by the Polish National Agency for Academic Exchange under a program of the International Academic Partnership, agreement no. PPI/APM/2018/1/00011/U/001, and by the National Science Centre in Poland, grant no. 2016/21/B/HS4/00653.
Institutional Review Board Statement
Not applicable.
Informed Consent Statement
Not applicable.
Data Availability Statement
The data presented in this study are available on request from the author.
Conflicts of Interest
The author declares no conflict of interest.
Appendix A. Tests of Significance
Table A1.
Tests of Significance.
Table A1.
Tests of Significance.
| Effect | Multivariate Tests of Significance; Sigma-Restricted Parameterisation; Effective Hypothesis Decomposition | |||||
|---|---|---|---|---|---|---|
| Test | Value | F | Effect df | Error df | p | |
| Lithuania | ||||||
| Intercept | Wilks | 0.00 | 1,534,767 | 7 | 918.000 | 0.00 |
| Pillai’s | 1.00 | 1,534,767 | 7 | 918.000 | 0.00 | |
| Hotellng | 11,703.02 | 1,534,767 | 7 | 918.000 | 0.00 | |
| Roy’s | 11,703.02 | 1,534,767 | 7 | 918.000 | 0.00 | |
| Class | Wilks | 0.71 | 16 | 21 | 2636.550 | 0.00 |
| Pillai’s | 0.30 | 15 | 21 | 2760.000 | 0.00 | |
| Hotellng | 0.39 | 17 | 21 | 2750.000 | 0.00 | |
| Roy’s | 0.34 | 45 | 7 | 920.000 | 0.00 | |
| Moldova | ||||||
| Intercept | Wilks | 0.00 | 1,407,221 | 7 | 434.000 | 0.00 |
| Pillai’s | 1.00 | 1,407,221 | 7 | 434.000 | 0.00 | |
| Hotellng | 22,697.12 | 1,407,221 | 7 | 434.000 | 0.00 | |
| Roy’s | 22,697.12 | 1,407,221 | 7 | 434.000 | 0.00 | |
| Class | Wilks | 0.83 | 4 | 21 | 1246.764 | 0.00 |
| Pillai’s | 0.17 | 4 | 21 | 1308.000 | 0.00 | |
| Hotellng | 0.20 | 4 | 21 | 1298.000 | 0.00 | |
| Roy’s | 0.17 | 11 | 7 | 436.000 | 0.00 | |
| Poland | ||||||
| Intercept | Wilks | 0.00 | 760,236.9 | 7 | 438.000 | 0.00 |
| Pillai’s | 1.00 | 760,236.9 | 7 | 438.000 | 0.00 | |
| Hotellng | 12,149.90 | 760,236.9 | 7 | 438.000 | 0.00 | |
| Roy’s | 12,149.90 | 760,236.9 | 7 | 438.000 | 0.00 | |
| Class | Wilks | 0.86 | 3.1 | 21 | 1258.250 | 0.000003 |
| Pillai’s | 0.14 | 3.1 | 21 | 1320.000 | 0.000004 | |
| Hotellng | 0.15 | 3.1 | 21 | 1310.000 | 0.000002 | |
| Roy’s | 0.10 | 6.5 | 7 | 440.000 | 0.000000 | |
| Romania | ||||||
| Intercept | Wilks | 0.000 | 912,008.4 | 7 | 774.000 | 0.00 |
| Pillai’s | 1.000 | 912,008.4 | 7 | 774.000 | 0.00 | |
| Hotellng | 8248.138 | 912,008.4 | 7 | 774.000 | 0.00 | |
| Roy’s | 8248.138 | 912,008.4 | 7 | 774.000 | 0.00 | |
| Class | Wilks | 0.711 | 13.3 | 21 | 2223.060 | 0.00 |
| Pillai’s | 0.294 | 12.1 | 21 | 2328.000 | 0.00 | |
| Hotellng | 0.398 | 14.6 | 21 | 2318.000 | 0.00 | |
| Roy’s | 0.377 | 41.8 | 7 | 776.000 | 0.00 | |
| Sebia | ||||||
| Intercept | Wilks | 0.0 | 12,673,886 | 7 | 366.000 | 0.00 |
| Pillai’s | 1.0 | 12,673,886 | 7 | 366.000 | 0.00 | |
| Hotellng | 242,396.7 | 12,673,886 | 7 | 366.000 | 0.00 | |
| Roy’s | 242,396.7 | 12,673,886 | 7 | 366.000 | 0.00 | |
| Class | Wilks | 0.7 | 6 | 21 | 1051.505 | 0.00 |
| Pillai’s | 0.3 | 5 | 21 | 1104.000 | 0.00 | |
| Hotellng | 0.4 | 6 | 21 | 1094.000 | 0.00 | |
| Roy’s | 0.3 | 17 | 7 | 368.000 | 0.00 | |
Source: own study based on analysed data.
Appendix B. Test HSD Tukey’s for Depended Variables Area
Table A2.
Test HSD Tukey’s for Depended Variables Area.
Table A2.
Test HSD Tukey’s for Depended Variables Area.
| Approximate Probabilities for Post Hoc Tests Error: Between MS = 0.00029, df = 924.00 | ||||
| Class | A | B | C | D |
| Lithuania | ||||
| A | 0.851163 | 0.862332 | 0.325203 | |
| B | 0.851163 | 0.999995 | 0.810099 | |
| C | 0.862332 | 0.999995 | 0.797247 | |
| D | 0.325203 | 0.810099 | 0.797247 | |
| Moldova | ||||
| Approximate Probabilities for Post Hoc Tests Error: Between MS = 0.00035, df = 440.00 | ||||
| A | 0.169867 | 0.016205 | 0.080283 | |
| B | 0.169867 | 0.798880 | 0.987242 | |
| C | 0.016205 | 0.798880 | 0.938751 | |
| D | 0.080283 | 0.987242 | 0.938751 | |
| Poland | ||||
| Approximate Probabilities for Post Hoc Tests Error: Between MS = 0.00077, df = 444.00 | ||||
| A | 0.214739 | 0.244448 | 0.571564 | |
| B | 0.214739 | 0.999881 | 0.917282 | |
| C | 0.244448 | 0.999881 | 0.939349 | |
| D | 0.571564 | 0.917282 | 0.939349 | |
| Romania | ||||
| Approximate Probabilities for Post Hoc Tests Error: Between MS = 0.00074, df = 780.00 | ||||
| A | 0.000008 | 0.000008 | 0.000008 | |
| B | 0.000008 | 0.987308 | 0.270144 | |
| C | 0.000008 | 0.987308 | 0.453403 | |
| D | 0.000008 | 0.270144 | 0.453403 | |
| Serbia | ||||
| Approximate Probabilities for Post Hoc Tests Error: Between MS = 0.00050, df = 372.00 | ||||
| A | 0.000008 | 0.000008 | 0.000008 | |
| B | 0.000008 | 0.994691 | 0.997976 | |
| C | 0.000008 | 0.994691 | 0.999884 | |
| D | 0.000008 | 0.997976 | 0.999884 | |
Source: own study based on analysed data.
References
- Bozek, J. Differentiation and dynamics of number of small agricultural farms in European Union countries. Probl. Small Agric. Hold. 2018, 3, 5–19. [Google Scholar]
- Filippini, R.; Marraccini, E.; Lardon, S.; Bonari, E. Assessing food production capacity of farms in periurban areas. Ital. J. Agron. 2014, 9, 63–70. [Google Scholar] [CrossRef] [Green Version]
- Tretiak, A.; Tretiak, V.; Priadka, T.; Lyashynskyy, V.; Tretiak, N. Non-conventional agricultural land use: A way to accelerate ecologization and capitalization. Sci. Pap. 2021, 21, 661–669. [Google Scholar]
- Xu, X.L.; Chen, H.H.; Zhang, R.R. The Impact of Intellectual Capital Efficiency on Corporate Sustainable Growth-Evidence from Smart Agriculture in China. Agriculture 2020, 10, 199. [Google Scholar] [CrossRef]
- Tillack, P.; SchulzE, E. The labor cost in CEE agriculture and its influence on competetiveness. In Proceedings of the Farm Work Science Facing Challenges of the XXI Century, Krakow, Poland, 25–27 June 2001; pp. 158–164. [Google Scholar]
- Kozera, M. Kapitał intelektualny w rolnictwie-zrozumieć, zmierzyć, zastosować. In Prace Naukowe Uniwersytetu Ekonomicznego we Wrocławiu, Efektywność-konceptualizacja i uwarunkowania; Dudycz, T., Osbert-Pociecha, G., Brycz, B., Eds.; Wydawnictwo Uniwersytetu Ekonomicznego we Wrocławiu: Wrocław, Poland, 2012. [Google Scholar]
- Kozera-Kowalska, M. Kapitał Intelektualny w Tworzeniu Wartości Dodanej Przedsiębiorstw Rolnych; Wydawnictwo Uniwersytetu Przyrodniczego w Poznaniu: Poznań, Poland, 2017. [Google Scholar]
- Xu, X.L.; Li, J.P.; Wu, D.S.; Zhang, X. The intellectual capital efficiency and corporate sustainable growth nexus: Comparison from agriculture, tourism and renewable energy sector. Environ. Dev. Sustain. 2021, 23, 16038–16056. [Google Scholar] [CrossRef]
- Xu, J.; Liu, F. The impact of intellectual capital on firm performance: A modified and extended VAIC model. J. Compet. 2020, 12, 161–176. [Google Scholar] [CrossRef]
- Chen, J.; Chen, X.A.; Guo, J.; Zhu, R.Y.; Liu, M.R.; Kuang, X.X.; He, W.Q.; Lu, Y. Agricultural, Ecological, and Social Insights: Residual Mulch Film Management Capacity and Policy Recommendations Based on Evidence in Yunnan Province, China. Sustainability 2021, 13, 1603. [Google Scholar] [CrossRef]
- Zhang, Y.L.; Xiao, X.; Cao, R.B.; Zheng, C.H.; Guo, Y.R.; Gong, W.X.; Wei, Z.C. How important is community participation to eco-environmental conservation in protected areas? From the perspective of predicting locals’ pro-environmental behaviours. Sci. Total Environ. 2020, 739, 10. [Google Scholar] [CrossRef]
- Stahle, P.; Stahle, S.; Aho, S. Value added intellectual coefficient (VAIC): A critical analysis. J. Intellect. Cap. 2011, 12, 531–551. [Google Scholar] [CrossRef]
- Xu, J.; Zhang, Y. Does Intellectual Capital Measurement Matter in Financial Performance? An Investigation of Chinese Agricultural Listed Companies. Agronomy 2021, 11, 1872. [Google Scholar] [CrossRef]
- XU, X.L.; Liu, C.K. How to keep renewable energy enterprises to reach economic sustainable performance: From the views of intellectual capitaland lifecycle. Energy Sustain. Soc. 2019, 9, 10. [Google Scholar] [CrossRef]
- Pulic, A. VAIC (TM)—An accounting tool for IC management. Int. J. Technol. Manag. 2000, 20, 702–714. [Google Scholar] [CrossRef]
- Edvinsson, L.; Malone, M.S. Intellectual Capital: Realizing Your Company’s True Value by Finding Its Hidden Brainpower; Harper Business: New York, NY, USA, 1997. [Google Scholar]
- Bontis, N. National Intellectual Capital Index a United Nations initiative for the Arab region. J. Intellect. Cap. 2004, 5, 13–39. [Google Scholar] [CrossRef] [Green Version]
- Iazzolino, G.; Laise, D. Value added intellectual coefficient (VAIC) A methodological and critical review. J. Intellect. Cap. 2013, 14, 547–563. [Google Scholar] [CrossRef]
- Beggs, D.S.; Jongman, E.C.; Hemsworth, P.H.; Fisher, A.D. The effects of herd size on the welfare of dairy cows in a pasture-based system using animal- and resource-based indicators. J. Dairy Sci. 2019, 102, 3406–3420. [Google Scholar] [CrossRef] [Green Version]
- Ovechkin, D.V.; Romashkina, G.F.; Davydenko, V.A. The Impact of Intellectual Capital on the Profitability of Russian Agricultural Firms. Agronomy 2021, 11, 286. [Google Scholar] [CrossRef]
- Ghosh, S.K.; Maji, S.G. Empirical Validity of Value Added Intellectual Coefficient Model in Indian Knowledge-based Sector. Glob. Bus. Rev. 2015, 16, 947–962. [Google Scholar] [CrossRef]
- Nadeem, M.; Dumay, J.; Massaro, M. If You Can Measure It, You Can Manage It: A Case of Intellectual Capital. Aust. Account. Rev. 2019, 29, 395–407. [Google Scholar] [CrossRef]
- Hron, J.; Stusek, J.; Arnost, M.; Huml, J. Diversification strategy in small and medium size agribusinesses in the Czech Republic-impulses for searching business opportunities. Agric. Econ. 2008, 54, 505–509. [Google Scholar] [CrossRef] [Green Version]
- Borychowski, M.; Stepien, S.; Polcyn, J.; Tosovic-Stevanovic, A.; Calovic, D.; Lalic, G.; Zuza, M. Socio-Economic Determinants of Small Family Farms’ Resilience in Selected Central and Eastern European Countries. Sustainability 2020, 12, 10362. [Google Scholar] [CrossRef]
- Rostamzadeh, R.; Keshavarz Ghorabaee, M.; Govindan, K.; Esmaeili, A.; Nobar, H.B.K. Evaluation of sustainable supply chain risk management using an integrated fuzzy TOPSIS- CRITIC approach. J. Clean. Prod. 2018, 175, 651–669. [Google Scholar] [CrossRef]
- Mandrzejewska-Smól, I. Wiek i doświadczenie jako atrybuty działalności zawodowej. In Praca Człowieka w XXI Wieku: Konteksty-Wyzwania-Zagrożenia; Gerlach, R., Ed.; Wydawnictwo Uniwersytetu Kazimierza Wielkiego: Bydgoszcz, Poland, 2008. [Google Scholar]
- Göbel, C.; Zwick, T. Which Personnel Measures Are Effective in Increasing Productivity of Old Workers? ZEW Discussion Papers; No. 10-069; IDEAS: St. Louis, MO, USA, 2010. [Google Scholar]
- Ruzik-Sierdzińska, A.; Lis, M.; Potoczna, M.; Belloni, M.; Villosio, C. Age and Productivity: Human Capital Accumulation and Depreciation; CASE Network Reports, No. 114/2013; Center for Social and Economic Research (CASE): Warsaw, Polan, 2012. [Google Scholar]
- Stanisz, A. Przystępny Kurs Statystyki z Zastosowaniem STATISTICA PL na Przykładach z Medycyny; StatSoft Polska: Kraków, Poland, 2007. [Google Scholar]
- Hanushek, E.A.; Woessmann, L. Overview of the symposium on performance pay for teachers. Econ. Educ. Rev. 2011, 30, 391–393. [Google Scholar] [CrossRef]
Publisher’s Note: MDPI stays neutral with regard to jurisdictional claims in published maps and institutional affiliations. |
© 2022 by the author. Licensee MDPI, Basel, Switzerland. This article is an open access article distributed under the terms and conditions of the Creative Commons Attribution (CC BY) license (https://creativecommons.org/licenses/by/4.0/).