Article

Eco-Efficiency Analysis of Integrated Waste Management Strategies Based on Gasification and Mechanical Biological Treatment

by
Abdulrahman Abdeljaber
1,
Rawan Zannerni
2,
Wedad Masoud
1,
Mohamed Abdallah
1,2,* and
Lisandra Rocha-Meneses
2
1
Department of Civil and Environmental Engineering, University of Sharjah, Sharjah 27272, United Arab Emirates
2
Biomass & Bioenergy Research Group, Center for Sustainable Energy and Power Systems Research, University of Sharjah, Sharjah 27272, United Arab Emirates
*
Author to whom correspondence should be addressed.
Sustainability 2022, 14(7), 3899; https://doi.org/10.3390/su14073899
Submission received: 14 February 2022 / Revised: 21 March 2022 / Accepted: 22 March 2022 / Published: 25 March 2022
(This article belongs to the Special Issue Waste Management for Sustainable Development)

Abstract

:
Integrated solid waste management (ISWM) strategies are developed towards promoting sustainable approaches for handling waste. Recently, gasification and mechanical biological treatment (MBT) technologies were recognized as effective processes for treating municipal solid waste. This study investigates the feasibility of integrating gasification and MBT technologies in multiple ISWM strategies, compared to incineration- and anaerobic digestion (AD)-based strategies. A comprehensive techno-economic and environmental assessment was carried out to evaluate the performance of the examined ISWM strategies. The evaluation was based on the energy generation potential, carbon footprint, and life cycle costing (LCC). An eco-efficiency analysis was conducted to quantify the environmental costs by incorporating the carbon footprint and LCC results. The proposed strategies were applied for the city of Abu Dhabi, United Arab Emirates, based on local bylaws and guidelines. The analysis revealed that the gasification-based strategy had the highest energy production of 47.0 million MWh, followed by the incineration- (34.2 million MWh), AD- (17.2 million MWh), and MBT-based (14.9 million MWh) strategies. Results of the environmental analysis indicated that the MBT- and AD-based strategies contributed the least to global warming with greenhouse gas emissions of 4442 and 4539 GgCO2-eq, respectively, compared to the gasification- (9922 GgCO2-eq) and incineration-based (15,700 GgCO2-eq) strategies. Furthermore, over a 25-year assessment period, the LCC findings demonstrated that the gasification- and MBT-based strategies were the most financially feasible with a positive net present value (NPV) of USD 364 and USD 284 million, respectively. The eco-efficiency analysis indicated that the MBT and gasification strategies are the most sustainable among the examined strategies. The sustainability of the assessed systems was improved by implementing policy and legal reforms, including incentive programs, less stringent bylaws on digestate, and encouraging source separation of wastes. Overall, this research emphasized the potential environmental and financial benefits of incorporating MBT and gasification technologies into ISWM strategies.

1. Introduction

Unprecedented technological development and industrialization affected the volume and patterns of waste generated worldwide. Moreover, exponential population growth, coupled with increased urbanization levels, led to a rather rapid increase in waste generation. The annual global municipal solid waste (MSW) reached around 2.01 billion tons in 2016 and is projected to be doubled by 2050 [1]. Sanitary landfilling remains the predominant management method of handling MSW, with 75% of the total waste being disposed of in landfills [2]. However, conventional landfilling has become an undesirable practice, mainly due to the environmental hazards and health risks imposed from the production of leachate and greenhouse gas (GHG) emissions, along with the pressure from land scarcity. To cope with the ever-increasing waste generation, integrated solid waste management (ISWM) strategies were developed to reduce the amount of disposed waste and promote resource and energy recuperation. Sustainable frameworks, such as the 5R (refuse, reduce, reuse, recycle, and recover) programs, were adopted in ISWM strategies to significantly minimize the amount of waste disposed of in landfills, hence reducing adverse impacts on ecosystems. ISWMs typically include a combination of various recycling, material/energy recovery, treatment, and disposal techniques according to the physical, chemical, and biological characteristics of waste, among other local factors [3]. Waste segregation programs, between recyclables and non-recyclables or wet (biodegradables) and dry waste streams, dictate the processes and facilities involved within the ISWM strategy [4].
Waste-to-Energy (WTE) technologies demonstrate a macro-approach towards sustainable and cost-effective MSW management [5,6]. WTE facilities play an inalienable role in ISWM strategies associated with substantial waste volume reduction and energy recovery from non-recyclable materials. The implementation of WTE technologies can contribute to meeting the high global energy demand [7]. Recently, WTE technologies underwent significant development, becoming a viable alternative for MSW management. WTE technologies can be classified as (1) thermochemical processes, e.g., incineration, pyrolysis, and gasification, and (2) biochemical processes, e.g., composting, anaerobic digestion (AD), fermentation, and mechanical biological treatment (MBT). The former includes producing energy from heat generated throughout different chemical processes, while the latter involves the utilization of microorganisms to generate biofuels from biodegradable organic waste. The present study focuses on two WTE technologies that recently gained momentum in managing MSW and that are less studied in the literature compared to other more prominent systems: gasification and MBT. Gasification is defined as the thermochemical conversion process of solid or liquid carbon-based feedstock to combustible syngas comprised of CO2, CO, H2, CH4, H2O, and other contaminants [8]. The main difficulties of the MSW gasification process are related to waste heterogeneity, as gasification is mostly used for homogeneous industrial and agricultural wastes, e.g., paper and cardboard wastes, waste tires, food wastes, wood wastes, etc. On the other hand, MBT integrates mechanical and effective biological processes aiming to separate waste into fractions for valorization [9]. MBT focuses on biologically stabilizing the organic fraction of MSW before landfilling or preparing MSW for combustion with energy recovery.
Several studies were conducted to evaluate the technical performance of different WTE technologies, particularly gasification and MBT. For instance, Korai et al. (2016) found a potential of generating up to 11.3 kW/ton of waste using biochemical WTE systems and up to 184.5 kW/ton of waste using thermochemical technologies [10]. Moreover, Patel (2003) revealed an energy generation potential of 600 kW/ton of waste via gasification [11]. Additionally, a study in Italy demonstrated that gasification is more efficient than incineration as it requires lower temperatures for waste processing [12]. Similarly, Jimenez et al. (2019) explored the electricity generation of carbo-gas gasification technology with combustion engines using different feedstocks and obtained 30% efficiency [13]. In terms of MBT performance, Barbara et al. (2013) evaluated the effects of treating organic fractions of MSW in a full-scale MBT plant. Results showed that short MBT could decrease the landfill impact and preserve energy to be generated successfully [14]. Another study investigated the stabilization of organic waste and mass reduction by MBT [15]. The findings revealed 30% mass reduction with great potential for inorganic material recovery. This agrees with an MBT study conducted in South America that reported a mass reduction of 41.0–53.4% with substantial volume reduction [16].
In addition to energy potential, gasification and MBT were found to provide multiple environmental benefits compared to conventional WTE technologies. For instance, a study assessed the environmental performance of incineration, pyrolysis, gasification, and gasification with an ash-melting system in terms of reduced emissions and improved energy recovery. The findings showed that gasification was the most eco-efficient technology due to the intermediate syngas cleaning process [17]. In another comparative study, a gasifier in Finland, a mechanical-grate incinerator plant in France, and a circulating fluidized-bed incinerator in China were evaluated using life cycle assessment. The results showed that gasification had higher overall environmental performance than incineration [18]. Similarly, several studies proved that MBT is a beneficial environmental management technique due to its positive impact on landfill leachate and biogas production and quality [19,20,21,22]. Fei et al. (2018) studied the energy and environmental performance of incineration and MBT connected with biogas purification systems. The results showed the preference of MBT over incineration by ~20% greater energy efficiency and less environmental impacts [23]. Moreover, Montejo et al. (2013) found that 190 kt of CO2-eq/year can be saved upon incorporating AD in MBT plants [24].
Furthermore, the feasibility of WTE technologies can be demonstrated by assessing multiple financial aspects throughout their life cycle. Life cycle costing (LCC) is extensively applied in cost-effectiveness assessments, taking into consideration all costs and potential revenues attained over the life cycle of a project or service [25]. For example, Mabalane et al. (2020) found that the average capital cost of a gasification plant was about USD 1950 per kW with an electricity generation efficiency of 31–35%, whereas the maintenance and operation cost varied between 3–6% of the capital costs [26]. Moreover, a considerably higher net present value (NPV) with a 10-year payback period (PP) was achieved compared to an AD plant due to the increased waste processing capacity and energy recovery. In line with the continuing technological progress in the waste management sector, several studies examined the feasibility of upgrading conventional gasification plants. For instance, Chen et al. (2021) conducted an LCC to investigate the potential economic benefits of integrating a tar removal system with gasifiers [27]. The results showed 40 and 17% reductions in capital and maintenance costs, respectively, upon installing a tar removal system. Another study assessed the financial performance of a fluidized-bed gasification plant equipped with a combined cycle gas turbine compared to incinerators. The researchers demonstrated that the former technology was more cost-effective with higher overall system efficiency [28].
On the other hand, LCC was rarely used for evaluating the financial efficiency of MBT systems. For instance, a study carried out an LCC study assessing different WTE facilities, namely incineration, composting, and MBT [29]. The findings showed that integrating composting with MBT resulted in economic savings of about USD 25.1 million. Another LCC assessment concluded that processing residual waste in MBT plants is financially feasible [30]. Furthermore, Bourtsalas and Triantafyllou (2019) evaluated four MBT facilities in Cyprus, Greece, and Spain [31]. The researchers suggested that MBT plants should be operated with a thorough sorting and recyclables recovery stream, along with a refused derived fuel (RDF) line for unrecovered materials to reduce harmful emissions and maximize energy potential achieving an internal rate of return (IRR) of 12%.
A key limitation in the literature was that gasification and MBT systems were rarely evaluated as part of an ISWM strategy, which may influence the findings of such studies. Moreover, the combined technical, environmental, and financial performance of these technologies were not addressed. Aggregating the environmental and financial aspects of an ISWM through a systematic eco-efficiency analysis would provide an insightful sustainability assessment [32,33]. Based on the reviewed literature, there is a shortage of eco-efficiency analyses for the ISWM strategies, particularly those involving gasification and MBT. This research work aims to carry out a comprehensive techno-economic and environmental assessment of different ISWM strategies based on the utilization of different WTE technologies: incineration, AD, gasification, and MBT. The analysis includes comparative carbon footprint and LCC studies for four proposed ISWM scenarios. The specific objectives of this study are to: (1) estimate the energy generation potential of the examined strategies, (2) compute the projected carbon footprint to assess the environmental impact of the proposed strategies, (3) conduct LCC analysis to evaluate the financial feasibility, (4) integrate the environmental and financial performance findings in an eco-efficiency analysis, and (5) apply the proposed evaluation framework on Abu Dhabi, United Arab Emirates (UAE), one of the top per-capita waste generators in the world. This research offers decision-makers a systematic analysis of promising WTE technologies as part of ISWM strategies towards achieving economic and environmental sustainability in the waste management sector.

2. Methodology

The present study provides a comprehensive assessment of five proposed ISWM strategies based on incineration, AD, gasification, and MBT plants. A techno-economic and environmental evaluation framework of the examined scenarios is presented. The assessment was based on potential energy production, carbon footprint, life cycle costing, and eco-efficiency analyses. The proposed methodology was applied to the city of Abu Dhabi.

2.1. Waste Management Systems

Multiple ISWM strategies were developed based on waste separation, collection, and treatment processes. The main components of the proposed alternatives include material and energy recovery and sanitary landfilling as the ultimate fate of waste. Figure 1 present the different proposed strategies along with their components.
The first scenario is an incinerator-based strategy. It involves a dual-bin collection system, i.e., recyclables and commingled waste. Recyclables are sent to a material recovery facility (MRF), whereas commingled waste, along with MRF rejects, are processed in the incinerator for conversion into heat and ash. The second scenario is an AD-based strategy. It involves source separation into two streams, i.e., food (kitchen) and commingled waste. The AD plant converts food waste to biogas and digestate, whereas commingled waste is sent to the MRF. The recyclables are marketed as baled materials, while rejects are disposed of in the landfill. The third scenario is a gasification-based strategy. It comprises of the separate collection in two bins, i.e., food and commingled waste. The former is treated by the gasifier, producing syngas along with ash and slag, whereas commingled waste is sent to the MRF. The fourth scenario is an MBT-based strategy with aerobic composting. It includes source separation into two streams, i.e., commingled and food waste. Commingled waste is processed in the mechanical sorting plant to recover recyclables and separate biodegradables and RDF through negative soring. The RDF is marketed as an alternative fuel for advanced thermal processes such as cement kilns, whereas rejects are disposed of in landfill. The food waste and separated biodegradables are sent to the composting plant.

2.2. Technical Performance

The technical performance of the proposed strategies was evaluated based on waste fraction allocation, energy recovery, and landfill volume reduction. Systematic efficiencies of waste separation (participation and recovery rates) of MSW streams were assumed. The participation rate identifies the fraction of the public that engages in recyclables sorting and separating at the household level, whereas the recovery rate is the extent of the MRF in recovering recyclable factions. Typical recovery rates of paper, plastic, glass, and metals in MRFs were assumed to be 60, 70, 80, and 90%, respectively. The mass balance applied for the proposed management facilities is summarized in Table 1.

Energy Recovery

Energy recovery is the process of producing energy by direct combustion (in incineration) or the formation of combustible fuel commodities, such as methane (in AD and landfill disposal) and syngas (in gasification). The computations of energy production for the examined facilities are discussed below.
The energy potential from incinerators was estimated according to the calorific value of different waste compositions and was computed using the following equation:
EP = W d × η   × ( M i × C V i )
where EP is the energy production (kWh), W d is the dry weight of treated waste (kg), η is the efficiency conversion within incinerators, assumed as 30% [38], M i is the mass fraction of material i in the waste stream, and C V i is the calorific value of material i (kWh/kg). The default values were reported in the literature [39,40,41,42].
The amount of energy produced from AD plants was calculated using the following equation [43]:
EP = M C H 4 × E C C H 4 × η
where EP is the energy production (kWh), M C H 4 is the mass of generated methane (kg),   E C C H 4 is the energy content of methane (14.31 kWh/kg), and η is the efficiency of energy conversion in the AD process, assumed as 30% [38]. The computations for the mass of methane generated can be found in the Supplementary Materials.
The energy potential of the gasifier was computed based on the high heating value (HHV) of the waste. The HHV was estimated using the following equation:
H H V s y n g a s = V s y n g a s ( ( H H V H 2 × H 2 % ) + ( H H V C O × C O % ) + ( H H V C H 4 × C H 4 % ) )
where H H V s y n g a s is the higher heating value of syngas (MJ/m3), V s y n g a s is the total volume of syngas (m3), and H H V is the higher heating value of gas x (MJ/m3). The HHV for H2, CO, and CO2 are reported in the literature as 12.76, 12.63, and 39.76 MJ/m3, respectively [44]. The computations for the volume of syngas can be found in the Supplementary Materials.
The main energy recovered from the MBT strategy is from burning the produced RDF. As mentioned earlier, the RDF is retrieved in the mechanical facilities through negative sorting, and it contains a large content of paper and plastics; thereby, it encompasses a high calorific value [23]. RDF is usually burned in incineration or gasification plants to produce energy that can be harnessed to generate electricity.

2.3. Environmental Performance

The proposed strategies were further assessed based on the GHG emissions released. The environmental carbon footprint was estimated based on the Intergovernmental Panel on Climate Change (IPCC) guidelines [45]. A global warming potential (GWP) index of 28 for CH4 over a 100-year horizon was considered [34].
The equivalent carbon emissions ( E C O 2 ) from incineration plants were estimated according to the following equation [46,47]:
E C O 2 = W P × 44 12 × ( M i × d m i × O F i × F C F i × C F i )
where E C O 2 is the total equivalent carbon emissions in a year (GgCO2-eq/year), WP is the mass of treated waste (Gg/year), 44/12 is the conversion factor from C to CO2, Mi is the mass fraction of material i, dmi is the dry matter fraction of waste material i, OFi is the oxidation factor, FCFi is the fraction of fossil carbon in the total carbon of waste material I, and CFi is the fraction of carbon in the dry matter of waste material i. The dmi, FCFi, and CFi values are reported in the literature [39,40,41,42], while a value of 1 was assumed for OFi.
The E C O 2 from AD plants was calculated as per tier 2 of IPCC guidelines of the biological treatment of solid waste as follows [45]:
E C O 2 = W P × E F × ( 1 R ) × G W P
where E C O 2 is the total equivalent carbon emissions in a year (GgCO2-eq/year), WP is the total mass of waste processed in a facility (Gg/year), EF is the emission factor (g CH4/g), R is the fraction of CH4 recovered, and GWP is the global warming potential of methane. According to the IPCC, the default values for the equation parameters are 0.0008 and 90% for EF and R, respectively [45,48].
The carbon footprint of gasification plants was estimated per functional unit of product (1 kg of syngas). The E C O 2 was computed based on the following equation:
E C O 2 = m G H G × C F G W P m P r o d u c t
where E C O 2 is the total equivalent carbon emissions in a year (GgCO2-eq/year), m G H G is the mass of the generated gases, CFGWP is the characterization factor of the GWP, and m P r o d u c t is the mass of the product.
The main source of GHG emissions in the MBT facility is the biological treatment process. The E C O 2 from aerobic composting plants were computed as per tier 2 of IPCC guidelines of the biological treatment of solid waste. Equation (5) was utilized to estimate the carbon footprint emitted of the composting facility with EF and R values of 0.004 and 0, respectively.

2.4. Financial Performance

Life cycle costing (LCC) was conducted to assess the proposed strategies from an economic perspective. The total costs are categorized into capital investment costs (CAPEX) as well as operation and maintenance costs (OPEX). On the other hand, the main revenue sources included the income from electricity generation and tipping fees. The financial parameters computed for the waste management strategies include: (1) NPV, (2) IRR, (3) PP, (4) profitability index (PI), and (5) levelized cost of electricity (LCOE). Table 2 show the detailed computations and interpretations of the financial parameters used in the present study.

2.5. Eco-Efficiency Analysis

The eco-efficiency analysis is a management tool that aggregates environmental and financial aspects towards a hybrid sustainability assessment. The NPV from the LCC presented the total worth of the investigated systems, while the estimated carbon footprint represented the environmental performance of the proposed strategies. The results of the eco-efficiency analysis were plotted on a portfolio for a comparative evaluation of the examined strategies [34]. The eco-efficiency index (EI) was computed based on the following ratio:
EI = E C O 2 NPV
where E I is the eco-efficiency index, E C O 2 is the normalized carbon footprint of (GgCO2-eq/kg), and NPV net present value of the examined strategy ($/kg).

2.6. Application: Abu Dhabi, UAE

The proposed framework was applied to the city of Abu Dhabi, UAE, to investigate the feasibility of the examined strategies based on the local statistics and operational conditions. In 2018, the MSW generation rate in Abu Dhabi was reported to be 1.76 kg/capita/day, translating to an annual waste generation of 1.8 million tons [49]. The average waste composition in Abu Dhabi was reported as 39% food waste, 25% paper, 19% plastics, 4% glass, 3% metal, 3% textiles, 3% wood, and 4% other [34]. The high fraction of food wastes (39%) is beneficial upon treating waste using gasification or anaerobic digestion, whereas high fractions of paper and plastics (25 and 19%, respectively) can potentially generate high amounts of energy through incineration.
To properly assess the actual MSW in Abu Dhabi, a set of physiochemical waste characterization analyses was carried out, particularly proximate and ultimate analyses (Supplementary Table S2). Realistic recyclables and food waste participation rates were applied. The recyclable participation rate was 20% [34,50,51,52], with an annual increment of 5%, reaching a maximum rate of 90%. Whereas the initial participation rate in separating food wastes was conservatively selected as 10%, increasing by 5% per annum up to 90% maximum [34].
The input economic parameters and assumptions are shown in Table 3. The examined strategies were analyzed over a 25-year design period at a discount rate of 6%. The electricity tariff used in this study was USD 0.08 per kWh, whereas the tipping fees at the landfill and WTE facilities were USD 30 and USD 60 per ton of waste, respectively [52,53]. It is worth mentioning that revenue from MRFs was not accounted for in the present study due to its negligible contribution compared to the income from energy recovery.

3. Results and Discussion

3.1. Technical Performance

To assess the performance of the examined strategies, a waste diversion analysis was conducted to estimate the overall landfill reduction through material and energy recovery. Figure 2 demonstrate the average waste diversion results of the proposed strategies. The findings revealed that the incineration strategy achieved the highest percentage of energy recovery (67%), followed by gasification (52%), MBT (46%), and AD (15%) strategies. The percentage of recycled waste was identical in all the strategies (34%), except for the incineration strategy, which was 12% lower due to the low recycling participation rate, resulting in a lower amount of waste sent to MRFs. On the other hand, the incineration strategy led to the lowest waste disposed of in landfills due to its low ash content. Alternatively, the AD strategy had the highest waste disposal to landfills, followed by the MBT strategy with percentages of 51 and 20%, respectively. This can be attributed to the low amounts of digested waste due to the low public participation in food waste separation, in conjunction with the high quantity of digestate sent to landfills due to the restrictive regulations of UAE regarding the limited usage of waste-based fertilizers [55].

Energy Recovery

Figure 3 present the energy recovery potential of the proposed ISWM strategies over a 25-year assessment period. The highest energy recovery was achieved in the gasification strategy, followed by the incineration strategy, with a total of 47.0 and 34.2 million MWh, respectively. This is mainly due to the high energy yield of gasified (860 kWh) versus incinerated (626 kWh) waste on a per ton processed waste basis. Similarly, a case study in the United States demonstrated that the energy recovered from gasification could range between 800 and 1200 kWh/ton [56]. Moreover, 637 kWh was generated per ton of incinerated waste in Fiji [57]. However, the incineration strategy generated higher energy (1.72 million MWh) in the first year compared to the gasification strategy (1.61 million MWh). This slight difference can be attributed to the larger amount of waste processed. Afterward, the figure showed a fluctuation in the energy generation corresponding to the significant reduction in incinerated waste due to the constant increase in public participation in recyclables separation. Concurrently, the energy production from the gasification plants continued to increase as a result of increased public participation in food waste separation. The significant energy recovery of the gasification technology over the years of operation is in line with the main findings reported in the literature [28]. The AD strategy produced an average of 311 kWh/ton of waste. This agrees with the literature, where 398 kWh/ton was recovered from an AD plant treating MSW in Saudi Arabia [58]. The AD strategy started with a low energy yield of 0.31 million MWh, then significantly increased up to threefold in the final year, reaching 17.2 million MWh. This considerable increase is due to the increased public participation in food waste separation. The MBT strategy had the least specific energy production (273 kWh/ton of waste), which translates to a total of 14.9 MWh due to limited quantities of recovered RDF. This is in line with a study by Fei et al. (2018), reporting that 250 kWh/ton could be generated from MBT systems in China [23]. However, this is compensated by the production of composts that can be marketed for economic revenue. The findings revealed the superiority of thermochemical over biochemical WTE technologies in terms of energy potential. This agrees with a study conducted in Pakistan that reported that the energy potential from thermochemical WTE systems was fourfold that of biochemical systems [59]. Similarly, a study in Ecuador found that treating MSW using thermochemical processes has a high potential for producing energy compared to biochemical processes [60].

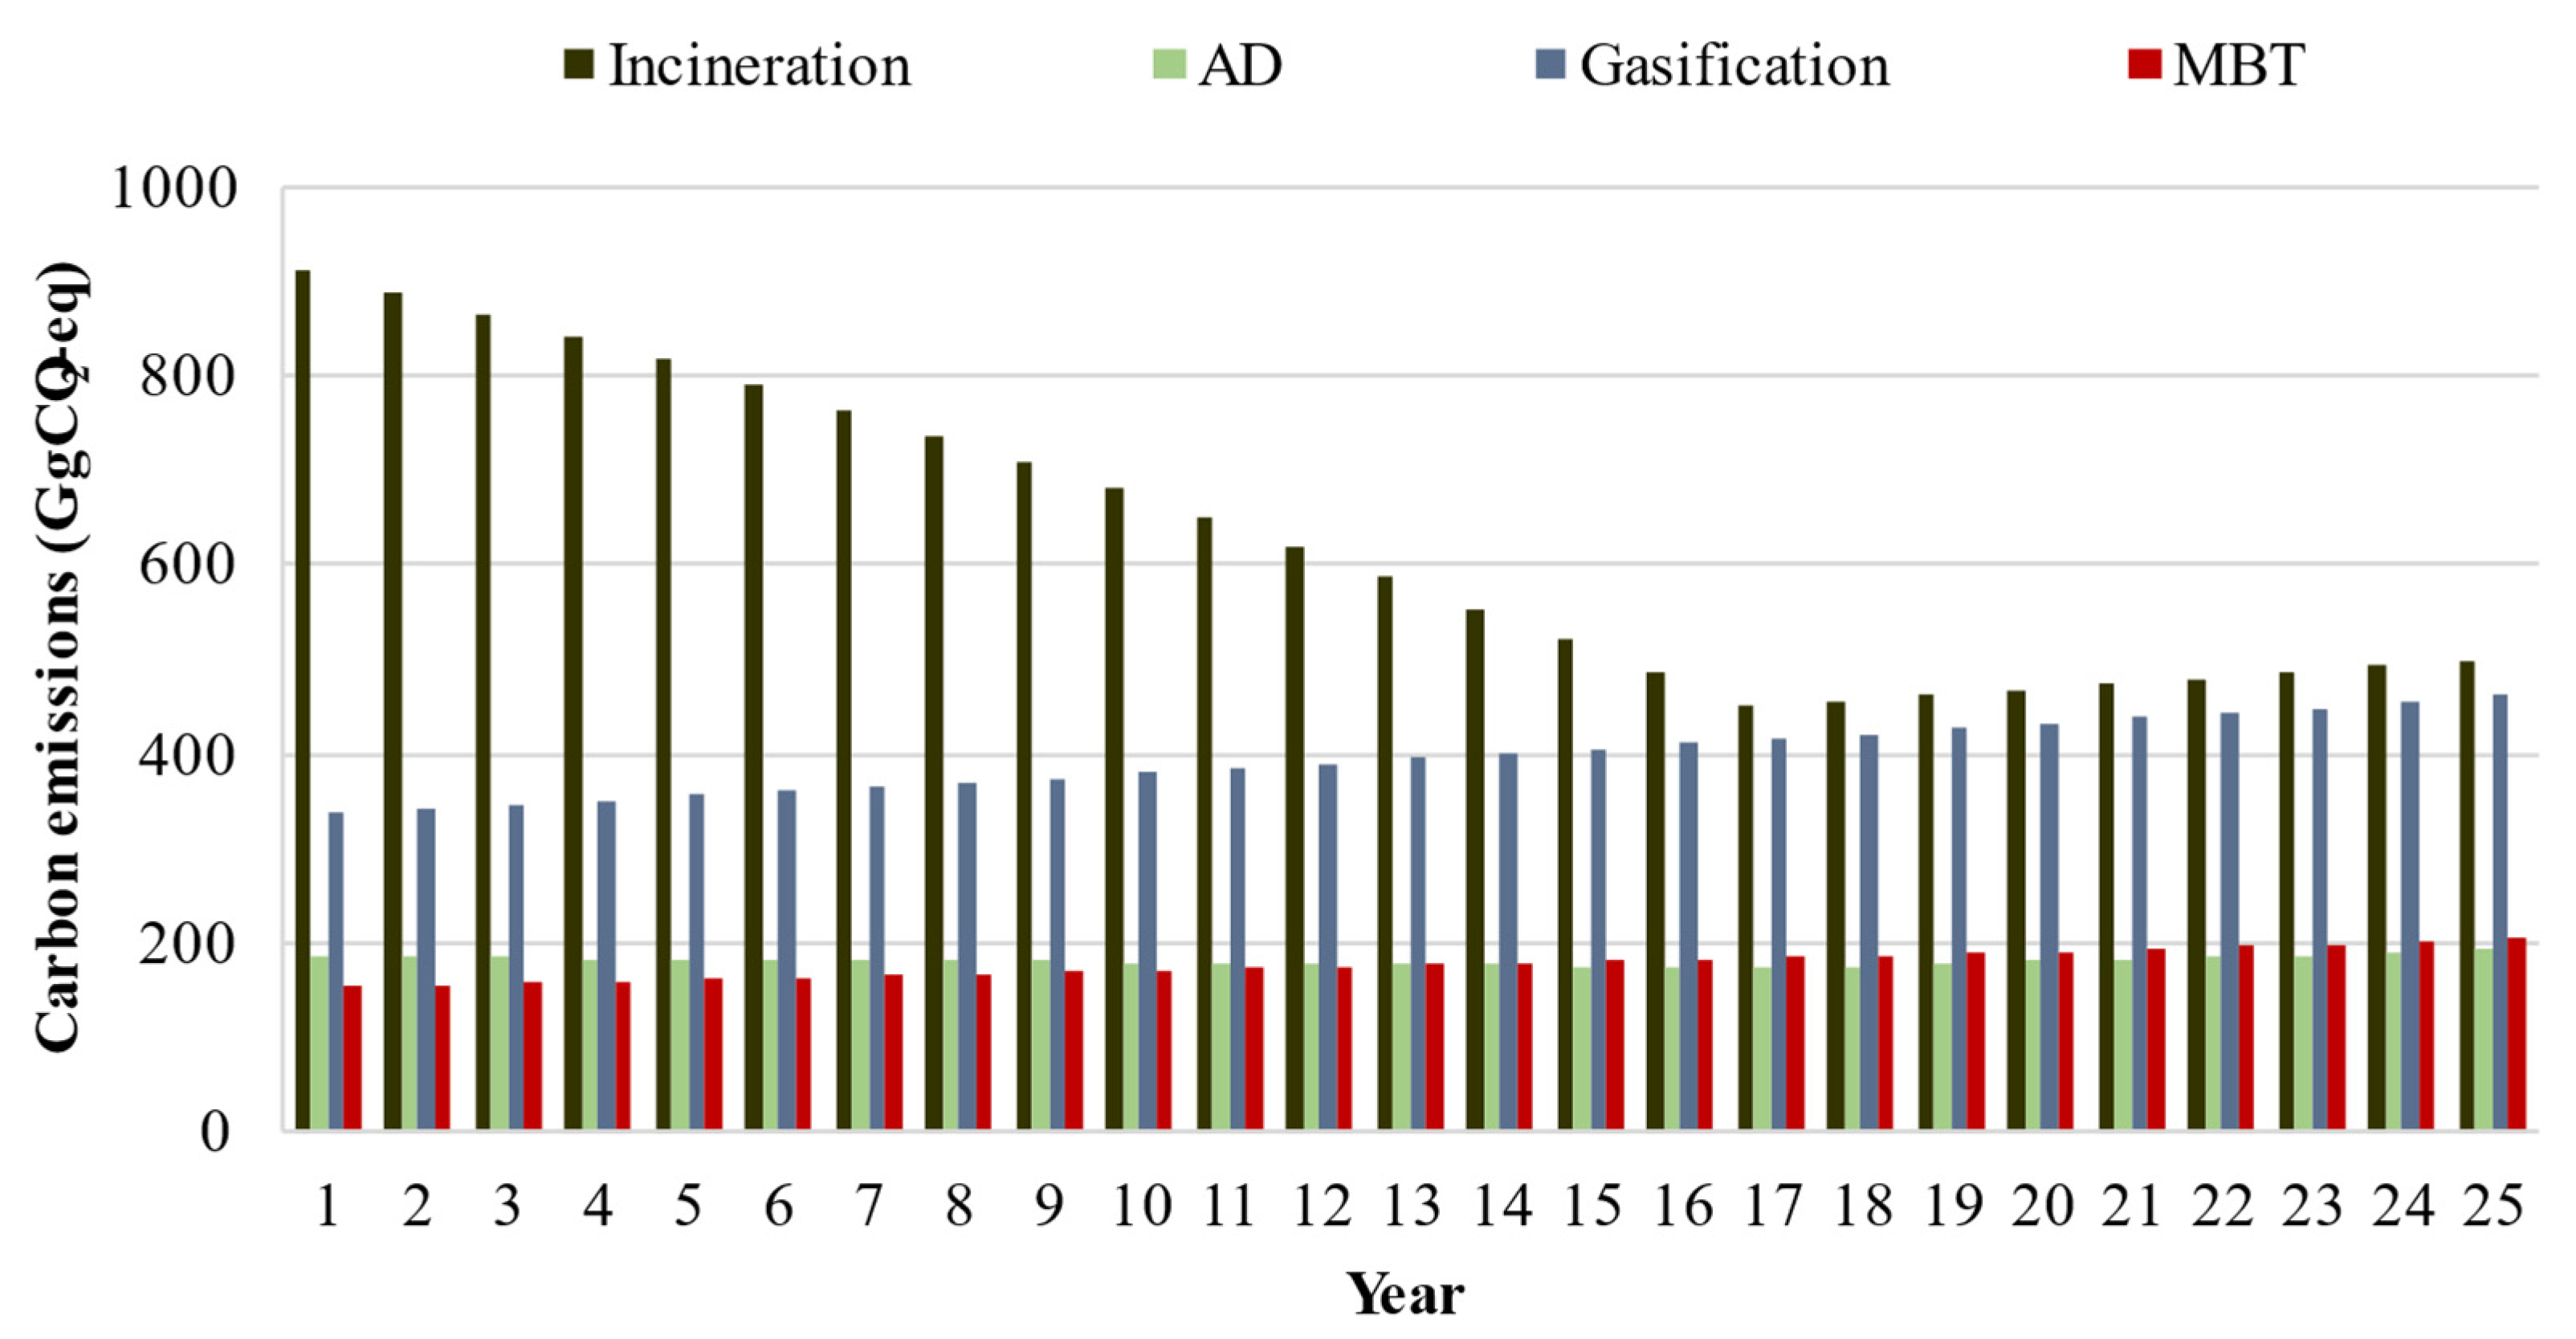
3.2. Environmental Performance

The UAE is classified among the highest per capita GHG emitters. In 2016, the GHG inventory of the country was reported as 22 tCO2-eq per capita [61], i.e., a total of 192 million tCO2-eq [62]. To evaluate the environmental impacts of the proposed ISWM strategies, the carbon footprint of each scenario was computed and presented in Figure 4. The incineration strategy had the highest carbon footprint of approximately 15,700 GgCO2-eq throughout the assessment period. However, the gasification plants resulted in a 36% reduction in GHG emissions due to the treatment of less amount of waste. Other studies also concluded that gasification has a clear environmental advantage over incineration throughout their life cycles. For example, Sun et al. (2021) compared the GWP of these technologies and revealed that gasification would release 32% less GHG emissions [63]. On the other hand, MBT and AD strategies were found to be the most environmentally sustainable, emitting around 4442 and 4539 GgCO2-eq, respectively. This can be attributed to the waste stabilization process before the final disposal in the landfill. The findings emphasized that the biochemical WTE technologies would impose lower environmental burdens compared to thermochemical processes. Moreover, the results are in line with the literature confirming that MBT has more environmental advantages compared to incineration [64].

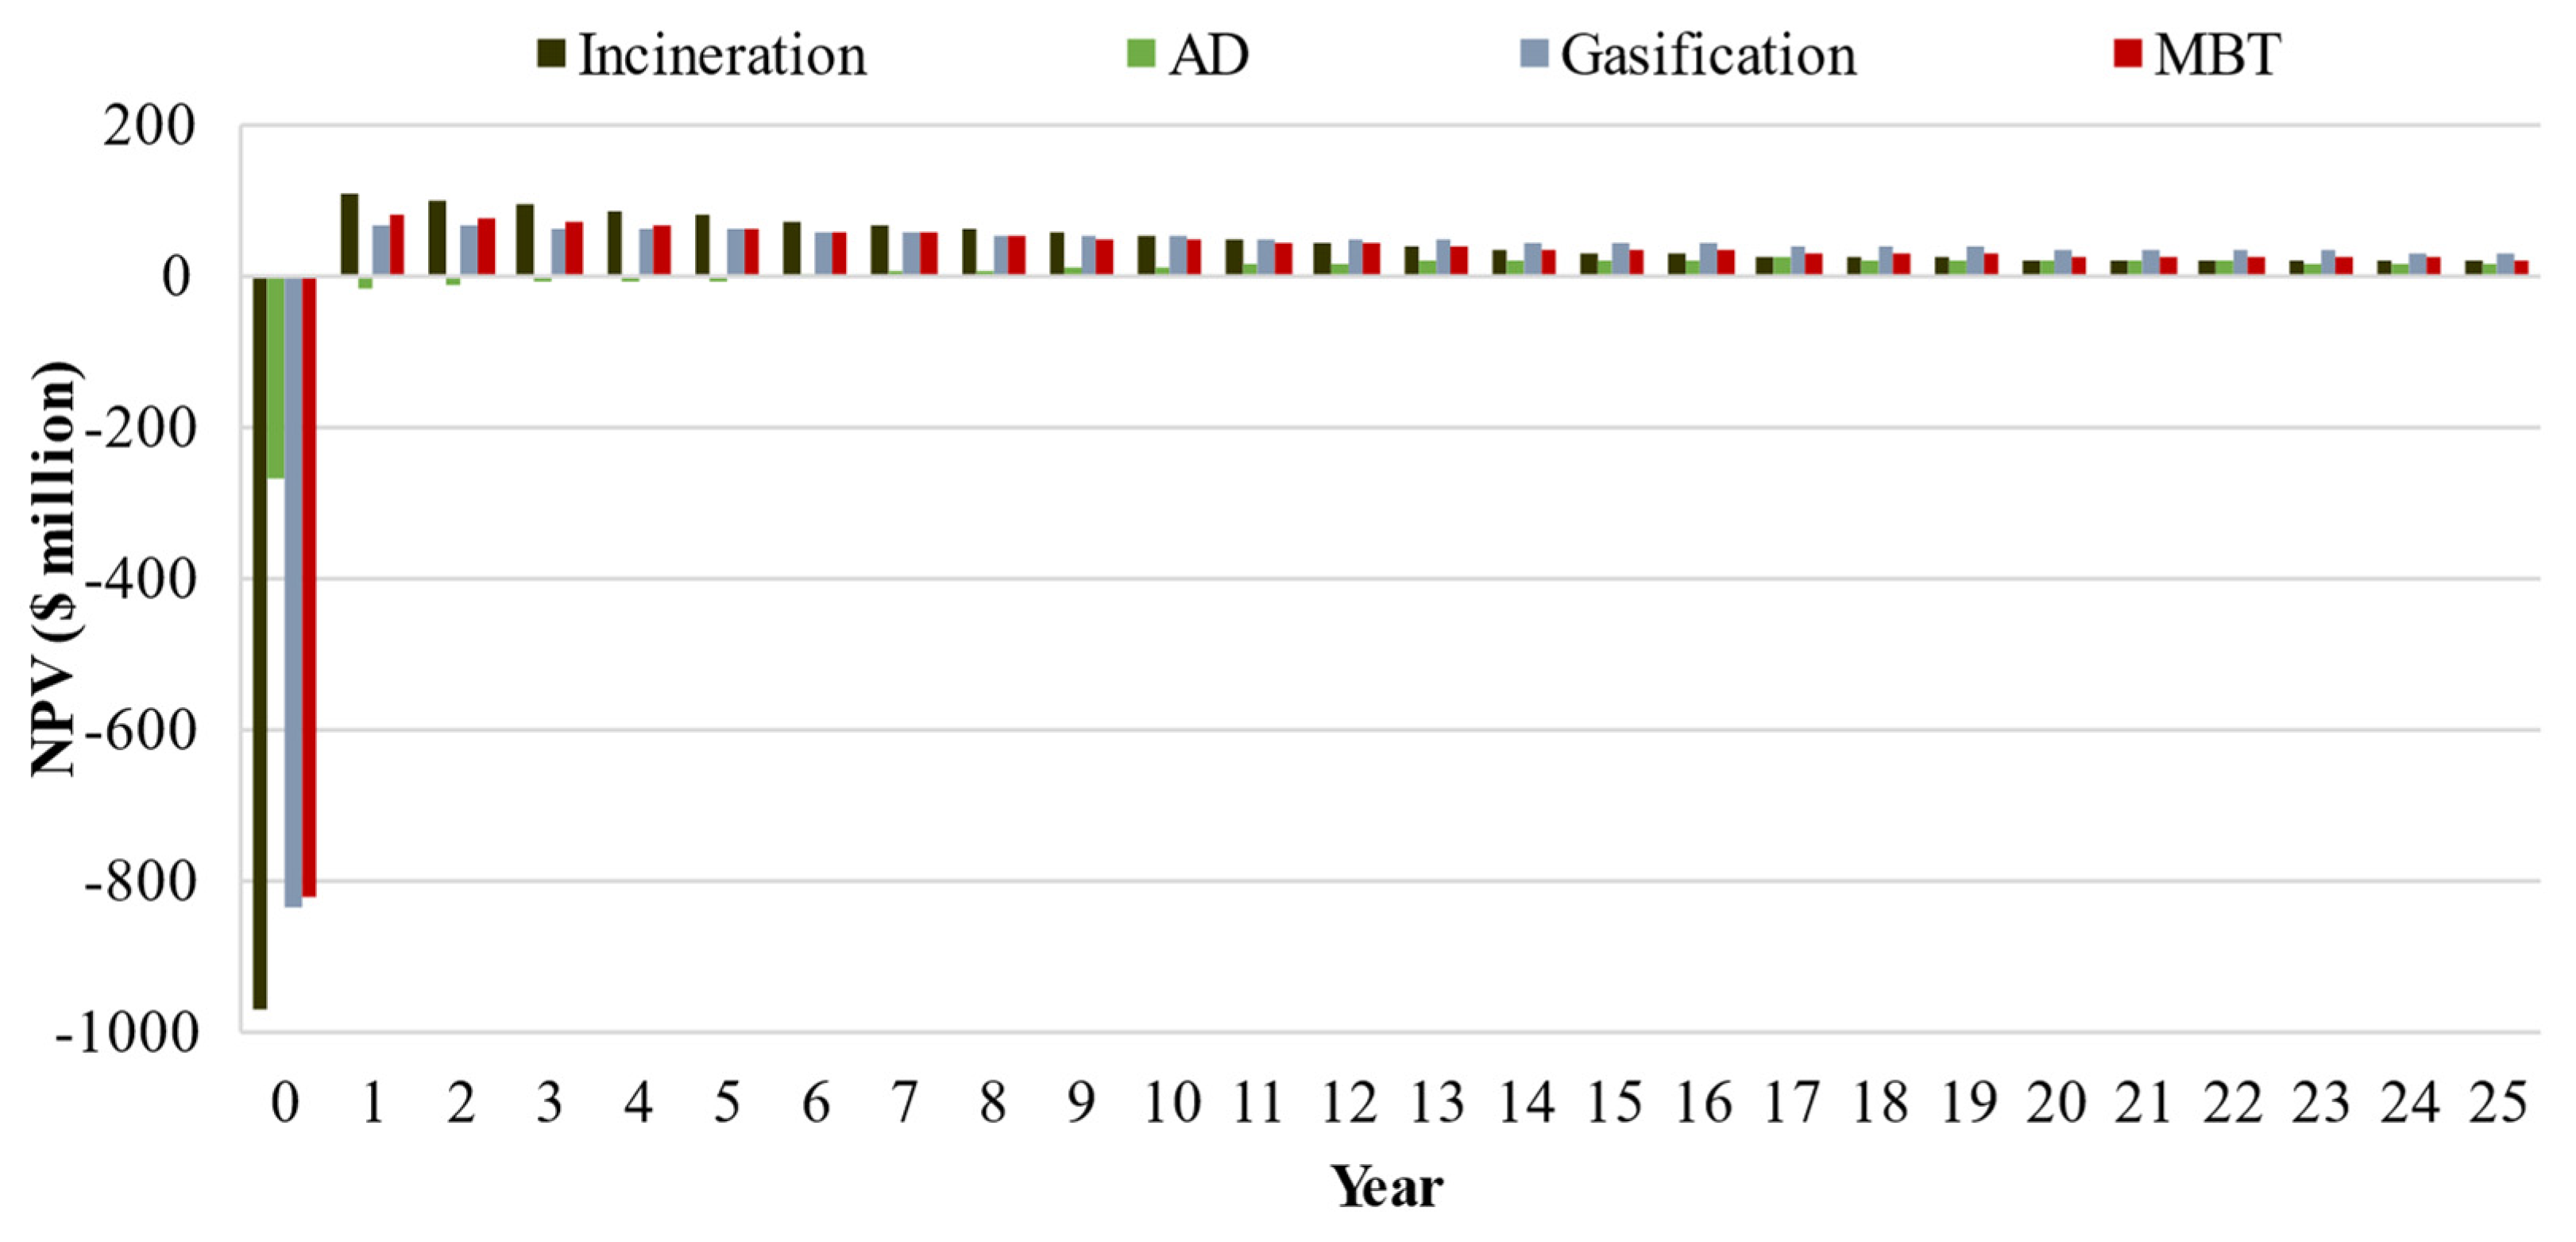
3.3. Life Cycle Costing Analysis

The financial model was developed to measure the performance of the four potential strategies by evaluating a set of financial indicators, (1) NPV, (2) PI, (3) IRR, (4) LCOE, and (5) PP. Figure 5 show the NPVs of the examined ISWM strategies over a 25-year assessment period. The cumulative NPV computations indicated that the gasification strategy was the most profitable with the highest NPV of USD 364 million, followed by the MBT strategy with an NPV of USD 284 million; this difference is attributed to the significantly larger energy revenues for the former strategy. This is in agreement with the findings reported by Hadidi and Omer (2017), who demonstrated that the NPV is highly sensitive to energy generation [2]. On the other hand, the AD strategy was the least financially feasible, with an NPV of USD 33 million. This is mainly due to the higher waste disposal cost resulting from landfilling the produced digestate (51% of the processed waste).
Moreover, the PI was computed as 1.44, 1.35, 1.26, and 1.12 for the gasification, MBT, incineration, and AD strategies, respectively, which was consistent with the NPV results. The profitability of the gasification and MBT strategies was further confirmed with a similar IRR of 9%, whereas the incineration- and AD strategies scored an IRR of 8% and 7%, respectively, which are more than the discount rate (6%) used in this study, hence indicating profitable projects. The lowest LCOE value of $0.108 per kWh was achieved in the gasification strategy, compared to the current electricity tariff ($0.08 per kWh). Despite the proven profitability, the LCOE of all strategies was higher than the current electricity tariff, as it does not consider other revenue streams of WTE technologies, e.g., tipping fees [34].
Figure 6 expressed the payback periods of the proposed ISWM strategies by plotting the cumulative NPV throughout the study period. During the opening year, the incineration strategy had the lowest NPV, followed by the gasification and MBT strategies. This is mainly due to higher CAPEX at the maximum treated waste capacity. The payback period for the gasification strategy was around 16 years, while it was about 17 years for the MBT and incineration strategies. On the other hand, the AD strategy took almost the whole assessment period, equal to its expected lifetime, to recover from the initial investment.

3.4. Eco-Efficiency Analysis

The eco-efficiency analysis provides a hybrid environmental and economic assessment of the proposed ISWM strategies. The carbon footprint results were incorporated with the NPV and depicted by an eco-efficiency profile. The profile represented the relationship between the environmental impacts relative to the economic value. Figure 7 illustrate the normalized eco-efficiency indicators of the proposed scenarios. The least net present worth and highest environmental impact is shown in the top left quartile, while the most eco-efficient strategies were represented in the bottom right quartile. The profile revealed that the MBT strategy achieved the lowest environmental impacts and least economic value, followed by the gasification strategy. On the other hand, despite the AD strategy having a relatively low carbon footprint, it achieved the lowest economic value. The EI computation revealed that the AD scenario was the least eco-efficient system of 0.99, whereas the MBT scenario was the most eco-efficient of 0.11. The integration of economic and environmental aspects into the eco-efficiency analysis indicated that the MBT alternative is the most eco-efficient ISWM strategy.
In conclusion, Table 4 summarize the findings of carbon footprint, LCC, and eco-efficiency analyses. Based on the GHG emissions of the four scenarios, the incineration strategy achieved the highest score, followed by gasification, AD, and MBT plant. According to the financial indicators, all strategies were found to have positive NPV; the gasification strategy was the most financially feasible, followed by the MBT and AD strategies. Combining both sustainability aspects, the MBT strategy was found to be the most eco-efficient, while the AD strategy was the least.

3.5. Suggested Reforms

The incineration and AD strategies were found to be the least eco-efficient. However, the findings of this study depended on current local legislations that may change in the future. Therefore, three policy reforms were investigated towards improving the performance of the incineration and AD strategies. The first reform constitutes a recycling incentive program. Implementing such a program would potentially increase the participation rate by 15.5% in Abu Dhabi, as it was successfully applied in the United States and the United Kingdom [65]. This program is estimated to cost around USD 0.4 per household/month, adding up to around USD 100,000 per month [65]. The second reform includes less stringent bylaws on digestate usage; considering the digestate generated as a valuable resource in agricultural applications would save the landfilling fees and promote waste diversion. The digestate would be sold at a rate of USD 0.27 per kg in the local market. The third reform involves increasing food waste source separation. The food waste source separation rate is a critical factor in determining the quantity of feedstock processed in biochemical WTE plants. Due to the scarcity of local and regional experiences, this study projected conservative participation rates. As a result, a 10% increase in food waste separation is implemented in the third reform [34]. Table 5 show the impact of the suggested reforms on environmental and financial performance.
As shown in Table 5, the proposed reforms resulted in positive impacts on the performance of the investigated strategies. The recognition of digestate as a commercial fertilizer for agricultural practices and the increase in food waste separation enhanced the NPV and carbon footprint of the AD strategy. Reform 2 caused an increase in NPV from $33 to $519 million while the carbon footprint decreased by 720 GgCO2-eq. This can be attributed to the significant reductions in the number of materials disposed of in landfills. The NPV increased to $125 million when reform 3 was implemented, whereas the carbon footprint slightly decreased. A similar observation was found upon implementing reform 3 with the gasification strategy, where the NPV increased by 20% and carbon footprint was marginally reduced by 5%. These findings demonstrate that reform 3 can be successfully applied to different strategies. On the other hand, the implementation of reform 1 showed enhancements in the carbon footprint of the incineration strategy by around 20%. However, this reform decreased the NPV from USD 248 to USD 150 million. This is mainly due to the lower fraction of waste processed in the incinerator, reducing the energy produced and the relevant revenues. Moreover, it was found that the proposed reforms could bring the AD closer to being the most sustainable strategy. Since the implementation of reform 2 would make the AD strategy more eco-efficient than the incineration and gasification strategies with an EI of 0.12, this positive changeover emphasizes that strategical reforms can be successfully adopted in decision-making and policy development.

4. Conclusions

WTE systems offer a promising alternative towards sustainable waste management as part of ISWM strategies. This study examined four ISWM strategies based on: (1) incineration, (2) AD, (3) gasification, and (4) MBT. The assessment investigated the techno-economic and environmental performance of the proposed scenarios by estimating the energy generation potential, life cycle costs, and carbon footprint. The feasibility of the proposed strategies was tested in Abu Dhabi, UAE, based on local conditions and bylaws. The highest energy recovery was achieved in the gasification strategy, generating around 47.0 million MWh, followed by the incineration strategy. On the contrary, the MBT and AD strategies were found to be the most environmentally viable, with GHG emissions of 4442 and 4539 GgCO2-eq, respectively. From an economic perspective, the gasification and MBT strategies achieved the highest profitability, with a total NPV of USD 364 and USD 284 million, respectively. Additionally, the environmental and financial findings were incorporated in an eco-efficiency analysis that showed that the strategies based on MBT and gasification were the most sustainable scenarios.
Multiple reforms were introduced to enhance the efficiency of the incineration and AD strategies. For instance, implementing a reward recycling program towards promoting public participation in separating recyclables resulted in 20% GHG emission reductions for the incineration strategy. Moreover, the financial feasibility of the AD strategy significantly improved upon selling the produced digestate rather than disposing of it. Overall, this research emphasized the potential environmental and economic benefits of integrating MBT and gasification technologies into ISWM strategies.

Supplementary Materials

The following supporting information can be downloaded at: https://www.mdpi.com/article/10.3390/su14073899/s1, Table S1: Calorific values of waste fractions; Table S2: Ultimate analysis of municipal solid waste streams.

Author Contributions

Conceptualization, M.A.; methodology, A.A., R.Z. and W.M.; software, A.A.; validation, R.Z., W.M. and L.R.-M.; formal analysis, A.A., R.Z. and W.M.; writing—original draft preparation, A.A., R.Z. and W.M.; writing—review and editing, M.A. and L.R.-M.; visualization, A.A., R.Z. and W.M.; supervision, M.A.; project administration, M.A. All authors have read and agreed to the published version of the manuscript.

Funding

This research received funding from the Office of Vice Chancellor for Research and Graduate Studies at the University of Sharjah.

Conflicts of Interest

The authors declare no conflict of interest.

Abbreviations

ADAnaerobic digestion
CAPEXCapital costs
EIEco-efficiency index
GHGGreenhouse gas
GWPGlobal warming potential
HHVHigh heating value
IPCCIntergovernmental panel climate change
IRRInternal rate of return
ISWMIntegrated solid waste management
LCCLife cycle costing
LCOELevelized cost of electricity
MBTMechanical biological treatment
MRFMaterial recovery facility
MSWMunicipal solid waste
NPVNet present value
OPEXOperation and maintenance costs
PIProfitability index
PPPayback period
RDFRefused derived fuel
UAEUnited Arab Emirates
WTEWaste-to-energy

References

  1. Vlachokostas, C.; Michailidou, A.; Achillas, C. Multi-Criteria Decision Analysis towards Promoting Waste-to-Energy Management Strategies: A Critical Review. Renew. Sustain. Energy Rev. 2021, 138, 110563. [Google Scholar] [CrossRef]
  2. Hadidi, L.A.; Omer, M.M. A Financial Feasibility Model of Gasification and Anaerobic Digestion Waste-to-Energy (WTE) Plants in Saudi Arabia. Waste Manag. 2017, 59, 90–101. [Google Scholar] [CrossRef] [PubMed]
  3. Mohammadi, M.; Harjunkoski, I. Performance Analysis of Waste-to-Energy Technologies for Sustainable Energy Generation in Integrated Supply Chains. Comput. Chem. Eng. 2020, 140, 106905. [Google Scholar] [CrossRef]
  4. Matter, A.; Dietschi, M.; Zurbrügg, C. Improving the Informal Recycling Sector through Segregation of Waste in the Household—The Case of Dhaka Bangladesh. Habitat Int. 2013, 38, 150–156. [Google Scholar] [CrossRef]
  5. Moya, D.; Aldás, C.; López, G.; Kaparaju, P. Municipal Solid Waste as a Valuable Renewable Energy Resource: A Worldwide Opportunity of Energy Recovery by Using Waste-To-Energy Technologies. Energy Procedia 2017, 134, 286–295. [Google Scholar] [CrossRef]
  6. Abdallah, M.; Arab, M.; Shabib, A.; El-Sherbiny, R.; El-Sheltawy, S. Characterization and Sustainable Management Strategies of Municipal Solid Waste in Egypt. Clean Technol. Environ. Policy 2020, 22, 1371–1383. [Google Scholar] [CrossRef]
  7. Abdallah, M.; Elfeky, A. Impact of Waste Processing Byproducts on the Carbon Footprint of Integrated Waste-to-Energy Strategies. J. Environ. Manag. 2021, 280, 111839. [Google Scholar] [CrossRef]
  8. Belgiorno, V.; de Feo, G.; Della Rocca, C.; Napoli, R.M.A. Energy from Gasification of Solid Wastes. Waste Manag. 2003, 23, 1–15. [Google Scholar] [CrossRef]
  9. Fuss, M.; Vergara-Araya, M.; Barros, R.T.V.; Poganietz, W.R. Implementing Mechanical Biological Treatment in an Emerging Waste Management System Predominated by Waste Pickers: A Brazilian Case Study. Resour. Conserv. Recycl. 2020, 162, 105031. [Google Scholar] [CrossRef]
  10. Korai, M.S.; Mahar, R.B.; Uqaili, M.A. Optimization of Waste to Energy Routes through Biochemical and Thermochemical Treatment Options of Municipal Solid Waste in Hyderabad, Pakistan. Energy Convers. Manag. 2016, 124, 333–343. [Google Scholar] [CrossRef]
  11. Patel, N. Municipal Solid Waste and Its Role in Sustainability. IEA Bioenergy 2003, 3, 4–9. [Google Scholar]
  12. Arena, U. Process and Technological Aspects of Municipal Solid Waste Gasification. A Review. Waste Manag. 2012, 32, 625–639. [Google Scholar] [CrossRef] [PubMed]
  13. Medina Jimenez, A.C.; Bereche, R.P.; Nebra, S. Three Municipal Solid Waste Gasification Technologies Analysis for Electrical Energy Generation in Brazil. Waste Manag. Res. 2019, 37, 631–642. [Google Scholar] [CrossRef]
  14. Scaglia, B.; Salati, S.; di Gregorio, A.; Carrera, A.; Tambone, F.; Adani, F. Short Mechanical Biological Treatment of Municipal Solid Waste Allows Landfill Impact Reduction Saving Waste Energy Content. Bioresour. Technol. 2013, 143, 131–138. [Google Scholar] [CrossRef]
  15. Trulli, E.; Ferronato, N.; Torretta, V.; Piscitelli, M.; Masi, S.; Mancini, I. Sustainable Mechanical Biological Treatment of Solid Waste in Urbanized Areas with Low Recycling Rates. Waste Manag. 2018, 71, 556–564. [Google Scholar] [CrossRef]
  16. Bezama, A.; Aguayo, P.; Konrad, O.; Navia, R.; Lorber, K.E. Investigations on Mechanical Biological Treatment of Waste in South America: Towards More Sustainable MSW Management Strategies. Waste Manag. 2007, 27, 228–237. [Google Scholar] [CrossRef]
  17. Dong, J.; Tang, Y.; Nzihou, A.; Chi, Y.; Albi, M.; Jarlard, C. Key Factors Influencing the Environmental Performance of Pyrolysis, Gasification and Incineration Waste-to-Energy Technologies. Energy Convers. Manag. 2019, 196, 497–512. [Google Scholar] [CrossRef] [Green Version]
  18. Dong, J.; Tang, Y.; Nzihou, A.; Chi, Y.; Weiss-Hortala, E.; Ni, M.; Zhou, Z. Comparison of Waste-to-Energy Technologies of Gasification and Incineration Using Life Cycle Assessment: Case Studies in Finland, France and China. J. Clean. Prod. 2018, 203, 287–300. [Google Scholar] [CrossRef]
  19. Barrena, R.; d’Imporzano, G.; Ponsá, S.; Gea, T.; Artola, A.; Vázquez, F.; Sánchez, A.; Adani, F. In Search of a Reliable Technique for the Determination of the Biological Stability of the Organic Matter in the Mechanical-Biological Treated Waste. J. Hazard. Mater. 2009, 162, 1065–1072. [Google Scholar] [CrossRef] [Green Version]
  20. Donovan, S.M.; Bateson, T.; Gronow, J.R.; Voulvoulis, N. Modelling the Behaviour of Mechanical Biological Treatment Outputs in Landfills Using the GasSim Model. Sci. Total Environ. 2010, 408, 1979–1984. [Google Scholar] [CrossRef]
  21. Zdanevitch, I.; Bour, O.; Llinas, L.; Lejal, S. Comparison of Polluting Potentials of Liquid Emissions from MBT Plants. Energy Convers. Manag. 2009, 196, 399–400. [Google Scholar]
  22. di Lonardo, M.C.; Lombardi, F.; Gavasci, R. Characterization of MBT Plants Input and Outputs: A Review. Rev. Environ. Sci. Biotechnol. 2012, 11, 353–363. [Google Scholar] [CrossRef]
  23. Fei, F.; Wen, Z.; Huang, S.; de Clercq, D. Mechanical Biological Treatment of Municipal Solid Waste: Energy Efficiency, Environmental Impact and Economic Feasibility Analysis. J. Clean. Prod. 2018, 178, 731–739. [Google Scholar] [CrossRef]
  24. Montejo, C.; Tonini, D.; del Carmen Márquez, M.; Fruergaard Astrup, T. Mechanical-Biological Treatment: Performance and Potentials. An LCA of 8 MBT Plants Including Waste Characterization. J. Environ. Manag. 2013, 128, 661–673. [Google Scholar] [CrossRef] [PubMed] [Green Version]
  25. Thibodeau, C.; Monette, F.; Bulle, C.; Glaus, M. Comparison of Black Water Source-Separation and Conventional Sanitation Systems Using Life Cycle Assessment. J. Clean. Prod. 2014, 67, 45–57. [Google Scholar] [CrossRef]
  26. Mabalane, P.N.; Oboirien, B.O.; Sadiku, E.R.; Masukume, M. A Techno-Economic Analysis of Anaerobic Digestion and Gasification Hybrid System: Energy Recovery from Municipal Solid Waste in South Africa. Waste Biomass Valorization 2020, 12, 1167–1184. [Google Scholar] [CrossRef]
  27. Chen, Y.; Wang, Y.; Pezzola, L.; Mussi, R.; Bromberg, L.; Heywood, J.; Kasseris, E. A Novel Low-Cost Tar Removal Technology for Small-Scale Biomass Gasification to Power. Biomass Bioenergy 2021, 149, 106085. [Google Scholar] [CrossRef]
  28. Yassin, L.; Lettieri, P.; Simons, S.J.R.; Germanà, A. Techno-Economic Performance of Energy-from-Waste Fluidized Bed Combustion and Gasification Processes in the UK Context. Chem. Eng. J. 2009, 146, 315–327. [Google Scholar] [CrossRef]
  29. Paes, M.X.; de Medeiros, G.A.; Mancini, S.D.; Bortoleto, A.P.; Puppim de Oliveira, J.A.; Kulay, L.A. Municipal Solid Waste Management: Integrated Analysis of Environmental and Economic Indicators Based on Life Cycle Assessment. J. Clean. Prod. 2020, 254, 119848. [Google Scholar] [CrossRef]
  30. Rigamonti, L.; Borghi, G.; Martignon, G.; Grosso, M. Life Cycle Costing of Energy Recovery from Solid Recovered Fuel Produced in MBT Plants in Italy. Waste Manag. 2019, 99, 154–162. [Google Scholar] [CrossRef]
  31. Bourtsalas, A.T.; Triantafyllou, V. Financial and Environmental Assessment of Four Advanced European MBT Facilities. 2019. Available online: http://uest.ntua.gr/heraklion2019/proceedings/pdf/HERAKLION2019_Bourtsalas_Triantafyllou.pdf (accessed on 10 February 2022).
  32. Abdalla, H.; Rahmat-Ullah, Z.; Abdallah, M.; Alsmadi, S.; Elashwah, N. Eco-Efficiency Analysis of Integrated Grey and Black Water Management Systems. Resour. Conserv. Recycl. 2021, 172, 105681. [Google Scholar] [CrossRef]
  33. ISO. 14045 Environmental Management—Ecoefficiency Assessment of Product Systems—Principles, Requirements and Guidelines; ISO: Geneva, Switzerland, 2012; ISBN 2831886376. [Google Scholar]
  34. Abdallah, M.; Shanableh, A.; Shabib, A.; Adghim, M. Financial Feasibility of Waste to Energy Strategies in the United Arab Emirates. Waste Manag. 2018, 82, 207–219. [Google Scholar] [CrossRef] [PubMed]
  35. Calì, G.; Deiana, P.; Bassano, C.; Meloni, S.; Maggio, E.; Mascia, M.; Pettinau, A. Syngas Production, Clean-up and Wastewater Management in a Demo-Scale Fixed-Bed Updraft Biomass Gasification Unit. Energies 2020, 13, 2594. [Google Scholar] [CrossRef]
  36. Economopoulos, A.P. Technoeconomic Aspects of Alternative Municipal Solid Wastes Treatment Methods. Waste Manag. 2010, 30, 707–715. [Google Scholar] [CrossRef]
  37. Christensen, T.H.; Boldrin, A.; Körner, I.; Krogmann, U. Composting: Mass Balances and Product Quality. Solid Waste Technol. Manag. 2010, 2, 569–582. [Google Scholar] [CrossRef]
  38. IRENA. Renewable Power Generation Costs in 2017; International Renewable Energy Agency: Abu Dhabi, United Arab Emirates, 2017; p. 92. ISBN 978-3-9815934-2-6. [Google Scholar]
  39. Ouda, O.K.M.; Raza, S.A.; Nizami, A.S.; Rehan, M.; Al-Waked, R.; Korres, N.E. Waste to Energy Potential: A Case Study of Saudi Arabia. Renew. Sustain. Energy Rev. 2016, 61, 328–340. [Google Scholar] [CrossRef]
  40. Arafat, H.A.; Jijakli, K. Modeling and Comparative Assessment of Municipal Solid Waste Gasification for Energy Production. Waste Manag. 2013, 33, 1704–1713. [Google Scholar] [CrossRef]
  41. IPCC 2006. IPCC Guidelines for National Greenhouse Gas Inventories: Vol 5 Chapter 3 Solid Waste Disposal. 2006 IPCC Guidel. Natl. Greenh. Gas Invent. 2006, 4, 6.1–6.49. [Google Scholar]
  42. Abdallah, M.; Hamdan, S.; Shabib, A. A Multi-Objective Optimization Model for Strategic Waste Management Master Plans. J. Clean. Prod. 2021, 284, 124714. [Google Scholar] [CrossRef]
  43. Ouda, O.K.M.; Raza, S.A.; Al-Waked, R.; Al-Asad, J.F.; Nizami, A.S. Waste-to-Energy Potential in the Western Province of Saudi Arabia. J. King Saud Univ. Eng. Sci. 2017, 29, 212–220. [Google Scholar] [CrossRef] [Green Version]
  44. Zainal, Z.A.; Rifau, A.; Quadir, G.A.; Seetharamu, K.N. Experimental Investigation of a Downdraft Biomass Gasifier. Biomass Bioenergy 2002, 23, 283–289. [Google Scholar] [CrossRef]
  45. Pipatti, R.; Sharma, C.; Yamada, M. Chapter 2: Waste Generation and Compositon and Management Data. IPCC Guidel. Natl. Greenh. Gas Invent. 2006, 5, 23. [Google Scholar]
  46. Rogoff, M.J.; Screve, F. Introduction and Overview, Waste-To-Energy. Res. Transp. Econ. 2011, 10, 1–9. [Google Scholar] [CrossRef]
  47. Abdallah, M.; Rahmat-Ullah, Z.; Metawa, A. Dynamic Multi-Objective Optimization of Integrated Waste Management Using Genetic Algorithms. In Soft Computing Techniques in Solid Waste and Wastewater Management; Elsevier: Amsterdam, The Netherlands, 2021; pp. 257–274. [Google Scholar]
  48. Intergovernmental Panel on Climate Change. Climate Change 2007: The Physical Science Basis: Contribution of Working Group I to the Fourth Assessment Report of the Intergovernmental Panel on Climate Change; Cambridge University Press: Cambridge, UK, 2007; ISBN 9780521705967. [Google Scholar]
  49. Statistics Centre of Abu Dhabi Waste Statistics; Abu Dhabi, 2018. Available online: https://data.abudhabi/dataset/waste-statistics-2018 (accessed on 10 February 2022).
  50. Groot, K.I. Activating Household Waste Separation Behaviour in High-Rise Rotterdam. 2019. Available online: https://repository.tudelft.nl/islandora/object/uuid:220f7d4f-81a8-4236-80f8-42ab3c0eb1be/datastream/OBJ/download (accessed on 10 February 2022).
  51. Sarbassov, Y.; Sagalova, T.; Tursunov, O.; Venetis, C.; Xenarios, S.; Inglezakis, V. Survey on Household Solid Waste Sorting at Source in Developing Economies: A Case Study of Nur-Sultan City in Kazakhstan. Sustainability 2019, 11, 6496. [Google Scholar] [CrossRef] [Green Version]
  52. Santoso, A.N. Farizal Community Participation in Household Waste Management: An Exploratory Study in Indonesia. E3S Web Conf. 2019, 125, 07013. [Google Scholar] [CrossRef]
  53. Kumar, A.; Samadder, S.R. A Review on Technological Options of Waste to Energy for Effective Management of Municipal Solid Waste. Waste Manag. 2017, 69, 407–422. [Google Scholar] [CrossRef]
  54. Judge, A. 2017 Briefing Report: Mechanical Biological Treatment-15 Years of UK Experience. 2017. Available online: https://www.tolvik.com/wp-content/uploads/2017/09/Tolvik-2017-Briefing-Report-Mechanical-Biological-Treatment.pdf (accessed on 10 February 2022).
  55. Ministery of Environment and water Ministerial Resolution Number (476) of the Year 2007 Concerning by-Law of AGCC Fertilizers and Agricultural Soil Conditioners Law; Abu Dhabi, 2007. Available online: https://www.moccae.gov.ae/assets/download/e4e8ae38/476.pdf.aspx?view=true (accessed on 10 February 2022).
  56. Gesell, G.; Fryklind, K.; Spott, B. Case Study of WTE and Gasification. In Proceedings of the North American Waste-to-Energy Conference, Lancaster, PN, USA, 19 February 2018; pp. 1–8. [Google Scholar]
  57. Nadan, M.K. Waste to Energy: Biogas from Municipal Solid Waste for Power Generation. Adv. Glob. Change Res. 2020, 68, 129–149. [Google Scholar] [CrossRef]
  58. Khan, M.S.M.; Kaneesamkandi, Z. Biodegradable Waste to Biogas: Renewable Energy Option for the Kingdom of Saudi Arabia. Int. J. Innov. Appl. Stud. 2013, 4, 101–113. [Google Scholar]
  59. Korai, M.S.; Mahar, R.B.; Uqaili, M.A. The Feasibility of Municipal Solid Waste for Energy Generation and Its Existing Management Practices in Pakistan. Renew. Sustain. Energy Rev. 2017, 72, 338–353. [Google Scholar] [CrossRef]
  60. Moya, D.; Aldás, C.; Jaramillo, D.; Játiva, E.; Kaparaju, P. Waste-To-Energy Technologies: An Opportunity of Energy Recovery from Municipal Solid Waste, Using Quito-Ecuador as Case Study. Energy Procedia 2017, 134, 327–336. [Google Scholar] [CrossRef]
  61. The Word Bank CO2 Emissions (Metric Tons per Capita)—United Arab Emirates. Available online: https://data.worldbank.org/indicator/EN.ATM.CO2E.PC?locations=AE (accessed on 10 February 2022).
  62. United Arab Emirates Ministry of Energy & Industry United Arab Emirates 4rth National National Communication Report. 2018. Available online: https://www.moei.gov.ae/en/open-data.aspx (accessed on 10 February 2022).
  63. Sun, Y.; Qin, Z.; Tang, Y.; Huang, T.; Ding, S.; Ma, X. Techno-Environmental-Economic Evaluation on Municipal Solid Waste (MSW) to Power/Fuel by Gasification-Based and Incineration-Based Routes. J. Environ. Chem. Eng. 2021, 9, 106108. [Google Scholar] [CrossRef]
  64. Kourkoumpas, D.S.; Karellas, S.; Kouloumoundras, S.; Koufodimos, G.; Grammelis, P.; Kakaras, E. Comparison of Waste-to-Energy Processes by Means of Life Cycle Analysis Principles Regarding the Global Warming Potential Impact: Applied Case Studies in Greece, France and Germany. Waste Biomass Valorization 2015, 6, 605–621. [Google Scholar] [CrossRef]
  65. University of Arkansas Implementing Incentives Programs to Increase Recycling Participation. 2010. Available online: https://sustainability.uark.edu/_resources/pdfs/acad-cap-2013-teague.pdf (accessed on 10 February 2022).
Figure 1. Schematic flow diagram of the proposed integrated waste management scenarios based on: (a) incineration, (b) anaerobic digestion, (c) gasification, and (d) mechanical biological treatment.
Sustainability 14 03899 g001
Figure 2. Average fractions of waste streams in the proposed ISWM strategies.
Sustainability 14 03899 g002
Figure 3. Potential energy production of the proposed ISWM strategies.
Sustainability 14 03899 g003
Figure 4. Carbon footprint of the proposed ISWM strategies.
Sustainability 14 03899 g004
Figure 5. Annual net present value of the proposed ISWM strategies.
Sustainability 14 03899 g005
Figure 6. Cumulative net present values of the proposed ISWM strategies.
Sustainability 14 03899 g006
Figure 7. Eco-efficiency profile for the proposed ISWM strategies.
Sustainability 14 03899 g007
Table 1. Flow streams and mass balance of the proposed management facilities.
FacilityBy-ProductsFate of by-ProductsFraction (%)References
IncinerationHeatEnergy generation90[34]
AshLandfill10
Anaerobic digestion (AD)BiogasEnergy generation60[34]
DigestateMarket/Incineration/Landfill40
GasificationSyngasEnergy generation80[35]
Ash and slagLandfill20
Mechanical sorting *RecyclablesMarket30[36]
BiodegradablesComposting facility30
RDFMarket18
RejectsLandfill22
Aerobic composting *Emissions-70[37]
CompostMarket30
* Mechanical sorting and aerobic composting facilities are part of the mechanical biological treatment (MBT).
Table 2. Detailed computations and interpretations of the financial parameters used in this study.
ParameterDefinitionComputationRemarksInterpretation
Net present value (NPV)Present value of projected future cash flows during the assessment periodNPV = ∑ (CLt − COt) × (1 + i)−tCIt and COt are the cash inflow and outflow in year t ($)
t is the economic life of the project (years)
i is the discount rate (%)
Positive NPV indicates a profitable project
Internal rate of return (IRR)Discounted cash flow criterion that estimates the return of potential investmentsComputed by a built-in function in Microsoft Excel given the annual cash flows-IRR greater than the discount rate implies a profitable project
Payback period (PP)Time required to recover initial expensesDetermined from a curve (cumulative NPV over the lifespan of the project)Intersection between the curve and the zero NPV line indicates the value of PPPP less than the design period indicates a profitable project
Profitability index (PI)Describes the relation between initial expenses and benefits of a projectPI = [PVP − ∑ [(OPEXt + Lt)/(1 + i)t]/CAPEX]PVP is the present value of cash inflow ($)
OPEXt is the operation and maintenance cost in year t
i is the discount rate (%)
t is the economic life of the project (years)
Lt is the total cost of landfilling in year t
CAPEX is the initial investment cost
PI indicates the profitability of the project based on the initial investments only
Levelized cost of electricity (LCOE)Minimum electricity generation requirement to recover cost and reach a breakeven point for a projectLCOE = [CAPEX + ∑ [(OPEXt + Lt)/(1 + i)t]/(Et/(1 + i)t)]CAPEX is the initial investment cost
OPEXt is the operation and maintenance cost in year t
Lt is the total cost of landfilling in year t
t is the economic life of the project (years)
Et is the amount of electricity generated in year t (MWh)
i is the discount rate (%)
LCOE less than the electricity tariff indicates a profitable project
Table 3. Input economic parameters and assumptions of the study area.
Parameter *IncinerationAnaerobic Digestion (AD)GasificationMechanical Biological Treatment (MBT)
CAPEX ($/ton)550300500450
OPEX (% of CAPEX)105.5128
* Economic parameters were obtained from [9,34,53,54].
Table 4. Summary of economic and environmental indicators for the proposed strategies.
StrategyCarbon Footprint (Ggco2-Eq)NPV ($ Million)IRR (%)PIPP (Year)LCOE ($/Kwh)EI
Incineration14,23024881.16170.1340.46
AD45393371.12250.1200.99
Gasification992236491.44160.1080.19
MBT444228491.35170.1410.11
Table 5. Comparative environmental and financial assessment of the proposed reforms.
StrategyReformCarbon Footprint (GgCO2-eq)NPV
($ Million)
IRR (%)PIPP (year)LCOE ($/kWh)EI
IncinerationNo reform14,23024881.16170.1340.46
Reform 1: Recycling incentive program12,90915071.15200.1410.6
ADNo reform45393371.12250.1200.99
Reform 2: Less stringent bylaws on digestate usage382027091.89190.1310.12
Reform 3: Increased food waste source separation444512581.16210.1090.25
GasificationNo reform992236491.44160.1080.19
Reform 3: Increased food waste source separation9436455101.54150.1030.15
MBTNo reform444228491.35170.1410.11
Publisher’s Note: MDPI stays neutral with regard to jurisdictional claims in published maps and institutional affiliations.

