Abstract
Much attention is being paid to the short-term supply security of raw materials for the energy transition. However, little attention is being paid to the impact of the energy transition on the long-term availability of a number of specific mineral resources that are needed for the realization of a fossil-free energy infrastructure. The aim of this paper is to examine whether the quantity of raw materials required for the energy transition could encounter limits of geological availability of mineral resources, especially in the case that energy supply and consumption are equitably distributed over all countries of the world in the long term. This study is an ex ante evaluation. The result of the evaluation is that four metals are relatively problematic: cobalt, copper, lithium, and nickel. The in-use stocks of these four metals in energy transition-related technologies may take up between 20% and 30% of the ultimately available resources of these metals in the continental Earth’s crust. Even with an 80% end-of-life recycling rate, the increase in the annual use of primary resources is estimated to be 9% for copper, 29% for nickel, 52% for cobalt, and 86% for lithium, compared to the estimated annual use of these metals without an energy transition. The conclusion of the study is that the question of whether energy equity and the energy transition are a compatible combination cannot be answered unambiguously. After all, it will depend on the extent and the speed with which cobalt, copper, lithium, and nickel can be substituted with other, geologically less scarce metals, and on the achieved end-of-life recycling rates of these metals, not only from energy transition-related products, but also from all other products in which these metals are applied. The novelty of the study is that the availability of raw materials for the energy transition is analyzed from a perspective of global equity at the expected level of the European Union in 2050.
1. Introduction
Much research has been carried out into the long-term availability of raw materials in a world with continued economic growth, although without specifically taking the extra material needs for the energy transition into account. Henckens provides an extensive overview of the different (including opposite) approaches for estimating the quantity of available mineral resources [1]. Bardi, Mudd et al., and Prior et al. emphasize the environmental limits of the future mining of resources [2,3,4]. It is not the pure amount of minerals available in the Earth’s crust that limits the exploitation of resources, but the (external) costs for the mitigation of the impacts of mining of the resources on the surrounding environment and the global climate. Calvo et al., Ragnarsdottir et al., and Sverdrup et al. used Hubbert’s peak approach for estimating the ultimately available amount of mineral resources, whereas, with the same goal, Rankin extrapolated the results of an extensive assessment of the US Geological Service of the undiscovered deposits of gold, silver, copper, zinc, and lead in the USA to a global scale [5,6,7,8,9,10,11]. Tilton states that it is impossible to provide predictions on the ultimately available amount of mineral resources [12,13]. He states that the available amount of resources in the Earth’s crust is very large, though increasingly more difficult to access, and that the available amount of a resource depends on what consumers are prepared to pay for that resource. UNEP’s International Resource Panel on Sustainable Resource Management bases itself on the average concentration of a mineral resource in the Earth’s crust to provide an estimate of the upper limit of the extractable global resources [14]. Ali et al., Bleischwitz et al., Tilton et al., and Nickless emphasize the necessity of international policy planning in view of mineral resources that will be increasingly more difficult and costly to exploit because of ever lower concentrations and ever higher impacts on the environment and the global climate [15,16,17,18]. Christmann advocates for the decoupling of economic growth and the use of resources in view of the very large economic growth to be expected in the decades to come [19].
In the interest of a smooth energy transition, much attention is also being paid to the short-term supply security of raw materials for the energy transition. Watari et al., Viehbahn et al., Valero et al., Nate et al., Moss et al., Giurco et al., Deetman et al., DeWit, Calvo and Valero, Bucholz and Brandenburg, Beylot et al., Kleijn, De Koning et al., Grandell et al., and the World Bank Group analyzed the material requests of the energy transition [20,21,22,23,24,25,26,27,28,29,30,31,32,33,34,35,36,37,38]. Söderman et al., Simon et al., Ortego et al., Iglesias-Émbil et al., Cullbrand and Magnusson, and Deng et al. specifically analyzed the material requests of battery electric vehicles; Candelise et al. specifically investigated the material requirements of wind energy [39,40,41,42,43,44,45,46].
As a result, therefore, too little attention is perhaps being paid to the specific impact of the energy transition on the long-term availability of a number of specific mineral resources that are needed for the realization of a fossil-free energy infrastructure. No literature could be found in this respect. With this in mind, the aim of this paper is to examine whether the quantity of raw materials required for the energy transition could encounter limits of the geological availability of mineral resources, especially in the case that energy supply and consumption are equitably distributed over all countries of the world in the long term. Section 2 includes the methodology of the analysis and Section 3 describes the EQUITY scenario. In Section 4, an analysis is made of the resource requirements of the various energy transition technologies that are relevant in the context of the EQUITY scenario: solar PV, wind, electric vehicles, electricity networks, and battery storage. The other main energy technologies, such as nuclear, hydro, and geothermal, are assumed to have relatively small additional raw material requirements compared to solar PV, wind, electric vehicles, electricity networks, and battery storage. Section 4 also provides an overview of the in-use stocks of metals in the energy infrastructure and of the annual raw material requirements after the completion of the EQUITY scenario. In Section 5, I discuss the geological availability, recyclability, and substitutability of four metals that are important to the energy transition. Section 6 provides an analysis of the sensitivity of the results of this study for the assumptions made. In Section 7, I draw conclusions.
2. Methodology
The study is an ex ante evaluation of the effects of the energy transition on the future availability of raw materials in a situation of global equity. Ex ante evaluations are based on assumptions about future developments, i.e., forecasts and prospects, assuming a certain baseline.
As a baseline I use the Net Zero Emissions by 2050 scenario from the International Energy Agency (IEA), which is described in two recent reports, both from 2021: (1) Net zero by 2050—A roadmap for the global energy sector, and (2) World Energy Outlook 2021 [47,48]. The main data on which I have based my evaluation are the word population and the population in different parts of the world in 2020 and 2050, the total energy supply per capita in different parts of the world in 2020 and 2050, and the energy mix in 2020 and 2050 (in the NZE scenario). The 2050 figures are from the mentioned IEA reports.
With respect to the extrapolation to the situation after the completion of the energy transition, I have based myself on the population prospects of UN DESA (medium variant) [49]. My main assumptions in that framework are that carbon-based fuels (including biomass) will not be used anymore after the completion of the energy transition and that hydro and nuclear will keep the same share of the total energy supply as in 2020. Regarding equity, I have assumed that the future world population has become as wealthy as the EU population in 2050 (as assumed by the IEA). Regarding the material intensity of clean energy technologies, I have used another recent report of the IEA, also published in 2021: The role of critical minerals in clean energy transitions. In this framework I have focused on solar PV, wind, battery electric vehicles, battery storage, and electricity networks. Where data are missing, they are supplemented from other sources. This results in two estimates: of the eventual in-use stock of the energy metals and of the annual use of the relevant metals for the previously mentioned energy technologies. This data will be compared with the ultimately available resources of the metals and with the predicted annual use of these metals without an energy transition. With regard to the ultimately available resources, I have based myself on own research [1].
An ex ante evaluation requires special attention for two issues: the degree of (un)certainty of each assumption and the sensitivity of the results of the study to each of the assumptions. These issues are treated in a separate section.
3. The EQUITY Scenario
In line with the Brundtland definition of sustainable development, a sustainable energy transition not only results in an end to the use of fossil fuels for our energy supply, but also achieves a fair distribution of energy supply and consumption among the countries of the world [50]. There are currently substantial differences between countries in terms of energy supply per capita, as demonstrated by the International Energy Agency in the World Energy Outlook 2021 [48]. However, although in the IEA Sustainable Development Scenario (SDS) energy will be used more efficiently in 2050 than in 2020, inequality—for instance between Africa and North America—will not decrease, but the prospected energy supply per capita in Africa in 2050 will remain about a factor of seven lower than that in North America in 2050.
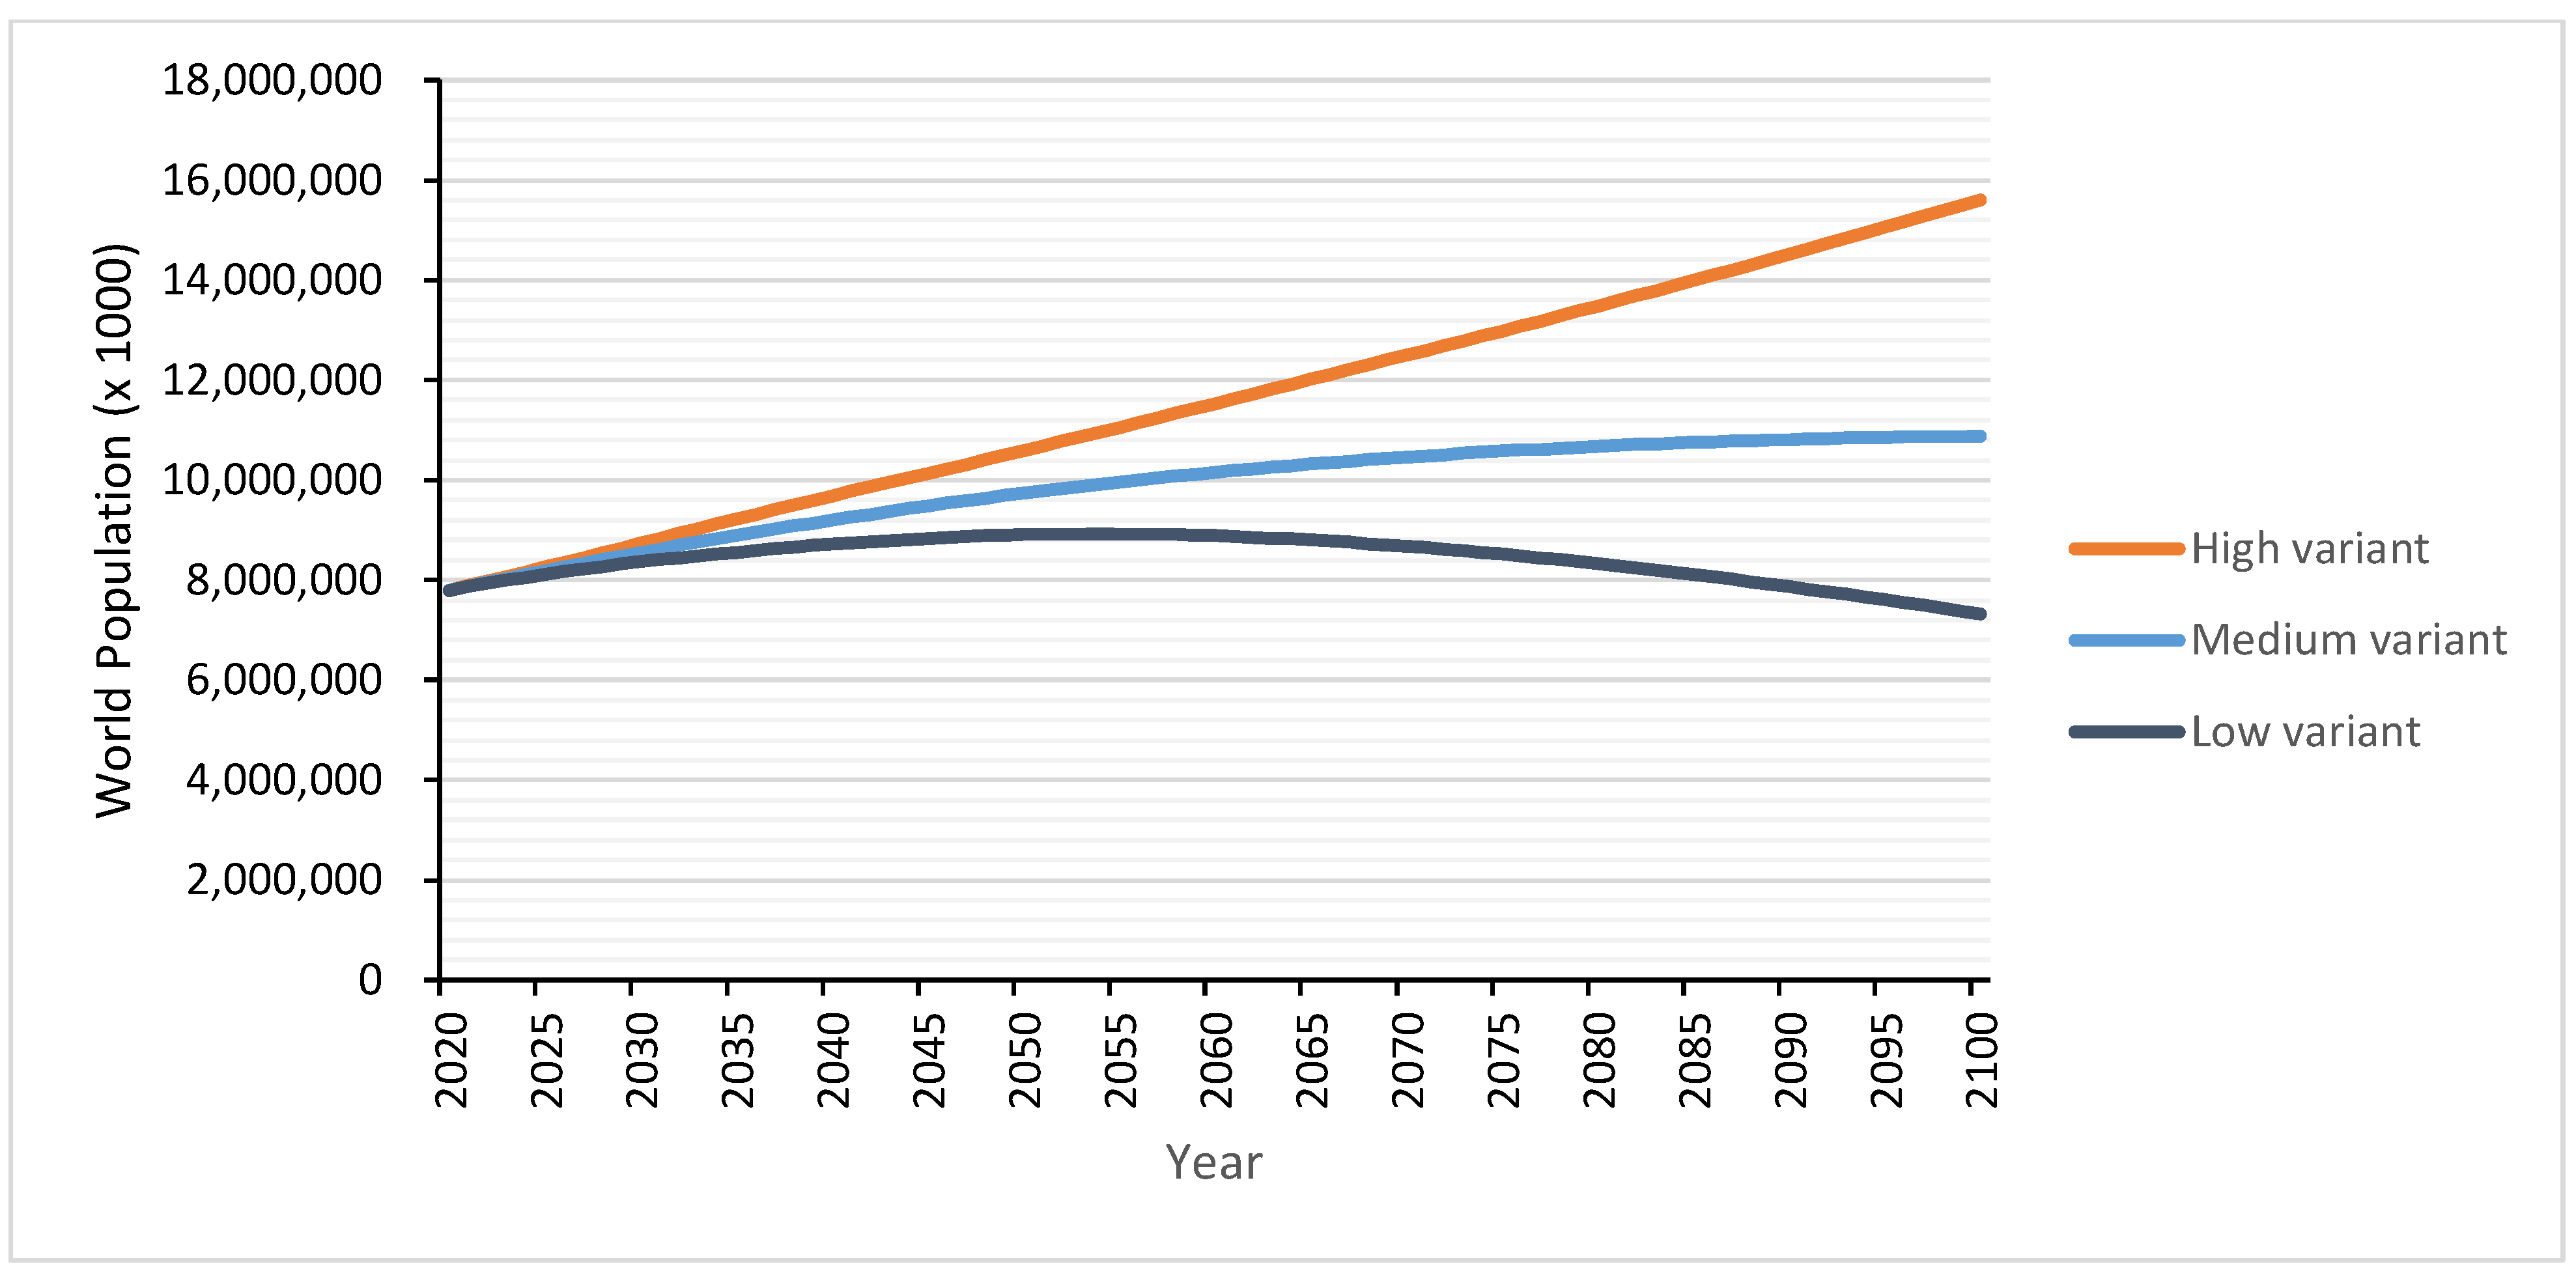
The EQUITY scenario is a scenario with zero CO2 emissions, a global population of 11 billion people, and energy equity between countries. In this context, “equity” means a situation in which the energy consumption per capita worldwide is equitably distributed, that is to say that every country has the same energy consumption level as the predicted average energy consumption level of the countries of the European Union in 2050. Although this situation is a long way off, we must not neglect the poorer countries in Africa and in other parts of the world when considering whether there are sufficient raw materials for the energy transition. The choice of a population of 11 billion is based on the medium variant of UN DESA [49] (see Figure 1).
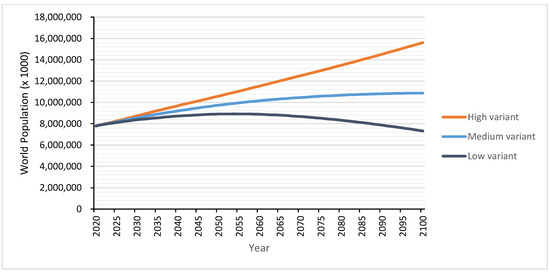
Figure 1.
World population prospects (UN DESA) [49].
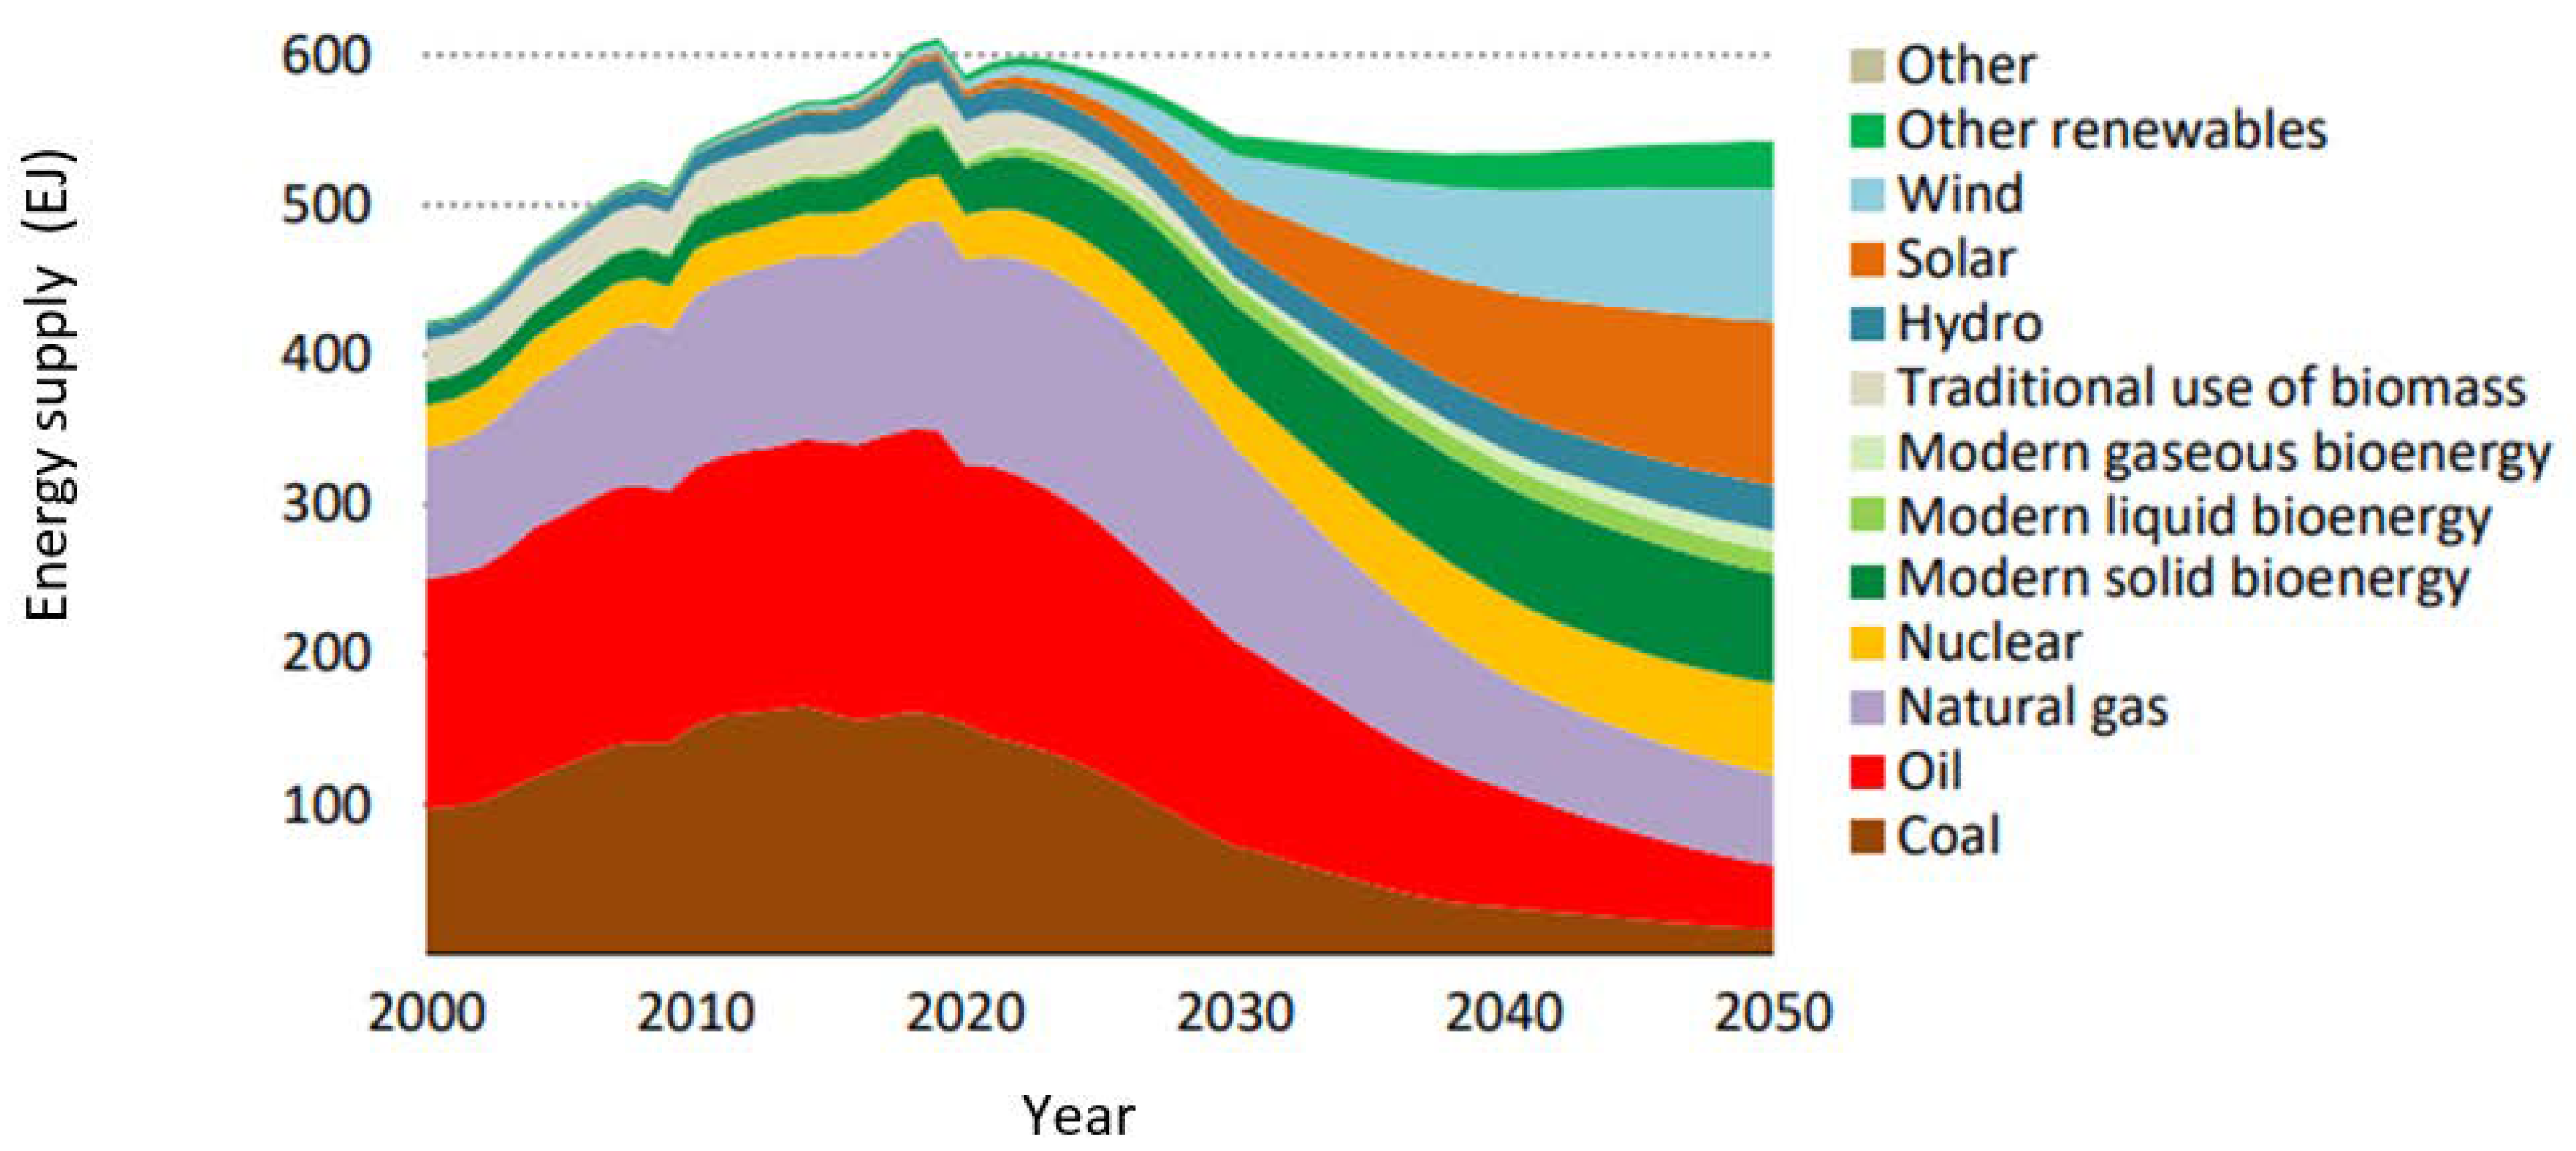
In its World Energy Outlook 2021, the International Energy Agency describes various scenarios up to 2050. For extrapolation after 2050 for the purpose of the EQUITY scenario, the net zero emissions (NZE) by 2050 scenario is used as a starting point for the relative contributions of the different energy sources to the energy supply (see Figure 2) [48]. However, carbon-based fuels (biomass, bioenergy, natural gas, oil, coal) are not included in the extrapolation to the EQUITY scenario, since the assumption is made that carbon-based fuels will not be used for energy purposes after the completion of the EQUITY scenario.

Figure 2.
Contribution of different energy sources to the total energy supply (energy mix) between 2000 and 2050 in a net zero emission scenario. The figure is derived from a report by the International Energy Agency [47] (p. 57). Table 1 shows the figures for 2050.
As can be seen in Figure 2, energy will be used considerably more efficiently under the NZE scenario in 2050 compared to 2020. Despite an approximately 25% larger world population, the total energy supply in 2050 will, according to the NZE scenario, be approximately 10% lower than in 2020. Note that oil, gas, and coal are included in the NZE scenario, even though the net CO2 emission is zero. The background is that (i) fossil fuels are used outside the energy sector, for example to produce chemicals; (ii) carbon capture, utilization, and storage (CCUS) is used to capture and store the CO2 produced from biomass or fossil fuels; and (iii) fossil fuels are used in sectors that will probably still find it difficult to operate without fossil fuels in the short term, such as aviation (the “unabated” use of fossil fuels). The NZE scenario of the IEA assumes that the CO2 emissions from these sectors are fully offset by BECCS (bioenergy equipped with CCUS) and DACCS (direct air carbon capture with storage). Both technologies remove CO2 from the air: the first via trees and plants, and the second directly from the air. The captured CO2 is then stored in the ground.
It is supposed that there will be insufficient time between 2020 and 2050 to achieve the net zero CO2 emissions target unless a certain quantity of carbon-based fuels is used and the CO2 emissions captured and stored using CCUS and/or DACCS. However, this is not an issue in the long term, as the NZE scenario represents an intermediate phase that is necessary to reduce net CO2 emissions to zero as quickly as possible.
A large-scale use of biomass in the long term does not seem to be sustainable, because the production of biomass for bioenergy generation requires a lot of land, in the order of 1 Gha per 100 EJ (Reilly and Paltsev, 2008). As the total energy supply in the NZE scenario is 543 EJ in 2050 and bioenergy is estimated to make up 20% of the energy supply, 0.2 × 5.43 = 1.1 Gha of land would be needed. According to Reilly and Paltsev, the global cropland area was 1.6 Gha at the turn of the century. Therefore, if energy is not to be produced at the expense of the food supply, such biomass production will require an enormous clearing of existing forests and their replacement with production forests or energy crops [51].
This does not seem a realistic scenario; not as an intermediate step, and not as the final situation. The assumption is therefore that, once the energy transition has been completed, biomass will no longer be used and will have been completely replaced by solar and wind, with the production of hydrogen or other non-carbon energy carriers such as ammonia becoming increasingly important to adequately absorb the peaks and troughs of energy production by solar PV and wind turbines.
Aircraft, trucks, and ships will also eventually have to switch to electric propulsion, hydrogen, or other non-carbon energy carriers. Ultimately, therefore, these modes of transport will also use the energy generated by the remaining energy sources in the EQUITY scenario: solar, wind, other renewables, hydro, and nuclear. Hence, the contributions of the other energy sources in the NZE scenario in 2050 are divided proportionally over solar and wind, and the contribution of hydro, other renewables, and nuclear is assumed to remain the same in the EQUITY scenario: 6%, 6%, and 11%, respectively. Oil, which is used for non-energy purposes, is not taken into account in this paper. Based on this, the distribution of energy sources in the EQUITY scenario as presented in Table 1 is achieved.

Table 1.
Shares of renewables and other energy sources in the energy supply in the NZE scenario in 2050 and in the EQUITY scenario [47].
Table 1.
Shares of renewables and other energy sources in the energy supply in the NZE scenario in 2050 and in the EQUITY scenario [47].
| Share of Energy Source in the NZE Scenario 2050 (%) [48] | Share of Energy Source in the EQUITY Scenario (%) | |
|---|---|---|
| Total energy supply | 100 | 100 |
| Renewables | 67 | 89 |
| Solar | 20 | 42 |
| Wind | 16 | 34 |
| Hydro | 6 | 6 |
| Modern solid bioenergy | 14 | |
| Modern liquid bioenergy | 3 | |
| Modern gaseous bioenergy | 3 | |
| Other renewables | 6 | 6 |
| Nuclear | 11 | 11 |
| Unabated natural gas | 3 | |
| Natural gas with CCUS | 8 | |
| Oil | 8 | |
| of which non-energy use | 5 | |
| Unabated coal | 1 | |
| Coal with CCUS | 3 |
4. Metal Use for Energy Transition in the EQUITY Scenario
4.1. Introduction
This paper focuses on the additional use of raw materials required for the energy transition compared to a situation in which no energy transition takes place. In that framework, this paper is limited to considering the use of raw materials for solar panels, wind turbines, electric vehicles, electricity networks, and battery storage, because of the specific metals used in these technologies. The resource use of other forms of CO2-free energy (hydro, nuclear, other renewables) is not considered in this paper.
The raw material consumption of clean energy technologies is mostly expressed in kt per GW installed electricity generation capacity. This means that knowledge of the expected installed capacity of solar and wind is important in order to estimate the material requirements. The installed electricity generation capacity in 2050 is assumed to be equal to that assumed in the NZE by the 2050 scenario of the International Energy Agency. Furthermore, the ratio of the total electricity generation per capita in the European Union to the total electricity generation per capita in the world in the Sustainable Development Scenario in 2050 is estimated to be a factor of 1.96 [48] (p. 314) (The geographical distribution data of the energy supply are not available for the NZE scenario. The geographical distribution data of the Sustainable Development Scenario of the IEA were therefore used.). Based on this, the total installed electricity generation capacity of wind and solar PV after the completion of the EQUITY scenario can be estimated (see Table 2). As can be seen in Table 2, the estimated installed electricity generation capacity of solar power is 35,000 GW and the estimated installed capacity of wind power is 20,000 GW, both after the completion of the EQUITY scenario. On the basis of these figures, the material requirements of solar PV and wind power can be determined. The raw material use of batteries in electric vehicles, electricity networks, and battery storage is also estimated, all after the completion of the EQUITY scenario.
Table 2.
Electrical capacity of clean energy technologies in the EQUITY scenario.
4.2. Solar PV
To estimate the metal requirements of solar PV, data are used from a report by Carrara et al. for the European Commission [52]. These data were also the basis for the calculations made by the International Energy Agency in their report The role of critical minerals in clean energy transitions [53].
The general trend is that the material intensity of all types of solar PV is decreasing quickly. Carrara et al. distinguish three scenarios: a low-demand scenario, a medium-demand scenario, and a high-demand scenario [52]. In the low-demand scenario, material demand is as low as reasonably possible, and there is sufficient time for innovations. In the high-demand scenario, material demand is as high as can be expected assuming net zero emissions in 2050, because there is not sufficient time for the development and implementation of innovations. Since the perspective in this paper is the resource requirements after the completion of the EQUITY scenario, the low-demand scenario of Carrara et al. is taken as the point of departure, therefore allowing sufficient time for innovations and resulting in a lower material intensity than in the high-demand scenario [52].
According to Carrara et al., 99% of solar PV will be generated using crystalline silicon (c-Si), 0.5% using cadmium telluride (CdTe), and 0.5 % using copper-indium-gallium-selenide (CIGS) in a low-demand scenario in 2050 [52]. Carrara et al. expect that solar panels on the basis of amorphous silicon will be practically phased out in 2050 [52]. The metal requirements of the three remaining types of solar PV are presented in Table 3.
Table 3.
Metal requirements for solar PV per GW electrical capacity in a low-demand scenario in 2050 [52].
The total installed electrical capacity of solar panels after the completion of the EQUITY scenario is estimated to be approximately 35,000 GW (see Table 2). The above data lead to a total in-use stock of metals in solar panels after the completion of the EQUITY scenario as presented in Table 4. Note that silicon is not included in Table 4. This is because the raw material from which silicon is produced is sand (SiO2), which is abundantly available in the Earth’s crust.
Table 4.
Estimate of the in-use stock of metals in solar PV after completion of the EQUITY scenario (kt), rounded.
4.3. Wind Turbines
The metal intensity of wind turbines is based on data provided by Carrara et al. in their report for the European Commission (see Table 5) [52]. Note that the type of wind turbine used depends on its location: onshore or offshore. According to Carrara et al., approximately 85% of the wind turbine capacity is expected to be onshore and 15% offshore in 2050 [52]. The total electrical capacity of wind turbines after the completion of the EQUITY scenario is estimated to be approximately 20,000 GW (see Table 2). The resulting in-use stock of metals in wind turbines after the completion of the EQUITY scenario is presented in Table 6.
Table 5.
Metal requirement in different types of wind turbines (t/GW), onshore and offshore, according to Carrara et al. [52].
Table 6.
Estimate of the in-use stock of metals in wind turbines after completion of the EQUITY scenario (kt).
4.4. Battery Electric Vehicles
According to the ACEA (Association de Constructeurs Européens d’Automobiles), there were approximately 278 million vehicles on EU roads in 2021. Over 87% of these were passenger cars, 2% were trucks, 10% were vans, and 0.3% were buses [54]. The EU population in 2020 was 451 million people. This results in a motorization rate of about 600 passenger cars and vans per 1000 inhabitants in the EU. The assumption is made that the number of vehicles per 1000 inhabitants in EU countries in 2050 will be approximately the same as in 2021. Extrapolating to 11 billion people worldwide with the same average level of prosperity as estimated in the EU27 countries in 2050, this results in 6.6 billion passenger cars and vans worldwide in the EQUITY scenario. Trucks and buses are assumed to be—at least partly—powered by hydrogen in the future. Because we assume that these 6.6 billion passenger cars and vans will all be electric, it is important to have knowledge of the material composition of the car batteries. However, there is still much uncertainty about the chemical composition of future batteries, as developments are taking place rapidly. Important aspects to be considered for possible applications of batteries are: energy density (kWh/kg), which should be as high as possible; thermal stability, which should be as high as possible; lifetime (number of cycles), which should be as high as possible; cobalt and nickel content in connection with the highest possible supply security and the lowest possible costs; and overall costs, which should be as low as possible.
At this moment, batteries in electric vehicles (EVs) are all based on lithium-ion technology. Two subtypes of lithium-ion batteries are used in EVs (IEA, 2021b): (i) NCA batteries, of which the cathode contains, in addition to lithium, nickel cobalt aluminum oxides; and (ii) NMC batteries, of which the cathode contains, in addition to lithium, nickel manganese cobalt oxides.
Both these subtypes contain cobalt and need a liquid electrolyte for ion transfer. In the framework of the search for higher energy densities and improved safety, developments are moving towards all-solid-state batteries (ASSBs) [53]. According to IEA, these ASSBs are still designed with NMC cathodes, but alternative cathode compositions are being investigated, such as lithium sulfur [53].
This paper uses data from the International Energy Agency regarding the metal intensity of batteries in battery electric vehicles (BEVs), complemented with information from other sources, on the condition that these sources indicate a substantial additional use of specific metals in BEVs compared with internal combustion engine vehicles (ICEVs) (see Table 7) [53].
Table 7.
Estimated metal intensity of BEVs (g/unit).
Most of the metals in Table 7 are found in the car batteries. Copper is a specific case, as it is an essential component of both electromotors and batteries. The rare earth elements (dysprosium, neodymium, praseodymium, terbium, and ytterbium) are also found in electromotors.
In addition to the metals mentioned in Table 7, BEVs also contain large quantities of other metals, such as aluminum, iron, steel, lead, and zinc, in the car body and in the motor. The use of these metals per unit is assumed not to fundamentally change as a result of the energy transition. While their total in-use stock in vehicles will increase due to the increase in the number of vehicles, this increase is considered to be part of the general increase in the use of metals due to increasing global wealth. The use of some metals in vehicles will decrease as a consequence of the energy transition, for instance the use of palladium, platinum, rhodium, and zirconium. These are metals that are used to clean the exhaust gases of ICEVs.
Assuming, therefore, a total number of 6.6 billion BEVs after the completion of the EQUITY scenario, Table 8 provides the global in-use stock of the metals in BEVs named in Table 7. Silicon and graphite are not included, as these can be produced from raw materials that are and will remain abundant.
Table 8.
Estimated global in-use stock of metals in BEVs after completion of the EQUITY scenario.
4.5. Electricity Networks
In the future, electricity production and consumption will increase faster than the total energy supply. This is because the energy supply, especially for heat and transport, is becoming increasingly electrical. In the EQUITY scenario, electricity generation will also become much more decentralized than at present. These two factors have major consequences for the length of electricity networks, both for the transmission and distribution of electricity.
The International Energy Agency estimates that approximately 150 Mt of copper and 210 Mt of aluminum are currently contained in existing electricity networks [53]. Copper, which is a better conductor than aluminum, is mainly used in underground and marine cables, where its greater weight does not play a role. Aluminum is mainly used in overhead lines, due to its lower weight. It is uncertain what the proportions of copper and aluminum will be in the future. Aluminum is also suitable for underground installation, and the choice of copper or aluminum is partly determined by their prices. In this paper, I follow the projections of the IEA for future demand for copper and aluminum [53]. IEA provides figures for the use of copper and aluminum for the expansion and replacement of electricity networks for the years 2020, 2030, and 2040 (see Table 9).
Table 9.
Annual use of copper and aluminum for the expansion and replacement of electricity networks. Projections of the International Energy Agency, Sustainable Development Scenario [53].
According to the IEA, 55% of copper and aluminum use will be for replacing existing networks between 2020 and 2030, decreasing to 30% between 2030 and 2040 [53]. The use of copper and aluminum for replacement will continue to decrease after this because an increasing part of the network will be new. I assume that, between 2040 and 2050, the replacement of existing networks will still account for about 10% of copper and aluminum use. I also assume that the replaced copper and aluminum will be completely recycled. The net consumption of primary copper and aluminum will therefore be lower than the gross consumption of primary plus secondary copper and aluminum. Furthermore, the increase in the in-use stock in the 2040–2050 period is assumed to be the same as the increase in electricity consumption over that period as projected in the Sustainable Development Scenario, which is 1.93% [48]. These figures lead to the in-use stock amounts of copper and aluminum in electricity networks presented in Table 10.
Table 10.
Projections of future in-use stocks of copper and aluminum in electricity networks (Mt).
The approach explained in Section 4.1 is used between 2050 and the completion of the EQUITY scenario. This results in an estimated global in-use stock of 760 Mt for copper and 1200 Mt for aluminum in electricity networks after the completion of the EQUITY scenario.
4.6. Battery Storage
Sufficient energy storage is important to balance fluctuations in the energy supply. There are a number of energy storage options, among which is battery storage. Battery storage is used to buffer short-term surplus electricity production, meaning a time period of minutes to days. As with batteries in BEVs, the future chemistry of battery storage is uncertain. In this paper, I adhere to the prognosis of the International Energy Agency [53] (see Table 11).
Table 11.
Metal intensity of battery storage in the SDS scenario in 2040 (kt/GW). Derived from IEA [53] (pp. 84 and 104).
According to the International Energy Agency, the estimated battery storage capacity in the NZE scenario in 2050 is about 3100 GW [48] (p. 312). Following the approach taken in Section 4, this means that the estimated battery storage capacity will be about 7000 GW after the completion of the EQUITY scenario. This results in the global in-use stock amounts of metals in battery storage presented in Table 12.
Table 12.
Estimated global in-use stock of metals in battery storage after the completion of the EQUITY scenario (kt).
4.7. Total In-Use Stock of Metals after the Completion of the EQUITY Scenario
An overview of the in-use stocks of the metals used in the different energy transition technologies is presented in Table 13. I call these metals the energy transition metals.
Table 13.
In-use stocks of metals after completion of the EQUITY scenario (kt).
The main conclusions are: (i) electric vehicles in particular take up a substantial part of the global in-use stock of raw materials after the completion of the EQUITY scenario; and (ii) electricity networks contribute substantially to the in-use stock of aluminum and copper, at 45% and 43%, respectively.
In Table 14, I compare the global in-use stocks of energy transition metals after the completion of the EQUITY scenario with the ultimately available resources of these metals as provided by Henckens [1]. I distinguish three groups of metals, based on the share of their in-use stocks after the completion of the EQUITY scenario in the ultimately available resources: (i) metals, of which the global in-use stock in the five considered clean energy technologies after the completion of the EQUITY scenario takes up < 1% of the ultimately available resources: aluminum, boron, cadmium, chromium, gallium, indium, iron, manganese, praseodymium, selenium, silver, terbium, and ytterbium; (ii) metals, of which the global in-use stock in the five considered clean energy technologies after completion of the EQUITY scenario takes up 1% to 10% of the ultimately available resources: dysprosium, molybdenum, neodymium, tellurium, vanadium, and zinc; and (iii) metals, of which the global in-use stock in the five considered clean energy technologies after completion of the EQUITY scenario takes up >10% of the ultimately available resources: cobalt, copper, lithium, and nickel. Table 14 shows that from the perspective of the geological availability of raw materials, the energy transition substantially contributes to the depletion of a number of these materials. This especially concerns nickel, copper, lithium, and cobalt.
Table 14.
Share of the ultimately available resources needed for the in-use stock of energy transition metals after completion of the EQUITY scenario.
4.8. Additional Annual Use of Metals due to the Energy Transition
Not only is knowledge of the global in-use stock of metals after the completion of the EQUITY scenario important, but so is information on the net annual use of these metals in the energy sector. The net annual use depends on the lifespans of the various products in which the metals are contained and on the end-of-life recycling rates. Electric vehicles and storage batteries are expected to be replaced every 15 to 20 years, solar panels and wind turbines have an expected lifespan of 20 to 30 years, and the lifespan of electricity networks can be more than 50 years. Each time a product is replaced, the metals in the end-of-life product are recycled to a certain extent, which may be 0%, but never 100%, as every cycle involves losses. These losses will need to be compensated with the mining of primary mineral resources. On average, however, the energy transition concerns specific and relatively large and uniform products, such as batteries, wind turbines, solar panels, and electricity cables. The recyclability of metals from these products may therefore be relatively high.
Table 15 provides estimates of the annual amounts of ten energy transition metals—of which the in-use stock may take up > 1% of the ultimately available resources—in end-of-life products after the completion of the EQUITY scenario, based on the expected lifetimes of the different technologies. The ten metals in Table 15 are used in many applications, not just in the considered energy transition technologies. Therefore, the global use of these metals is expected to increase even without the energy transition, due to increasing global wealth. However, the energy transition will cause an additional increase in the use of these metals, and the question is how much this will be.
Table 15.
Annual amounts of energy transition metals in end-of-life products after completion of the EQUITY scenario.
The EQUITY scenario was defined as 11 billion people enjoying the same energy consumption per capita as the average EU citizen in 2050. Extending this approach to the extraction of mineral resources, this leads to the global annual extraction figures after the completion of the EQUITY scenario as presented in the right column of Table 16.
Table 16.
Assumed extraction of ten metals after completion of the EQUITY scenario, not taking the additional material use of the energy transition into account.
Table 17 shows the required increase in the annual extraction of the ten metals considered due to the energy transition, compared to the situation without an energy transition and depending on their end-of-life recycling rates. The conclusion is that the energy transition will necessitate a relatively large increase in the annual extraction of seven metals, even at a high recycling rate. These are: cobalt, copper, dysprosium, lithium, neodymium, nickel, and vanadium. Some of these metals, in particular copper and nickel, require particular attention due to their geological scarcity. Henckens has provided maximum sustainable extraction rates for the geologically scarcest mineral resources, including these two metals [1].
Table 17.
Increase in annual extraction rates of ten metals due to the energy transition as a share of the supposed extraction without the energy transition.
4.9. Discussion
The observation is made that the list of metals that deserve attention from a long-term point of view in the context of the energy transition differs substantially from the list of critical raw materials produced, for example, by the European Union. The 2020 EU list of critical raw materials consists of the following 30 metals [60]:
| Antimony | Fluorspar | Magnesium | Silicon metal |
| Baryte | Gallium | Natural graphite | Tantalum |
| Bauxite | Germanium | Natural rubber | Titanium |
| Beryllium | Hafnium | Niobium | Vanadium |
| Bismuth | HREEs | PGMs | Tungsten |
| Borates | Indium | Phosphate rock | Strontium |
| Cobalt | Lithium | Phosphorus | |
| Coking coal | LREEs | Scandium |
According to the definition of the EU, a critical raw material is a material of high economic importance that faces supply risks (i.e., geographical and/or geopolitical constraints) and for which there is no actual or commercially viable substitute. It is striking that half of the ten metals that, according to the present paper, give the highest concern from a long-term geological availability perspective do not appear in the EU list of critical raw materials. These are: copper, molybdenum, nickel, tellurium, and zinc, of which copper and nickel are identified as the most critical metals in this paper. The reason for this is that the EU focuses with its list of critical raw materials on the short-term availability of raw materials for the countries of the European Union, whereas the scope of the present paper is the long-term availability of metals for the countries of the world.
5. Four Metals Needing Special Attention in the EQUITY Scenario
5.1. Cobalt
Currently, almost 60% of cobalt applications are in batteries, including lithium-ion batteries in cars and electronics (see Figure 3). According to the Cobalt Institute, battery applications of cobalt are increasing 10% annually, whereas, according to the US Geological Survey, total cobalt applications increased by about 4% annually between 1980 and 2020 [57,61]. In 2020, primary cobalt production was 142,000 tons [57], while the secondary production of cobalt was 10,600 tons, of which about 65% was from battery recycling [61]. That means that cobalt recycling is still at a low level, but this is expected to improve quickly since the application of cobalt in batteries will continue to grow compared to other applications of cobalt from which recycling is more complex.
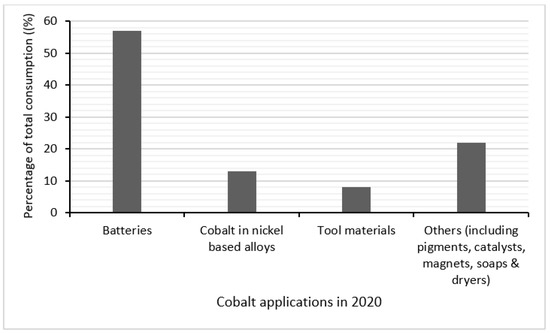
Figure 3.
Cobalt applications in 2020 [61].
The ultimately available cobalt resources are estimated to be somewhere between 200 Mt and 3000 Mt [1]. Based on the IEA prospects for future cobalt use in BEVs and battery storage (see Section 4.4 and Section 4.6), the in-use stock of cobalt for cobalt applications in clean energy technologies after the completion of the EQUITY scenario is estimated at about 39 Mt (see Table 13). The estimate for the annual use of cobalt in the EQUITY scenario without the energy transition is 850 kt (see Table 16). Assuming an 80% end-of-life recycling rate of cobalt from energy transition-related products, the energy transition could add 52% to this amount (see Table 17), after which the global annual use of cobalt would be about 1300 kt. Although these figures are not directly alarming from an exhaustion point of view, they imply that—by way of precaution and considering future generations—cobalt needs to be used as economically as possible. Maximum recycling from end-of-life products and, if possible, the substitution of cobalt with other, less scarce metals is important, especially in batteries, and does not seem impossible given the rapid developments taking place in battery chemistry.
5.2. Copper
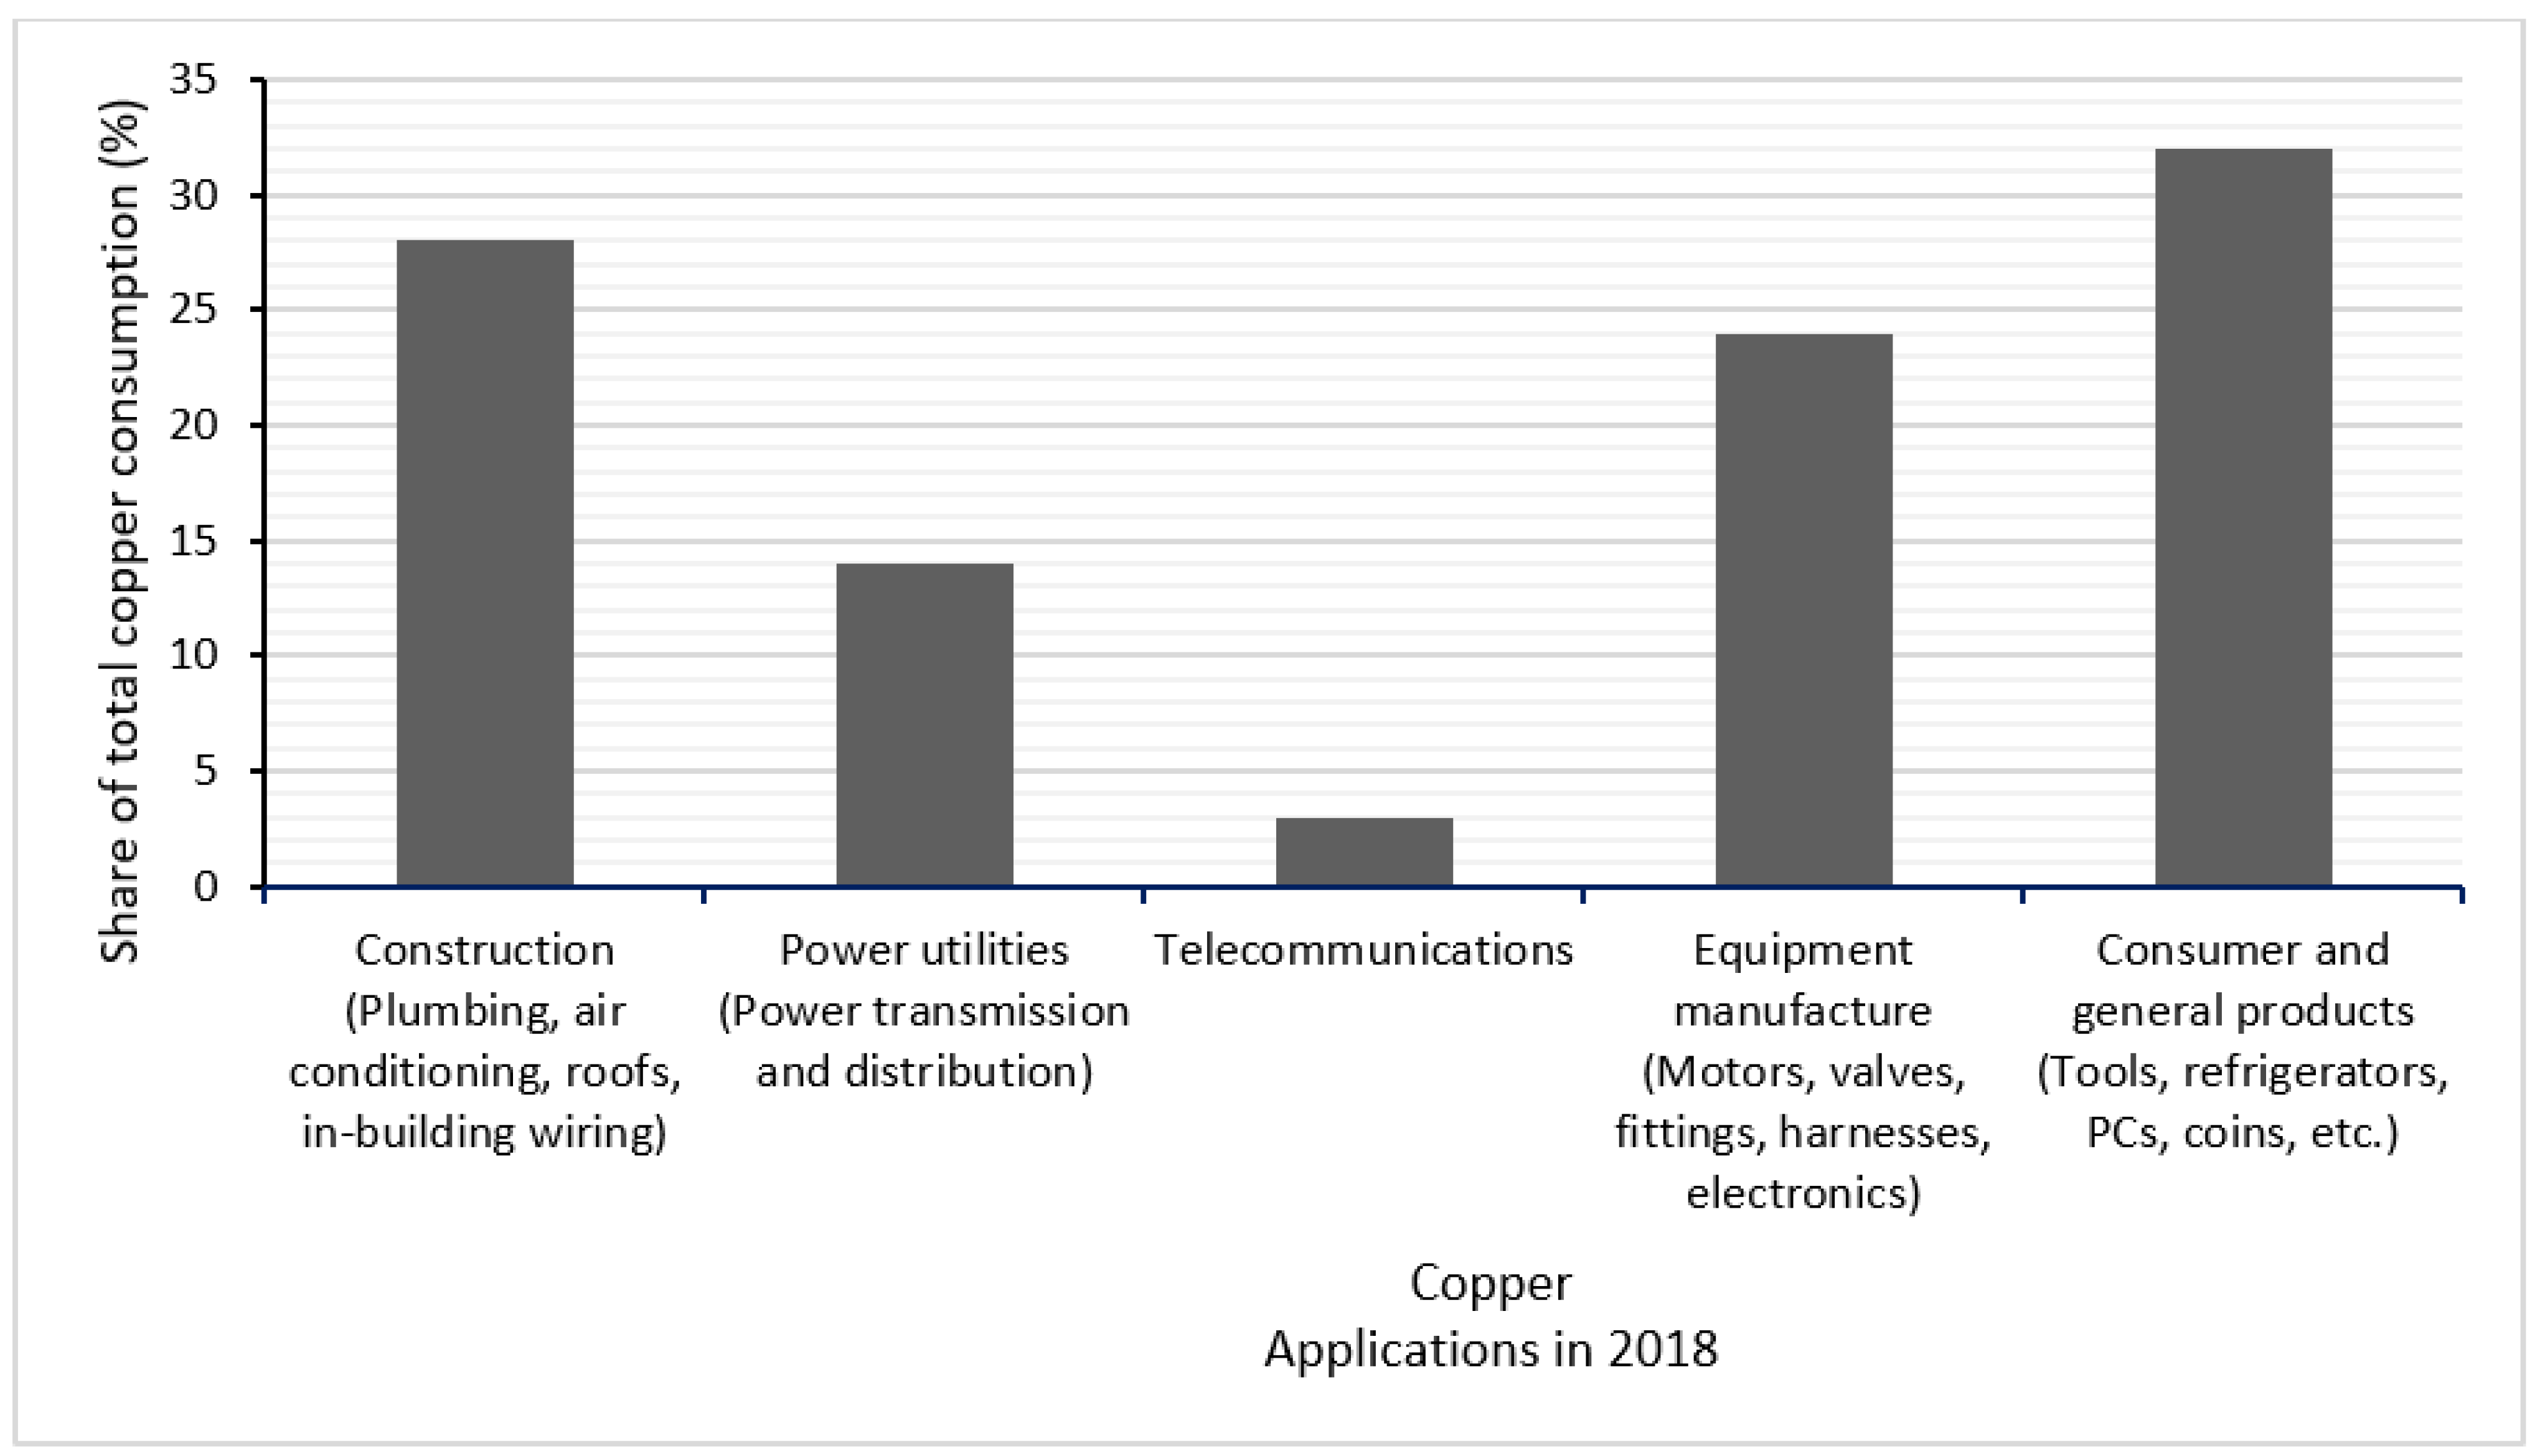
Copper applications in 2018 are presented in Figure 4. Total primary copper production was about 21 Mt in 2020 [57].
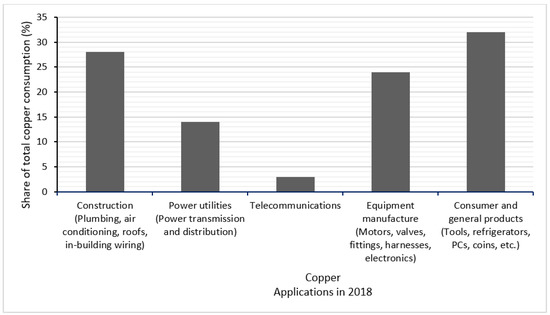
Figure 4.
Copper applications in 2018 [1,62].
The in-use stock of copper in the energy sector after the completion of the EQUITY scenario will be about 1200 Mt, of which 62% will be in electricity networks, 23% in electric vehicles, 11% in solar PV, 3% in wind turbines, and 1% in battery storage (see Table 13). This amount, 1200 Mt, is about 60 times the 2020 global copper production. Although the application of 1200 Mt of copper for the energy transition will be spread out over a long period of 50 to 100 years, it is clear that the energy transition could imply almost a doubling in the demand for copper, which will have a major impact on the availability of copper for future generations. The ultimately available copper resources are estimated to be between 6 and 25 Gt. The annual use of copper after the completion of the EQUITY scenario, without taking the energy transition into account, is 87,000 kt (Table 16). Assuming an 80% end-of-life recycling rate of copper from energy transition-related products, the energy transition would add 9% to this amount after the completion of the EQUITY scenario (see Table 17). Given the relative scarcity of copper, it is therefore important to replace copper as much as possible with other, less scarce metals and to increase the recycling of copper from end-of-life products as much as possible. An important substitution option is to replace copper with aluminum, in particular in transmission and distribution networks, as this is much less scarce than copper. One problem that needs to be solved, however, is the poorer conductivity of aluminum.
The global end-of-life copper recycling rate is currently just 45%. It will not be easy to achieve an overall copper recycling rate of more than 70% from end-of-life copper-containing products in the future, as copper is often used in relatively complex products with many metals, such as motors, refrigerators, tools, and electronic devices [1]. The recycling of copper from electricity transmission and distribution networks is less complex and may therefore be easier.
5.3. Lithium
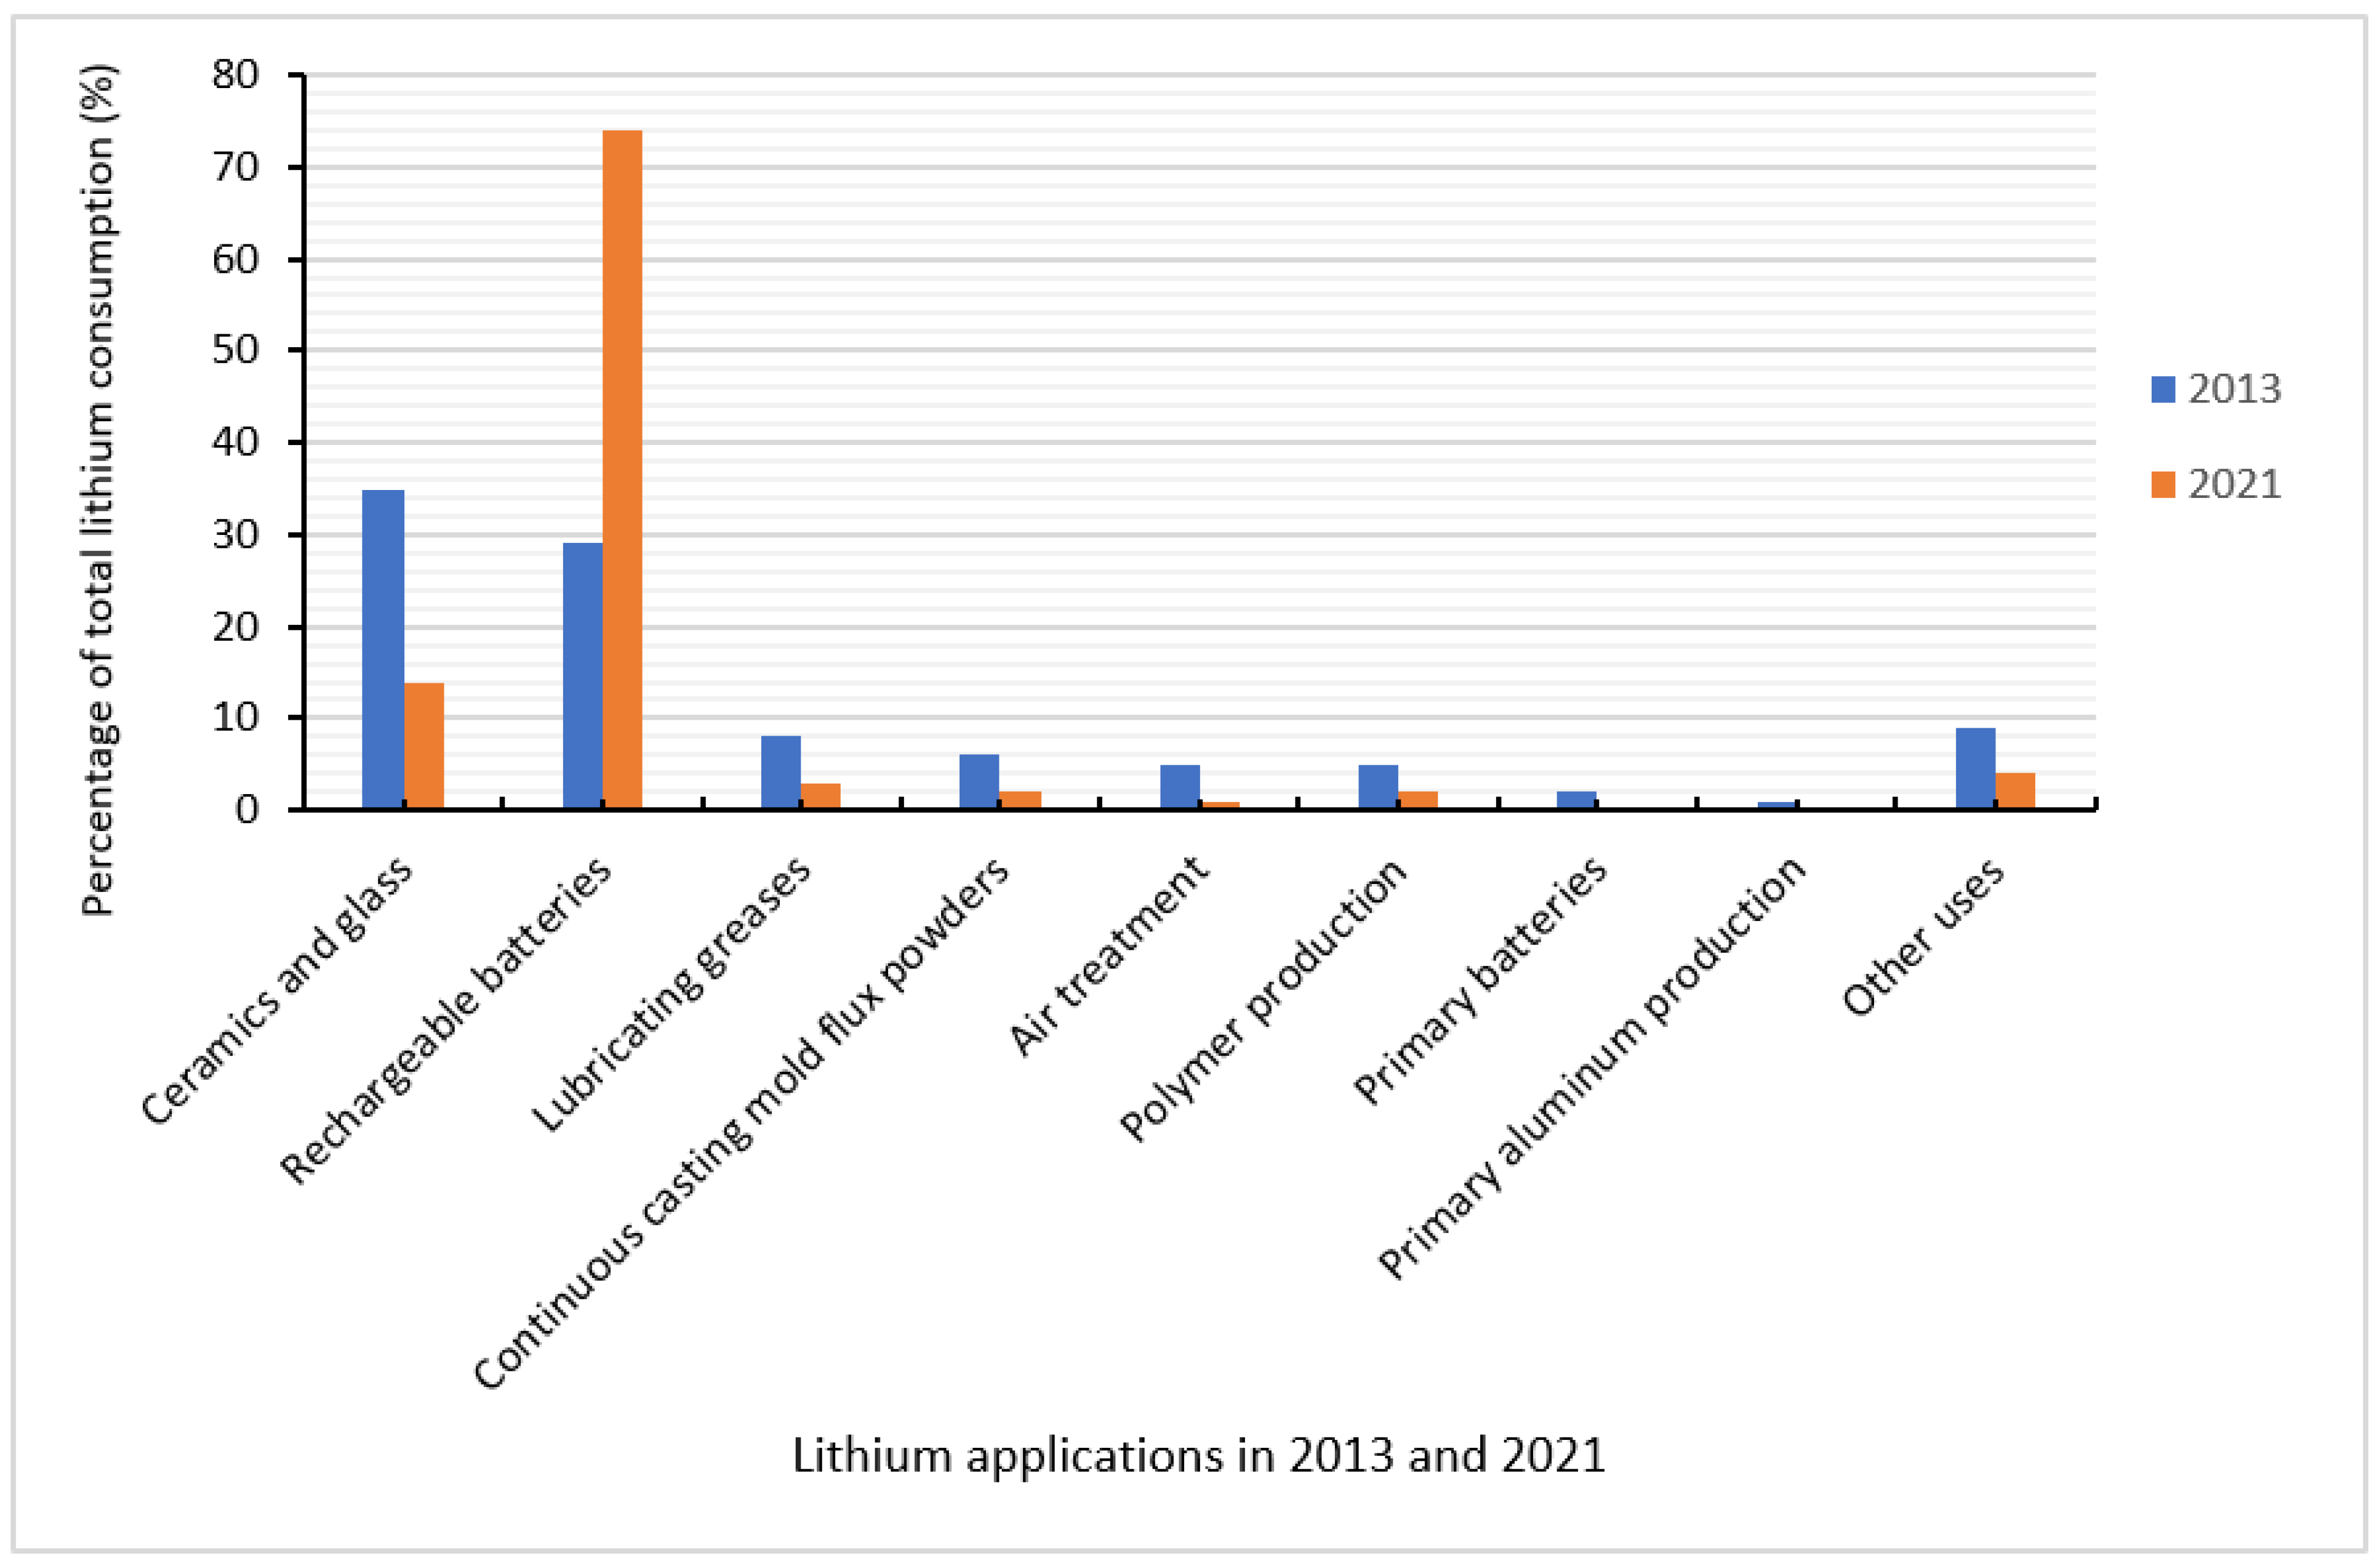
End uses of lithium in 2013 and 2021 are presented in Figure 5, clearly showing how rapidly the application of lithium in rechargeable batteries has increased in recent years. The global extraction of lithium was 34 kt in 2013, 82.5 kt in 2020, and 100 kt in 2021, the two latter figures excluding the US production [57,63].
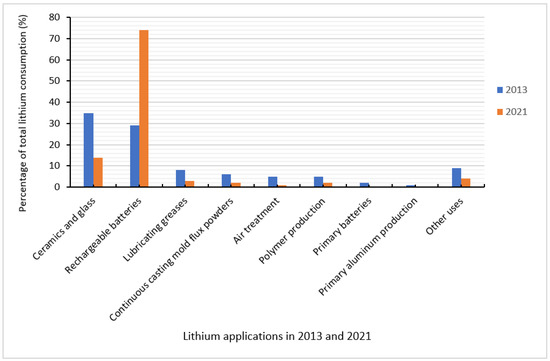
Figure 5.
Lithium applications as a percentage of world consumption in 2013 (blue, left) and 2021 (red, right) [57,63].
The ultimately available resources of lithium in the continental Earth’s crust are estimated to be in the range of 500 to 2000 Mt [1]. Additionally, seawater contains a large amount of lithium, which could, theoretically, be exploited after the exploitable resources in the continental crust are exhausted, though at a considerably higher cost.
The in-use stock of lithium in BEVs and battery storage after the completion of the EQUITY scenario is estimated at about 98 Mt, of which 97% is in BEVs and 3% is in battery storage (see Table 13). The annual use of lithium after the completion of the EQUITY scenario, without taking the energy transition into account, is estimated to be 1300 kt per year (see Table 16). Assuming an 80% end-of-life recycling rate of lithium from energy transition-related products, the energy transition may add 86% to this amount (see Table 17), after which the global annual use of lithium would be about 2400 kt per year. Given the amount of lithium available in the Earth’s crust and in the sea, this is not directly alarming. However, in the interest of future generations, it is important to recycle lithium as much as possible.
5.4. Nickel
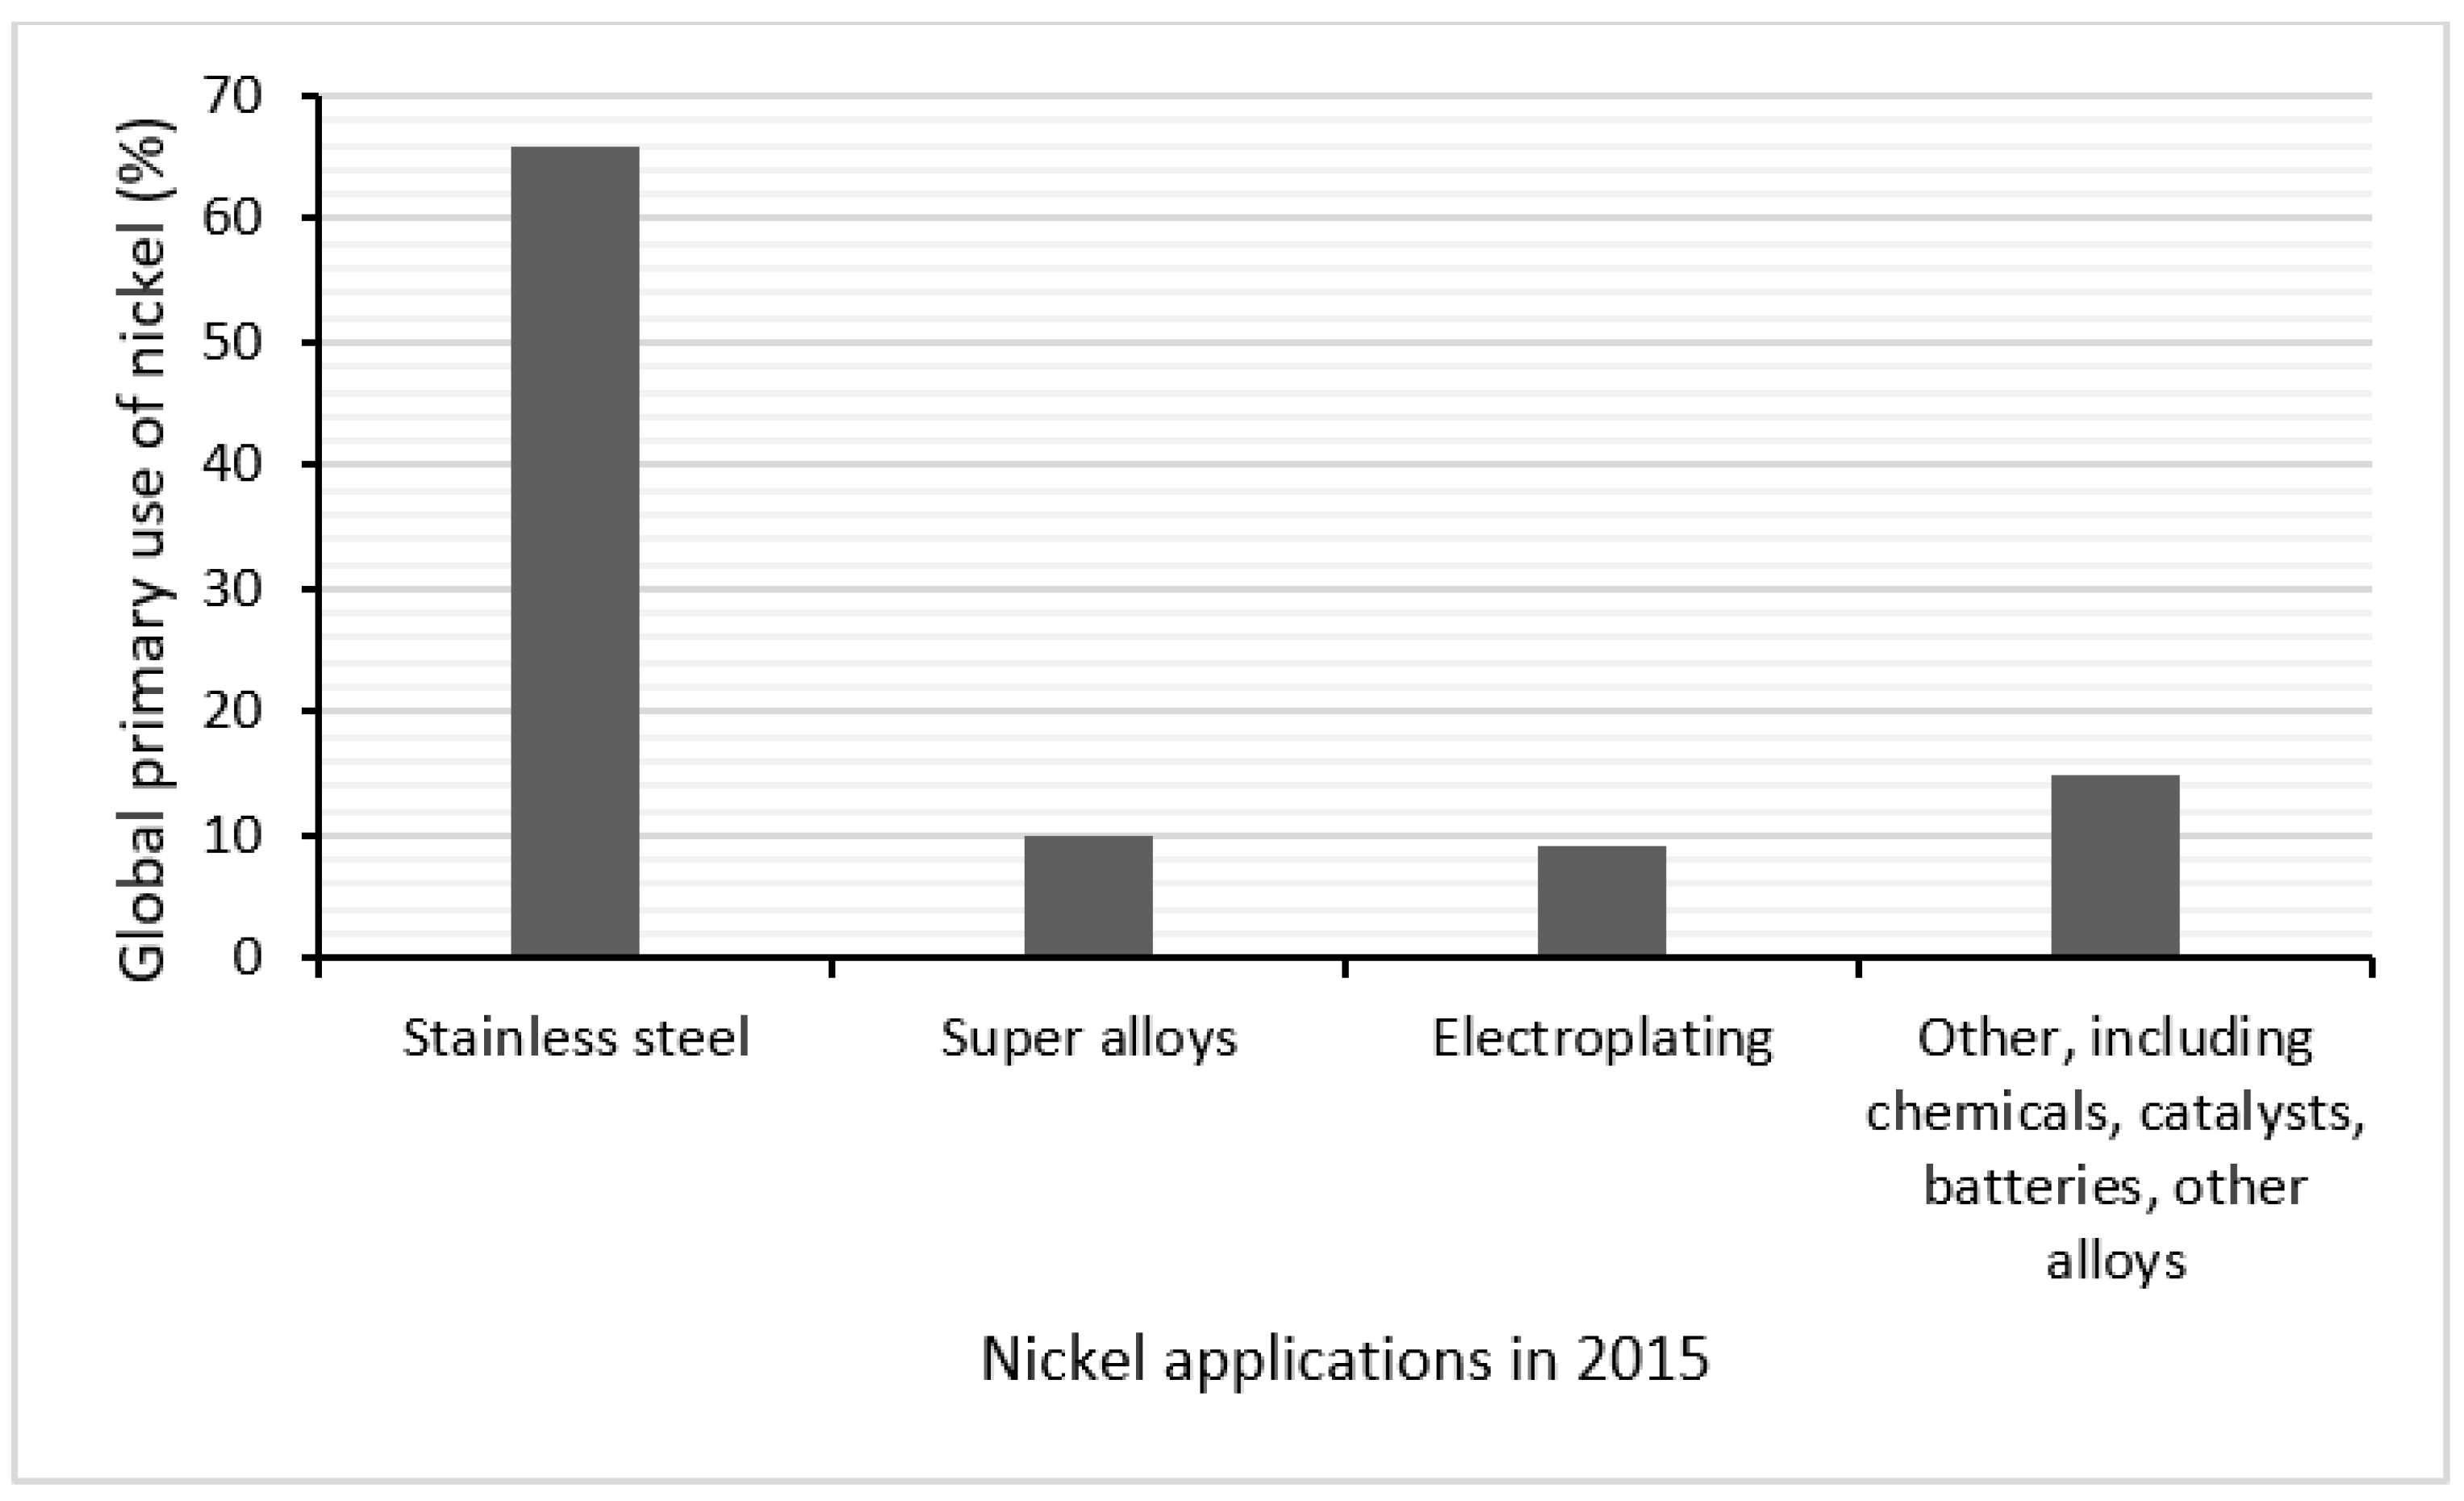
End uses of nickel in 2015 are presented in Figure 6.

Figure 6.
Nickel applications in 2015 [64].
The global in-use stock of nickel in BEVs, wind turbines, and battery storage after the completion of the EQUITY scenario is estimated at about 310 Mt, of which 96.5% is in BEVs, 2.5% in wind turbines, and 1% in battery storage (see Table 13).
According to Henckens, the ultimately available nickel resources are in the range of 1000 to 8000 Mt [1]. The annual use of nickel after the completion of the EQUITY scenario, without taking the energy transition into account, is 12,000 kt (Table 16). Based on an end-of-life nickel recycling rate of 80% from batteries and wind turbines after the completion of the EQUITY scenario, the increase in annual nickel extraction due to the energy transition would be about 29% of this amount. Taking the relative geological scarcity of nickel into account, the conclusion, therefore, is that there is an urgent need to substitute nickel with other materials in car batteries and, where nickel is still used in car batteries, to increase the end-of-life nickel recycling rate as much as possible. Rapid developments are taking place in the chemistry of car batteries. However, the short-term development seems to be from cobalt-rich cathodes to nickel-rich cathodes [53], although nickel-free cathodes (in ASSB batteries) also seem possible in the longer term.
6. Uncertainty and Sensitivity Analyses
This study is an ex ante evaluation of the estimated metal use of the energy transition, assuming that the world average level of wealth is equal to the level of wealth of the average EU citizen in 2050 as predicted by the International Energy Agency. Necessarily, in ex ante evaluations, assumptions need to be made, and the further the evaluation looks ahead, the more uncertain the outcome will be. The main assumptions made in this paper are presented in Table 18.
Table 18.
Overview of the main assumptions in this study.
The chemical composition of batteries in the future is quite uncertain. The technical developments are fast. I have based myself on the data in the respective report of the IEA [53]. Uncertainty of the assumptions regarding the chemical composition of batteries is particularly relevant, because battery electric vehicles take up a substantial share of the material requirements of clean energy technologies (see Table 15). The uncertainty of the assumptions regarding the material requirements of solar, wind, and electricity networks is considered less than the ones regarding battery electric vehicles and battery storage.
The sensitivity of the results of the analysis in this paper to the different assumptions is presented in Table 19.
Table 19.
Sensitivity of the results of the study to the different assumptions made.
The conclusion is that the results are especially sensitive to future changes of the chemistry in batteries in electric vehicles. For the other assumptions made, the results are (approximately) proportional to the assumptions made.
7. Conclusions
The study makes an estimate of the in-use stocks and the annual use of important energy transition metals after the completion of the EQUITY scenario, i.e., a scenario with zero CO2 emissions, a global population of 11 billion people, and energy equity between countries at the expected level of the European Union in 2050.
The calculations made in this paper—which are based on existing knowledge regarding possible developments—clarify that four mineral resources are most relevant from the point of view of their long-term geological availability. These are (in order of importance): nickel, copper, lithium, and cobalt. After the completion of the EQUITY scenario, the in-use stocks of these four metals may take up between 20% and 30% of the ultimately available resources of these metals in the continental Earth’s crust. The additional annual use of primary resources of nickel, copper, lithium, and cobalt due to the energy transition will depend on the end-of-life recycling rates of these metals from solar PV, wind turbines, electric vehicles, electricity networks, and battery storage. With an 80% end-of-life recycling rate, the increase in the annual use of primary resources is estimated to be 9% for copper, 29% for nickel, 52% for cobalt, and 86% for lithium, compared to the annual use of these metals without an energy transition.
The question of whether energy equity and the energy transition are a compatible combination cannot be answered unambiguously. After all, it will depend on the extent and the speed with which cobalt, copper, lithium, and nickel can be substituted with other, geologically less scarce metals, and on the achieved end-of-life recycling rates of these metals, not only from energy transition-related products, but also from all other products in which these metals are applied. However, nickel and copper require the most urgent attention, given their geological scarcity.
Funding
This research received no external funding.
Institutional Review Board Statement
Not applicable.
Informed Consent Statement
Not applicable.
Conflicts of Interest
The author declares no conflict of interest.
References
- Henckens, T. Governance of the World’s Mineral Resources, beyond the Foreseeable Future; Elsevier: Amsterdam, The Netherlands, 2021; ISBN 978-0-12-823886-8. [Google Scholar]
- Bardi, U. 2013, Plundering the Planet; 33rd Report for the Club of Rome; Oekom Verlag GMBH: München, Germany, 2013. [Google Scholar]
- Mudd, G.M.; Jowitt, S.M.; Werner, T.T. The world’s lead-zinc mineral resources: Scarcity, data, issues and opportunities. Ore Geol. Rev. 2017, 80, 1160–1190. [Google Scholar] [CrossRef]
- Prior, T.; Giurco, D.; Mudd, G.; Mason, L.; Behrisch, J. Resource depletion, peak minerals and the implications for sustainable resource management. Glob. Environ. Chang. 2012, 22, 577–587. [Google Scholar] [CrossRef]
- Calvo, G.; Valero, A.; Valero, A. Assessing maximum production peak and resource availability of non-fuel mineral resources: Analyzing the influence of extractable global resources, Resources. Conserv. Recycl. 2017, 125, 208–217. [Google Scholar] [CrossRef]
- Ragnarsdottir, K.V.; Sverdrup, H.U.; Koca, D. Assessing long term sustainability of global supply of natural resources and materials. In Sustainable Development—Energy, Engineering and Technologies—Manufacturing and Environment; IntechOpen: London, UK, 2012; pp. 83–116. [Google Scholar]
- Sverdrup, H.U. Modelling global extraction, supply, price and depletion of the extractable geological resources with the lithium model. Resour. Conserv. Recycl. 2016, 114, 112–129. [Google Scholar] [CrossRef]
- Sverdrup, H.U.; Ragnarsdottir, K.V.; Koca, D. An assessment of metal supply sustainability as an input to policy: Security of supply extraction rates, stocks-in-use, recycling, and risk of scarcity. J. Clean. Prod. 2017, 140, 359–372. [Google Scholar] [CrossRef]
- Hubbert, M.K. The energy resources of the earth. Sci. Am. 1971, 225, 60–73. [Google Scholar] [CrossRef]
- Rankin, W.J. Minerals, Metals and Sustainability, Meeting Future Material Needs; CRC Press: Boca Raton, FL, USA, 2011. [Google Scholar]
- US Geological Survey. 1998 Assessment of undiscovered deposits of gold, silver, copper, lead and zinc in the United States; Circular 1178; US Geological Survey: Reston, VA, USA, 2000.
- Tilton, J.E. Depletion and the Long-Run Availability of Mineral Commodities. In Proceedings of the Workshop on the Long-Run Availability of Mineral Resources Sponsored by the Mining, Minerals and Sustainable Development Project and Resources for the Future, Washington, DC, USA, 22–23 April 2001. [Google Scholar]
- Tilton, J.E. On borrowed time? Assessing the threat of mineral depletion. Miner. Energy. Raw Mater. Rep. 2003, 18, 33–34. [Google Scholar] [CrossRef]
- UNEP. International Resource Panel on Sustainable Resource Management, Estimating Long-Run Geological Stocks of Metals; Working Group on Geological Stocks of Metals, Working Paper; UNEP: Nairobi, Kenya, 6 April 2011. [Google Scholar]
- Ali, S.H.; Giurco, D.; Arndt, N.; Nickless, E.; Brown, G.; Demetriades, A.; Durrheim, R.; Enriquez, M.A.; Kinnaird, J.; Littleboy, A.; et al. Mineral supply for sustainable development requires resource governance. Nature 2017, 543, 367–372. [Google Scholar] [CrossRef]
- Bleischwitz, R.; Welfens, P.J.; Zhang, Z. Sustainable Growth and Resource Productivity: Economic and Global Policy Issue; Greenleaf Publishing Limited: Sheffield, UK, 2009. [Google Scholar]
- Tilton, J.E.; Crowson, P.C.F.; DeYoung, J.H., Jr.; Eggert, R.G.; Ericsson, M.; Guzmán, J.I.; Hunphreys, D.; Lagos, G.; Maxwell, P.; Radetzki, M.; et al. Public policy and future mineral supplies. Resour. Policy 2018, 57, 55–60. [Google Scholar] [CrossRef]
- Nickless, E. Resourcing future generations: A contribution by the Earth Science Community. Nat. Resour. Res. 2017, 27, 143–158. [Google Scholar] [CrossRef]
- Christmann, P. Towards a more equitable use of mineral resources. Nat. Resour. Res. 2017, 27, 159–177. [Google Scholar] [CrossRef]
- Watari, T.; McLellan, B.C.; Giurco, D.; Dominish, E.; Yamamsue, E.; Nansai, K. Total material requirement for the global energy transition to 2050: A focus on transport and electricity. Resour. Conserv. Recycl. 2019, 148, 91–103. [Google Scholar] [CrossRef]
- Viebahn, P.; Soukup, O.; Samadi, S.; Teubler, J.; Wiesen, K.; Ritthoff, M. Assessing the need for critical minerals to shift the German energy system towards a high proportion of renewables. Renew. Sustain. Energy Rev. 2015, 49, 655–671. [Google Scholar] [CrossRef] [Green Version]
- Valero, A.; Valero, A. Thermodynamic rarity and recyclability of raw materials in the energy transition: The need for an in-spiral economy. Entropy 2019, 21, 873. [Google Scholar] [CrossRef] [Green Version]
- Valero, A.; Valero, A.; Calvo, G.; Ortego, A. Material bottlenecks in the future development of green technologies. Renew. Sustain. Energy Rev. 2018, 93, 178–200. [Google Scholar] [CrossRef]
- Valero, A.; Valero, A.; Calvo, G.; Ortego, A.; Ascaso, S. Global material requirements for the energy transition. An exergy flow analysis of decarbonization pathways. Energy 2018, 159, 1175–1184. [Google Scholar] [CrossRef]
- Nate, S.; Bilan, Y.; Kurylo, M.; Lyashenko, O.; Napieralski, P.; Kharlamova, G. Mineral policy within the framework of limited critical resources and green energy transition. Energies 2021, 14, 2688. [Google Scholar] [CrossRef]
- Moss, R.L.; Tzimas, E.; Willis, P.; Arendorf, J.; Thompson, P.; Chapman, A.; Morley, N.; Sims, E.; Bryson, R.; Pearson, J.; et al. Critical Metals in the Path towards the Decarbonization of the EU Energy Sector; European Commission JRC: Petten, The Netherlands, 2013. [Google Scholar]
- Moss, R.L.; Tzimas, E.; Kara, H.; Willis, P.; Kooroshy, J. The potential risks from metals bottlenecks to the deployment of strategic energy technologies. Energy Policy 2013, 55, 556–564. [Google Scholar] [CrossRef]
- Giurco, D.; Dominish, E.; Florin, N.; Watari, T.; McLellan, B. Requirements for minerals and metals for 100% renewable scenarios. In Achieving the Paris Climate Agreement Goals; Teske, S., Ed.; Springer: Cham, Switzerland, 2019; Chapter 11. [Google Scholar] [CrossRef] [Green Version]
- Deetman, S.; Pauliuk, S.; Van Vuuren, D.P.; VanderVoet, E. Scenarios for demand growth of metals in electricity generation technologies, cars, and electronic applications. Environ. Sci. Technol. 2018, 52, 4950–4959. [Google Scholar] [CrossRef] [Green Version]
- DeWit, A. Heavy metal: Critical raw materials and the energy transition. Rikkyo Econ. Rev. 2020, 74, 1–108. [Google Scholar]
- Calvo, G.; Valero, A. Strategic mineral resources: Availability and future estimations for the renewable energy sector. Environ. Dev. 2021, 41, 100640. [Google Scholar] [CrossRef]
- Bucholz, P.; Brandenburg, T. Demand, supply, and price trends for mineral raw materials relevant to the renewable energy transition. Chem. Ing. Tech. 2018, 90, 141–153. [Google Scholar] [CrossRef]
- Beylot, A.; Guyonnet, D.; Muller, S.; Vaxelaire, S.; Villeneuve, J. Mineral raw material requirements and associated climate change impacts of the French energy transition by 2050. J. Clean. Prod. 2019, 208, 1198–1205. [Google Scholar] [CrossRef]
- Kleijn, R. Materials and Energy: A Story of Linkages. Ph. D. Thesis, Leiden University, Leiden, The Netherlands, 2012. [Google Scholar]
- De Koning, A.; Kleijn, R.; Huppes, G.; Sprecher, B.; Van Engelen, G.; Tukker, A. Metal supply constraints for a low carbon economy? Resour. Conserv. Recycl. 2018, 129, 202–208. [Google Scholar] [CrossRef]
- Grandell, L.; Lehtilä, A.; Kivinen, M.; Koljonen, T.; Kihlman, S.; Lauri, L.S. Role of critical minerals in the future markets of clean energy technologies. Renew. Energy 2016, 95, 53–62. [Google Scholar] [CrossRef]
- World Bank Group. The Growing Role of Minerals and Metals for a Low Carbon Future; World Bank: Washington, DC, USA, 2017. [Google Scholar]
- World Bank Group. Minerals for Climate Action: The Mineral Intensity of the Clean Energy Transition; World Bank: Washington, DC, USA, 2020. [Google Scholar]
- Söderman, M.L.; Kushnir, D.; Sandén, B. Will metal scarcity limit the use of electric vehicles? In Systems Perspectives on Electromobility; Chalmers University of Technology: Göteborg, Sweden, 2013; Chapter 7; ISBN 979-91-980973-1-3. [Google Scholar]
- Simon, B.; Ziemann, S.; Weil, M. Potential metal requirement of active materials in lithium-ion battery cells of electric vehicles and its impact on reserves: Focus on Europe. Resour. Conserv. Recycl. 2015, 104, 300–331. [Google Scholar] [CrossRef]
- Ortego, A.; Calvo, G.; Valero, A.; Iglesias-Émbil, M.; Valero, A. Assessment of strategic raw materials in the automobile sector. Resour. Conserv. Recycl. 2020, 161. [Google Scholar] [CrossRef]
- Iglesias-Émbil, M.; Valero, A.; Ortego, A.; Villacampa, M.; Vilaró, J.; Villalba, G. Raw material use in a battery electric car-a thermodynamic rarity assessment. Resour. Conserv. Recycl. 2020, 158, 104820. [Google Scholar] [CrossRef]
- Cullbrand, K.; Magnusson, O. The Use of Potentially Critical Materials in Passenger Cars; Report 2012-13; Department of Energy and Environment, Chalmers University of Technology: Göteborg, Sweden, 2012. [Google Scholar]
- Deng, J.; Bae, C.; Denlinger, A.; Miller, T. Electric vehicles batteries: Requirements and challenges. Joule 2020, 4, 509–551. [Google Scholar] [CrossRef]
- Candelise, C.; Speirs, J.F.; Gross, R.J.K. Materials availability for thin film (TF) PV technologies development: A real concern? Renew. Sustain. Energy Rev. 2012, 15, 4972–4981. [Google Scholar] [CrossRef]
- Kim, J.; Guillaume, B.; Chung, J.; Hwang, Y. Critical and precious materials consumption and requirement in wind energy system in the EU 27. Appl. Energy 2015, 139, 327–334. [Google Scholar] [CrossRef]
- IEA. Net Zero by 2050–A Roadmap for the Global Energy Sector; IEA: Paris, France, 2021. [Google Scholar]
- IEA. World Energy Outlook; IEA: Paris, France, 2021. [Google Scholar]
- UN DESA (United Nations Department of Economic and Social Affairs). 2019 Revision of World Population Prospects. 2019. Available online: https://population.un.org/wpp/ (accessed on 16 December 2021).
- World Commission on Environment and Development (Brundtland Commission), Our Common Future; Elsevier: Amsterdam, The Netherlands, 1987.
- Reilly, J.; Paltsev, S. Biomass Energy and Competition for Land, Joint Program on the Science and Policy of Global Change; GTAP Working Paper No 46; Massachusetts Institute of Technology: Cambridge, MA, USA, 2008. [Google Scholar]
- Carrara, S.; Alves Dias, P.; Plazzotta, B.; Pavel, C. Raw Materials Demand for Wind and Solar PV Technologies in the Transition towards a Decarbonized Energy System, Eur 30095EN; Publications of the European Union: Luxembourg, 2020; ISBN 978-97-76-16225-4. [Google Scholar] [CrossRef]
- IEA. The Role of Critical Minerals in Clean Energy Transitions, World Energy Outlook; Special Report; IEA: Paris, France, 2021. [Google Scholar]
- Association de Constructeurs Européens d’Automobiles. Available online: https://fr.wikipedia.org/wiki/Association_des_constructeurs_europ%C3%A9ens_d%27automobiles (accessed on 29 December 2021).
- Ortego, A.; Valero, A.; Valero, A.; Restrepa, E. Vehicles and critical raw materials. J. Ind. Ecol. 2018, 22, 1005–1015. [Google Scholar] [CrossRef] [Green Version]
- Valero, A.; Valero, A.; Calvo, G. The Materials Limits of Energy Transition: Thanatia; Springer: Berlin/Heidelberg, Germany, 2021; ISBN 978-3-030-78533-8. [Google Scholar]
- US Geological Survey. Mineral Commodity Summaries, Cobalt, Copper, Lithium, Molybdenum, Nickel, Rare Earth Elements, Tellurium, Vanadium, Zinc; US Geological Survey: Reston, VA, USA, 2022.
- World Bank. Available online: htpps://www.data.worldbank.org/indicator (accessed on 1 February 2022).
- US Geological Survey. Mineral Commodity Summaries and Historical Data; US Geological Survey: Reston, VA, USA, 1980–2020.
- EU. Available online: https://ec.europa.eu/growth/sectors/raw-materials/areas-specific-interest/critical-raw-materials (accessed on 10 February 2022).
- Cobalt Institute. Available online: https://www.cobaltinstitute.org/wp-content/uploads/2021/09/Cobalt-Institute-State-of-the-Cobalt-Market-Report_2020.pdf (accessed on 23 January 2022).
- Copper Alliance, Global 2018 Semis End Use Data Set. Available online: https://copperalliance.org/trends-and-innovatons/data-set (accessed on 14 January 2019).
- US Geological Survey. Lithium, Chapter K of Critical Mineral Resources of the United States; Professional Paper 1802-K; US Geological Survey: Reston, VA, USA, 2017.
- US Geological Survey. Nickel. In 2015 Minerals Yearbook; US Geological Survey: Reston, VA, USA, 2018. [Google Scholar]

Publisher’s Note: MDPI stays neutral with regard to jurisdictional claims in published maps and institutional affiliations. |
© 2022 by the author. Licensee MDPI, Basel, Switzerland. This article is an open access article distributed under the terms and conditions of the Creative Commons Attribution (CC BY) license (https://creativecommons.org/licenses/by/4.0/).