Article

Autonomous Vehicles for Enhancing Expressway Capacity: A Dynamic Perspective

1
School of Civil and Hydraulic Engineering, Huazhong University of Science and Technology, Wuhan 430074, China
2
Key Laboratory of Road and Traffic Engineering, Ministry of Education, Tongji University, Shanghai 200092, China
3
School of Naval Architecture Ocean and Civil Engineering, Shanghai Jiao Tong University, Shanghai 200240, China
*
Author to whom correspondence should be addressed.
Sustainability 2022, 14(9), 5193; https://doi.org/10.3390/su14095193
Submission received: 19 March 2022 / Revised: 17 April 2022 / Accepted: 18 April 2022 / Published: 25 April 2022
(This article belongs to the Special Issue Sustainable Transportation Planning and Roadway Safety)

Abstract

:
With rapidly developing communication and autonomous-driving technology, traffic flow on road networks will change from homogeneous human-driven vehicle (HDV) traffic flow to heterogeneous mixed traffic flow (MTF) comprising HDVs, autonomous vehicles (AVs), and connective-and-autonomous vehicles (CAVs). To understand the changes in the MTF of transportation engineering, we investigated the reserved capacity (RC) and right-of-way (ROW) reallocation policy that should be utilized under MTF scenarios. We established an MTF-based theoretical model to calculate the expressway segment capacity, theoretically analyzed the influence of the market penetration rate (MPR) on capacity and validated the model through numerical analysis. The results showed that the MPR of AVs and CAVs can enhance the MTF RC that is within 0–200% and that the platooning rate of CAVs positively influences the MTF RC. CAV popularization does not necessarily lead to a rapid increase in the transportation system efficiency when the MPR is <40% but significantly improves the efficiency of existing urban transportation facilities. When the MPR is >40%, the greatest enhancement is 4800 pcu/h/lane in terms of RC. A ROW reallocation policy that equips CAV-dedicated lanes according to the MPR of AVs and CAVs can enhance the capacity of expressway systems by 500 pcu/h/lane in terms of RC.

1. Introduction

The human population is expected to reach 9 billion by 2050, 75% of which is expected to live in towns and cities [1]. The associated increasing traffic demand poses a challenge to urban transportation systems. Frequent, widespread congestion significantly impacts urban life due to carbon emissions and air and noise pollution [2,3]. Owing to traffic congestion, the capacity of existing facilities is unable to accommodate the growing traffic demands. Therefore, to alleviate traffic congestion and enhance the capacity of urban networks, traffic demand management [4,5,6] has been conducted by developing public transport systems and new transportation facilities. The expressway system plays an important role in our urban transportation systems. For example, according to a previous study, although the expressway system in Shanghai, China, accounts for only 8% of the total length of the road network, it is responsible for 35% of the urban traffic volume. Considering that expressway systems play a significant role in urban transportation, municipal authorities in the world are currently building larger-scale expressway systems. However, such large-scale construction is unsustainable owing to resource constraints, such as land, financial investment, and carbon emissions [7].
A more sustainable method to alleviate traffic congestion is to release the reserved capacity (RC) of existing facilities. Numerous studies have demonstrated that the capacity of existing facilities can be significantly improved using methods such as optimal geometric design [8], signal timing [9], traffic management [10,11], and maintenance considering risk profiles [12]. In recent years, the maturity and popularization of autonomous driving technology have provided a new perspective for improving the capacity of existing expressway facilities. Owing to the maturation and commercialization of communication and autonomous driving technology, cars will operate as transportation robots with functions such as autonomous perception, decision making, and execution. In the future, communication and autonomous driving technology could assist or replace human drivers, owing to shorter perception–reaction times in real-time road conditions and precise vehicle control. Therefore, autonomous vehicles (AVs) are expected to fundamentally change the inherent properties of traditional traffic flow, reduce the number and severity of traffic accidents and carbon emissions, and improve the efficiency of existing infrastructure [13,14,15,16,17,18,19].
AVs and connective-and-autonomous vehicles (CAVs) [20,21] are two types of autonomous driving technology applications. AVs are vehicles that have a certain degree of autonomous driving but cannot communicate with the infrastructure of other vehicles. AVs using onboard sensors drive independently, in contrast to other vehicles. Adaptive cruise control and lane-keeping assist systems are examples of typical AV technology. Conversely, CAVs refer to vehicles based on AV technology that use vehicle-to-everything (V2X) technology to obtain the status and intentions of other traffic participants and traffic facilities beyond the visual range [22,23]. More importantly, owing to platooning technology, multiple CAVs can drive like a train and have a shorter headway, compared with a pair of disconnected AVs [24]. The cooperative adaptive cruise control system is a typical example of CAV technology. It is foreseeable that the heterogeneous traffic flow of human-driven vehicles (HDVs), AVs, and CAVs will coexist in the same transportation system in the near future.
The Highway Capacity Manual [25] defines road capacity as the maximum sustainable hourly flow rate at which persons or vehicles can be reasonably expected to traverse a point (or a uniform section of a lane or roadway) during a given time period (under prevailing roadway, environmental, traffic, and control conditions). However, this definition treats capacity as a constant without considering heterogeneous traffic flow in the near future. For traffic managers and local authorities, sound understanding and capacity enhancement by emerging AV and CAV technologies (using right-of-way (ROW) management policies from a dynamic perspective) are essential for traffic planning [26], design [27], and operation [28,29,30].
It is difficult to assess the possible effects of emerging AV and CAV technologies on the capacity of urban road facilities considering that HDVs, AVs, and CAVs could share road space for a relatively long time [31,32]. Different factors constantly influence the capacity change until it is fully autonomous and connected. For example, the market penetration rate (MPR) of AVs changes constantly, and CAV technology that shortens the headway (to form platoons as communication technology) has been developed. To address these dynamic issues, traffic managers and local authorities should apply ROW management strategies when the MPR or CAV platoon technologies are changing. Furthermore, considering that unreasonable ROW management can decrease the capacity, the interaction between mixed traffic flow (MTF) and transportation infrastructure management should be carefully considered. In several studies, the MTF capacity has been investigated using methods such as analytical modeling [21,33] and simulation [34,35] as well as empirical approaches [15,36]. These studies have formed a consensus that as the MPR of AVs and CAVs increases, the MTF capacity significantly increases.
Most existing research assumed that there are two types of MTF: HDVs with AVs and HDVs with CAVs. It also did not sufficiently consider the complexity of heterogeneous traffic flow [24,30,32,36,37]. In fact, AVs and CAVs exhibit different characteristics that should be considered separately, because a CAV will generate much lower headway than that generated by an AV when forming a platoon. Furthermore, the percentage of forming a CAV platoon in MTF is a random factor, where special considerations are required, and ROW management will affect this randomness. To the best of our knowledge, no study has been conducted on the simultaneous analysis of the MTF capacity and ROW management considering HDVs, AVs, and CAVs (which will simultaneously appear on the road with variable penetration rates in the near future). However, the existing study on MTF capacity or ROW management under simplified MTF will not be applicable, especially for this dynamic situation. Therefore, herein, we propose a theoretical RC quantitative model of MTF to address the combinational effects between the MPR of MTF and CAV platoon rates. The proposed model is verified through numerical analysis, and ROW management policies are discussed.
The main contributions of this study can be summarized as follows:
  • A theoretical analysis model framework for MTF capacity was established. In contrast to previous research, which only considered simplified MTF, this study considered the heterogeneity of HDVs, AVs, and CAVs, especially considering that CAVs could not communicate with the vehicles in front and degenerated into AVs.
  • From the perspective of saturated headways, we demonstrated that, as AV and CAV technologies progress, the existing road infrastructure would still have an extremely large RC. Furthermore, we investigated RC formulation comprising deterministic and random expressions, which theoretically proved the scale effects of AV and CAV penetration rates on road operation efficiency.
  • A simulation framework was developed to calculate the capacity of a single lane under a variable MPR. Based on numerical analysis, the theoretical model was verified, and a ROW reallocation method was analyzed for capacity enhancement.

2. Problem Description

2.1. Fundamental Assumptions

In this study, the RC for MTFs comprising HDVs, AVs, and CAVs was investigated. The following assumptions were made:
(1)
Expressway segment without an on/off ramp: We considered the capacity of the freeway segment without considering ramps and off-ramps.
(2)
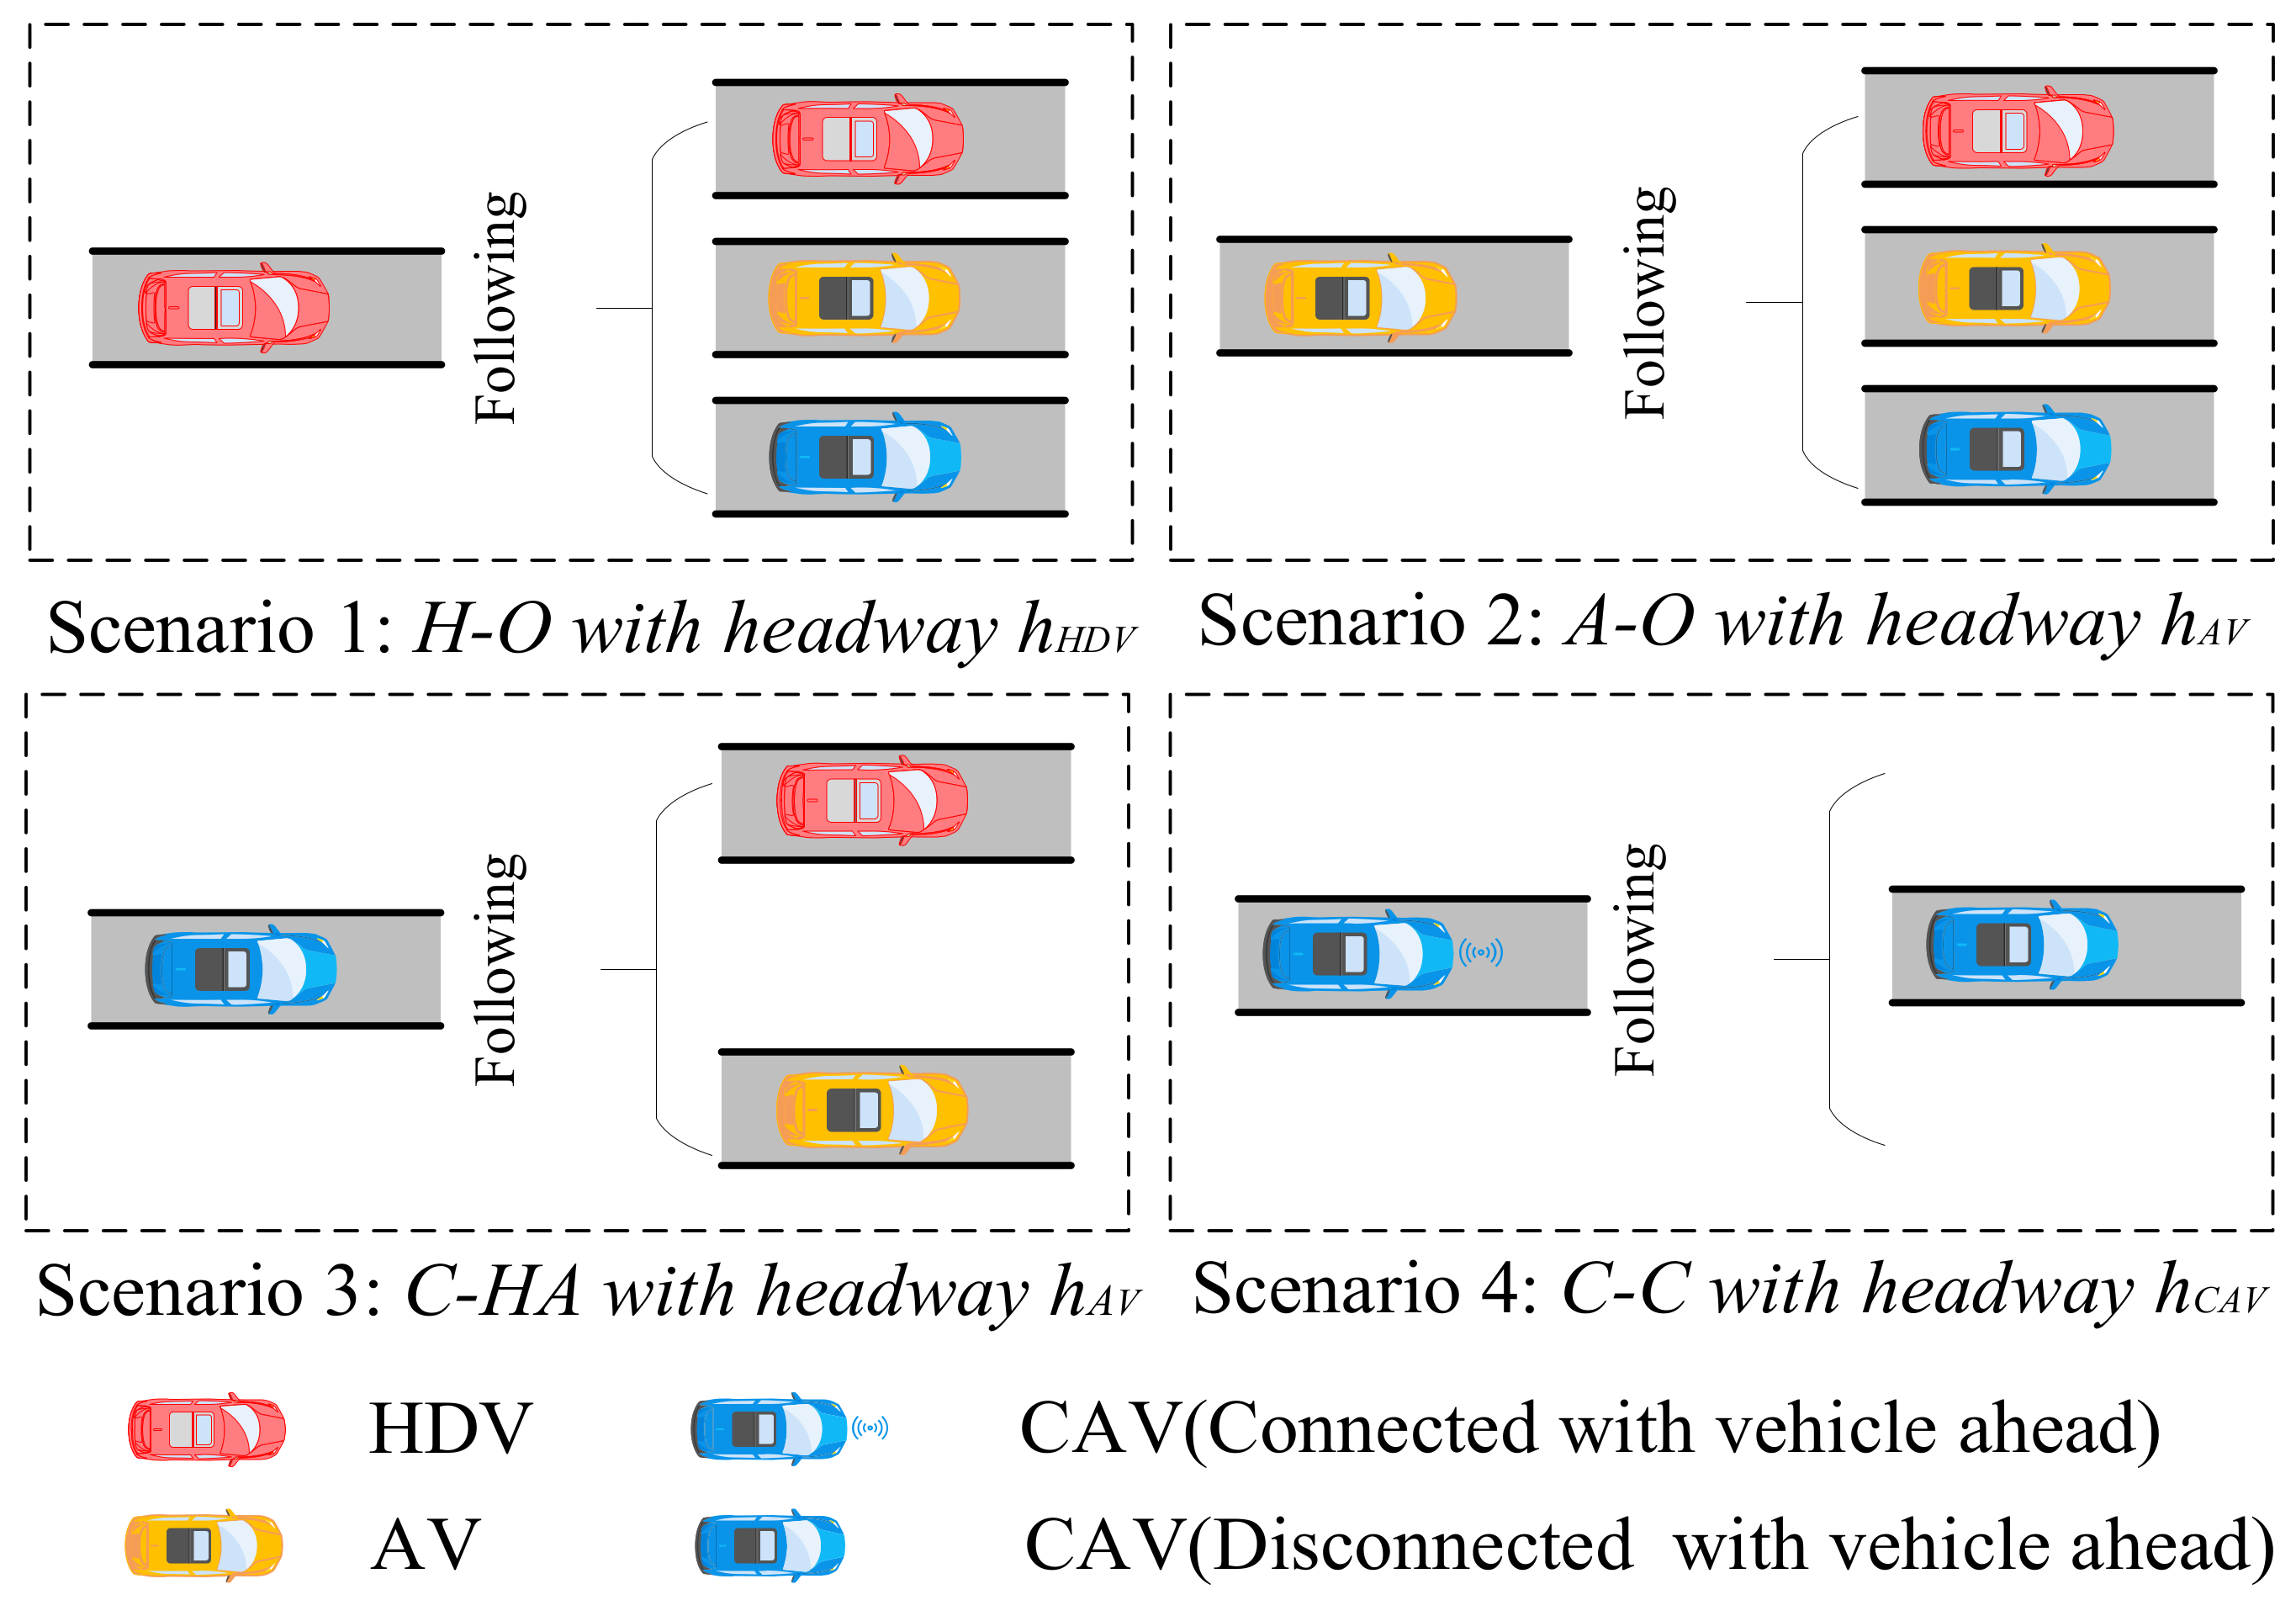
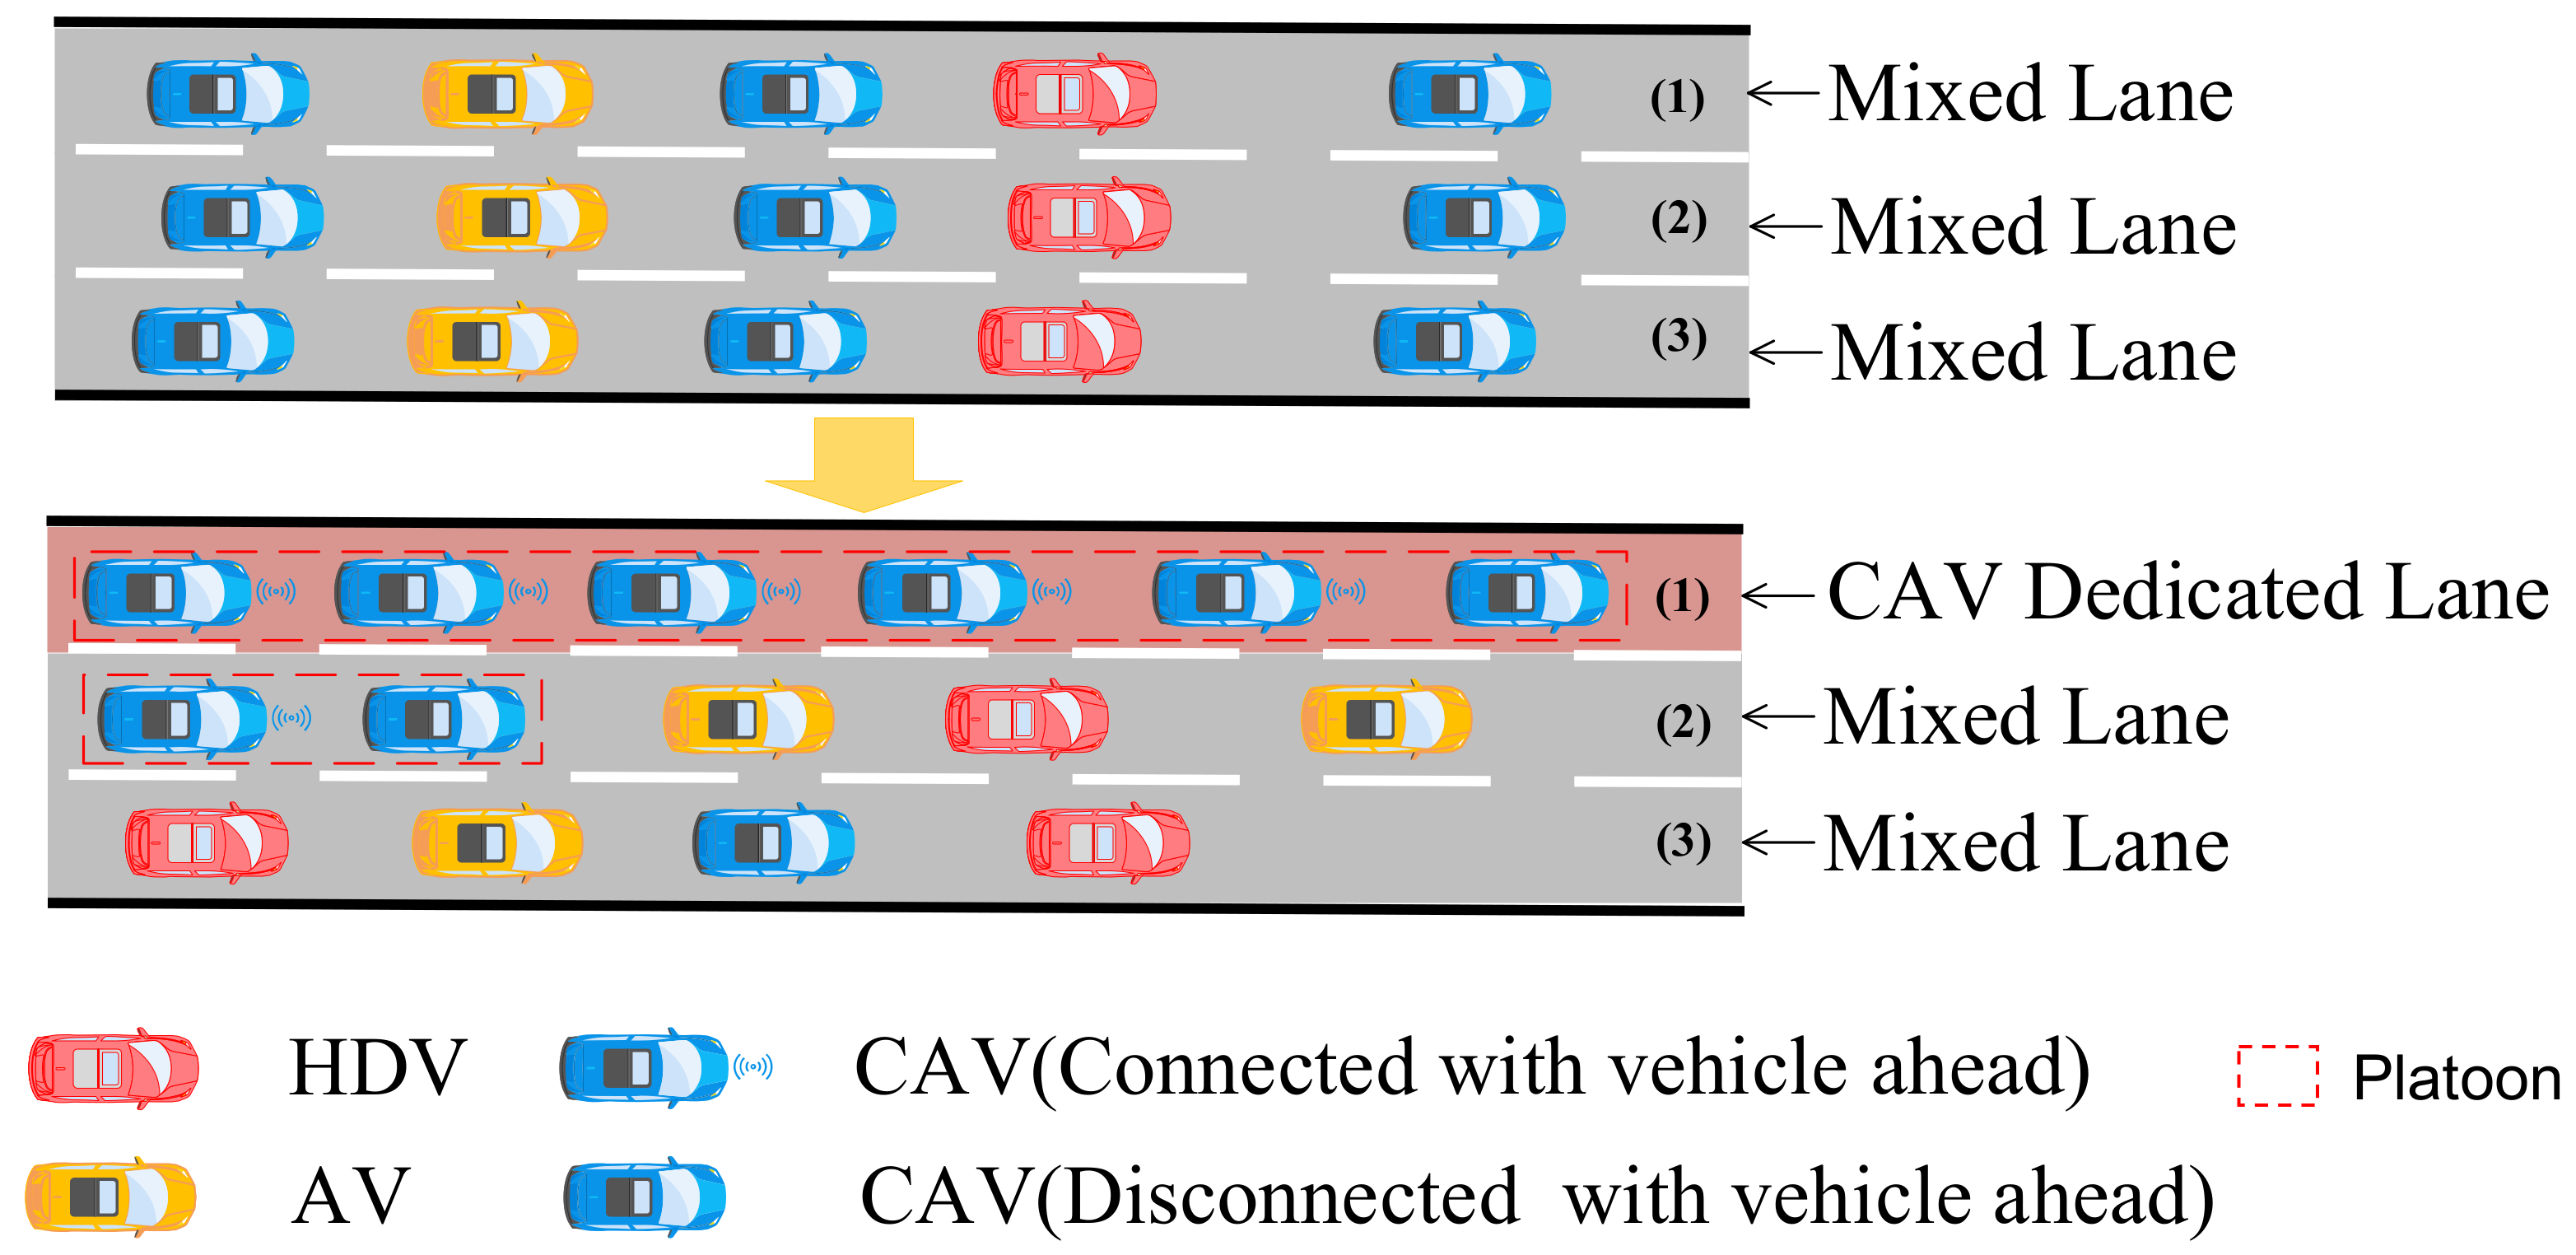
Traffic flow composition: Although there are two types of autonomous driving technologies, that is, AVs and CAVs, the micro behaviors of vehicles (including car following, lane changing, and CAV platooning) of different brands and technical levels (L1–L5) [38] are bound to be different. We simplified MTFs into three categories: HDVs, AVs, and CAVs. When a CAV follows an HDV or an AV, and there is no real-time interaction with the vehicle in front based on the internet-connected communication function, the CAVs degrade to AVs [14,24]. Section 2.2 provides details on those specific analyses.
(3)
Steady flow: For modeling traffic flow at the freeway segment, in this study, we assumed a fixed headway as an estimate of the mean headway for a given car-following scenario. This simplified the model analysis and solution process. To derive the macroscopic theoretical capacity formulation, the detailed effects of lane changes and dynamic CAV platooning processes at the microscopic level were not considered.

2.2. Vehicle-Following Analysis
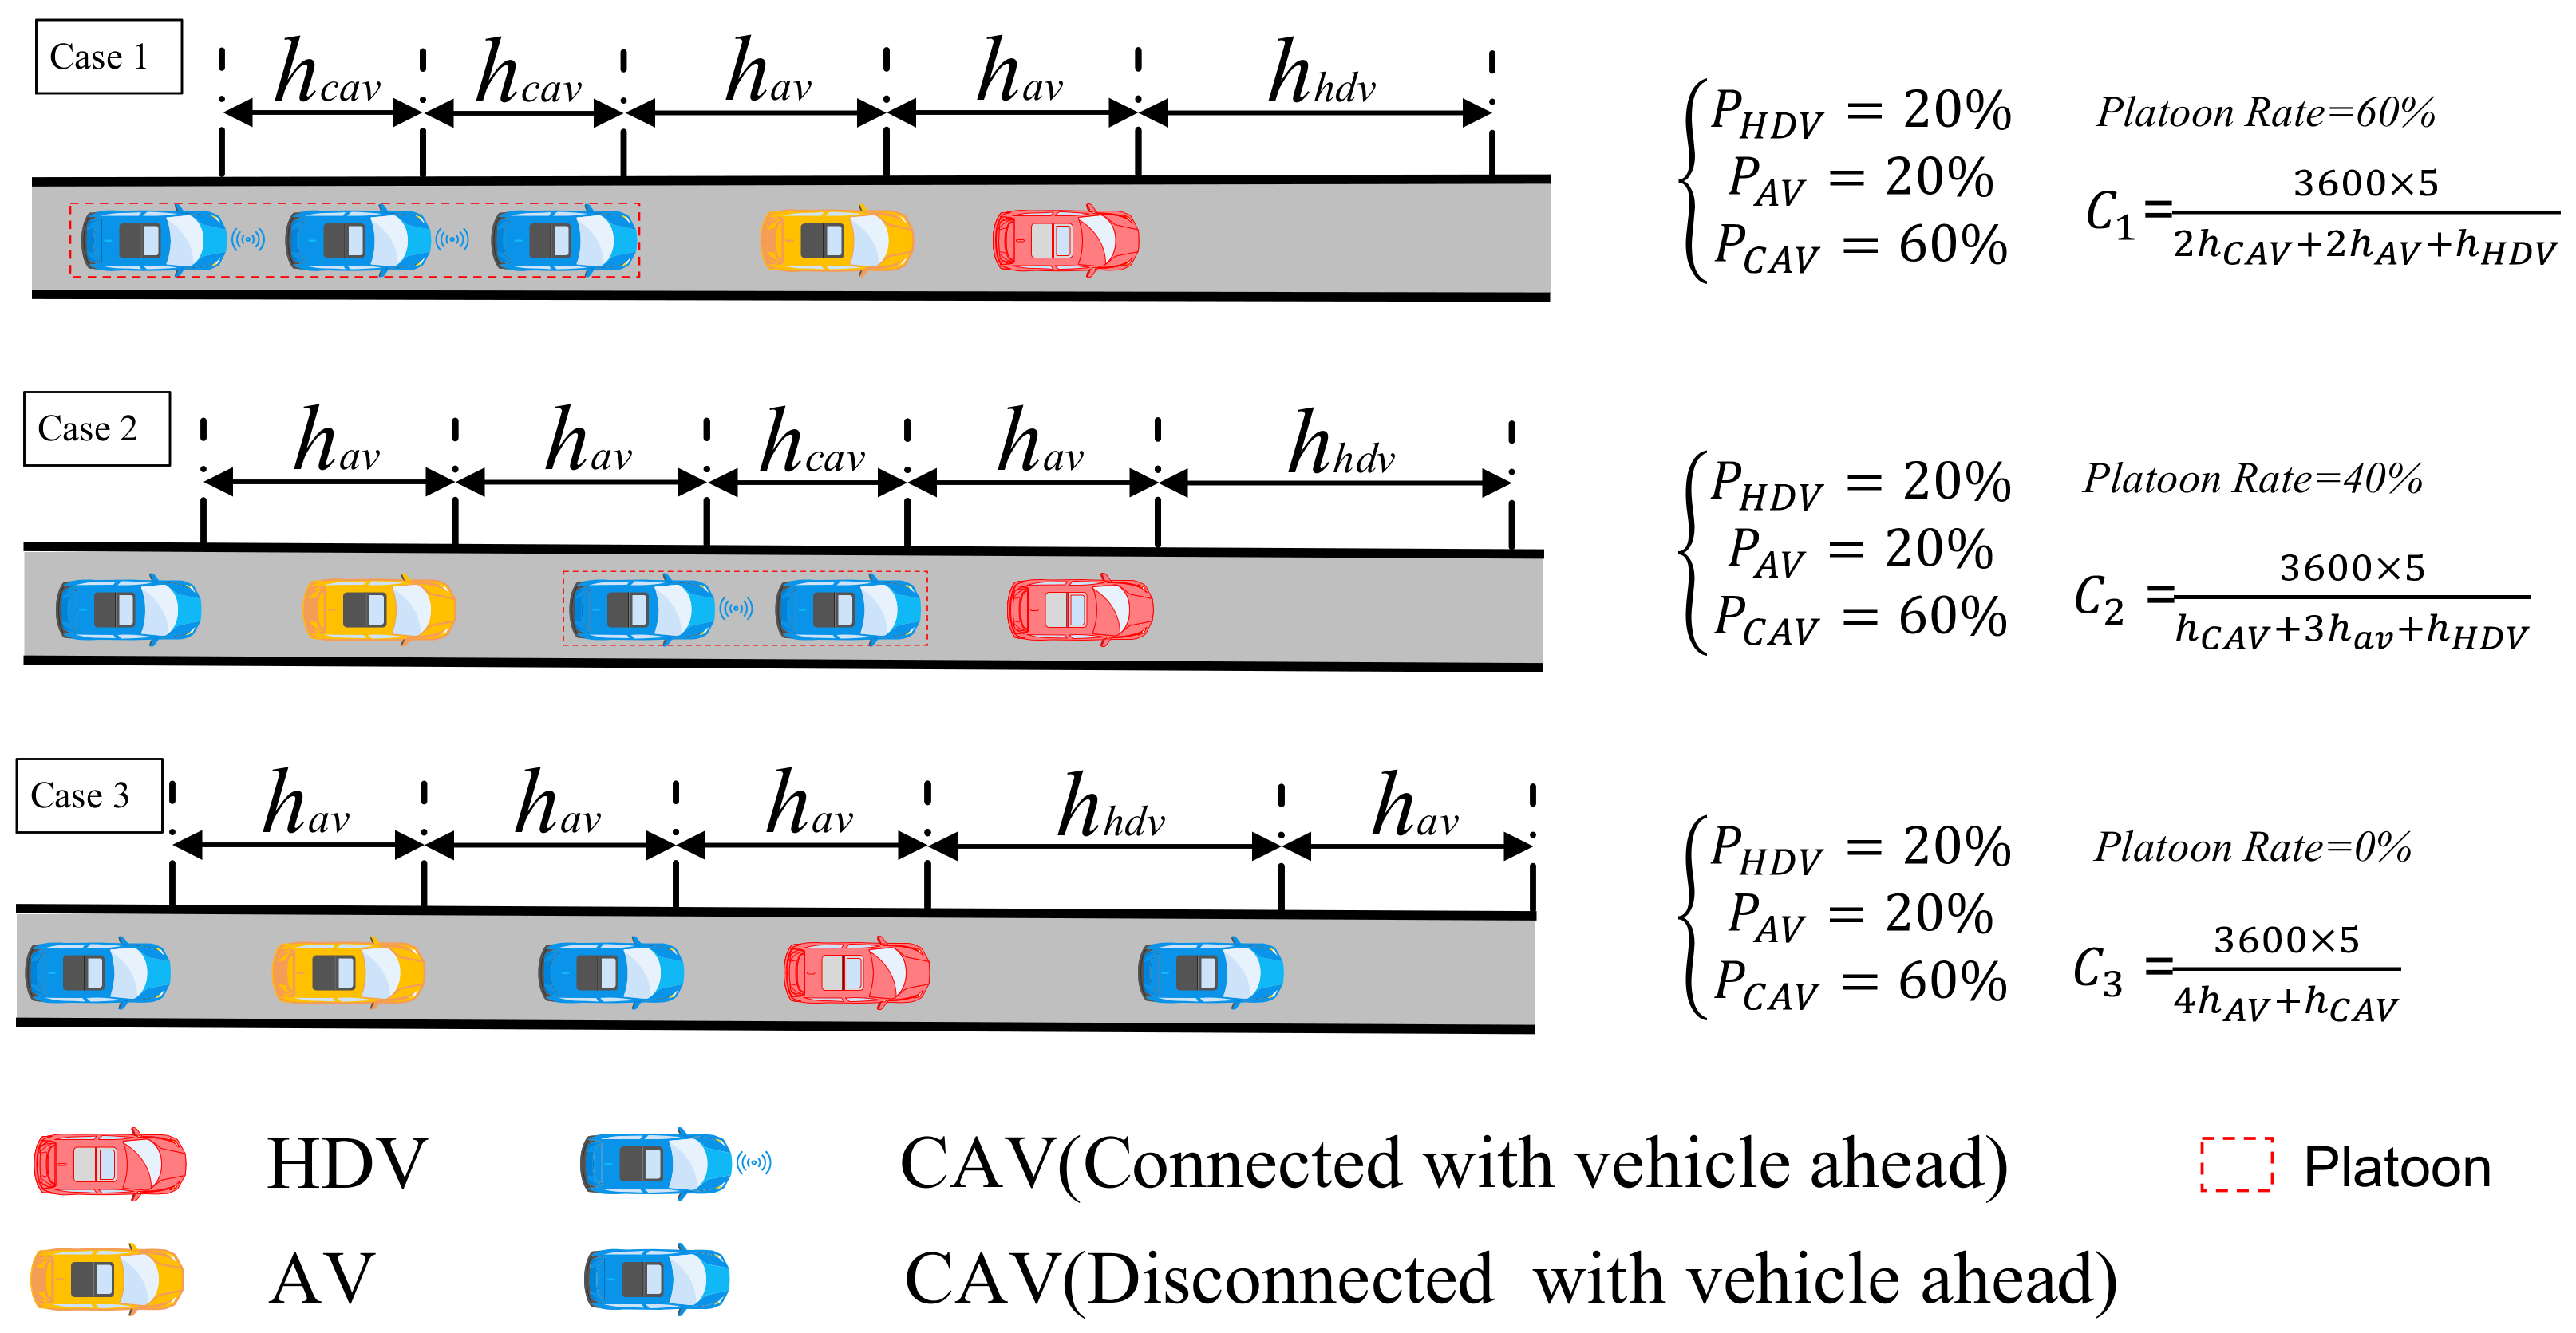
As shown in Figure 1, we analyzed four types of car-following scenarios to calculate the RC of heterogeneous traffic flow based on the car-following model (simplified by assumptions).
Scenario (1): HDV following others. This mode is referred to as H-O. Here, an HDV follows an HDV, an AV, or a CAV with a headway of h H V . Considering that the following HDV does not communicate, information cannot be shared between vehicles. Therefore, when the longitudinal driving behavior (acceleration and deceleration) of the front car changes, the following car should identify it and take acceleration and deceleration measures (corresponding to human behavior). According to previous research [39,40,41], the average headway between HDVs is approximately 1.8–2.5 s.
Scenario (2): AV following others. This mode is referred to as A-O. Here, an AV follows an HDV, an AV, or a CAV with a headway of h A V . Considering that the following car does not communicate, information cannot be shared between vehicles (similar to H-O). However, the following car can identify when the longitudinal driving behavior (acceleration and deceleration) of the front car changes using advanced sensing equipment and take corresponding acceleration and deceleration measures using autonomous technology. According to previous research [33,42,43], the average headway between AVs following other vehicles is approximately 0.9–2.0 s.
Scenario (3): CAV following HDV/AV. This mode is referred to as C-HA. Here, a CAV follows an HDV or AV, and there is no real-time interaction with the vehicle in front based on the internet-connected communication function. The CAV degenerates into an AV. Therefore, the CAV follows with a headway of h A V .
Scenario (4): CAV following CAV. This mode is referred to as C-C. Here, the CAV follows with a headway of h C A V . When a CAV follows a CAV, communication between them is possible, and the following vehicles share information through real-time communication. The car in front can share its subsequent longitudinal driving behavior (acceleration and deceleration) with the car behind it in advance, which allows synchronous changes in the driving behavior between the two cars. It can be considered that the two vehicles form a team when acceleration and deceleration changes are conducted simultaneously (a platoon). According to previous research [37,44,45], the average headway between CAVs following CAVs is approximately 0.5–1.1 s.

2.3. CAV Platooning

As shown in Figure 2, it can be concluded that the capacity differs in terms of the CAV spatial position, although the penetration rates of the three vehicle types are the same. Different CAV platooning intensities may result in different capacities. For example, if CAVs are more scattered across the highway, there will be fewer long platoons of CAVs with reduced headways, and thus, the improvement in traffic capacity becomes less salient. However, if CAVs are better clustered, highway capacity will increase because of longer CAV platoons with reduced headways.
As a measurement of CAV platooning intensity, we define the CAV platoon rate (PR) as follows:
P R   =   N p N H D V   +   N A V   +   N C A V .

2.4. Capacity Assessment

To facilitate this presentation, the key variable notations used hereafter are summarized in Table 1.

2.4.1. Reserved Capacity

Owing to emerging AV and CAV technologies, we propose a description of the enhancement in traffic flow capacity, called RC. It can be defined as the enhanced value of the maximum sustainable hourly MTF rate at which persons or vehicles can reasonably traverse a point (or a uniform section of a lane or roadway) during a given time period under prevailing roadway, environmental, traffic, and control conditions. The RC can be expressed as follows:
R C   =   C M T F     C H D V .
In MTF, the probability of different headways occurring on the road is given by
P h H D V   =   P H O P h d v , P a v , P c a v , P R ,
P h A V   =   P A O P h d v , P a v , P c a v , P R   +   P C H A P h d v , P a v , P c a v , P R ,
P h C A V   =   P C C P h d v , P a v , P c a v , P R .
Therefore, the average headway is
h ¯   =   P H O   ·   h H V   +   ( P A O   +   P C H A )   ·   h A V   +   P C C   ·   h C A V .
The capacity is calculated as
C M T F   =   3600 h ¯   =   3600 P H O   ·   h H V   +   ( P A O   +   P C H A )   ·   h A V   +   P C C   ·   h C A V   =   3600 P h H D V h H D V   +   P h A V h A V   +   P h C A V h C A V .
The HDV capacity is given by
C H D V   =   3600 h H D V .
Combining Equations (7) and (8), the RC is then given by
R C   =   3600 P h H D V h H D V   +   P h A V h A V   +   P h C A V h C A V     3600 h H D V .
From Equation (9), we can conclude that the single-lane capacity of an expressway is affected by three factors: (1) car-following headways: h H D V , h A V ,   and   h C A V ; (2) the MPR of HDVs, AVs, and CAVs; (3) the PR (CAV platooning intensities in MTF). In the following section, we analyze the mathematical properties based on capacity formulation.

2.4.2. Monotonicity and Convexity of Capacity

To study the theoretical characteristics of the RC, we analyzed the monotonicity and convexity of capacity.
The monotonicities of the penetration rates of AVs and CAVs are calculated based on the calculation of the first derivative. They are given by
C P A V   =   C P h A V P h A V P A V   =   1 h ¯ 2 h H D V     h A V P h A V P A V ,
d C d P C A V   =   C P h C A V P h C A V P C A V   =   1 h ¯ 2 h H D V     h C A V P h C A V P C A V .
The convexity of the penetration rates of the AVs and CAVs is calculated based on the calculation of the Hessian matrix. It is given by
H   =   [ 2 C 2 P h A V P h A V P A V 2   2 C P h A V P h C A V P h A V P A V P h C A V P C A V 2 C P h C A V P h A V P h C A V P C A V P h A V P A V 2 C 2 P h C A V P h C A V P C A V 2 ] .
We can conclude that C M T F · is a convex function if H is positively defined in the domain of the definition.
First, the sign of the first derivative is determined by h H V     h A V or h H V     h C A V (i.e., an improvement in vehicle performance decreases the headway), which can be derived easily from the basic concept of free-flow capacity. When all vehicles are CAVs, the capacity of a single lane reaches a maximum, and all vehicles in one platoon are run with a headway of h C A V . Second, the second derivative is positive, which indicates that capacity is convex to P A V   and   P C A V , thereby achieving the basic conclusion: the capacity growth is not linear (AVs have a “scale effect” on capacity growth). Lastly, although the above conclusion is based on a single lane, it provides theoretical support for AV-exclusive lanes. If AVs on expressways are concentrated on AV-exclusive lanes, the scale effect and traffic capacity can be improved.

3. Methodology

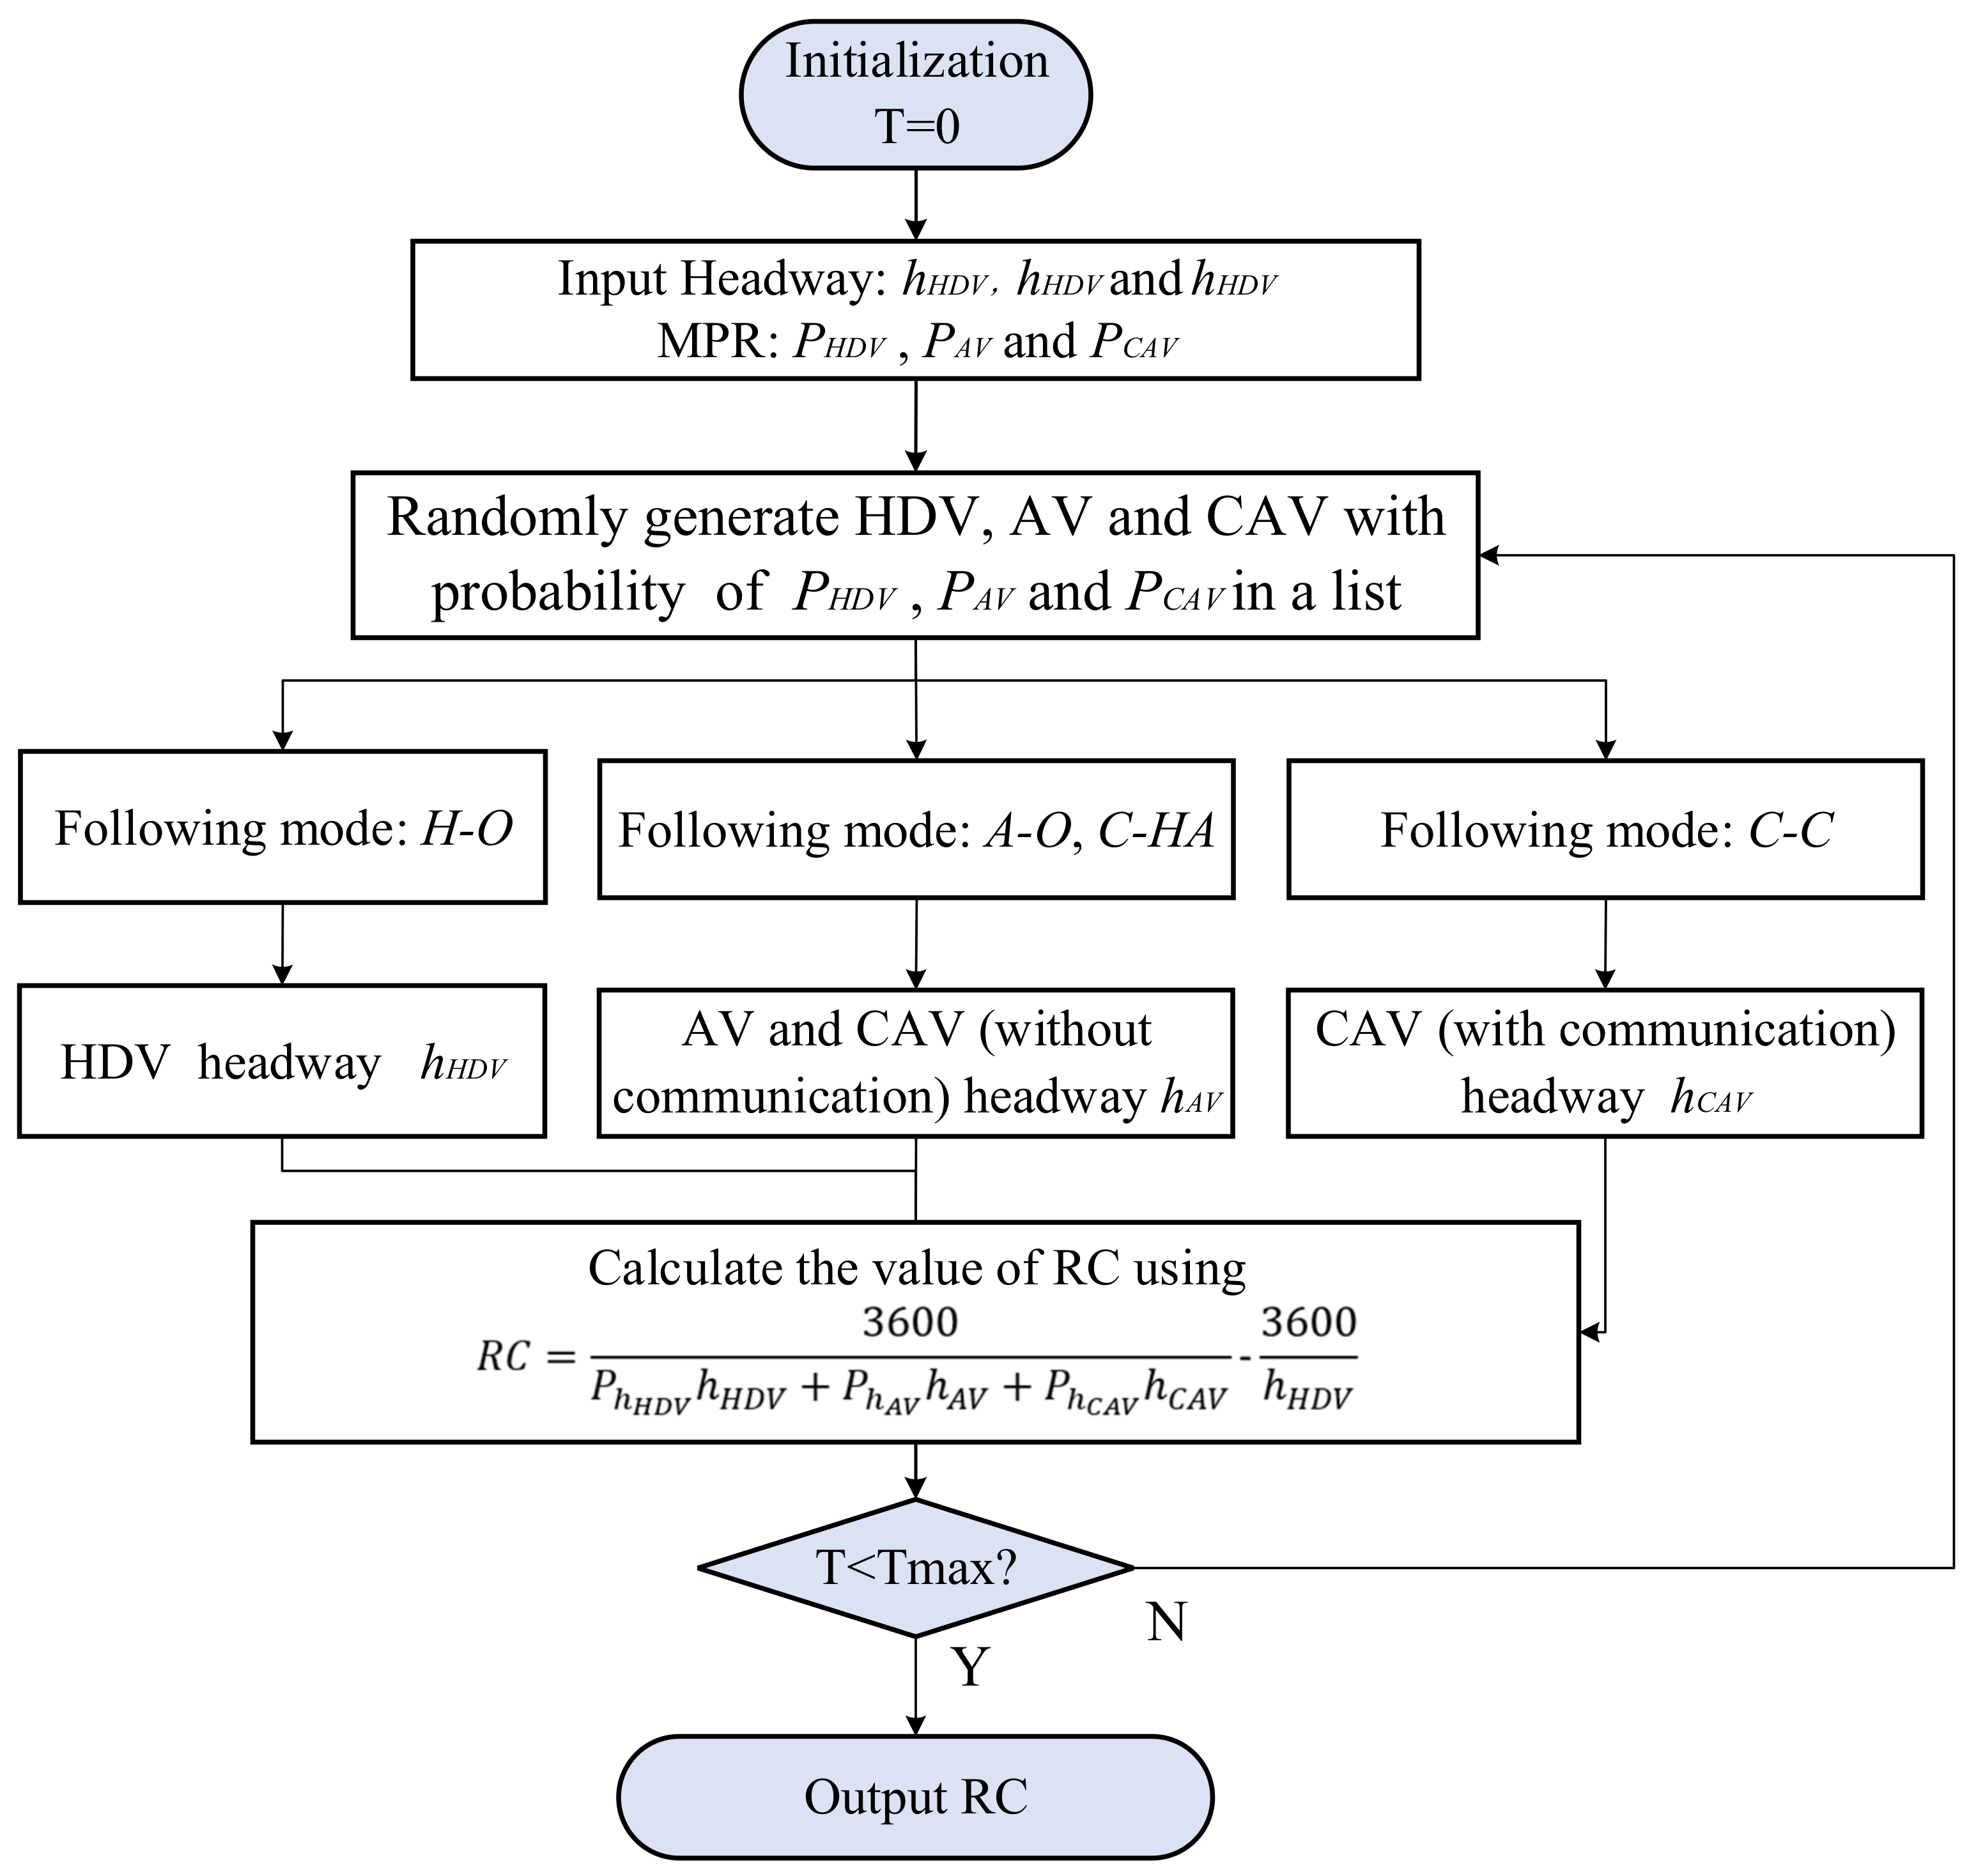
3.1. Monte Carlo Simulation Framework

According to the theoretical analysis of single-lane RC formulation, the RC was affected by the stochastic features of headways and MPRs. Therefore, Monte Carlo simulation was proposed to study the randomness of the RC under different headways and MPRs, as shown in Figure 3. By randomly generating HDVs, AVs, and CAVs with a probability of MPRs, different types of headways can be simulated on the road, and a set of RCs can be obtained based on Equation (9).

3.2. Right-of-Way Allocation

It was challenging for traffic managers and local authorities to efficiently reallocate the ROW for the MTF of HDVs, AVs, and CAVs. Herein, we discuss ROW management to reduce the impact of randomness on the RC. We also propose an analytical lane management framework to determine the optimal number of lanes allocated exclusively to CAVs. Additionally, we propose a mixed-integer optimization model to maximize capacity via ROW management. The decision variable sets some of the existing mixed lanes to the CAV-dedicated lane.
m a x R C   =   i   =   1 n C i i , where   R C i   is   obtained   using   the   simulation   model s . t . i 0 , 1 , 0     P h H D V i     1 , 0     P h A V i     1 , 0     P h C A V i     1 , i P h H D V i   =   P h H D V , i P h A V i   =   P h A V , i P h C A V i   =   P h C A V ,   P h H D V   +   P h A V   +   P h C A V   =   1 ,
where the decision variable, i , refers to setting lane i as the CAV-dedicated lane under MPR constraints.

4. Numerical Analyses

In this section, three numerical analyses—MPR, PR, and ROW management strategies—are designed to verify the RC analysis and management method proposed in Section 3.

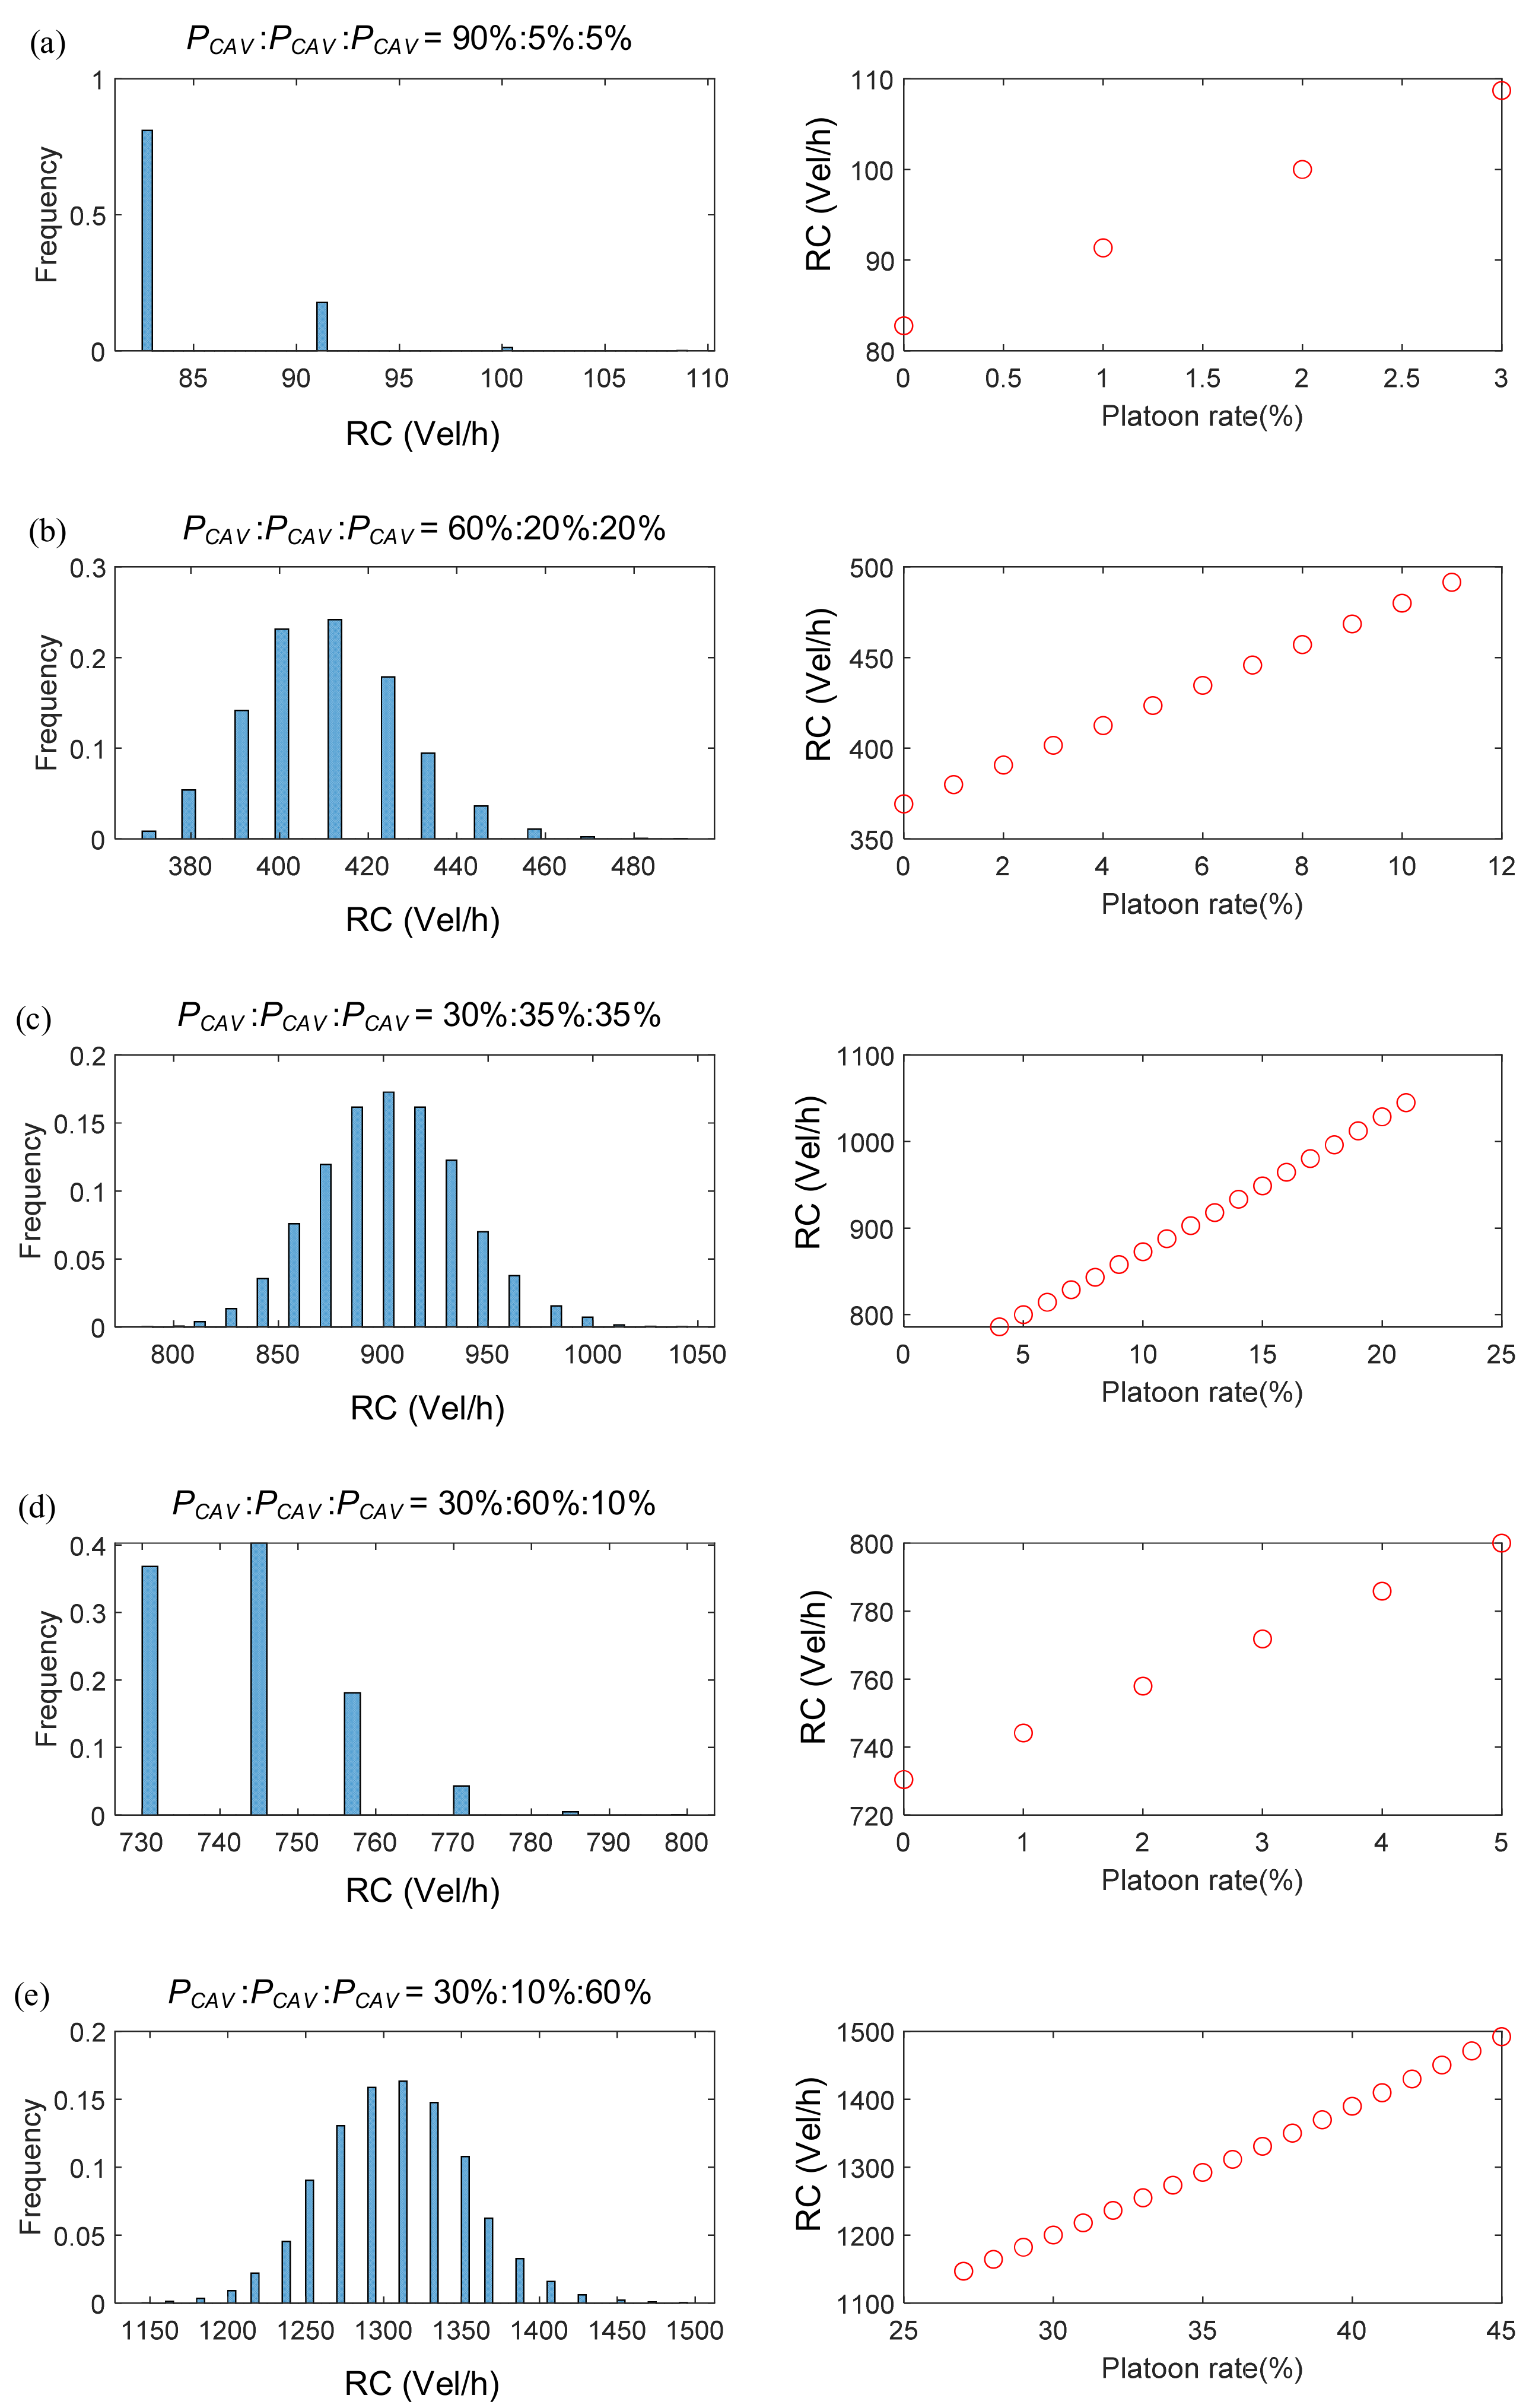
4.1. Market Penetration Rate

Based on the Monte-Carlo-based simulation framework, we tested the RC under different MPRs of AVs and CAVs, from 0% to 100% with a 20% step, for each MPR combination. The average value of the simulated RC was considered as the estimated RC.
Figure 4 shows how P C A V and P A V influence the RC average value when the cars are randomly distributed on the road. The maximum theoretical capacity of mixed AV and CAV flow is convex according to the penetration rate. The curve is convex, which verifies the theoretical results presented in Section 2. The maximum RC value, which is 4800 pcu/h, appeared at P C A V   =   100 % . Figure 5 shows the relationship between the RC and the MPR of AVs and CAVs.
In this study, it was found that even a marginal increase in capacity enhancement can increase market penetration levels, both for intelligence and connectivity. Furthermore, as the CAV penetration rate increases, the marginal increase effect becomes more evident. Especially when PR is higher than 40%, the increase becomes significant.

4.2. Platooning Rate

To study the stochastic features of the RC, several MPRs were tested in the simulation framework, and the simulation results are shown in Figure 6.
There is no randomness in the theoretical capacity when vehicles are HDVs, AVs, or CAVs. In other cases, owing to the randomness of the CAV spatial position, which affects the PR, the RC exhibits randomness. As shown in Figure 6, owing to the different proportions of the three models, appropriate vehicle platoon management strategies can be adopted to enhance the RC. The RC of human–machine mixed driving exhibits significant uncertainty, and therefore, a probabilistic expression is required in the expression paradigm.

4.3. Right-of-Way Management

As shown in Figure 7, we analyzed a three-lane expressway segment as an example, wherein we considered setting none, one, or two lanes as CAV-dedicated lanes under different MPRs.
As shown in Table 2 and Figure 8, appropriate dedicated lane settings for CAVs can effectively enhance the capacity of expressways. In this case, the optimal result is that one dedicated lane is set up when the proportion of the CAV is between 44% and 64%, whereas two dedicated lanes are set up when the proportion is between 64% and 100%. This demonstrates that a suitable control method for enhancing the possibility of a CAV platoon can help release the RC.

5. Conclusions and Future Studies

5.1. Conclusions

In this study, we investigated the impact of the RC using AV and CAV technologies and explored three factors that influence the RC (which include the MPR, PR, and ROW management strategies) through numerical analysis. Based on the results, the following conclusions can be drawn:
(1)
Owing to the improvement in the MPRs of AVs and CAVs in MTF, the capacity of the expressway system can be improved significantly. In an ideal scenario, where all CAVs operate at a 0.5 s headway, the maximum single-lane capacity of the expressway segment can reach 7200 pcu/h. However, the existing facilities still have a considerable RC under autonomous and connected vehicle scenarios.
(2)
In the future, traffic flow is expected to comprise HDVs, AVs, and CAVs simultaneously, and the capacity of mixture flow is expected to be quite complex (which can be affected by the MPRs of AVs and CAVs in MTF, saturation headway in multiple vehicle-following scenarios, and platooning rates of CAVs). Additionally, the capacity is convex to the MPRs of AVs and CAVs, which indicates that the growth in capacity is not linear (AVs and CAVs have a “scale effect” on capacity growth). In other words, the population of AVs and CAVs does not necessarily lead to a rapid increase in capacity when the MPR is >40%; therefore, the long-term operating efficiency of existing urban transportation facilities can be improved significantly.
(3)
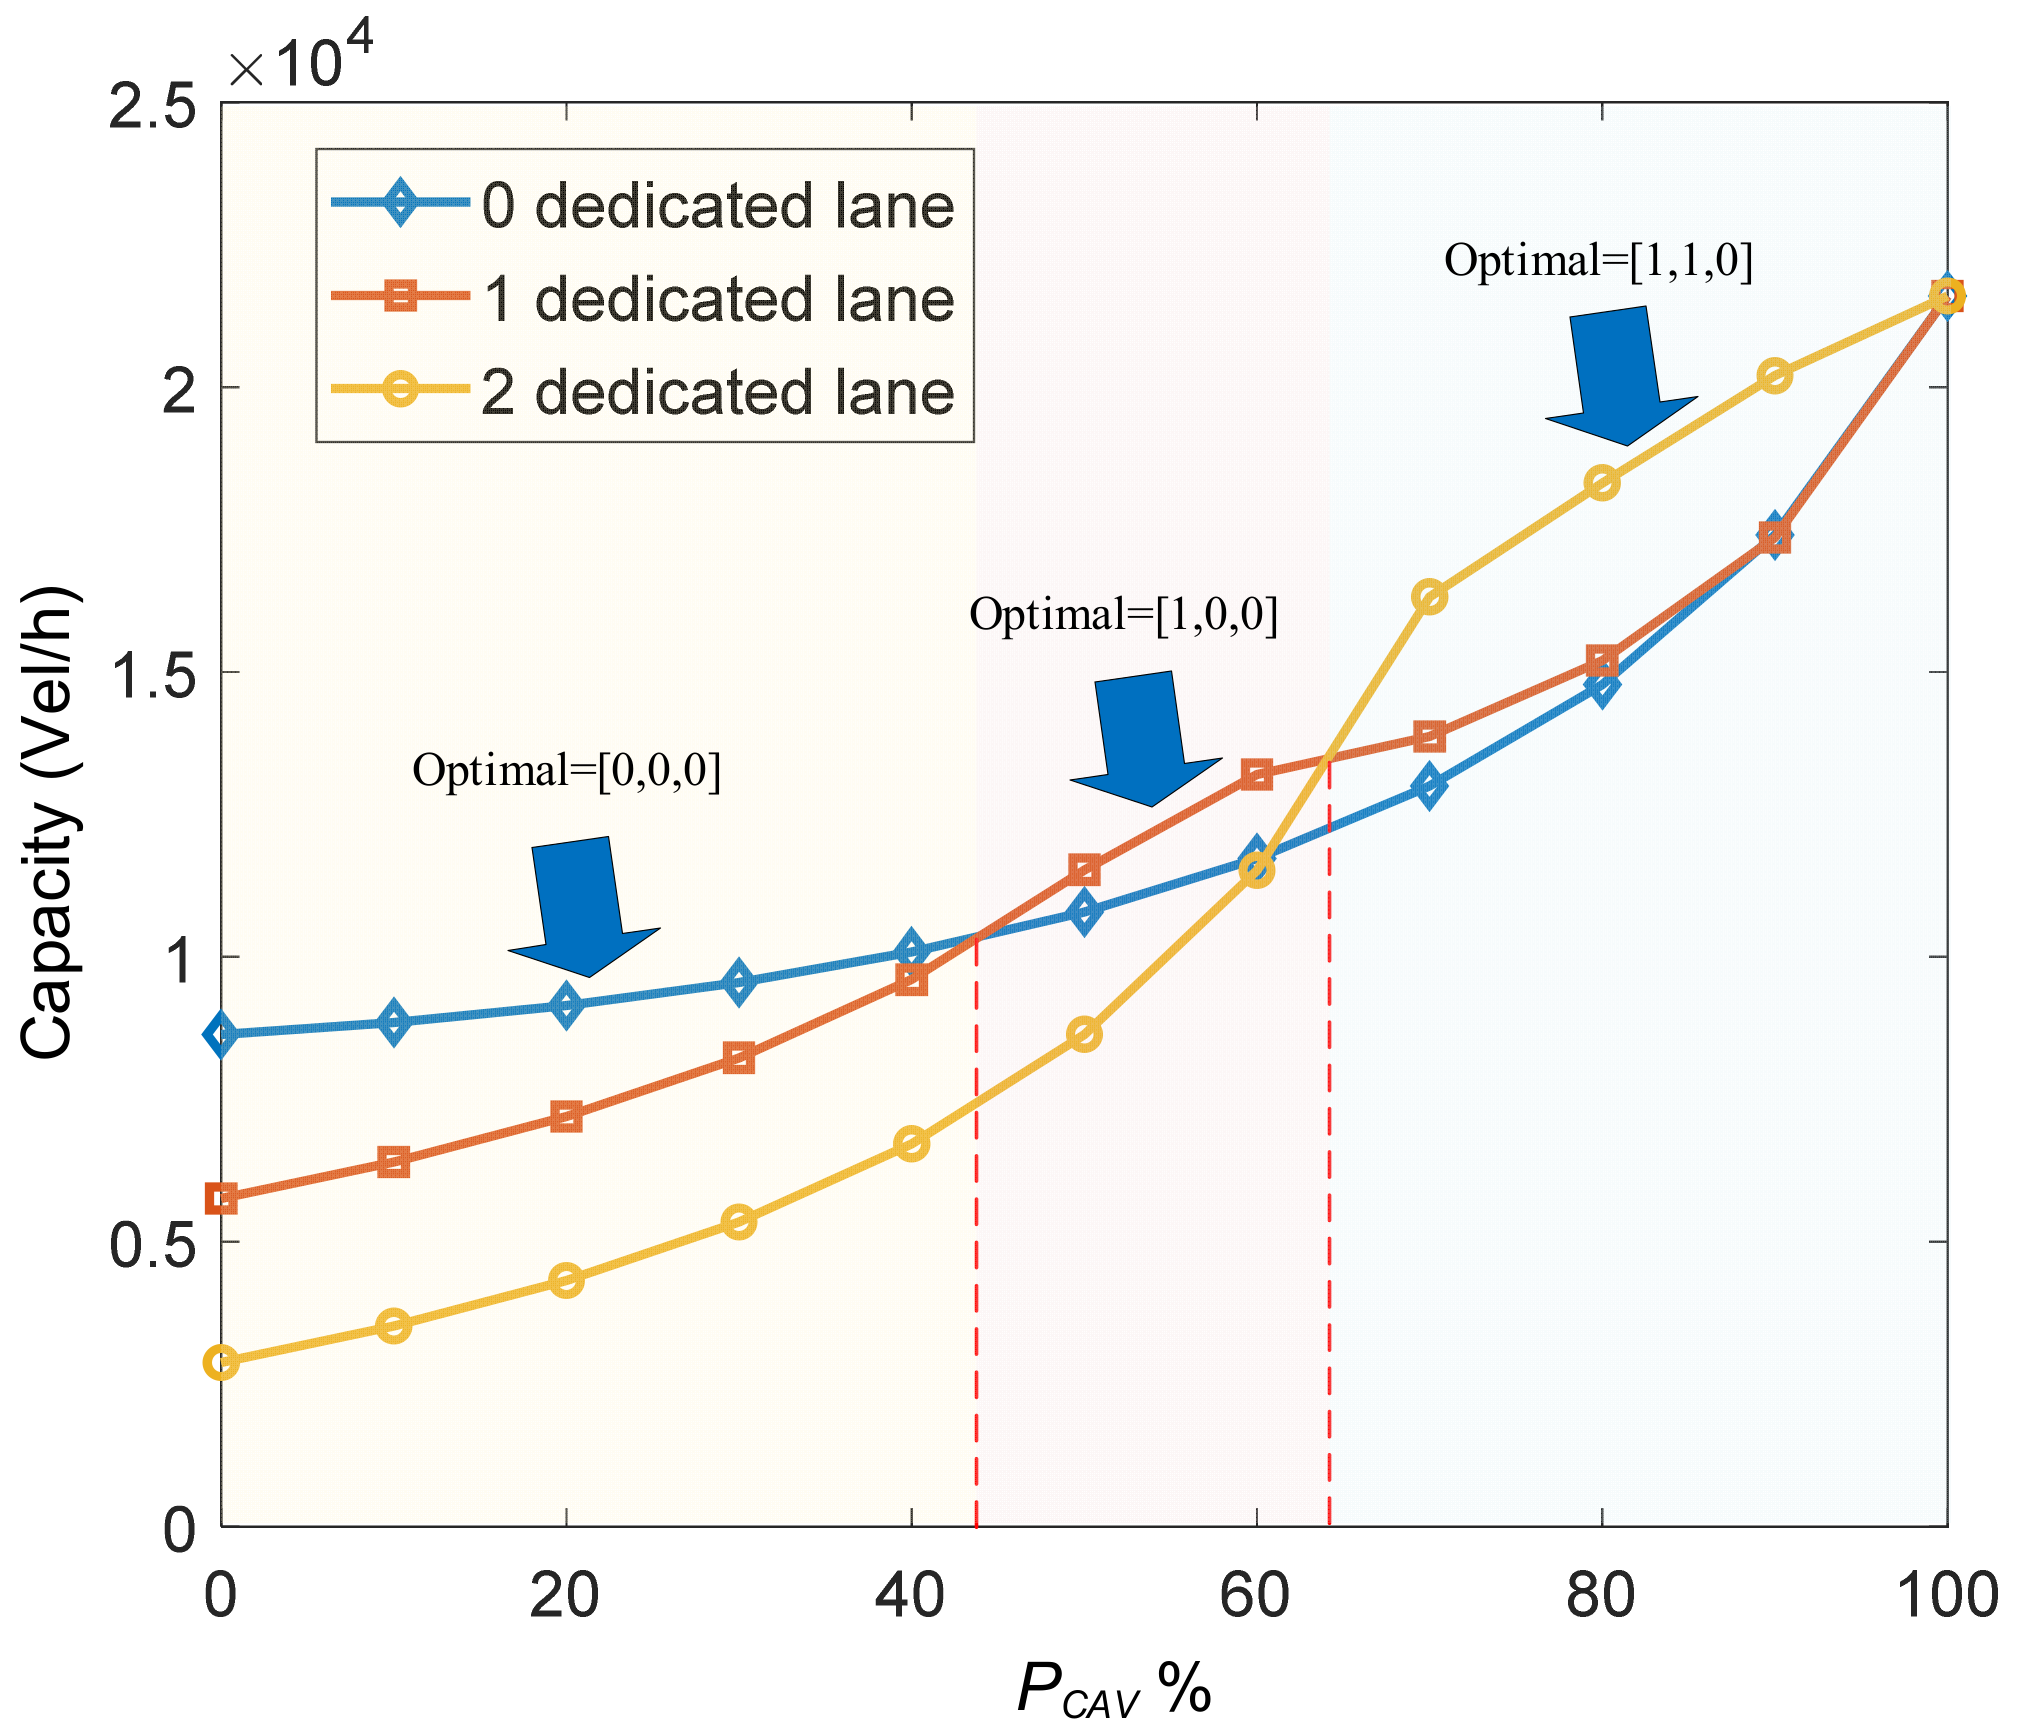
In autonomous and connected vehicle environments, the ROW reallocation (the setting of dedicated lanes for CAVs) should be based on the MPR of CAVs, considering that it can improve the capacity of expressway segments. However, traffic flow should be sufficient enough to fulfill the dedicated lane to saturated (7200 pcu/h), rather than unsaturated levels.

5.2. Future Studies

In this study, we proposed RC estimation and ROW methods for expressways under an MTF of HDVs, AVs, and CAVs; however, for their application, the criteria have few limitations. The capacity formulation only considers a fixed headway. The randomness of the headway and its impacts on the RC and ROW can be studied in future research. A steady flow is ideal because vehicle lane changes, overpasses, and stop-and-go elements exist in real traffic flow; future studies will consider these aspects.

Author Contributions

Conceptualization, C.-J.L. and Z.-H.J.; methodology, C.-J.L.; software, F.-K.W.; supervision, Z.-H.J.; visualization, Z.-Z.W.; writing—Original draft preparation, C.-J.L.; writing—review and editing, T.W. All authors have read and agreed to the published version of the manuscript.

Funding

This research was supported by the National Natural Science Foundation of China, Grant Number 52102377, the China Postdoctoral Science Foundation, Grant Number 2021M701312, and the Fundamental Research Funds for the Central Universities, Grant Number HUST:5003242004. The authors express their sincere gratitude to them.

Data Availability Statement

Data used to support the findings of this study are available from the corresponding author upon reasonable request.

Conflicts of Interest

The authors declare no conflict of interest regarding the publication of this paper.

References

  1. Mitchell, J.D.; Claris, S.; Edge, D. Human-centered mobility: A new approach to designing and improving our urban transport infrastructure. Engineering 2016, 2, 33–36. [Google Scholar] [CrossRef] [Green Version]
  2. Yang, Y.; Yuan, Z.; Chen, J.; Guo, M. Assessment of osculating value method based on entropy weight to transportation energy conservation and emission reduction. Environ. Eng. Manag. J. 2017, 16, 2413–2423. [Google Scholar] [CrossRef]
  3. Kaewunruen, S.; Sresakoolchai, J.; Xiang, Y. Identification of weather influences on flight punctuality using machine learning approach. Climate 2021, 9, 127. [Google Scholar] [CrossRef]
  4. Wang, Y.; Geng, K.; May, A.D.; Zhou, H. The impact of traffic demand management policy mix on commuter travel choices. Transp. Policy 2022, 117, 74–87. [Google Scholar] [CrossRef]
  5. Ma, Z.; Koutsopoulos, H.N.; Liu, T.; Basu, A.A. Behavioral response to promotion-based public transport demand management: Longitudinal analysis and implications for optimal promotion design. Transp. Res. Part A Policy Pract. 2020, 141, 356–372. [Google Scholar] [CrossRef]
  6. Halvorsen, A.; Koutsopoulos, H.N.; Lau, S.; Au, T.; Zhao, J. Reducing subway crowding: Analysis of an off-peak discount experiment in Hong Kong. Transp. Res. Rec. J. Transp. Res. Board 2016, 2544, 38–46. [Google Scholar] [CrossRef] [Green Version]
  7. Zhao, C.; Wang, K.; Dong, X.; Dong, K. Is smart transportation associated with reduced carbon emissions? The case of China. Energy Econ. 2022, 105, 105715. [Google Scholar] [CrossRef]
  8. Li, C.; Ding, L.; Zhong, B. Highway planning and design in the Qinghai–Tibet Plateau of China: A cost–safety balance perspective. Engineering 2019, 5, 337–349. [Google Scholar] [CrossRef]
  9. Liu, M.; Zhao, J.; Hoogendoorn, S.P.; Wang, M. An optimal control approach of integrating traffic signals and cooperative vehicle trajectories at intersections. Transp. B Transp. Dyn. 2021, 1–17. [Google Scholar] [CrossRef]
  10. Decker, C.; Chiambaretto, P. Economic policy choices and trade-offs for Unmanned aircraft systems Traffic Management (UTM): Insights from Europe and the United States. Transp. Res. Part A Policy Pract. 2022, 157, 40–58. [Google Scholar] [CrossRef]
  11. Kaewunruen, S.; Alawad, H.; Omura, T.; Saito, M. Machine learning-aided management of motorway facilities using single-vehicle accident data. SAE Int. J. Transp. Saf. 2021, 9, 205–232. [Google Scholar]
  12. Omura, T.; Kaewunruen, S. Viaduct maintenance for future traffic demands and earthquakes. Infrastruct. Asset Manag. 2020, 7, 256–268. [Google Scholar] [CrossRef]
  13. Fagnant, D.J.; Kockelman, K. Preparing a nation for autonomous vehicles: Opportunities, barriers and policy recommendations. Transp. Res. Part A Policy Pract. 2015, 77, 167–181. [Google Scholar] [CrossRef]
  14. Rad, S.R.; Farah, H.; Taale, H.; van Arem, H.; Hoogendoorn, S.P. Design and operation of dedicated lanes for connected and automated vehicles on motorways: A conceptual framework and research agenda. Transp. Res. Part C Emerg. Technol. 2020, 117, 102664. [Google Scholar]
  15. Shi, X.; Li, X. Empirical study on car-following characteristics of commercial automated vehicles with different headway settings. Transp. Res. Part C Emerg. Technol. 2021, 128, 103134. [Google Scholar] [CrossRef]
  16. Grabbe, N.; Kellnberger, A.; Aydin, B.; Bengler, K. Safety of automated driving: The need for a systems approach and application of the functional resonance analysis method. Saf. Sci. 2020, 126, 104665. [Google Scholar] [CrossRef]
  17. Yang, Y.; Yuan, Z.; Meng, R. Exploring traffic crash occurrence mechanism towards cross-area freeways via an improved data mining approach. J. Transp. Eng. Part A Syst. 2022. [Google Scholar] [CrossRef]
  18. Yang, Y.; He, K.; Wang, Y.; Yuan, Z.; Yin, Y.; Guo, M. Identification of dynamic traffic crash risk for cross-area freeways based on statistical and machine learning methods. Phys. A Stat. Mech. Its Appl. 2022, 595, 127083. [Google Scholar] [CrossRef]
  19. Liu, R.; Stefanovich, A.; Kaewunruen, S. Sensitivity of a highspeed rail development on supply chain and logistics via air-rail-road freight transportation. Front. Built Environ. 2021, 7, 685884. [Google Scholar] [CrossRef]
  20. Mahmassani, H.S. 50th anniversary invited article—Autonomous vehicles and connected vehicle systems: Flow and operations considerations. Transp. Sci. 2016, 50, 1140–1162. [Google Scholar] [CrossRef]
  21. Olia, A.; Razavi, S.; Abdulhai, B.; Abdelgawad, H. Traffic capacity implications of automated vehicles mixed with regular vehicles. J. Intell. Transp. Syst. 2018, 22, 244–262. [Google Scholar] [CrossRef]
  22. Ghiasi, A.; Li, X.; Ma, J. A mixed traffic speed harmonization model with connected autonomous vehicles. Transp. Res. Part C Emerg. Technol. 2019, 104, 210–233. [Google Scholar] [CrossRef]
  23. Wang, C.; Xie, Y.; Huang, H.; Liu, P. A review of surrogate safety measures and their applications in connected and automated vehicles safety modeling. Accid. Anal. Prev. 2021, 157, 106157. [Google Scholar] [CrossRef] [PubMed]
  24. Ghiasi, A.; Hussain, O.; Qian, Z.S.; Li, X. A mixed traffic capacity analysis and lane management model for connected automated vehicles: A Markov chain method. Transp. Res. Part B Methodol. 2017, 106, 266–292. [Google Scholar] [CrossRef]
  25. Highway Capacity Manual: A Guide for Multimodal Mobility Analysis, 6th ed.; The National Academies Press: Washington, DC, USA, 2016.
  26. Chen, Z.; He, F.; Yin, Y.; Du, Y. Optimal design of autonomous vehicle zones in transportation networks. Transp. Res. Part B Methodol. 2017, 99, 44–61. [Google Scholar] [CrossRef] [Green Version]
  27. Wang, J.; Lu, L.; Peets, S.; He, Z. Optimal toll design problems under mixed traffic flow of human-driven vehicles and connected and autonomous vehicles. Transp. Res. Part C Emerg. Technol. 2021, 125, 102952. [Google Scholar] [CrossRef]
  28. Bahrami, S.; Roorda, M.J. Optimal traffic management policies for mixed human and automated traffic flows. Transp. Res. Part A Policy Pract. 2020, 135, 130–143. [Google Scholar] [CrossRef]
  29. Lazar, D.A.; Biyik, E.; Sadigh, D.; Pedarsani, R. Learning how to dynamically route autonomous vehicles on shared roads. Transp. Res. Part C Emerg. Technol. 2021, 130, 103258. [Google Scholar] [CrossRef]
  30. Chen, D.; Ahn, S.; Chitturi, M.; Noyce, D.A. Towards vehicle automation: Roadway capacity formulation for traffic mixed with regular and automated vehicles. Transp. Res. Part B Methodol. 2017, 100, 196–221. [Google Scholar] [CrossRef] [Green Version]
  31. Van den Berg, V.A.; Verhoef, E.T. Autonomous cars and dynamic bottleneck congestion: The effects on capacity, value of time and preference heterogeneity. Transp. Res. Part B Methodol. 2016, 94, 43–60. [Google Scholar] [CrossRef]
  32. Sala, M.; Soriguera, F. Capacity of a freeway lane with platoons of autonomous vehicles mixed with regular traffic. Transp. Res. Part B Methodol. 2021, 147, 116–131. [Google Scholar] [CrossRef]
  33. Zhao, L.; Sun, J. Simulation framework for vehicle platooning and car-following behaviors under connected-vehicle environment. Procedia Soc. Behav. Sci. 2013, 96, 914–924. [Google Scholar] [CrossRef] [Green Version]
  34. Schoenmakers, M.; Yang, D.; Farah, H. Car-following behavioural adaptation when driving next to automated vehicles on a dedicated lane on motorways: A driving simulator study in the Netherlands. Transp. Res. Part F Psychol. Behav. 2021, 78, 119–129. [Google Scholar] [CrossRef]
  35. Milanés, V.; Shladover, S.E. Modeling cooperative and autonomous adaptive cruise control dynamic responses using experimental data. Transp. Res. Part C Emerg. Technol. 2014, 48, 285–300. [Google Scholar] [CrossRef] [Green Version]
  36. Zhong, Z.; Lee, J.; Zhao, L. Traffic flow characteristics and lane use strategies for connected and automated vehicles in mixed traffic conditions. J. Adv. Transp. 2021, 2021, 8816540. [Google Scholar] [CrossRef]
  37. Li, T.; Guo, F.; Krishnan, R.; Sivakumar, A.; Polak, J. Right-of-way reallocation for mixed flow of autonomous vehicles and human driven vehicles. Transp. Res. Part C Emerg. Technol. 2020, 115, 102630. [Google Scholar] [CrossRef]
  38. SAE International. Taxonomy and Definitions for Terms Related to Driving Automation Systems for on-Road Motor Vehicles; (J3016); SAE International: Warrendale, PA, USA, 2016. [Google Scholar]
  39. Neubert, L.; Santen, L.; Schadschneider, A.; Schreckenberg, M. Single-vehicle data of highway traffic: A statistical analysis. Phys. Rev. E 1999, 60, 6480–6490. [Google Scholar] [CrossRef] [Green Version]
  40. Fancher, P.; Bareket, Z.; Ervin, R. Human-centered design of an acc-with-braking and forward-crash-warning system. Veh. Syst. Dyn. 2003, 36, 203–223. [Google Scholar] [CrossRef]
  41. Liu, H.; Kan, X.; Shladover, S.E.; Lu, X.-Y.; Ferlis, R.E. Modeling impacts of Cooperative Adaptive Cruise Control on mixed traffic flow in multi-lane freeway facilities. Transp. Res. Part C Emerg. Technol. 2018, 95, 261–279. [Google Scholar] [CrossRef]
  42. Bose, A.; Ioannou, P.A. Analysis of traffic flow with mixed manual and semiautomated vehicles. IEEE Trans. Intell. Transp. Syst. 2003, 4, 173–188. [Google Scholar] [CrossRef] [Green Version]
  43. Wang, Z.; Chen, X.; Ouyang, Y.; Li, M. Emission mitigation via longitudinal control of intelligent vehicles in a congested platoon. Comput.-Aided Civ. Infrastruct. Eng. 2015, 30, 490–506. [Google Scholar] [CrossRef]
  44. Xiao, L.; Wang, M.; Schakel, W.; van Arem, B. Unravelling effects of cooperative adaptive cruise control deactivation on traffic flow characteristics at merging bottlenecks. Transp. Res. Part C Emerg. Technol. 2018, 96, 380–397. [Google Scholar] [CrossRef]
  45. Rahman, M.S.; Abdel-Aty, M. Longitudinal safety evaluation of connected vehicles’ platooning on expressways. Accid. Anal. Prev. 2018, 117, 381–391. [Google Scholar] [CrossRef] [PubMed]
Figure 1. Four scenarios of car-following modes.
Sustainability 14 05193 g001
Figure 2. Different CAV degeneration cases.
Sustainability 14 05193 g002
Figure 3. Monte-Carlo-based simulation framework.
Sustainability 14 05193 g003
Figure 4. Average RC value according to the penetration rate.
Sustainability 14 05193 g004
Figure 5. Relationship between RC and the MPR of AVs and CAVs.
Sustainability 14 05193 g005
Figure 6. RC distribution under different PRs: P H D V : P A V : P C A V = (a) 90%:5%:5%, (b) 60%:20%:20%, (c) 30%:35%:35%, (d) 30%:10%:60%, and (e) 30%:60%:10%.
Sustainability 14 05193 g006
Figure 7. Right-of-way management cases.
Sustainability 14 05193 g007
Figure 8. Impact of a dedicated lane on capacity ( P H D V : P A V = 1:1).
Sustainability 14 05193 g008
Table 1. List of variables used in this paper.
VariableDescription
HDV(s)Human-driven vehicle(s)
AV(s)Autonomous vehicle(s)
CAV(s)Connective-and-autonomous vehicle(s)
RCReserved capacity
P H D V Penetration rate of HDVs in MTF
P A V Penetration rate of AVs in MTF
P C A V Penetration rate of CAVs in MTF
P h H D V Probability headway of h H D V occurring
P h A V Probability headway of h A V occurring
P h C A V Probability headway of h C A V occurring
h ¯ Average critical headway per cycle
C H D V Capacity with only HDVs
C M T F Capacity of MTF
C R E S Reserved capacity
Table 2. Capacity under variable CAV-dedicated lane settings.
Lane Number123123123
M P R ( P H D V : P A V : P C A V ) NoNoNoYesNoNoYesYesNo
(50:50:0)288028802880028802880002880
(45:45:10)2949.52949.52949.5640288028803203202880
(40:40:20)3049304930491440288028807207202880
(35:35:30)3183.23183.23183.2246928802880123412342880
(30:30:40)336133613361384028802880192019202880
(25:25:50)3596.43596.43596.4576828802880288028802880
(20:20:60)3908.63908.63908.6720030003000432043202880
(15:15:70)4332.34332.34332.3720033333333672067202880
(10:10:80)4926.64926.64926.6720040004000720072003920
(5:5:90)580258025802720050805080720072005800
(0:0:100)720072007200720072007200720072007200
Publisher’s Note: MDPI stays neutral with regard to jurisdictional claims in published maps and institutional affiliations.

