1. Introduction
The trend of mass customization and the need in industry for producing lightweight parts of increasingly complexity in terms of overall shape or tailor-designed features is challenging the manufacturing industry in significantly pushing production chains to their limits in a time known as the 4th Industrial Revolution [
1]. In this view, the need for providing products and/or services that best fit consumption needs while maintaining near mass production efficiency is of great importance [
2].
In view of the above, one technology that is nowadays standing out as a key enabler for flexible production of tailor-made end-use components with sophisticated shapes/features is Additive Manufacturing (AM) [
3]. Although originally used to produce prototypes, AM it is nowadays utilized to produce fully dense parts for state-of-the-art applications in a wide variety of materials ranging from plastics, organics, ceramics and composites to metals [
4]. In case of metals, the most widespread AM processes belong to the categories of Powder Bed Fusion (PBF) and Direct Energy Deposition (DED) [
5].
PBF processes work by selectively melting several beds of metallic powder placed over a platform layer-by-layer for shaping the final part. These processes use focused thermal heat sources in form of lasers or electron beams to allow printing complex parts with high resolution. However, PBF is largely affected by drawbacks associated to expensive energy and raw material consumptions, complex and costly equipment, limited envelops and to the necessity of using support structures that can be arduous or even impossible to remove [
6].
DED processes make use of feedstock (which can be powder or wire) that is fed and melted instantaneously with the combined action of a thermal heat source and a feedstock supply unit. Moreover, DED offers the possibility of utilizing an alternative and much cheaper heat source in the form of an electric arc. This variant is designated as wire-arc additive manufacturing (
WAAM) and has been attracting some attention over the years from the manufacturing sector due to its accessible and sustainable use to fabricate large scale parts with high deposition rates, low-cost equipment and high material efficiency [
7]. In addition, the acquisition costs of
WAAM equipment may even be negligible since most companies already have at their disposal the necessary electric arc welding and computer numeric control (
CNC) motion systems [
8].
Nowadays, the applicability of
WAAM is rising in accordance to the increasingly worldwide profits of metal AM [
9]. Examples of such can be found in parts assembled in the jet airline model Boeing 787 Dreamliner [
10], structural components such as full bridges made by MX3D [
11], pressure vessels for space exploration by Thales Alenia Space [
12], among others. However,
WAAM is still in its infant stage in terms of state-of-the-art implications concerning deposition strategies, parametrization, part quality or new materials, all of which are currently under extensive investigation [
13]. Moreover, the economic and environmental performance of
WAAM are key points in forecasting and settling on further applications of this technology as an efficient and sustainable alternative to conventional manufacturing technologies.
In terms of cost evaluation, some studies have been published in recent years surrounding AM processes with comparisons to other manufacturing technologies such as [
14,
15,
16] addressing several AM processes such as Direct Metal Laser Sintering, Electron Beam Melting, Stereolithography, Fused Deposition Modeling, among others [
17]. Regarding
WAAM, the first cost model, to the authors concern, was developed by Martina and Williams [
18] to compare the cost of a titanium part produced by
WAAM or by a conventional manufacturing chain of machining from solid. The overall cost modelling was time activity based for simplifying deposition times as a function of the CAD model volume and the buy-to-fly (
BTF) ratio to estimate the specific cost of each process variable. The authors concluded that
WAAM can achieve cost savings in the range of 7% to 69%. However, this cost model is not robust because it excessively simplifies the operator actions by considering only one operator per machine while not also accounting for important non-production tasks such as consumable changeovers.
More recently, another
WAAM cost model was proposed by Cunningham et al. that particularizes in studying the main process activities apiece by sensitivity analysis [
19]. This cost model is more robust than the previous developed by Martina and Williams because it considers other process chain variables, such as those involving baseplate preparation, part inspection or post-processing by heat treatment. However, the cost model does not consider dynamic on-off modifications such as those concerning consumables, overhead costs, different materials and variable labor.
Adding to the necessity of designing more complete and robust cost models for
WAAM, the available literature on this technology still lacks a clear combined-effect assessment of cost and environmental impact that are crucial to ensure a proper process planning and design [
20].
Under these circumstances, this work aims to investigate on the economic and environmental benefits that WAAM may bring in the near future. For this purpose, the state-of-the-art developments mentioned above will be extended with the establishment of a comprehensive process-based cost model (PBCM) for WAAM. In addition to metal deposition activities, the proposed model englobes other manufacturing stages that are intrinsic to a typical WAAM processing chain, such as machining operations, and allows inputting labor, materials, energy, equipment and building variables for the different manufacturing stages. Afterwards, the PBCM is tested with the fabrication of a case study part and the results are compared against those obtained using a traditional subtractive approach (machining). The environmental impact will be estimated by means of Life Cycle Assessment (LCA) in the ReCiPe midpoint and endpoint levels. All in all, the proposed PBCM for a WAAM chain improves on previous ones in terms of robustness and capability of reacting to industry market dynamics. The cost performance results combined with those from LCA highlight the economic viability and environmental friendliness of WAAM when compared with conventional manufacturing technologies.
2. Methodologies
2.1. WAAM Processing Chain
The working principles of
WAAM involve layer-by-layer deposition in which an electric arc is used as thermal energy source for melting the wire feedstock [
21]. However, although metal deposition constitutes the core stage of the process, a typical
WAAM production chain possesses other stages that are crucial for ensuring proper quality standards of metal parts. The best example of such corresponds to the utilization of machining operations because quality of as-built parts produced by
WAAM can be very rough in terms of surface quality and geometric precision which are far from conventional quality standards of end-use metal parts [
22].
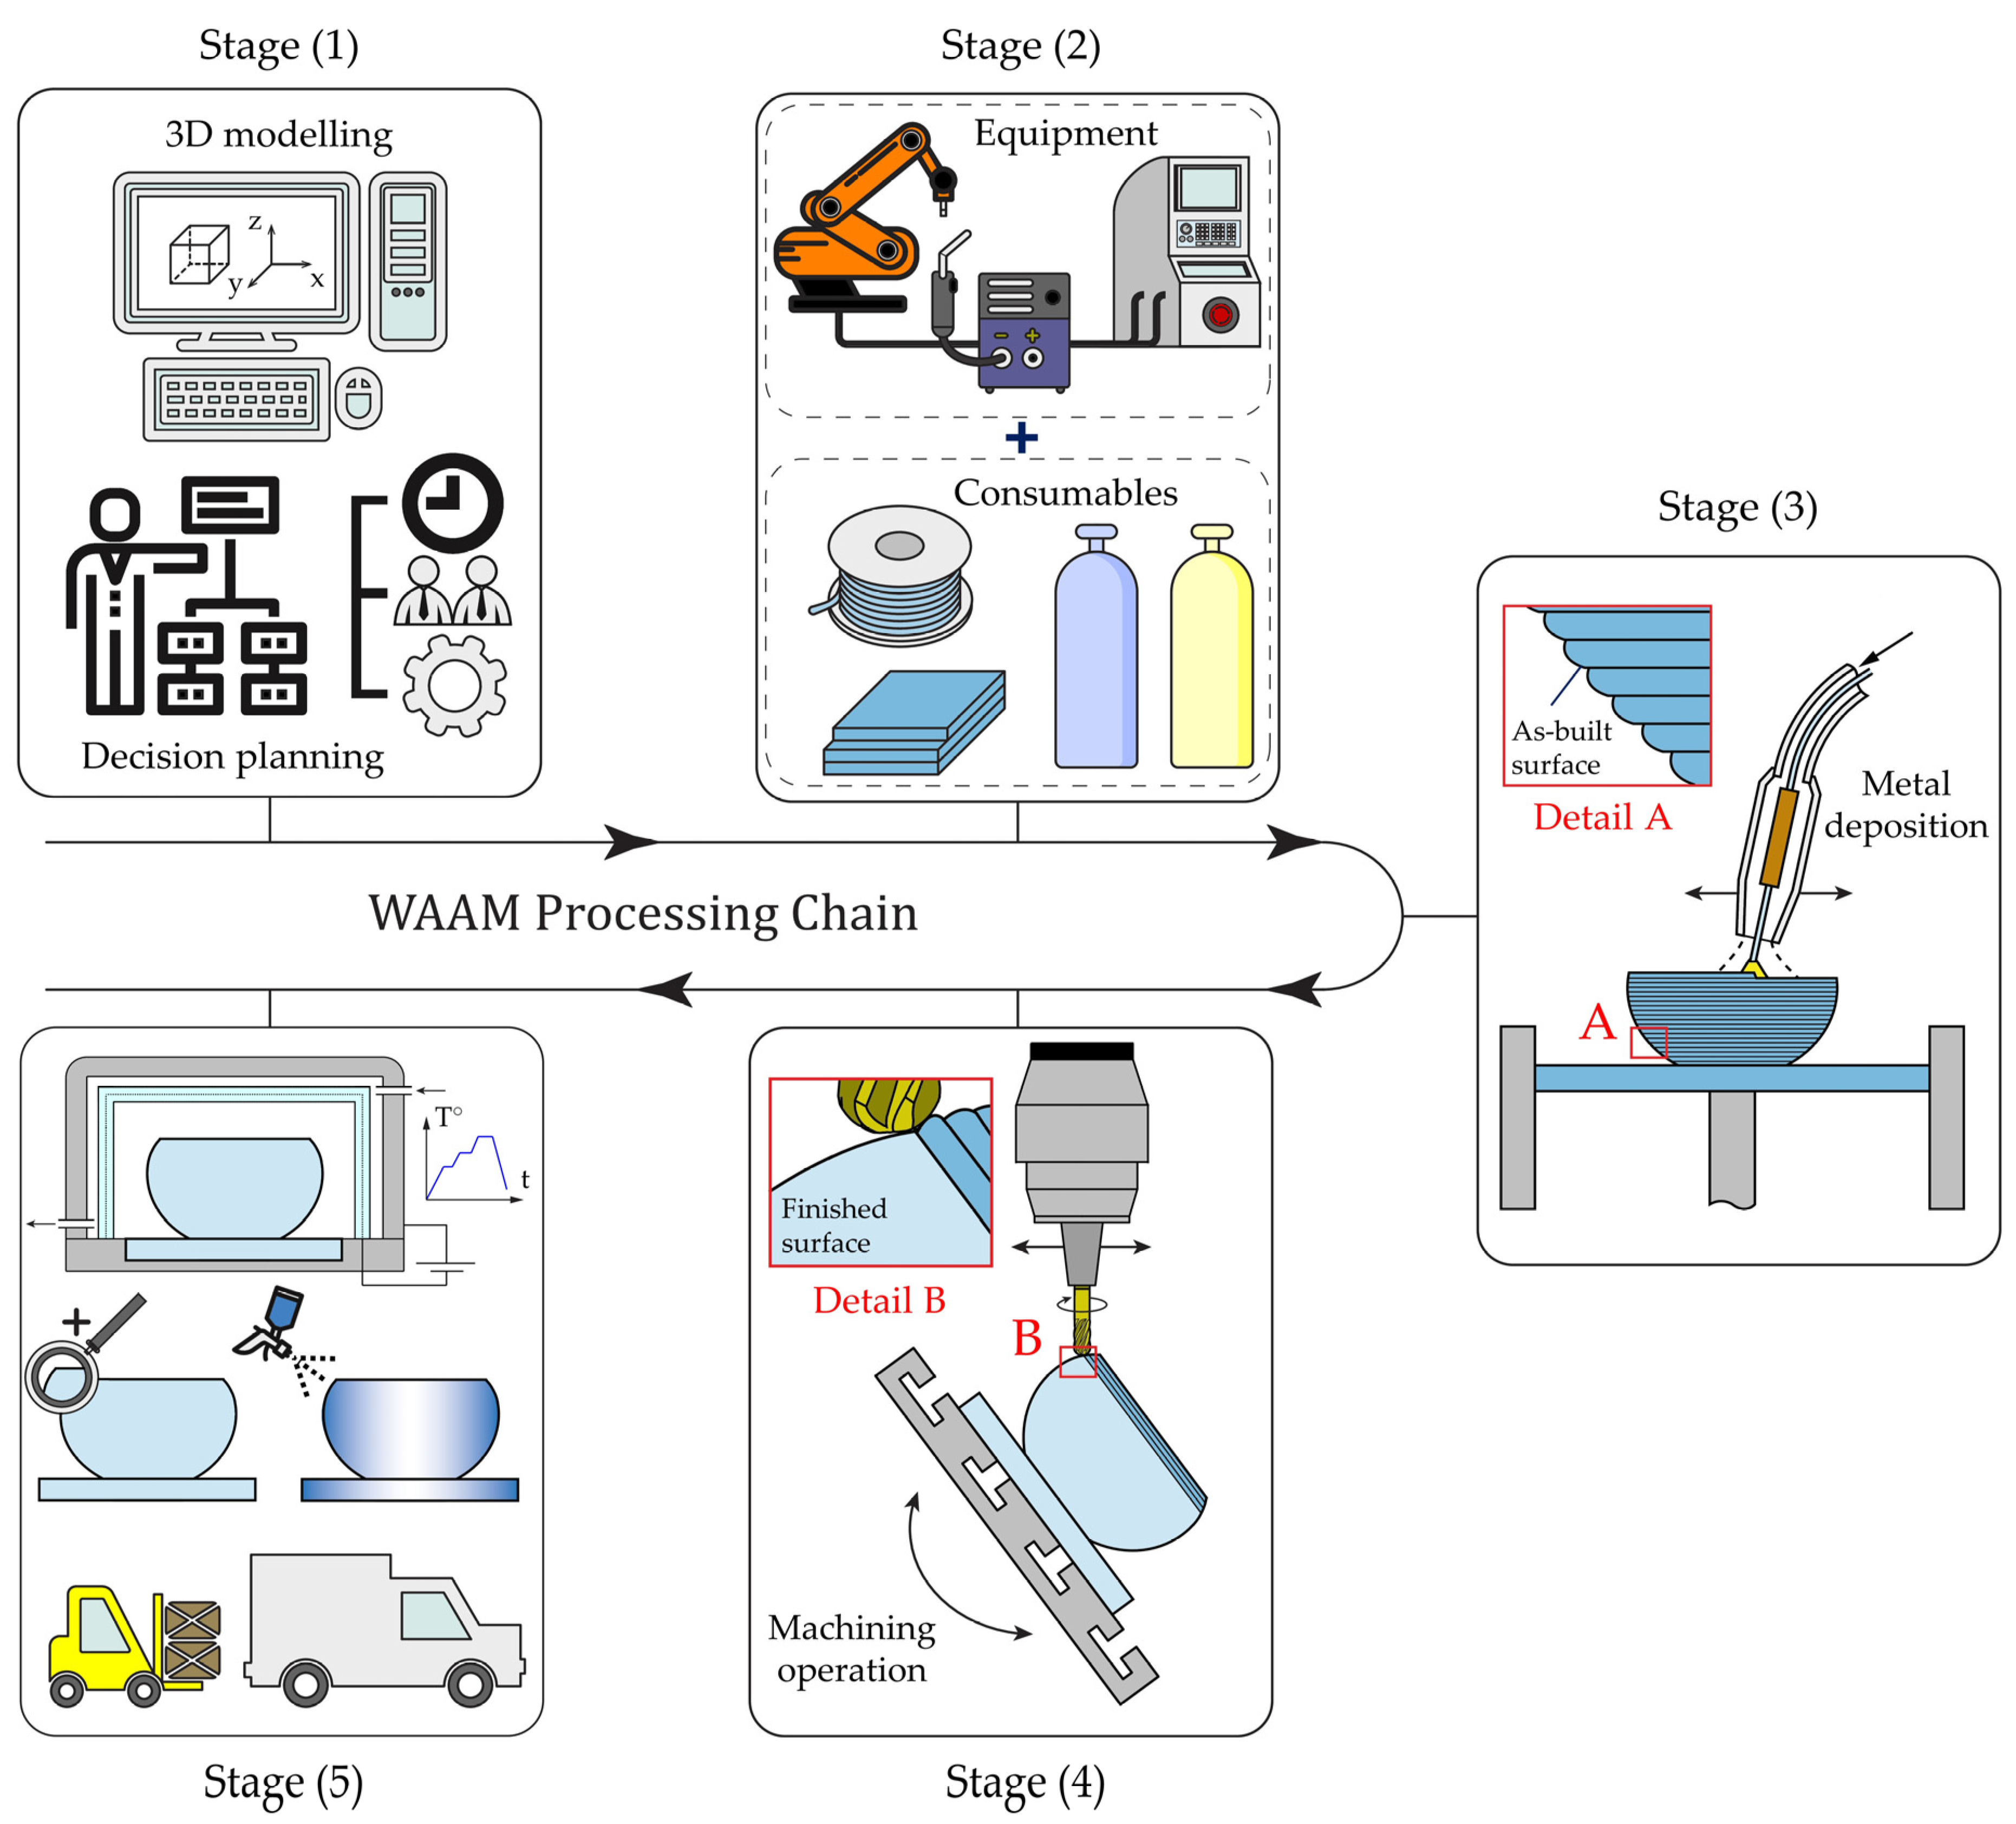
Figure 1 presents a flow map of a typical
WAAM processing chain which can be decomposed in five stages: (1) pre-processing, (2) equipment setup, (3) metal deposition by
WAAM; (4) machining and (5) post-processing.
The pre-processing stage (1) concerns all tasks involved in modelling and planning the following four stages. Examples of these tasks are 3D part modelling, choosing the adequate processing parameters or designing the deposition strategy to be used during stage (3).
The equipment setup stage (2) is implemented in-site and involves setting up the machines, preparing and clamping the baseplate and installing the process consumables such as wire feedstock and shielding gas. In a typical WAAM processing chain, three main machines are needed: (i) the power unit that feeds and simultaneously melts the wire feedstock, (ii) the motion system to move the torch in pre-defined regions for depositing metal and (iii) the machining center to be used in stage (4) of the chain.
The metal deposition stage (3) is where a near-net-shape part is built according to the strategies and processing parameters established in the previous stages.
The machining stage (4) is where the near-net-shape part will be shaped into one with the required geometric precision, dimensional tolerances, and surface quality. Additionally, this stage may also account for other cutting tasks such as those used for sawing the deposited part from the baseplate if needed.
Finally, a WAAM processing chain reaches its end with a post-processing stage (5). This stage does not include any machining operations but instead other closure tasks such as heat treatments, polishing, part inspection, painting, transportation, among others.
From all five stages schematized in
Figure 1, stages (2), (3) and (4) are the most exclusive ones of the AM technology with special regard to
WAAM. In fact, stages (1) and (5) involving pre and post processing are also customary in conventional manufacturing technologies such as machining from a solid or casting. Moreover, the duration and strictness level of both these stages are highly dependent on not only the part itself but also on its intended industrial applicability context. For these reasons, stages (1) and (5) are not included in the proposed PBCM which in turn will enable a more suitable and fair comparison between
WAAM and conventional manufacturing technologies.
2.2. Cost Model Analysis
The development of a PBCM for the main three stages of a
WAAM processing chain (refer to stages (2), (3) and (4) shown in
Figure 1) is aimed at fulfilling the following three main aspects: (i) to establish a strong relation between process, resources, product, equipment and other cost-based variables; (ii) to ensure its simple and accessible reproducibility within different scenarios and (iii) to be capable of reacting to sudden or predicted changes in the overall workflow.
The PBCM will be mostly based on the pre-defined annual production that allows outputting the total annual costs
which are estimated as the sum of fixed costs
with variable costs
,
2.2.1. Fixed Costs
The fixed costs included in the PBCM are those that are not directly associated with the annual production of goods. These costs do not change during the production cycle and can be obtained by summing up cost activities associated to equipment, building use and administration overheads,
The equipment costs
englobe expenses on machines, maintenance, devices, fixtures and tools, which can be further divided into the following three terms,
The first term refers to the acquisition costs of the three main machines utilized in a typical
WAAM processing chain: an electric arc welding power source, a motion system and a
CNC machining center. These investments are dependent on the cost of opportunity and years of life
associated with each machine as well as to their usability as dedicated or non-dedicated equipment. In cases where the machines are non-dedicated, their investments
must be multiplied by their utilization rate
as follows,
where
is the total cycle time, AP is the annual production (number of parts per year), RR is the rejection rate (%) and
is the machine uptime given by the multiplication of the annual working days with the machine daily utility time. Equation (4) is computed for both metal deposition and machining stages separately by inserting their respective machine investments and corresponding cycle times
and
. The acquisition of special-purpose devices such as torches or alignment devices, among others, should be included in the first term of Equation (3).
The second term of Equation (3) is for accounting costs associated with the tools needed in the main stages of the
WAAM processing chain. In this parcel, the costs will be mainly dependent on the acquisition of machining tools due to their limited tool lifetime [Park, 2020] and can be estimated as follows,
where
is the number of cutting tools,
is the acquisition cost for each cutting tool,
is the actual cutting time and
is the tool lifetime. Additionally, tooling costs can also include those spent on tool holders and fixtures or jigs used for clamping the workpiece for both metal deposition and machining tasks (
in Equation (5)).
The third and final term of Equation (3) allocates expenses related to annual maintenance activities on the three main machines used in a WAAM chain. These include cleaning, lubrification and replacement of worn-off accessories such as torch contact tips and nozzles for maintaining the mechanical assets of the machines.
The remaining two terms involved in the fixed costs (refer to Equation (2)) are related to building use and administration overheads. Building use expenses
are estimated as a function of the yearly rent rate (YRR, €/m
2), the machinery area (MA, m
2) and the utilization rate (UR),
The overheads costs are not directly spent on the processing chain but are allocated to the industrial/fixed structure, not directly related with the production line.
2.2.2. Variable Costs
The variable costs are those that show a direct dependence on the annual production of the desired goods. These costs correspond to the sum of expenses associated with the following three main groups: materials, labor and energy,
The term
accounts for metals and consumables such as wire feedstock, baseplate and shielding gas needed for carrying out the main stages of the production chain. These costs are presented per unit while also accounting for material expenses spent on rejected parts with the inclusion of the rejection rate RR (%),
The first term of Equation (8) englobes costs associated with the wire feedstock. This consumable is mostly bought in coils (similarly to electric arc welding applications) with a given unit cost and mass related to the density of the chosen metal alloy. Differences in part volume after deposition (as-built part) and after machining (final part) are conveyed by the Buy-to-Fly ratio (BTF) which corresponds to the ratio between the as-built part volume and the final part volume. As seen, the proposed PBCM allows inputting variables for different metal alloys given their corresponding material properties and unit acquisition cost, where the latter can vary from company to company.
The second term accounts all costs related to the baseplate material. This term is expressed in a similar way to that of the wire feedstock by being dependent of the acquisition unit cost and of its mass and density . The effective baseplate volume needed for supporting metal deposition of one part and its number of uses are also expressed. In cases where the baseplate is designed as a segment of the final part, it cannot be reusable (i.e., ).
The third term is related to shielding gas consumables needed for protecting the molten metal from environmental contaminations during depositions. These consumables are usually acquired in gas cylinders or tanks with a given cost
and gas volume
. Since this consumable is only being used when metal deposition is taking place, its expenses are dependent on the gas flow rate
and deposition time
, where the first is a processing parameter of
WAAM and the second can be determined as a function of the wire feed speed
WFS and diameter
as follows,
The term
of Equation (7) considers incomes from waste management resulting from metal deposition tasks or machining tasks to scrap processing companies,
As seen, these incomes will be highly dependent on the waste income per volume and include all solid wastes in the form of rejected parts for both manufacturing stages and as well as metal chips that come from machining stages by means of the parameter () multiplied by the part volume .
The labor costs were considered only for operators directly involved in the different stages of a
WAAM processing chain. These costs are estimated as follows,
where
corresponds to annual direct wages of the total number of operators directly involved in the production chain. The variables inside the brackets correspond to different time-consuming stages that will be disclosed apiece.
The first input
is given by the sum of the deposition time
with the cooling time
as follows,
The cooling time (also known as dwell time) englobes all idle times taking place in between the deposition of material layers. The rightmost coefficient WD corresponds to the worker dedication percentage (in this case, during metal deposition by WAAM).
The second input
is the total machining time which considers two main components: the actual cutting time and idle times
. The first component implies contact between the workpiece and the cutting tool, while the other compiles all non-productive times such as those used for tool changeovers. This allows retrieving the following equation,
where
MRR is the material removal rate and
accounts for all non-productive times.
The third and final input of Equation (11) regards setup tasks involved in the operation of the
WAAM and machining equipment and can be calculated with the following equation,
As seen, the overall setup time is calculated per part and is affected by the time it takes to set up both WAAM and machining equipment (inputting and compiling the CNC programs, machine offsetting, workpiece clamping, and other minor tasks). The term “Parts per clamping” is to account for the number of parts that can be fabricated in a single baseplate clamping (i.e., within the same setup time). Changeover times for replacing the wire coils and the gas bottle/tank with new ones are also considered.
The expenses related to energy consumptions needed for operating the main machines of the
WAAM production chain are obtained from the multiplication of the main power consumptions in
WAAM and machining operations (
and
, respectively) with their consumed time and with the monetary price of energy
,
Since the main WAAM power consumption (welding power source + motion system) comes from the instants where metal deposition is taking place, only the deposition time is considered. For machining operations, the total machining time is used because the machining center is not only fully operating during the actual cutting time but also during tool changing times and idle times as well.
2.3. Life Cycle Assessment
The evaluation of the environmental aspects and potential impacts associated with the implementation and utilization of the WAAM processing route was developed following the Life Cycle Assessment (LCA) methodology. Although being a life cycle methodology, allowing for cradle to grave analyses of products (Ribeiro, 2020), this tool allows estimating the environmental performance of a process by adopting a cradle to gate scope, that is, analyzing only the raw material extraction and manufacturing phases.
The net of resources to be considered in the LCA of
WAAM comprise the wire feedstock material, the baseplate material, the shielding gas and the sources of the electricity generation with resources and emissions taken from the Ecoinvent 3.7 database representing global averages. The environmental impact is quantified and later analyzed into different impact categories using the ReCiPe2016 method [
23] in SimaPro 7 software developed by PRé Consultants, based in the Netherlands. Firstly, the ReCiPe Midpoint (H) V1.11/World Recipe H is used for transforming and evaluating the list of life cycle inventory under midpoint indicators among the chosen environmental impact categories to be presented. Afterwards, the ReCiPe Endpoint (H) V1.11/World ReCiPe H/H method is also used for assessing the impacts into three main indicators: human health, ecosystems and resources.
3. Case Study
This section is structured in four different studies that make use of the established PBCM for evaluating the economic and environmental performance of
WAAM. The starting point for these studies was on the production of a case study part schematized and illustrated in
Figure 2a,b. The main processing parameters used for building the case study part were established in a previous work from the authors [
24]. Since the proposed PBCM is based upon a volume-dependent approach, the reachable geometric complexity of as-built parts implies knowing beforehand on the most suitable deposition strategies by means of parametrization studies.
The first study is focused on presenting total production costs in WAAM for the main purpose of pointing out its main cost drivers. The second study comprises a sensitivity analysis to allow identifying the key fluctuations in production costs lead by modifications in the PBCM inputs. The third study is on assessing the economic viability of WAAM by comparing the proposed PBCM results with those obtained from a traditional subtractive approach by machining from solid. The fourth and final study is on analyzing the environmental viability of WAAM through LCA to allow concluding on its sustainability.
The case study part was firstly deposited by
WAAM in a three-axis
CNC gantry equipped with the gas metal arc welding power source LUC 400 Aristo 400 (from ESAB, Fulton, MD, USA). The materials used were AISI 316L stainless steel wire feedstock with 1 mm diameter, AISI 316L stainless steel hot-rolled baseplates with 15 mm thickness and a high-purity (99.99%) Argon gas for shielding purposes. The mechanical and metallurgical properties of AISI 316L stainless steel obtained by
WAAM can be found elsewhere [
25].
Machining tasks were carried out in the five axis universal milling machine DMU 50 incorporated with a rigid swivel rotary table for finishing the part in a single workpiece clamping within a machining time of 30 min. The total cycle times for each manufacturing stage were of min and min.
Times spent on metal deposition by
WAAM and on machining
were measured onsite. Power consumptions in all three-phase three-wire circuits were assessed with the power meter PROVA 6830 equipped with clamp-on ammeters and voltage test leads. The consumptions were recorded in 2 s time intervals with a resolution of 0.1 W and 1 W for power supplies up to 1 kW and 10 kW, respectively (for a maximum of 100 A).
Figure 3 plots the experimental measurements for power consumptions from the gas metal arc welding source and
CNC gantry during metal deposition of two layers by
WAAM. These measurements allow concluding that: (i) power consumptions are high and nearly constant during metal deposition and (ii) power consumptions taking place during cooling times are negligible.
The assumptions considered in the PBCM that will be used in the different studies of
Section 3 are disclosed in
Table 1.
3.1. WAAM Cost Drivers
The cost performance of the
WAAM processing chain will firstly be assessed by analyzing the production costs (€ per part) for metal deposition tasks. These costs are presented in
Figure 4a in individual (left bar) and total (right bar) perspectives. The main conclusion drawn from
Figure 4a is that production costs associated with metal deposition by
WAAM are highly affected by material expenses. For this reason, the variable costs (23.20 € per part) clearly surpass the remaining fixed costs related to equipment and building use (2.64 € per part, corresponding to 10% of the total production costs). The sum between fixed and variable costs gives a total production cost of 25.84 € per part.
Figure 4b provides a deeper analysis on material costs showing that the wire feedstock contains a big portion (72%) of the overall material costs. The remaining costs spent on the baseplate and shielding gas are somewhat leveled, constituting percentages of 12% and 11% of the total material costs. These results are mainly related with the higher acquisition cost of the material in a wire format. Conversely, labor and energy costs are low due to the high automatization degree and high deposition rates of
WAAM (low worker dedication and fast processing cycles) while equipment costs reflect upon the low acquisition expenses of flexible systems that integrate a welding power source with a
CNC gantry.
Figure 5a shows the individual and total production costs (€ per part) for machining tasks that follow metal deposition in a
WAAM processing chain. These costs are again presented in individual (left bar) and total (right bar) points of view and allow denoting that the equipment costs are now the main cost driver for machining the as-built parts. This leads to a complete shift from the previous analysis on metal deposition stages, whereby the fixed costs are now the bigger portion of the total production costs (10.16 € per part corresponding to a percentage of 75%). The total machining costs are of 13.50 € per part which is nearly half of those spent on metal deposition by
WAAM (25.84 € per part).
Figure 5b explores the equipment expenses considered in the PBCM showing that they are mainly affected by machine costs (77%) due to high acquisition costs of the
CNC machining center. Moreover, the higher machine size, worker dedication, and power consumption are responsible for the increases in building, labor and energy costs in machining tasks when compared with those obtained from metal deposition by
WAAM. Since machining tasks are performed only on as-built parts, no material costs are included since they were fully accounted on the metal deposition tasks (refer to
Figure 4).
The complete distribution of costs per part for the
WAAM processing chain is shown in
Figure 6 for the individual and total perspectives. These distributions still evidence the preponderance of materials in
WAAM (55%), equipment (25%) and labor (11%) as the main cost drives of the process. This analysis allows estimating a total production cost of 39.34 € per part that can slightly decrease by considering solid waste incomes that are of 0.06 € per part.
3.2. Sensitivity Analysis
The sensitivity analysis is supported by the key cost drivers of the
WAAM processing chain that were previously identified in
Section 3.1. The goal here is to estimate the production cost fluctuations resulting from adjustments in the PBCM inputs as a consequence from industry market dynamics. For this purpose, the percentual variation of production costs per part is quantified by changing PBCM parameters within the range of ±30%.
Results are presented in
Figure 7a for variable costs and
Figure 7b for fixed costs. Variations in unit energy and labor costs show small fluctuations in the production costs, whereby the main cost driver is the setup time in machining tasks (maximum variation of ±3.47%). Still, this result highlights that setup times in machining have a greater impact in production costs than the same setup types but for metal deposition tasks (approximately 4 times higher fluctuations). As expected, the acquisition of the wire feedstock is the main cost drivers in a
WAAM processing chain (maximum obtained variation of ±12.47%), clearly surpassing those spent in baseplate and shielding gas consumptions.
The fixed cost sensitivity analysis shown in
Figure 7b allows denoting two main cost drivers: the acquisition costs of the
CNC machining center and the machine uptime. The first is again related with the high acquisition cost of the machining equipment showing unit price fluctuations about 5 times higher than those attained for the metal deposition machines (±7.29% against ±1.43%, respectively). The machine uptime is related to its productive time (i.e., the time the equipment is working) and therefore its increase leads to negative fluctuations on production costs and vice versa. Moreover, fluctuations of the machine uptime originate asymmetric variations in production costs that show a higher absolute value (−13.99%) when the machine uptime increases.
3.3. Comparison between WAAM and Machining from Solid
This subsection presents a comparison of the cost performance of a
WAAM processing chain with that of a traditional subtractive approach upon which machining operations on billets or ingots give rise to the final part. For this purpose, the variables of the developed PBCM that are related with machining tasks were adapted for the traditional subtractive approach in two different manufacturing stages: a first one with a rough machining task followed by a fine machining task (
Figure 8). These tasks are performed sequentially to allow decreasing machining times without compromising the final part quality standards in terms of surface conditions and geometry precision. The adaptations to be implemented in this Subsection made use of Equations (3)–(6), (13)–(15) of the proposed PBCM disclosed in
Section 2.2.
For each task, two different Buy-to-Fly ratios (
BTF) were considered:
taken from a 500 cm
3 raw stock and
for fine finishing of the semi-finished part, which is equal to that considered in the PBCM (refer to
Table 1). The material removal rates (
MRR) were also assumed to be different to account for realistic cutting conditions:
(rough machining) and
(fine machining—again equal to that considered in the PBCM).
Figure 9a presents a complete comparison of all main individual costs (€ per part) spent when using either a
WAAM processing chain or a traditional subtractive approach (machining) for the production of the case study part. As seen in
Figure 9a, individual part costs related with full machining costs surpass nearly all of those spent on a
WAAM processing chain. The biggest deviation is denoted on equipment costs (24.28 € vs. 9.82 € per part) because two
CNC machining centers are required in the traditional subtractive approach. In fact, if only a single
CNC machining was to be considered for performing both rough and fine machining tasks sequentially, the estimated annual production of 1500 parts would not be attained.
Nonetheless, material costs remain are the only higher in
WAAM when compared to the subtractive approach (20.4 € vs. 21.72 € per part). The reason for this is again due to high acquisition costs of the wire feedstock consumables that are mandatory in
WAAM. Therefore, even though the initial
BTF is nearly 3 times higher in the subtractive approach than in
WAAM (3.2 vs. 1.2), the material price differences related to its format (billets or wire coils) completely countervails the material volume differences. In conclusion, the variable costs will be similar for both approaches, while the fixed costs are those that highlight the expensiveness of using a traditional subtractive approach instead of
WAAM as shown in
Figure 9b. By summing up the main cost drivers previously disclosed in
Figure 9b for
WAAM, the PBCM estimates an overall cost of 39.34 € per part corresponding to a 34% reduction in costs spent for the production of the case study part using a traditional subtractive approach.
For cases where the annual production is higher than 1500 parts, more machines have to be implemented because otherwise the production times would exceed the available machine uptime. Hence, the following cost analysis disclosed in
Figure 10 considers the existence of either 1, 10 or 100 fully-dedicated machine sets
. This new variable
serve as a multiplication factor to all fixed costs of the PBCM. For
WAAM, a machine set
implies the utilization of one
WAAM system (power source +
CNC gantry) and one machining center. For the traditional subtractive approach, the same machine set
now suggests the existence of two machining center: one for rough machining stages and another for fine machining stages.
Figure 10 allows highlighting that the lower cost of
WAAM is observed for different annual production volumes. This analysis allows denotes the effectiveness of using
WAAM for producing parts in large batches.
3.4. Life Cycle Assessment
The goal and scope of the LCA will follow the same boundaries and comparisons as the cost assessment, considering a cradle to gate approach, the functional unit related to the production of the case study part, and considering its comparison with a traditional subtractive approach (machining). The cradle-to-gate approach considers within the boundaries of the analysis the pre-production and the deposition stage of the part.
Table 2 discloses the inventory used for the LCA analysis. The main environmental drivers, the materials and the energy, were considered in both processes. Regarding consumables, only the argon consumable gas was considered for the
WAAM processing chain whereas consumables for machining were disregarded since these are negligible in the overall impact [
26]. The values were all based on the ones obtained in the case study measures and the remaining values were obtained from a previous study on energy requirements of manufacturing processes [
27].
Table 3 presents the ReCiPe Midpoint impacts values of the part produced by
WAAM and the impacts of the main environmental drivers (materials and electricity). For the midpoint analysis of
WAAM, the impacts were assessed in 18 different categories all of them representing different impacts. These are Climate change, Ozone Depletion, Terrestrial Acidification, Freshwater eutrophication, Marine Eutrophication, Human Toxicity, Photochemical oxidant formation, Terrestrial ecotoxicity, Freshwater ecotoxicity, Marine Ecotoxicity, Ionizing radiation, Agricultural land occupation, Natural land transformation, Water depletion, Metal depletion and Fossil depletion. For a better understanding of each one of these categories it is recommended to see the explanation provided elsewhere [
28]. The biggest impact in most categories comes from the material (AISI 316L wire feedstock and baseplate), followed by the electricity and the shielding gas.
Finally, the ReCiPe Endpoint method was used for comparing the environmental impact of
WAAM and machining by means of a single indicator. The results are presented in
Figure 11 for each of the endpoint categories, Human Health, Ecosystems and Resources, and as a total (aggregated). Results show the benefit of using an additive manufacturing process (
WAAM) regarding the material impact. This was expected since the material usage,
BTF ratio, is much higher when producing a part by traditional subtractive approach than with
WAAM. The machining equipment is also much more powerful, and therefore requires more energy to operate. The only difference would be the shielding gas, which has a residual impact when compared to those regarding materials and energy. There are no relevant differences proportionally regarding the impact in the categories, as both processes have the main impacts related with material and energy.


