Abstract
Foams produced with biobased materials, such as poly(lactic acid) (PLA), cellulose, starch, and plant oil-based polyurethanes, have become more and more important in the circular economy. However, there are still significant challenges, including inferior performance and higher cost. The use of low-cost filler material has the potential to reduce the cost and alter the composite properties of biobased foams. By selecting biofillers derived from plant material, we can reduce the cost without sacrificing the compostability. This study explored the impact of landfill-diverted biofiller material, ground coffee chaff and rice hulls on the physical properties of biobased foams. Both biofillers were extrusion compounded with PLA, then extruded into rigid foams using a physical blowing agent. A filler concentration up to 10 weight % rice hull or 5 weight % coffee chaff could be incorporated without a significant increase in density, in comparison to the regular PLA foam. The thermal conductivity was similarly unaffected by biofiller loading, with values ranging between 71.5 and 76.2 mW/m-K. Surprisingly, the filler composite foams possessed impressive mechanical properties with all compressive moduli above 300 MPa. Only 5 weight % loading resulted in the doubling of compressive modulus, compared to the regular PLA foam. These results indicate that landfill-diverted fillers can strengthen foam mechanical properties without impacting thermal insulation performance, by forming reinforcing networks within the cell walls.
1. Introduction
Rigid foams are a crucial component in the everyday lives of people around the world. They are used in a multitude of applications, including packaging, insulation, and disposable food containers. Expanded polystyrene (EPS), commonly referred to by the brand name Styrofoam™, is one of the current industry standards for rigid foam. Although EPS is well suited to insulation and packaging applications, and is low cost, it is not a sustainable option. Similarly to other petroleum-based foams, the production of EPS involves the consumption of non-renewable resources, and it is typically disposed in landfills after one-time use. Polystyrene is recyclable; however, the low density of EPS and limitations in recycling infrastructure have hindered it from being economically viable [1]. Though governments and companies around the world have made great progress in increasing recycling efforts [2], including those for foam materials, a more sustainable option is still needed to achieve a circular economy.
Biobased polymers are a popular route that researchers have taken towards improving the environmental friendliness of rigid foams. Studies have shown that replacing petroleum-based polymers with biobased counterparts results in a reduction in emissions that are harmful to the environment and human health [3,4,5,6,7,8]. Many biobased polymers are also biodegradable or industrially compostable, which can reduce landfill accumulation [9,10]. Several works have already demonstrated that biobased polymer foams can be made using industrially scalable methods, and can achieve similar performance as traditional industry standards [11,12,13,14,15]. In particular, poly(lactic acid) (PLA) is a promising biobased option, due to its physical properties, which are often compared to polystyrene and polypropylene, and its compostability [16,17]. Previous studies verified the potential of PLA as a foam material through extrusion with both physical and chemical blowing agents [18,19,20,21]. The primary concern with PLA in the past has been degradation during processing. PLA is susceptible to hydrolysis when exposed to moisture at processing temperatures. This problem can be mitigated through drying procedures and the use of chain-extending agents [22,23], thus making PLA a viable alternative to the traditional plastics used for foams.
The remaining concern with PLA continues to be its cost and lack of performance. Despite the necessary plants (e.g., corn) being widely available in many parts of the world, the production of PLA still results in a higher price than petroleum-based plastics [24,25]. At the same time, there are millions of tons of agricultural waste products, such as rice hulls, which are disposed in landfills. This inefficient use of resources presents a serious issue and an opportunity to improve. Researchers have already created PLA composite foams with various nanoparticle additives to alter the foam properties [26,27]. For example, it is known that the addition of nanoclay additives is typically associated with an increase in mechanical strength [28,29]. However, few studies have explored the use of biobased filler materials in polymer foams. Biobased agricultural waste products have the potential to work well as inert filler within a PLA foam, as they are primarily cellulosic material and have essentially negative to zero economic value. Furthermore, adding a biofiller is not anticipated to compromise the compostibility of the foam, while reducing the cost of the material.
The aim of this work is to understand the viability of landfill-diverted agricultural waste as filler material in extruded PLA foams. Two biofillers, rice hulls (RH) and coffee chaff (CC), were ground and compounded with foam grade PLA in different ratios, prior to foaming with a physical blowing agent (PBA). The biofiller–PLA foams were compared with unfilled PLA foam to determine the impact of the biofiller on foam properties, including density, thermal conductivity, and mechanical strength. The results of this study demonstrated that at low concentrations (≤5 wt. %), biofiller does not reduce the foaming capability of PLA. Additionally, a significant increase in compression modulus was observed in the biofiller–PLA foam, suggesting that the use of biofiller can reduce the cost of the material and increase the value of the final product.
2. Materials and Methods
2.1. Materials
Semi-crystalline foam grade PLA Ingeo 8052D (NatureWorks) with a D-lactide content of 4.6%, specific gravity of 1.24, melt flow index of 14 g/10 min, number-average molecular weight of 2.09 × 10⁵ g/mol, and polydispersity index of 1.39 was used as the base polymer. Joncryl® ADR 4368-C was used as an epoxy-functionalized chain-extending agent. An endothermic chemical blowing agent, designed for use with PLA, TecoCell® GT, was supplied by Trexel. A small amount of water was produced as a by-product of the CBA. Use of the chain-extending agent and lowest possible temperature setting was expected to decrease potential hydrolysis. Jetfine® 3CC, supplied by Imerys Talc, was used as a talc nucleating agent. Additionally, landfill-diverted rice hulls and coffee chaff were procured from a commercial source.
2.2. Preparation of Biofiller-Compounded PLA and Foams
The rice hulls and coffee chaff were separately ground through multiple cycles using a Cyclone Mill. After grinding, the particles were sieved to a size of 350 μm. Larger fragments were reground and sieved again until enough material was obtained. Each ground biofiller was then compounded with PLA to create blends at concentrations of 5 weight % and 10 weight %. PLA foams without biofiller were made for comparison. Additionally, since the biofiller was hypothesized to have the potential to act as a nucleating agent for the foaming process, no additional nucleating agents (CBA and Talc) were added to the formulations containing biofiller. Formulations were compounded using a Leistritz 27 mm twin-screw extruder operating at the maximum set temperature of 190 °C, and then pelletized. Prior to all extrusion steps, the PLA (or biofiller-compounded PLA) was dried in a desiccator for a minimum of 12 h at 60 °C. Formulations for each foam are listed in Table 1.

Table 1.
PLA foam sample formulations. Samples made with biofiller-compounded PLA are listed in terms of weight percentage of the specific biofiller.
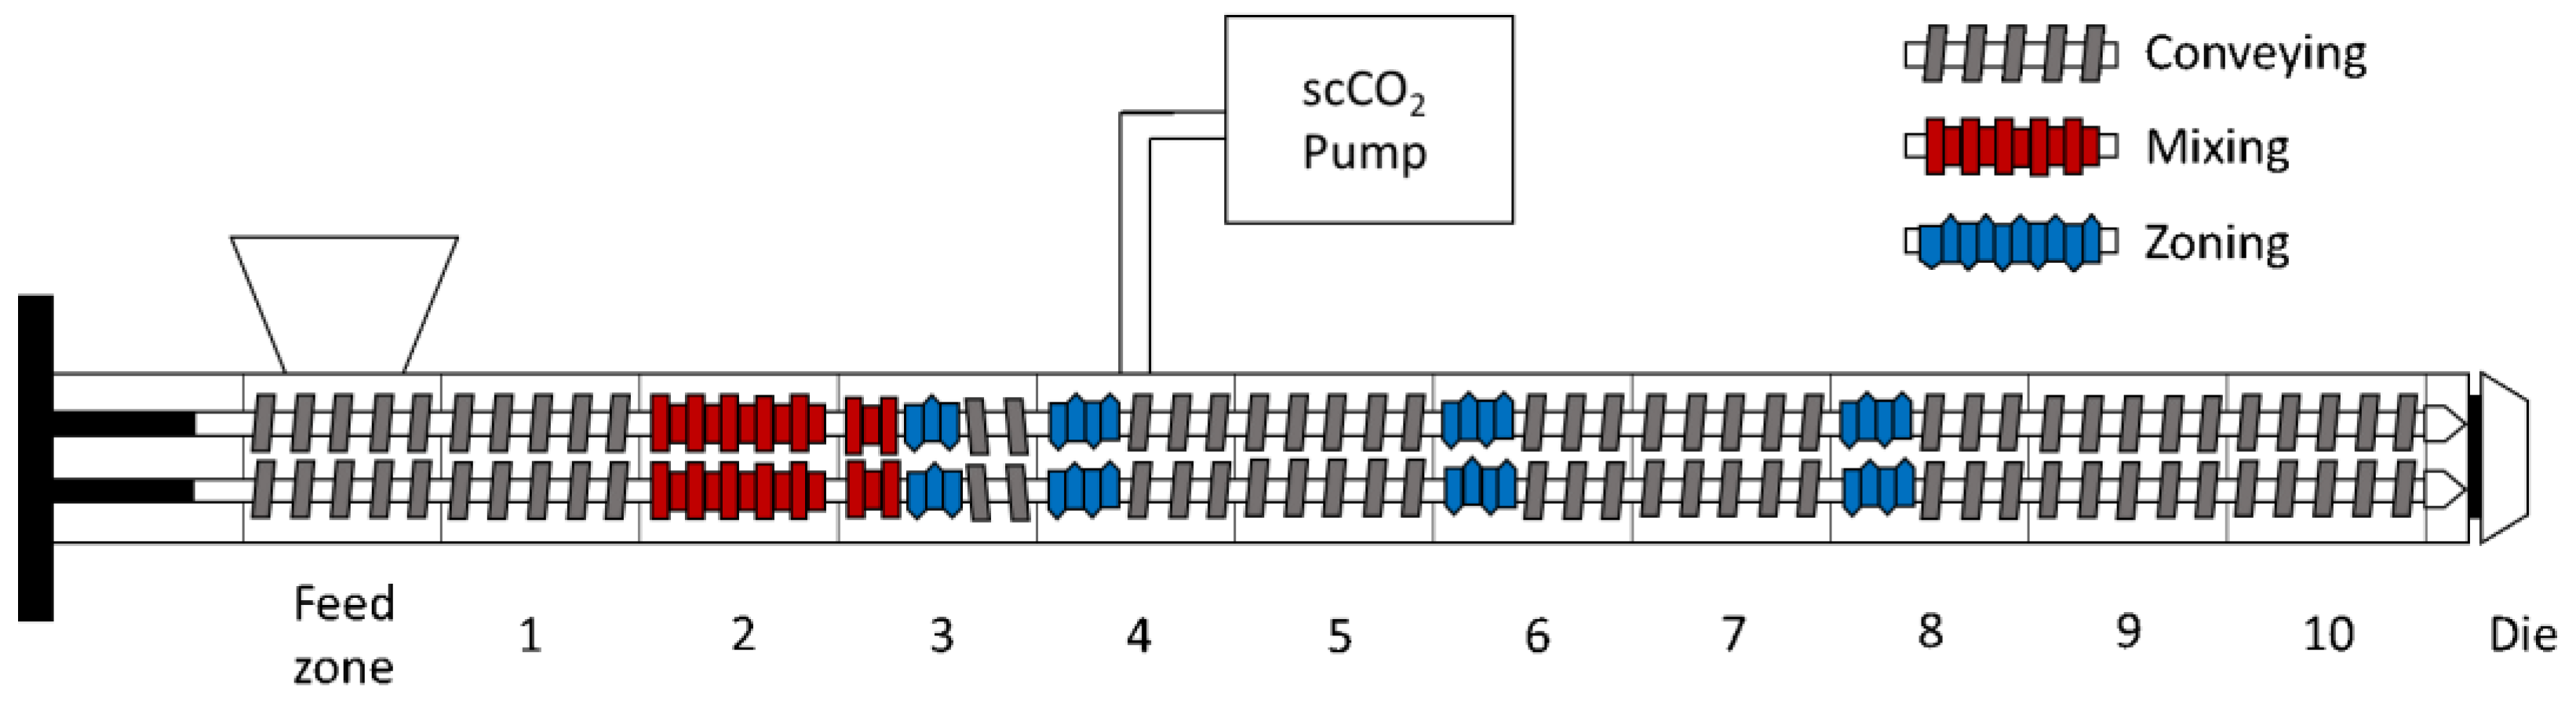
Foaming extrusion was conducted at the Leistritz extrusion facility in Somerville, New Jersey. Figure 1 illustrates the setup of the 27 mm twin-screw extruder (6.3 mm round die) with a supercritical fluid injection pump that was used for foaming. All solid materials, including PLA (or biofiller-compounded PLA), chain-extending agent (0.7 wt. % of polymer), chemical blowing agents, and nucleating agent, were fed into the hopper at a constant rate. The feeding rate was adjusted to obtain the desired supercritical CO2 (scCO2) dosage. After exiting the extruder die, the foams were allowed to cool on a conveyer belt at room temperature. Additional extrusion parameters are shown in Table 2.

Figure 1.
Generalized diagram of foam extrusion twin-screw set-up.
Table 2.
Extrusion foaming parameters for each sample batch.
2.3. Characterization
Ground biofiller particles were characterized using a 3D Surface Profiler VK-X1000 microscope (Keyence Corporation of America, Itasca, IL, USA). Representative images of the particles were captured with 5× and 10× magnification optical lenses. Lighting was adjusted to clearly observe the particle texture and color. The foam samples were also imaged using the same general method. The foam samples were prepared first by cryofracturing a cross-section along the transverse direction (perpendicular to the direction in which the sample exited the extruder die).
Foam samples were also imaged with scanning electron microscopy (SEM). Samples were prepared by cryofracturing a cross-section along the transverse direction and then sputter coating with iridium. The samples were imaged with an FEI Quanta-FEG 250 SEM with a 1 nm resolution, operating at an accelerating voltage of 10 kV. The SEM images were analyzed with ImageJ (U.S. National Institutes of Health, Bethesda, MD, USA) software to calculate the average cell size. Cell size was measured along the longest direction of the cell. Fifteen cells from three images were measured at random for every sample, giving 45 total measurements per sample. The average and standard deviation were calculated.
Density of the foam samples was determined by first cutting cylindrical sections from three different regions of the overall sample batch. The sample replicates were massed with a balance with precision to 0.1 mg. The sample heights and diameters were measured with a caliper three times. The average of the height and diameter measurements was calculated. Using the average values, the volume of the sample was calculated, assuming a perfect cylinder. The density was calculated for each sample replicate by dividing the mass by the volume, and the final density of the overall sample was taken to be the average of the replicates.
Thermal conductivity of the foam samples was measured using a Hot Disk TPS 1500 (Hot Disk® Instruments, Göteborg, Sweden). Based on the size of the samples, a 3.2 mm radius Kapton sensor was selected. Three sets of replicates were measured for each sample and the average was calculated. Due to reduced expansion in the 10% biofiller foam samples, the radius of the sample was too small to be accurately measured. As a result, the data for those samples are not provided.
The compressive strength of the foam samples was measured using an Instron 5569 (Instron, Norwood, MA, USA) electromechanical testing system with a 50 kN load cell. Ten replicates of each sample were tested, according to the method outlined in ASTM D1621-16 [30]. The compression modulus of each replicate was calculated from the slope of the resulting stress–strain curve. The modulus of the sample was taken as the average of the replicates.
Crystallinity of the PLA and foam samples was determined through differential scanning calorimetry (DSC). Three measurements from each sample were analyzed with a Q2000 DSC (TA Instruments, New Castle, DE, USA), utilizing a heat/cool/heat cycle ranging from 30 °C to 200 °C at a rate of 10 °C/min, under a nitrogen atmosphere. The thermal transitions in the first heating cycle were analyzed. Crystallinity of the sample was calculated by subtracting the enthalpy of crystallization (∆Hc) from the enthalpy of melting (∆Hm) and dividing the difference by ∆Hm0 (enthalpy of melting for a 100% crystalline PLA sample). The value of ∆Hm0 was taken to be 93.7 J/g, as shown in previous literature [31].
Attenuated total reflectance (ATR) Fourier transform infrared spectroscopy (FT-IR) was conducted on the foam samples to detect interactions occurring between the biofiller particles and the PLA matrix. A Nicolet 6700 infrared spectrometer (Thermo Scientific, Waltham, MA, USA) with a DTGS detector was used. Each spectrum collection consisted of 32 scans and had a 2 cm−1 resolution. Three replicates of each foam sample were analyzed with 32 scans per run. The data are reported in the Supplementary Materials.
2.4. Statistical Analysis
For density and compression data, a statistical analysis was conducted using JMP® Pro 16, SAS Institute Inc., Cary, NC, USA. One-way ANOVA with Bonferroni-corrected post hoc t-tests was conducted to determine if the material properties were statistically different from one another.
3. Results and Discussion
3.1. Foam Structure and Imagaing
In general, polymer composite properties are influenced by the morphology and dispersion of the minority (particulate) phase [32,33]. For foam structural properties, the cell size and foam density are critical parameters. Optical images of the ground biofiller particles and the composite foams were collected to understand the differences in the rice hulls and coffee chaff. Figure 2a displays the rice hull particles, which have a broad size distribution, ranging from 5 to 1000 µm, and are generally anisotropic with a flake-like morphology. The larger particles are ridged and up to 50 µm thick. The large rice hull particles are clearly visible in the composite foams (Figure 2b,c), and are on a similar size scale as the foam cells. There is no indication of agglomeration of the large rice hull particles, though it is unclear from the optical images if the fine particles are well dispersed. In comparison, the coffee chaff (Figure 2d) has fewer very fine particles (maximum Feret length <10 µm) and the majority of larger particles are wafer-like with thicknesses less than 10 µm. Though most of the coffee chaff particles are wafer-like, a few have a rounder, more pebble-like morphology. In Figure 2e,f, the individual coffee chaff particles are generally not visible within the polymer matrix. However, the relatively uniform color change of the polymer suggests that the particles are well dispersed.
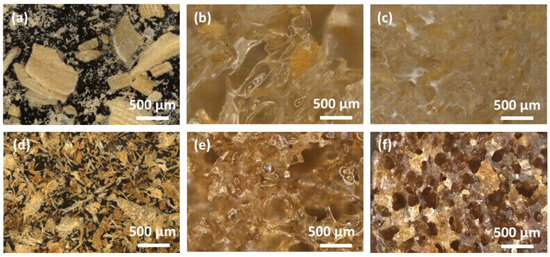
Figure 2.
Optical images of ground biofiller particles: (a) rice hulls, (d) coffee chaff, and PLA–biofiller foams: (b) 5RHf, (c) 10RHf, (e) 5CCf, and (f) 10CCf.
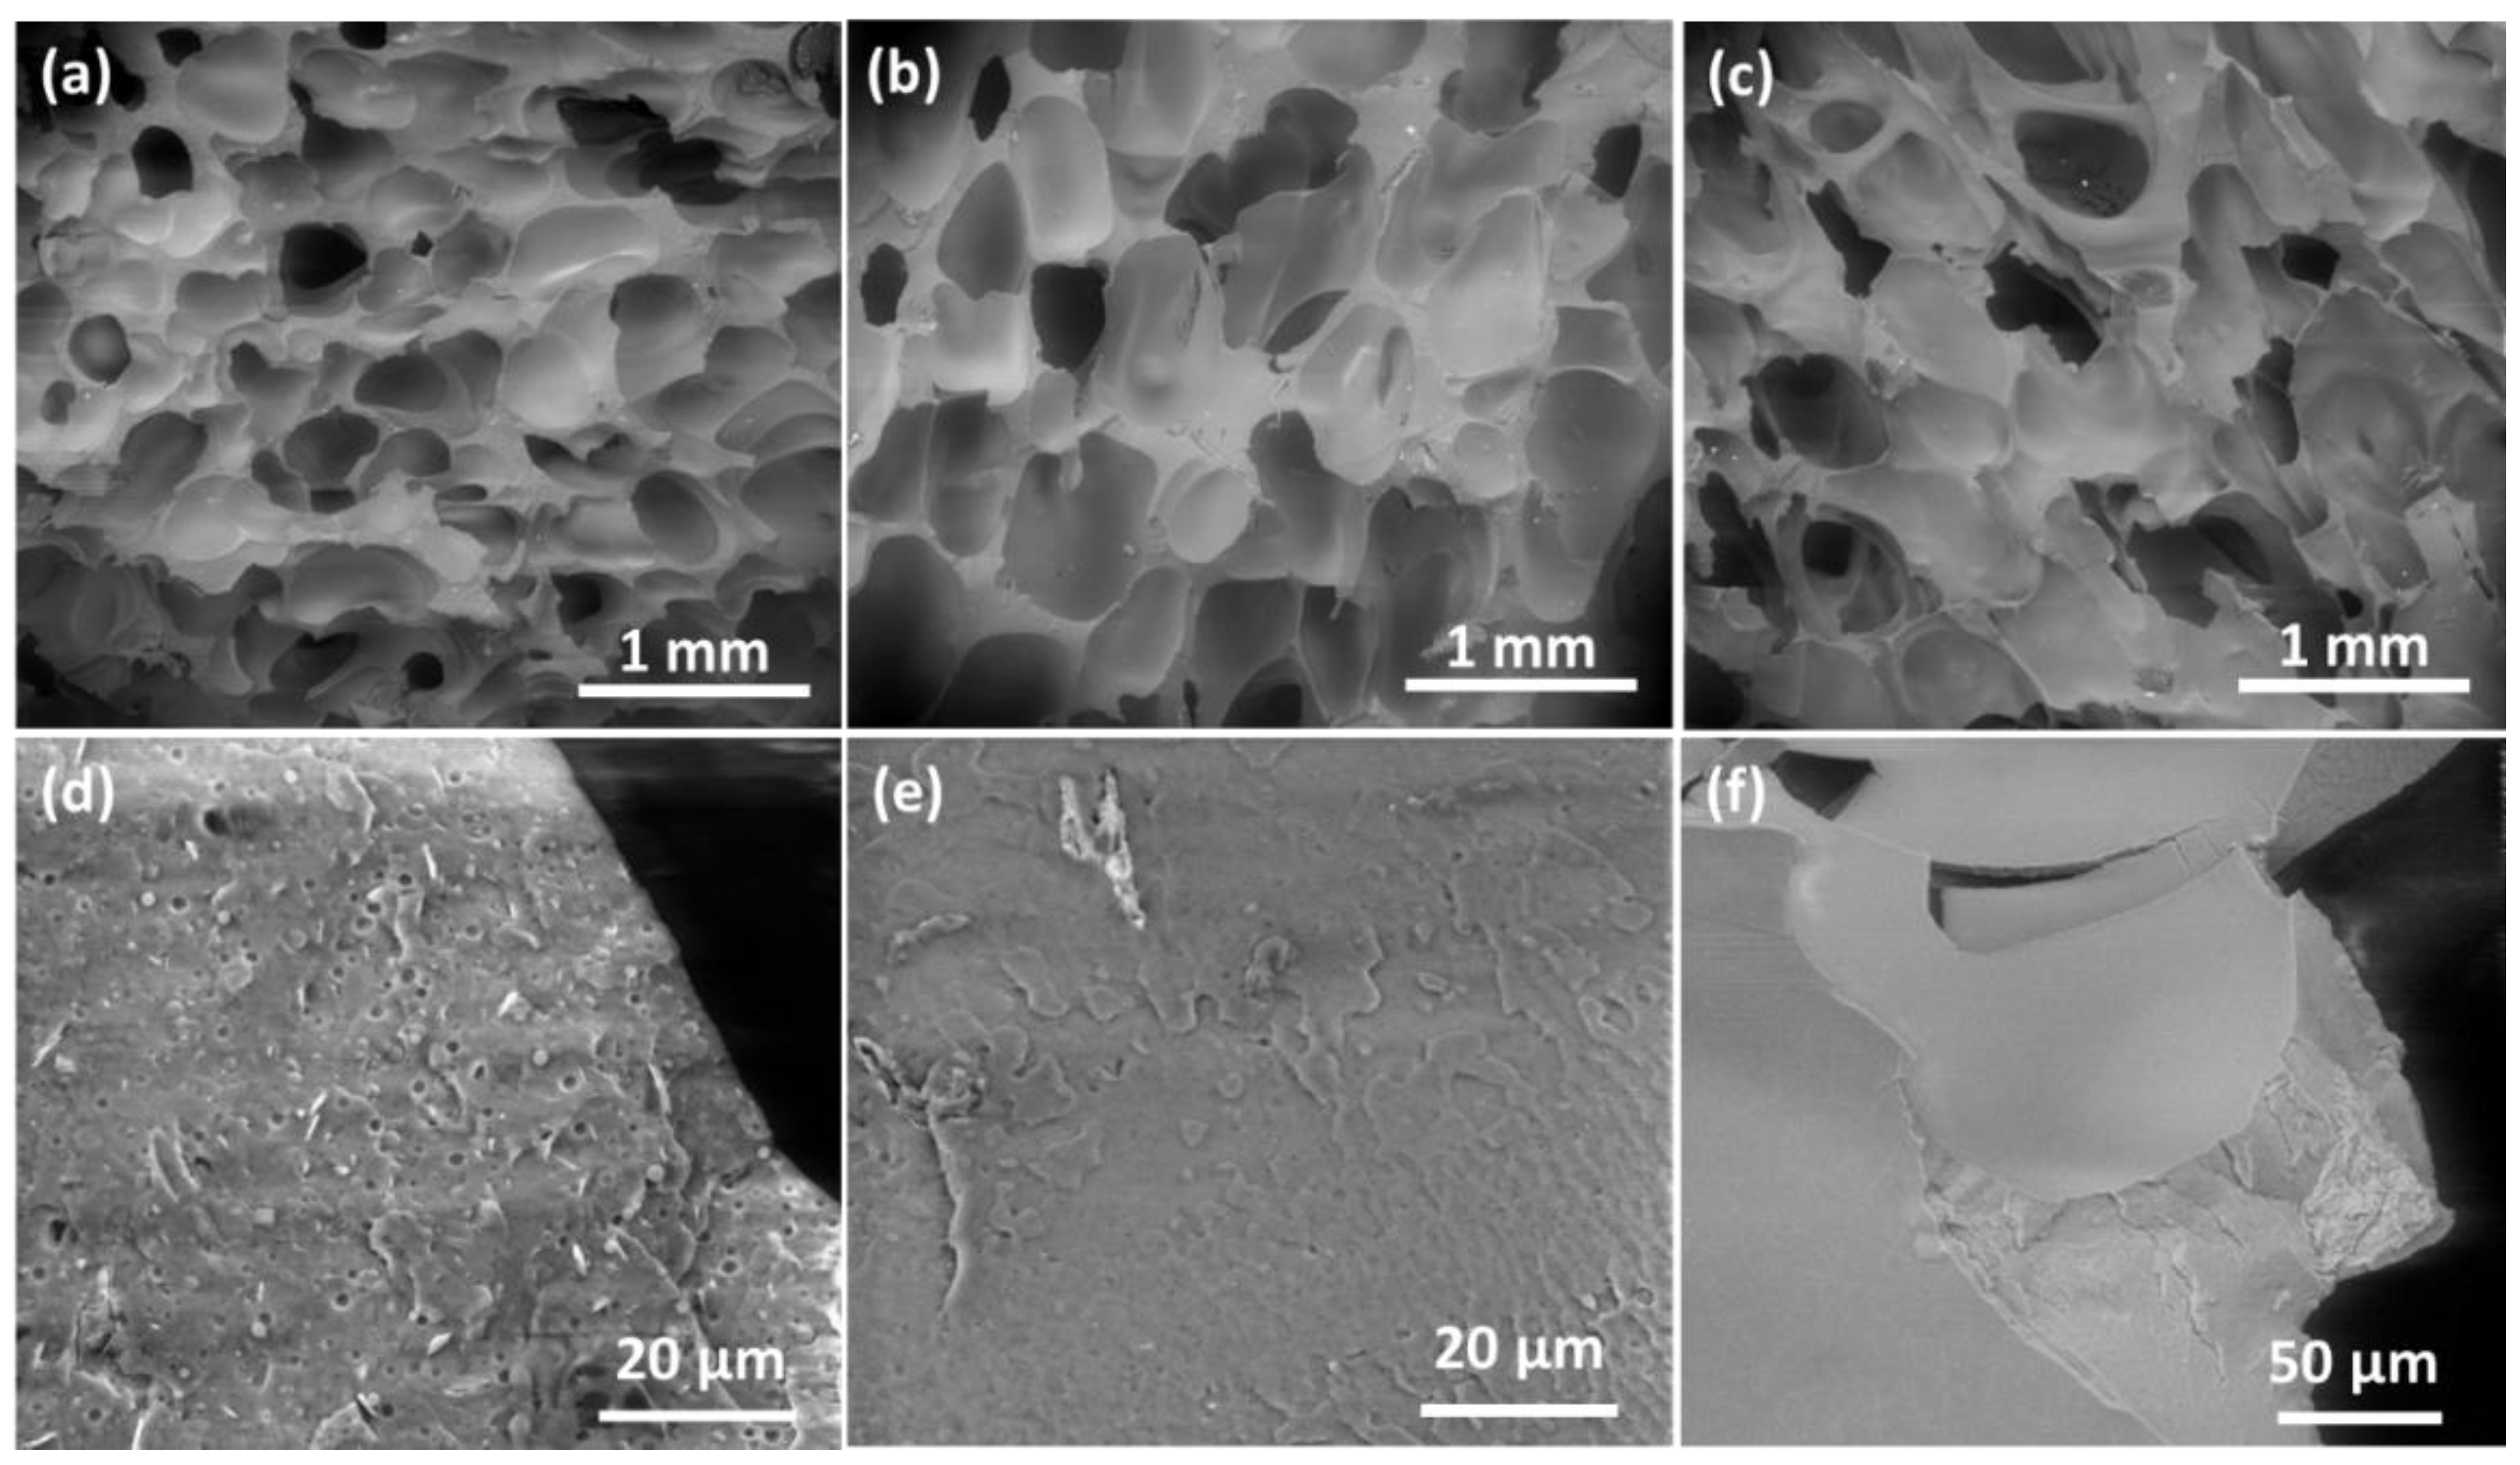
To obtain a clear image of the foam cell structure, SEM images were collected (see Figure 3). All the samples have a mostly closed-cell structure. The SEM images were also used to determine the average cell diameter, as shown in Figure 4. The cell wall cross-sections displayed in Figure 3d–f are smooth for all the biofiller composite foams. In comparison, the PLAf cell walls have a pockmarked appearance. We hypothesize that the divots are nucleation sites resulting from the talc nucleating agent. Talc was not added to the biofiller foams, which could explain the absence of the pockmarked structure in those samples.

Figure 3.
SEM images of cryofractured foam cross-sections. Cell structures are displayed in the top row: (a) PLAf, (b) 5RHf, and (c) 5CCf. Cell wall cross-sections are displayed in the bottom row: (d) PLAf, (e) 5RHf, and (f) 5CCf.

Figure 4.
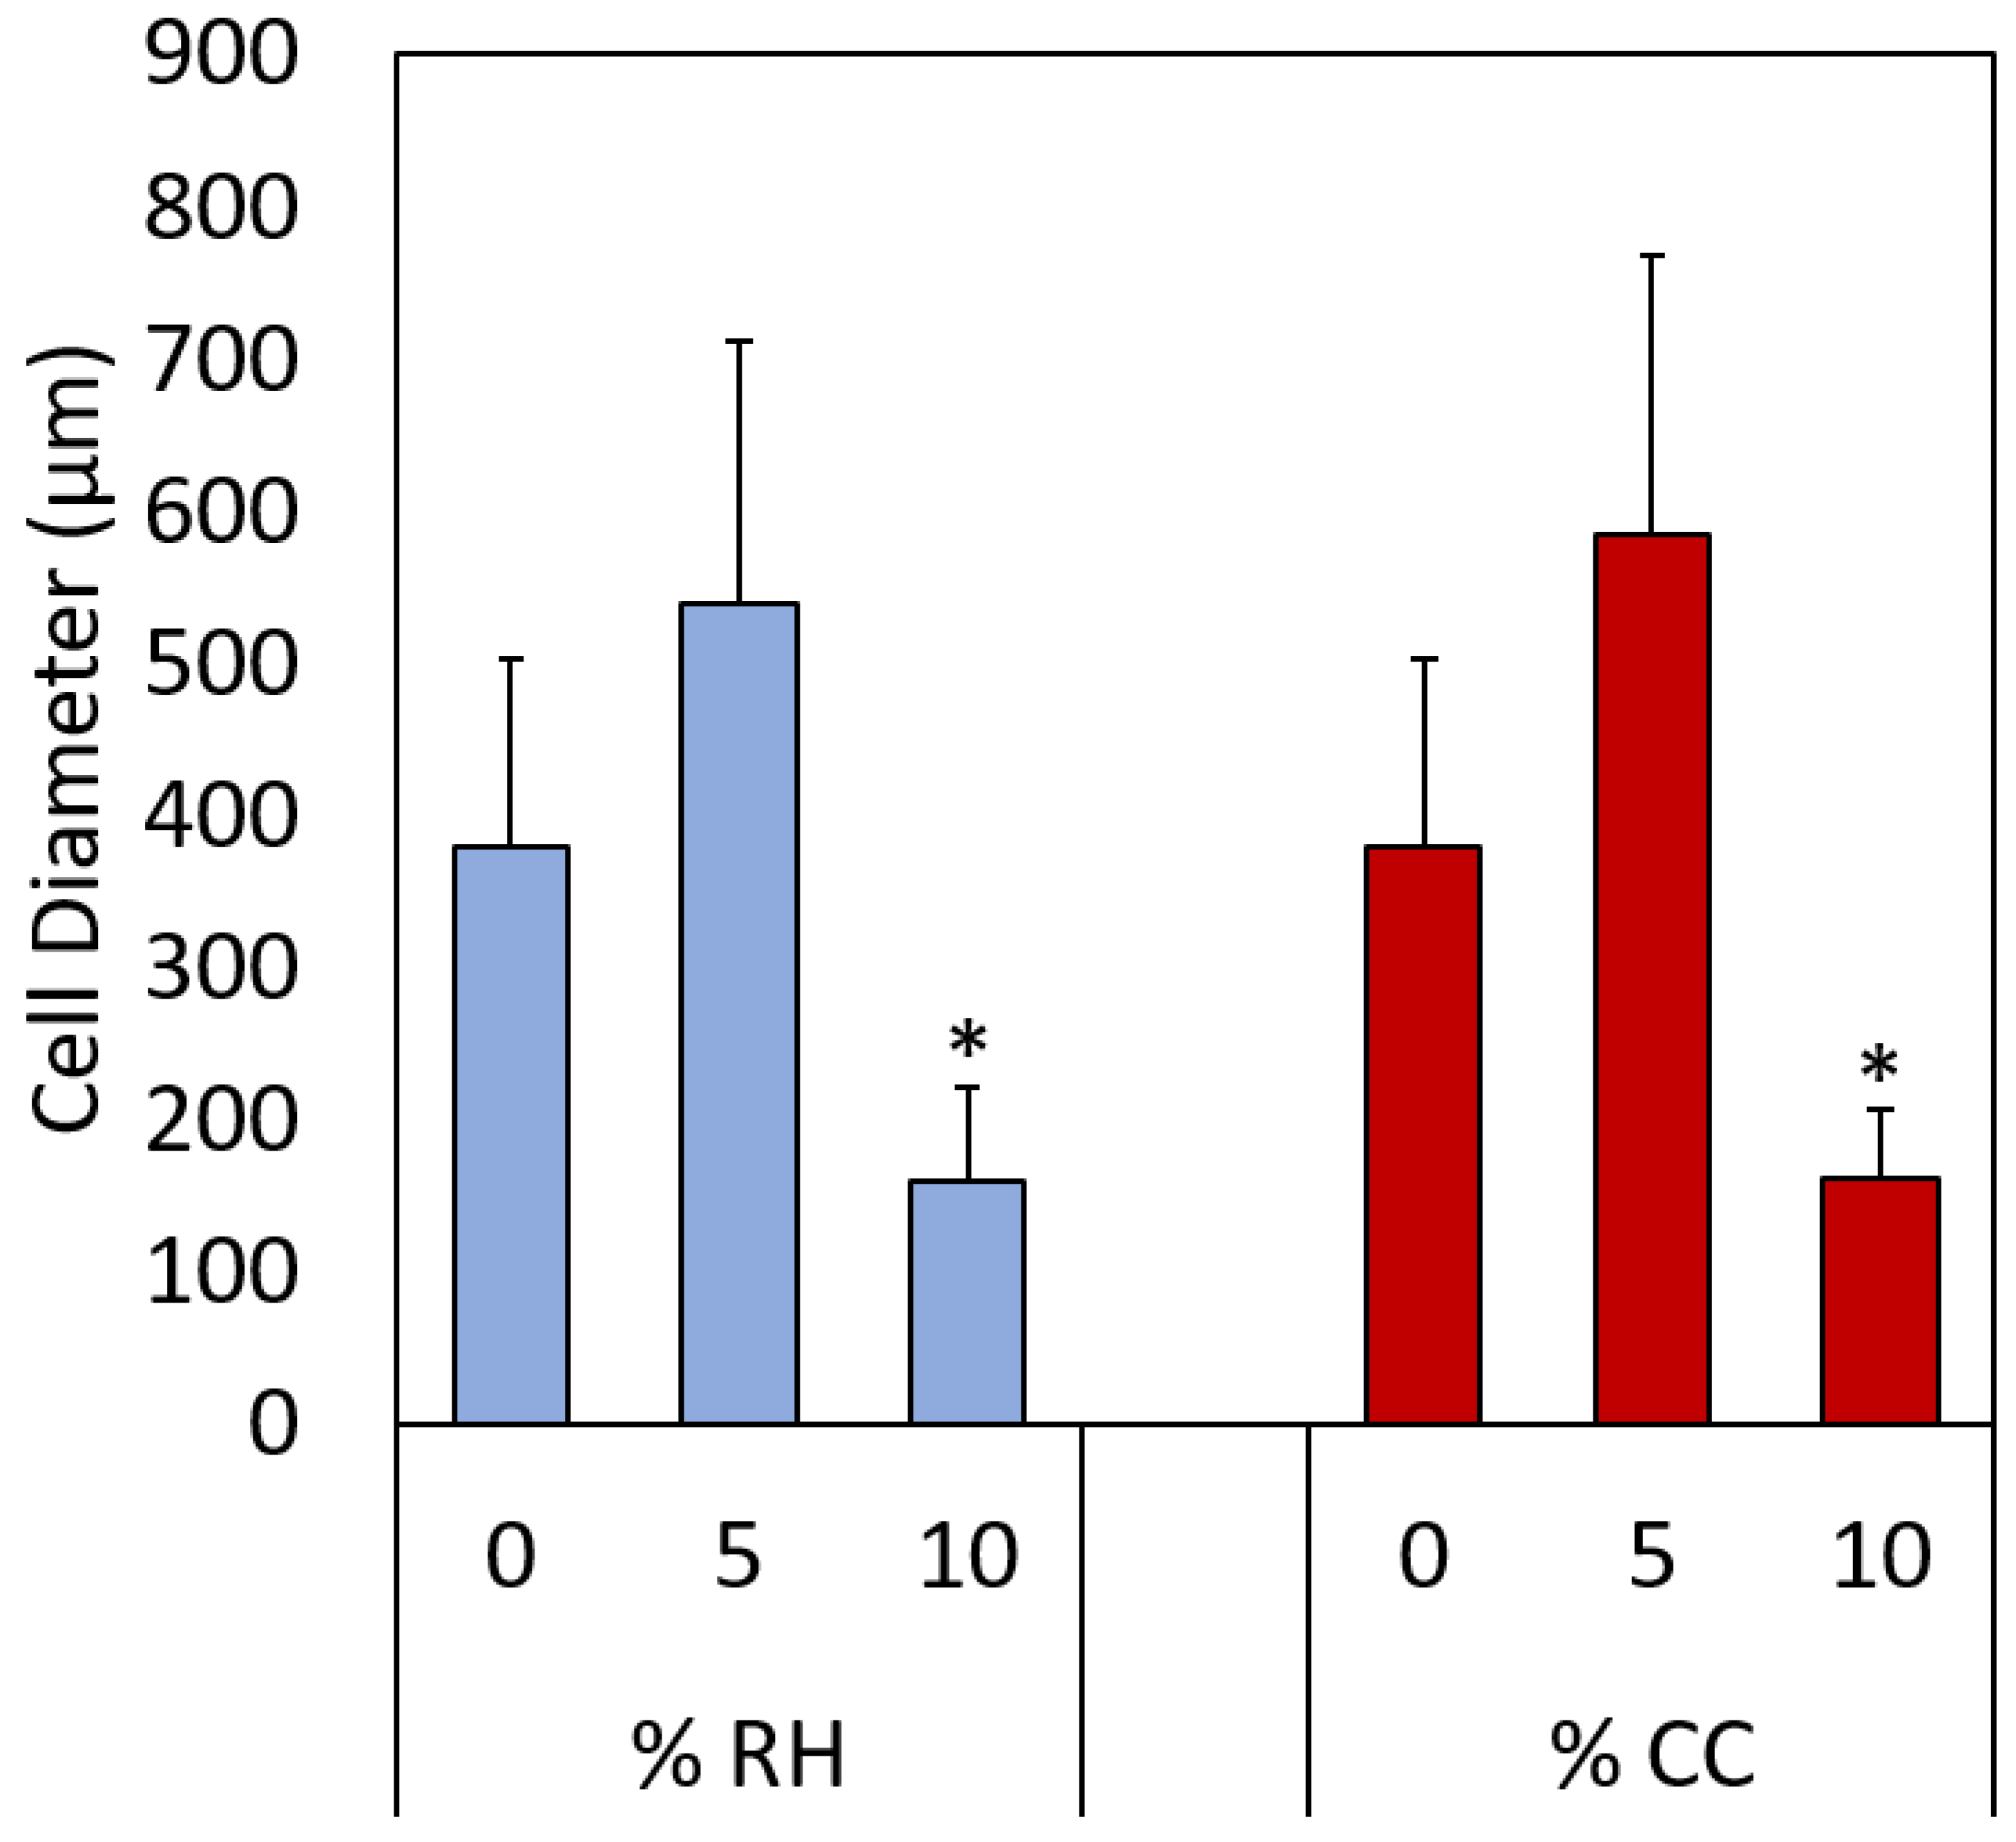
Average cell sizes for all foam samples, displayed in terms of weight percentage of each biofiller. Cell diameters were determined from SEM images using image analysis software. The 10 wt. % samples were statistically different from the 5 wt. % samples (indicated with asterisks).
3.2. Density
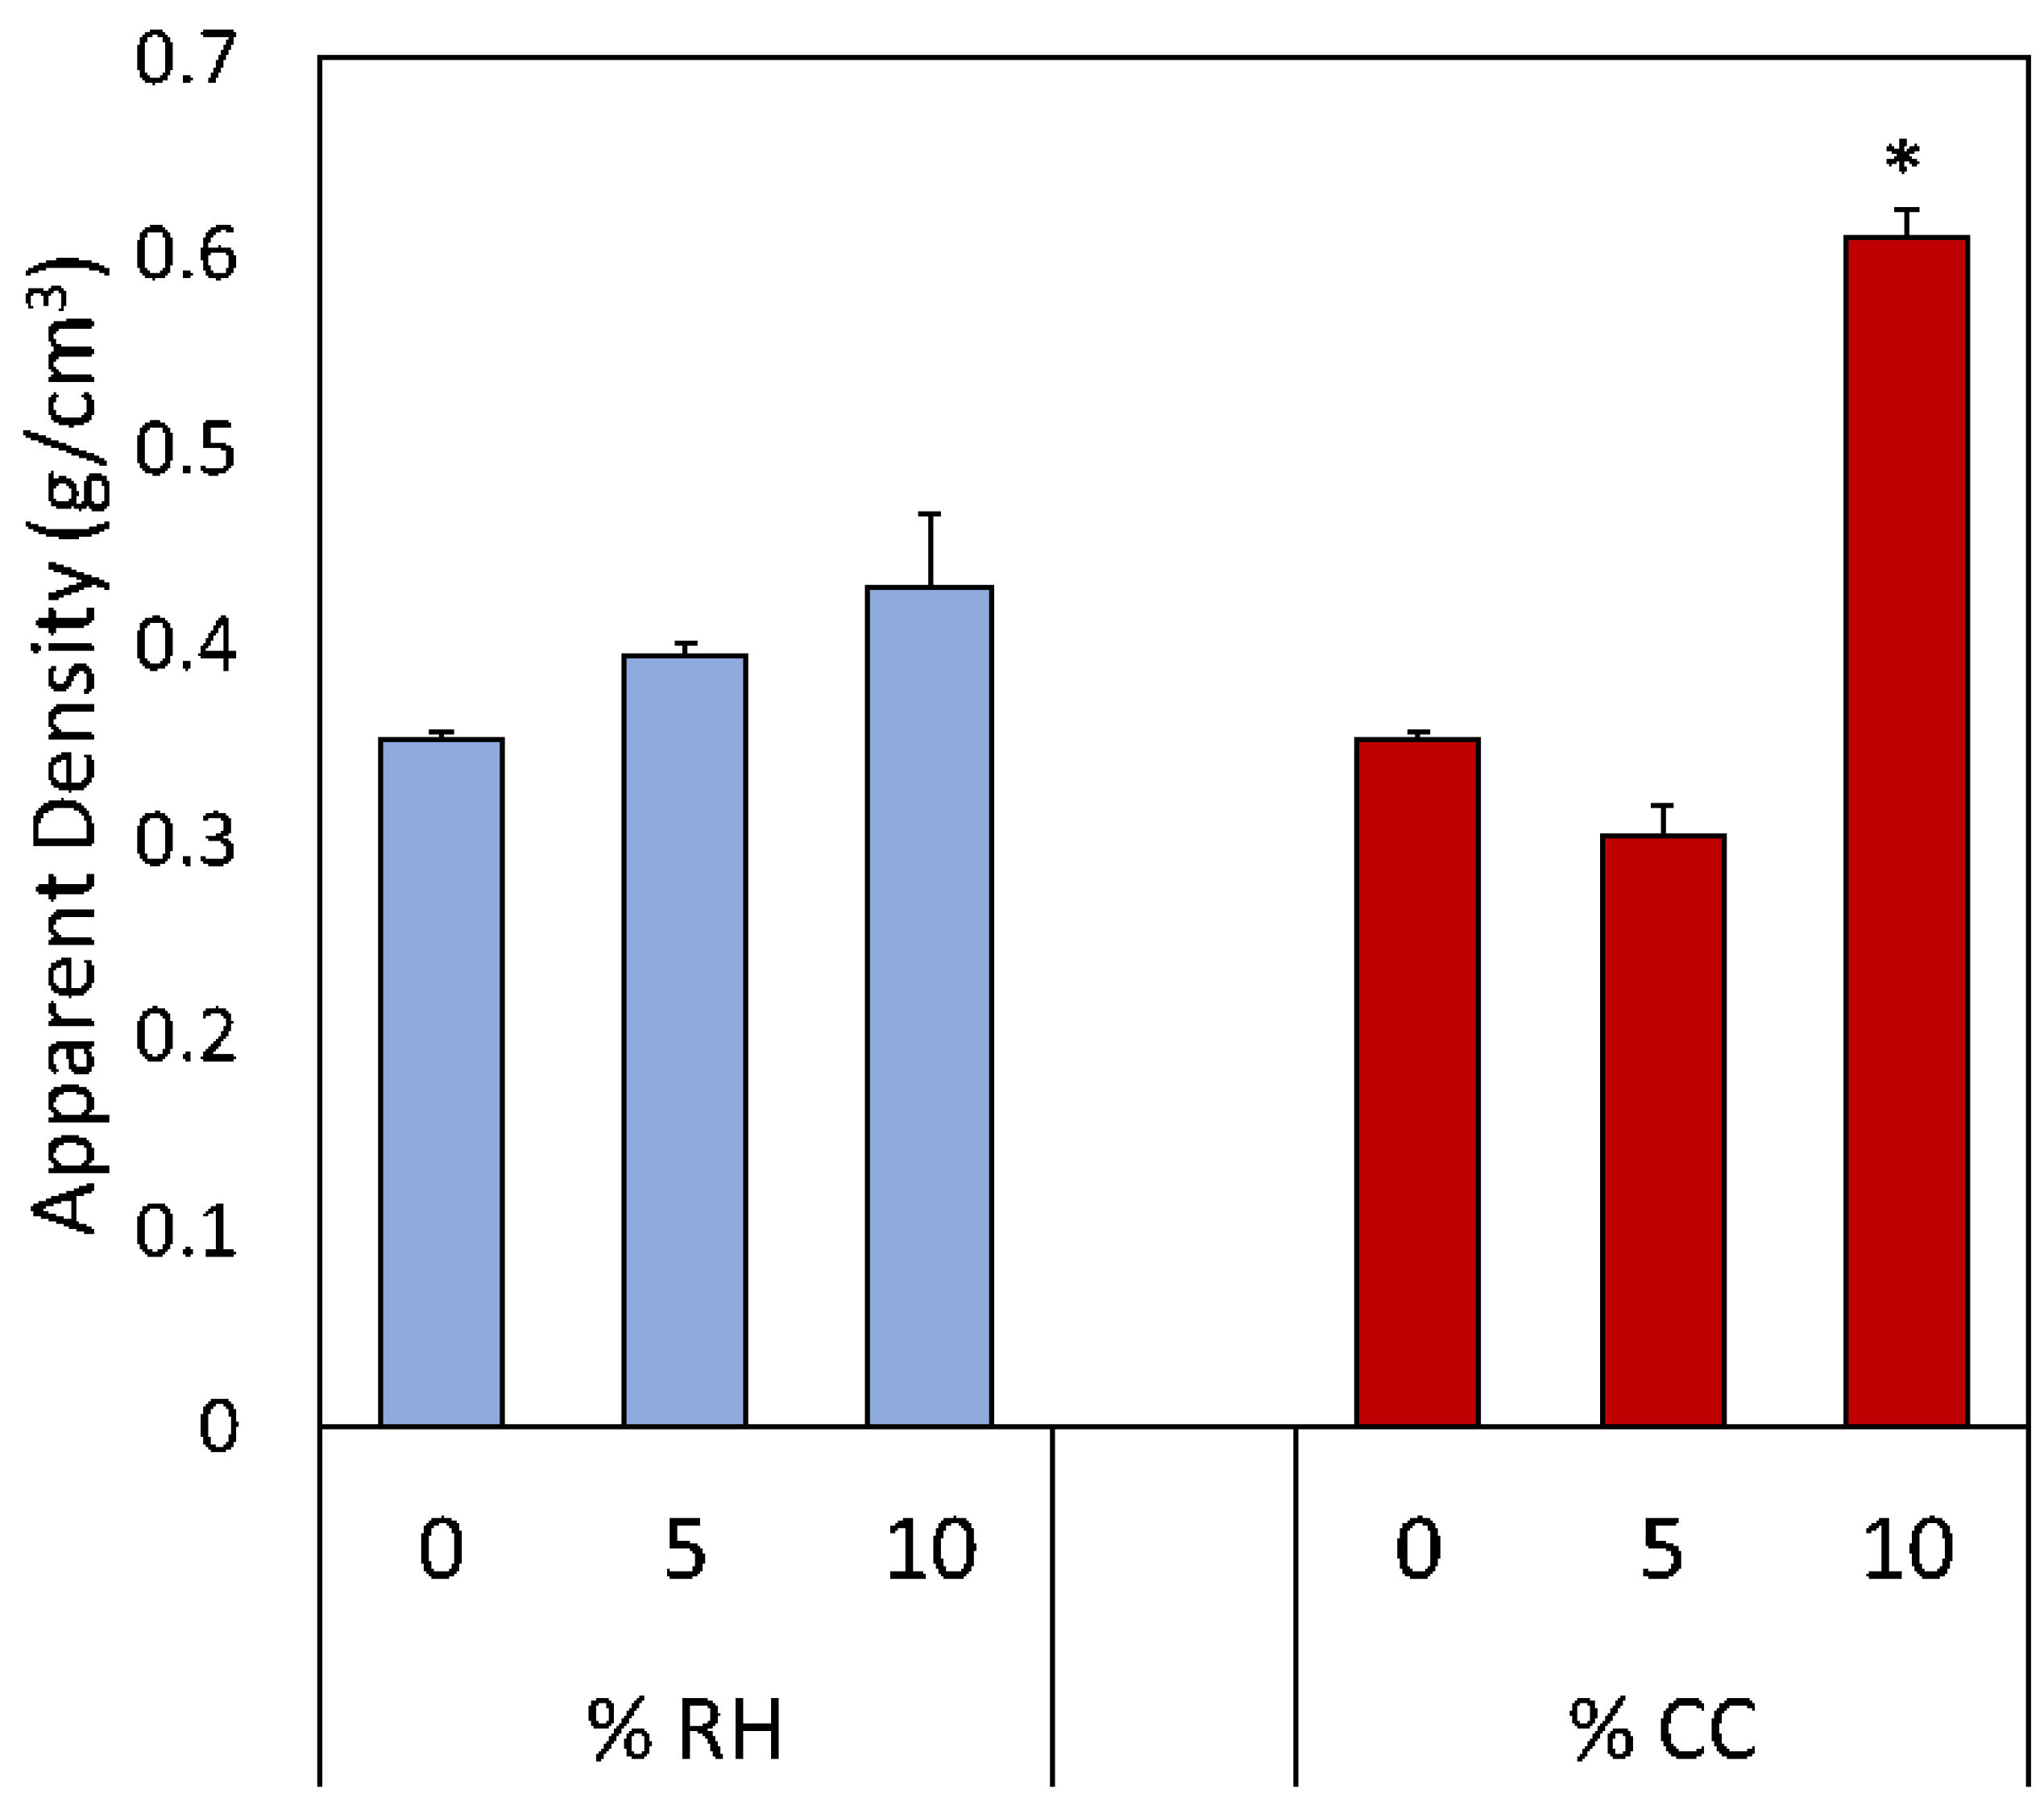
The apparent density of foams is an important factor related to other areas of performance, including thermal conductivity and mechanical strength [34,35]. It was hypothesized that increasing the biofiller content would lead to a higher density by disrupting the cell structure. Largely, the data shown in Figure 5 support the hypothesis. The rice hull samples exhibit a slight increase in density with higher biofiller percentages. The coffee chaff samples do not have a clear trend, with 5CCf possessing a lower density than PLAf, and 10CCf possessing a very high density of 0.6 g/cm3. The statistical analysis indicated that neither of the rice hull samples nor 5CCf are statistically different from PLAf. Sample 10CCf has a much higher density, resulting in a statistical difference from both PLAf and 5CCf. In general, these foams have a density in the range of 0.3–0.5 g/cm3, approximately 3 to 5 times the density of EPS foam [36].

Figure 5.
Apparent density data for all foam samples, displayed in terms of weight percentage of each biofiller. Sample 10CCf is statistically different from PLAf and 5CCf (indicated with asterisk).
3.3. Thermal Conductivity and Diffusivity
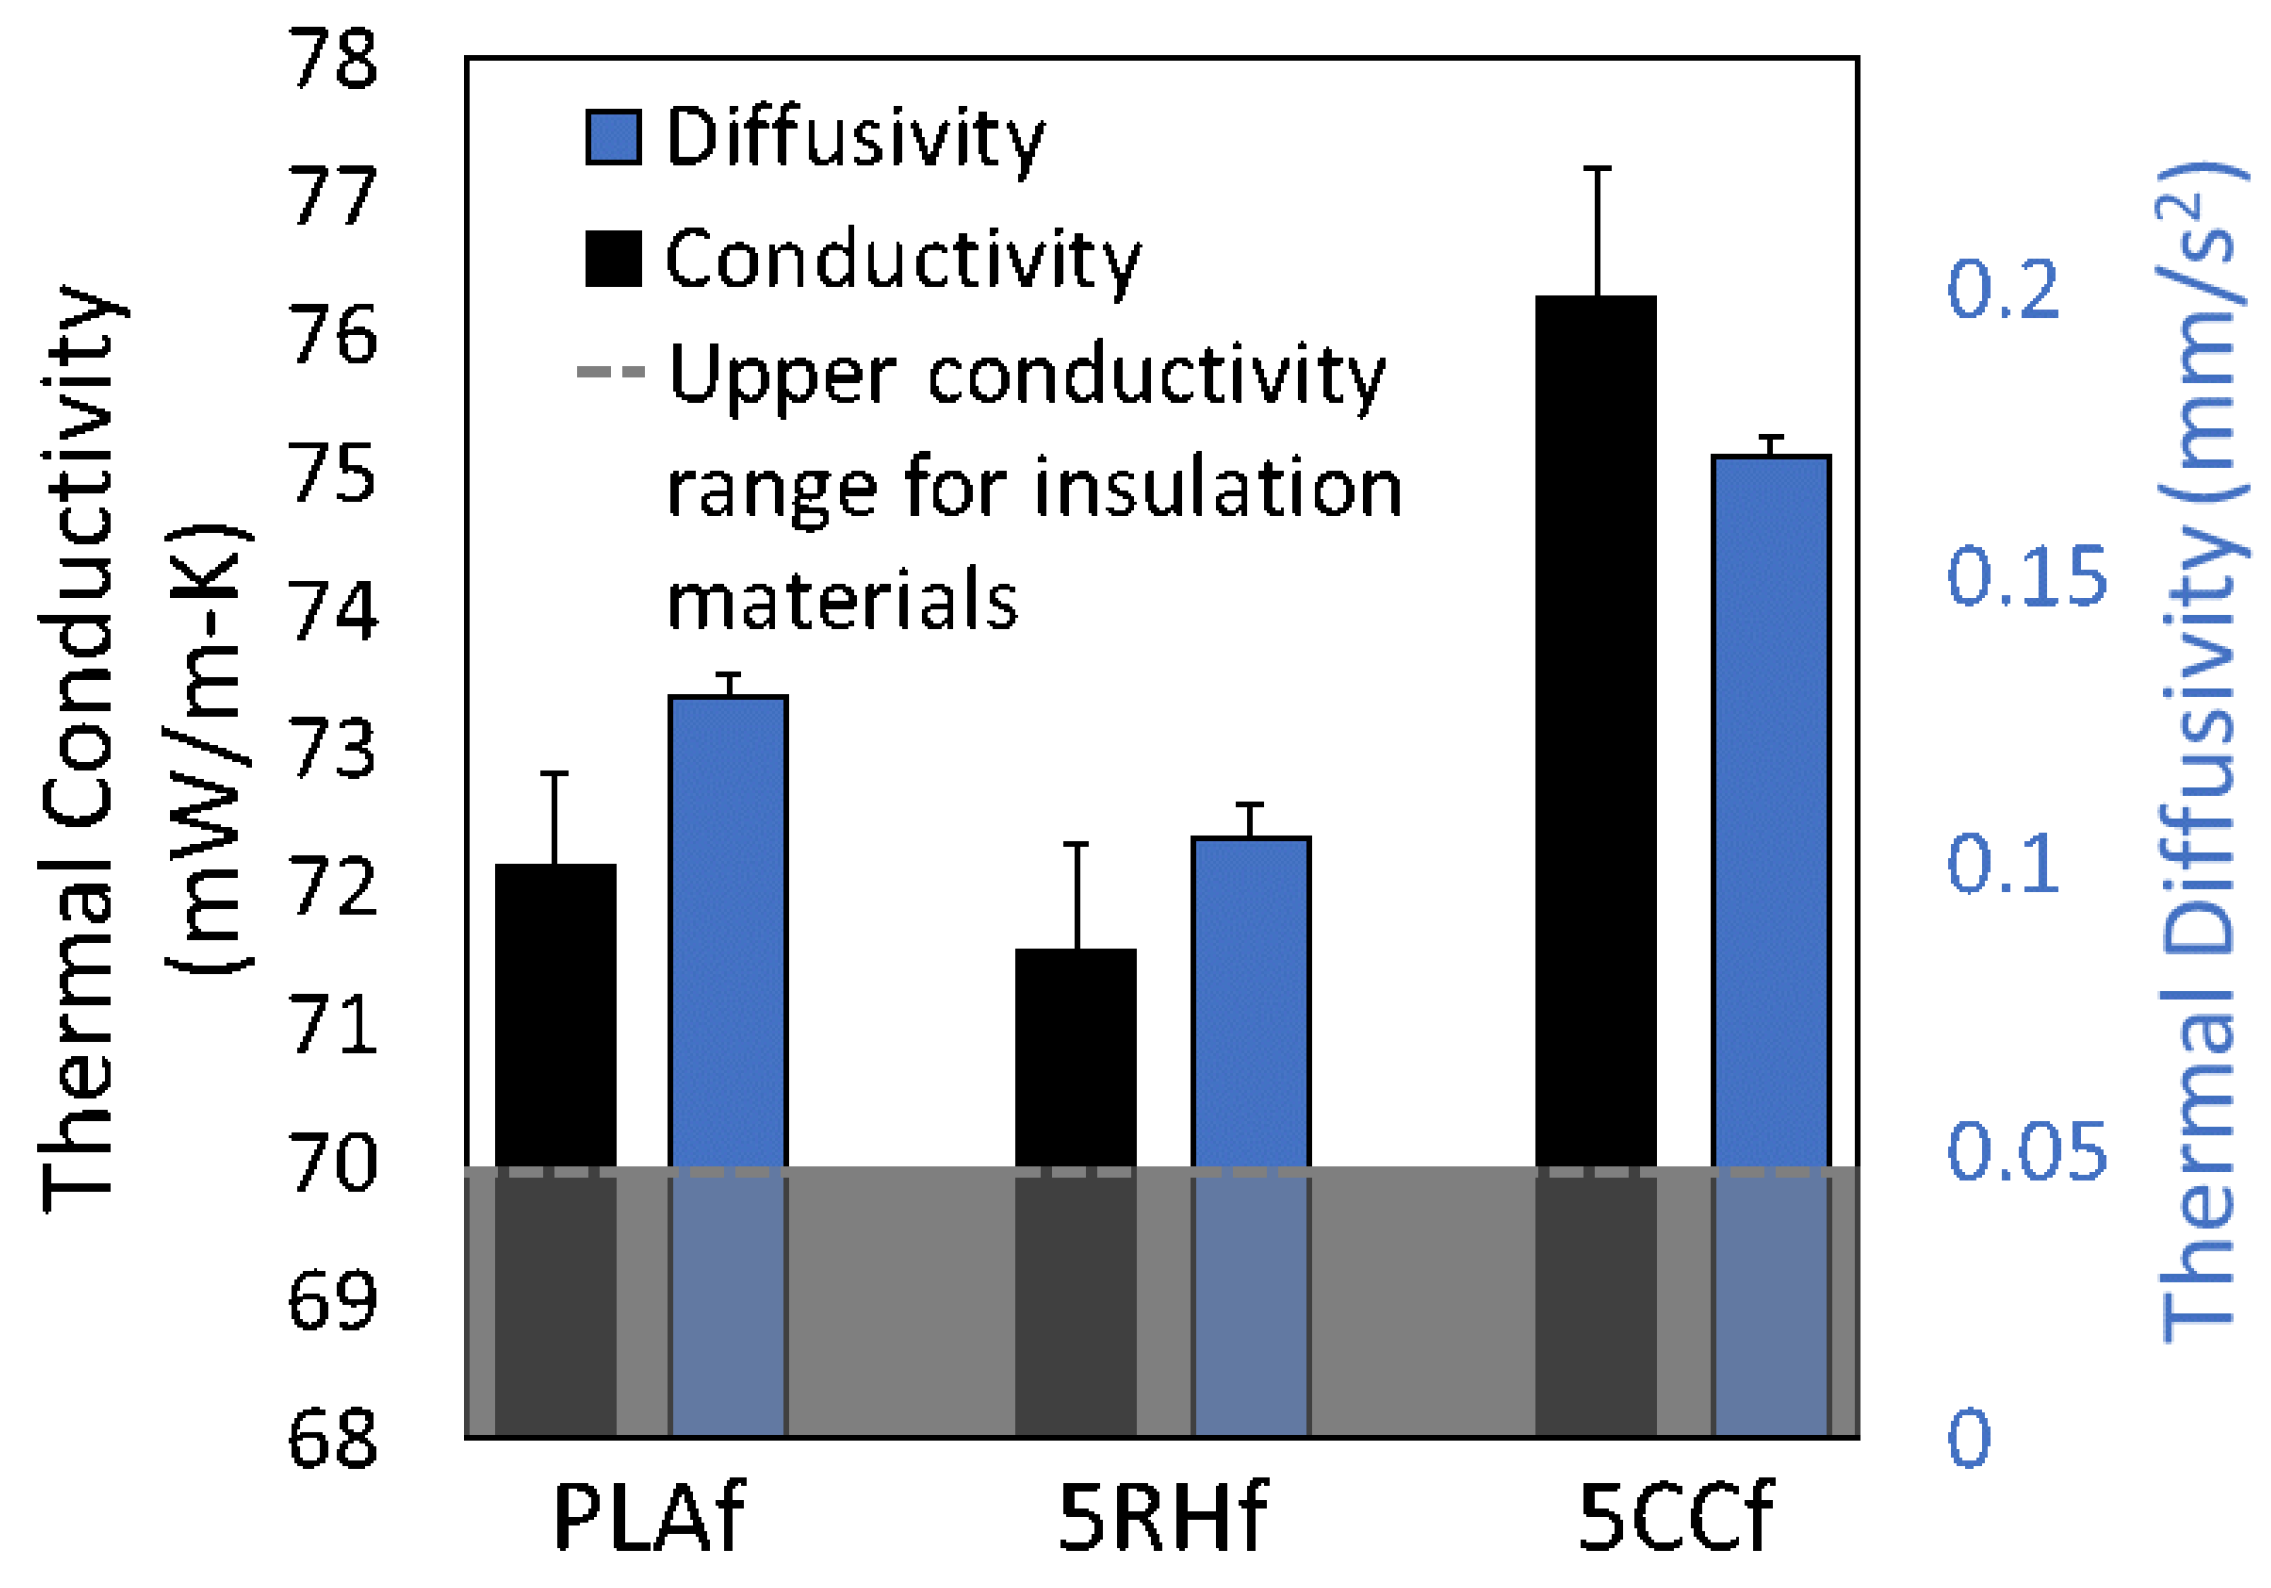
The thermal conductivity and diffusivity analysis indicated that the 0% and 5% biofiller samples possess similar properties. Simple models for PLA foams indicate that thermal conductivity can be related to foam density by a power law [37]. Therefore, thermal conductivity is expected to follow the same trend as density. In the case of the 5% biofiller foams, however, the rice hulls possessed lower thermal conductivity than the coffee chaff—the opposite of what was anticipated, due to the density trends. It should be noted, however, that the difference in thermal conductivity for the three samples in Figure 6 is practically small, with the averages ranging from only 71.5 to 76.2 mW/m-K. The statistical analysis results suggest there are no statistically significant differences between the samples. Similarly, thermal diffusivity is fairly consistent across the three samples. These results are encouraging, as they demonstrate that both biofillers can be used without causing significant change to the foam thermal insulation properties. The insulation materials used in building and packaging applications typically have thermal conductivity ranging from 15 to 70 mW/m-K [38]. The PLA foams with an average conductivity of 72.1 mW/m-K (PLAf) and 71.5 mW/m-K (5RHf) could possibly serve as suitable substitutes for insulation materials at the top of this range.

Figure 6.
Thermal conductivity and thermal diffusivity for the 0% and 5% biofiller foam samples.
3.4. Compression Testing
Compression testing was conducted to assess the mechanical performance of the PLA–biofiller foams. Similar to the thermal insulation properties, it was hypothesized that the compression modulus data would follow the same trend as density. As can be observed in Figure 7, this hypothesis is mostly supported by the data. All of the foam samples have compression moduli above 200 MPa, and all of the biofiller foams are significantly stronger than PLAf. Given that 10CCf had a far higher density than any of the other samples, the increase in modulus, compared to the other samples, was anticipated. However, the other biofiller samples have dramatic increases in modulus, beyond what would be predicted based on density alone. In particular, 5CCf has an average density lower than that of PLAf, but has a compression modulus double that of PLAf. All the biofiller samples have moduli above 300 MPa.
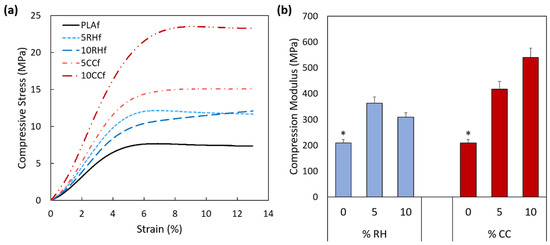
Figure 7.
Compression data for all foam samples: (a) representative stress–strain curves for each sample, and (b) modulus data displayed in terms of weight percentage of each biofiller. The 0% biofiller sample is shown with an asterisk to indicate statistical difference from all other samples.
The statistical analysis determined that 5RHf, 5CCf, and 10CCf are statistically different from PLAf. Additionally, when comparing the coffee chaff and rice hull samples to each other, the modulus of 10CCf is statistically different from all the other samples. Overall, these results suggest that the biofiller significantly increases the compression modulus, and that this phenomenon is likely not entirely attributed to differences in foam density. Given the fairly uniform dispersion of particles throughout the foams, observed in Figure 2, a possible explanation for the increased compression modulus is that the particles are able to both adhere well to the PLA matrix and form a supportive network that acts as mechanical reinforcement [39,40]. Another possibility is that the biofiller particles acted as crystal nucleation sites, thereby increasing the polymer crystallinity and/or formed dipole–dipole interactions with the polymer matrix through hydroxyl groups. Further investigation of the foam mechanical properties, beyond compression testing, may reveal new information. Compression testing is a widely used method to determine foam stiffness, but modal analysis has been demonstrated as an accurate method for measuring the effective elastic modulus [41,42].
3.5. Foam Crystallinity
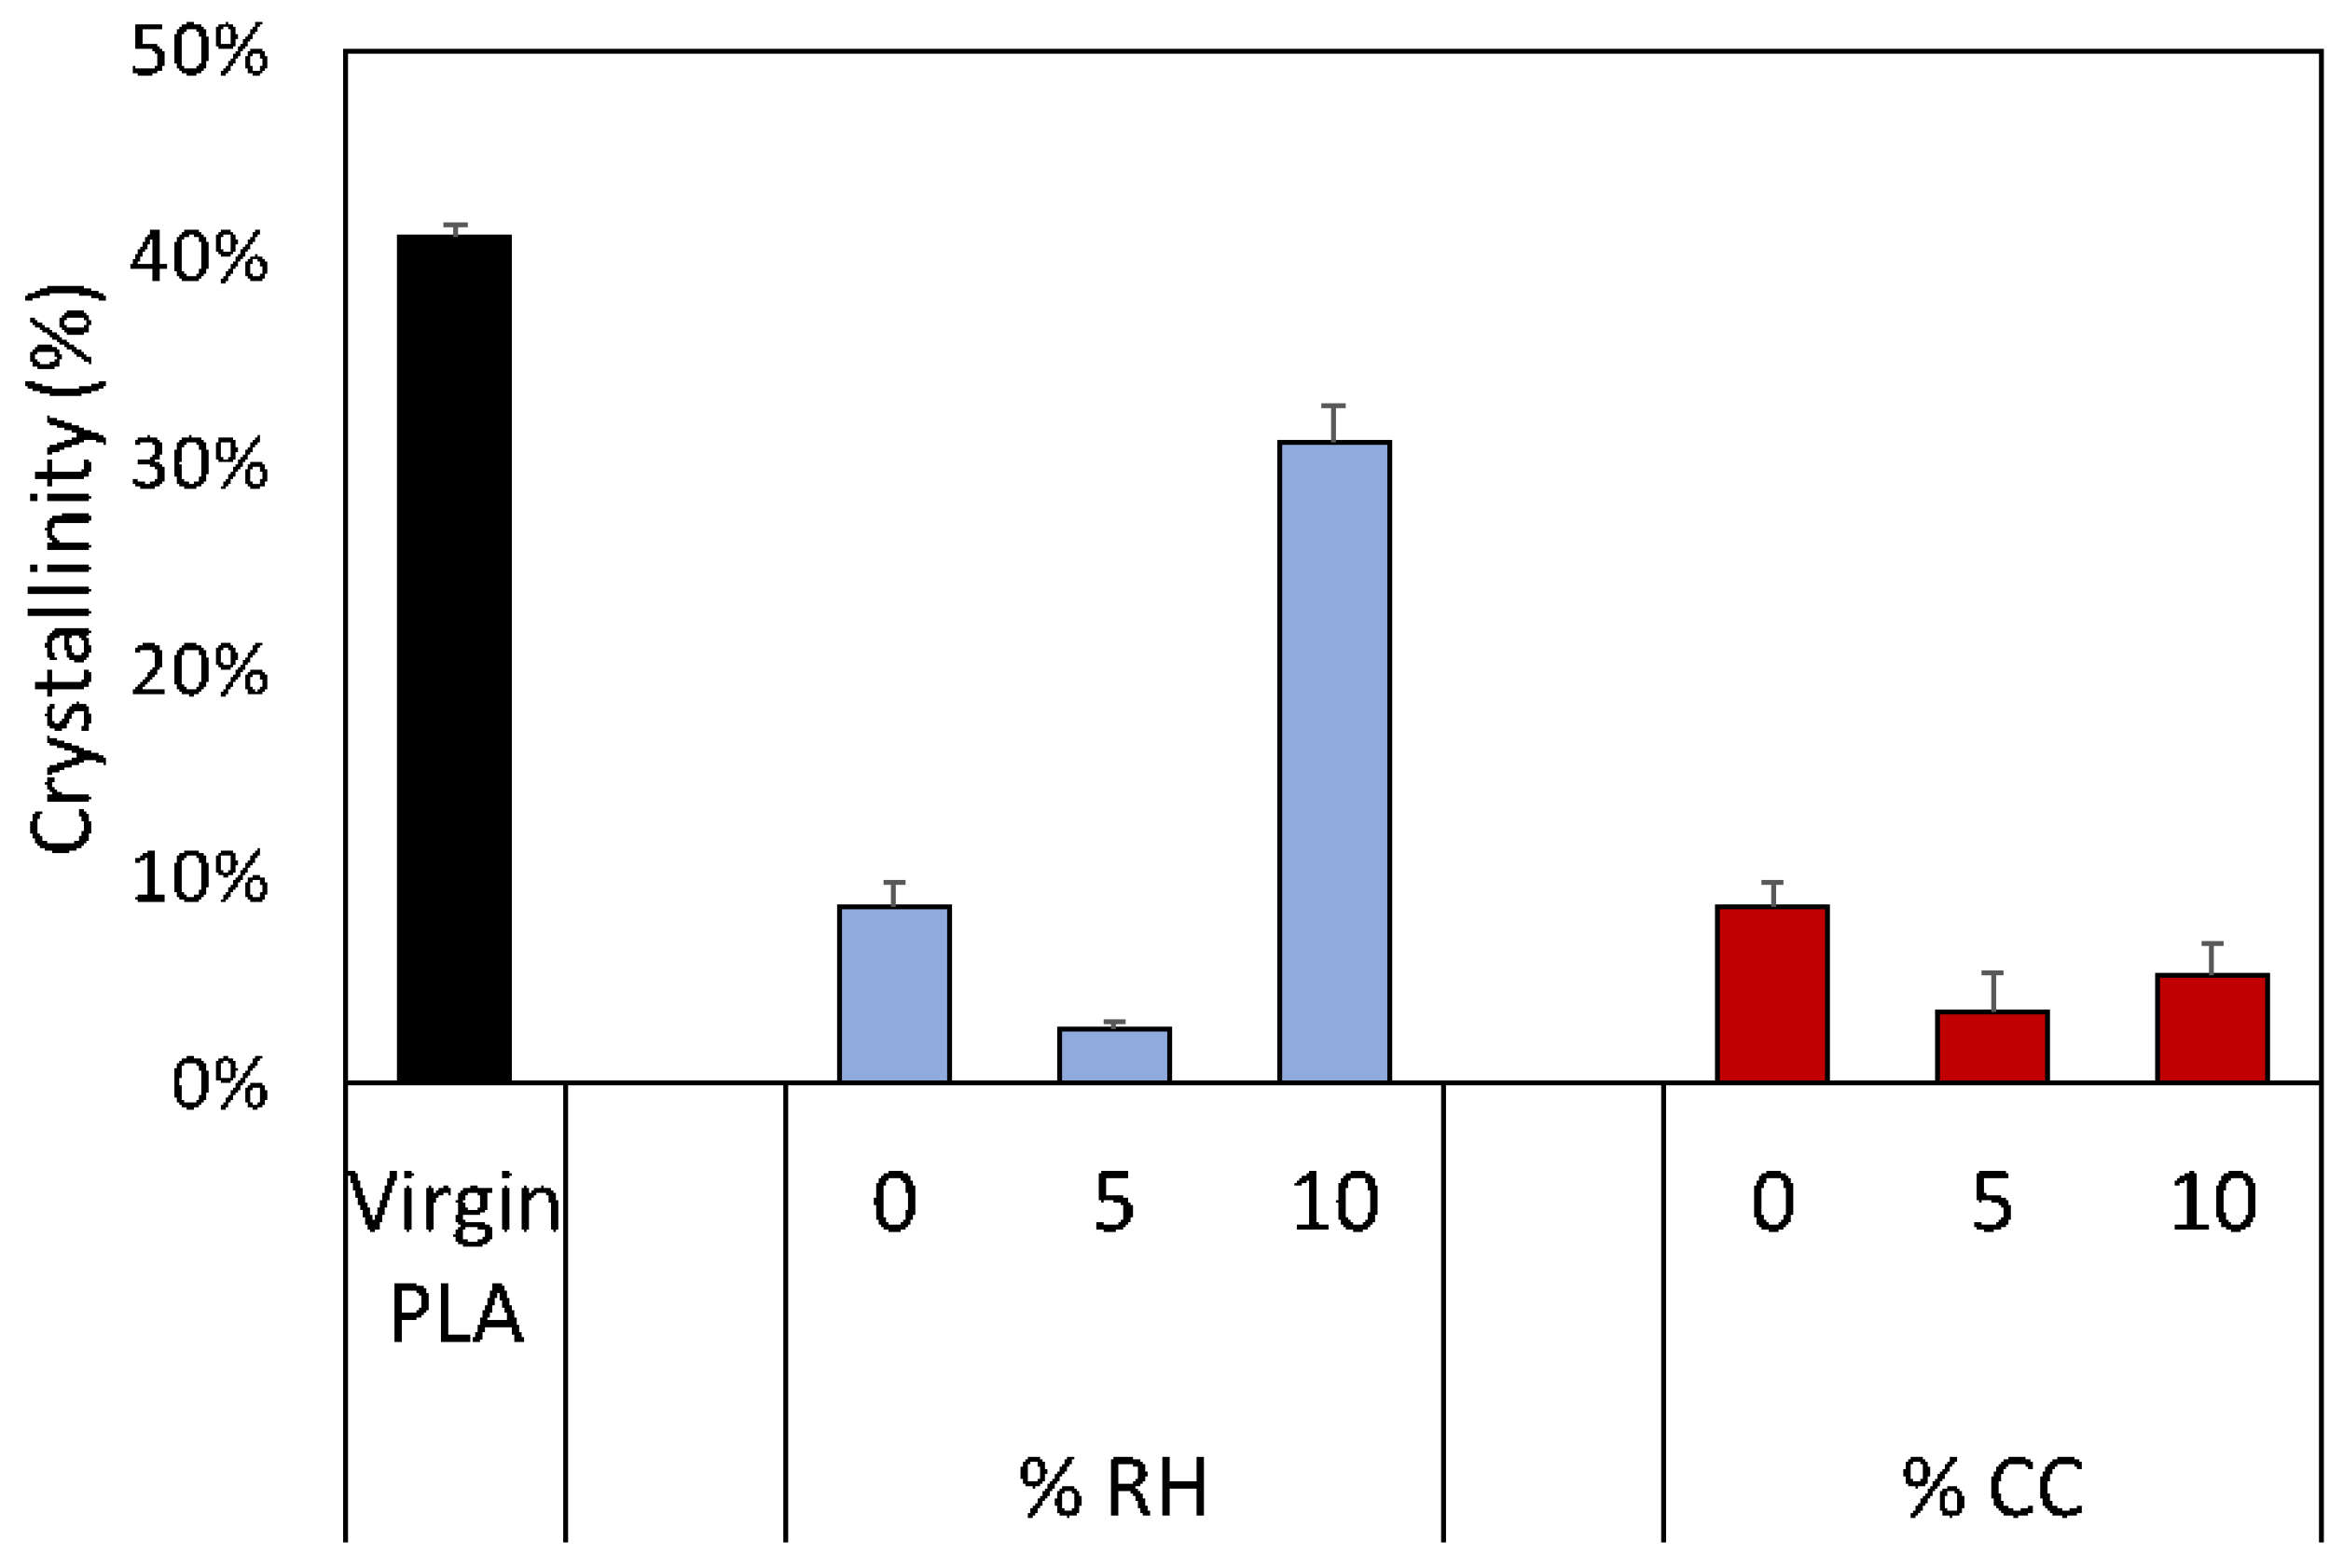
To further investigate the reason for the compression testing results, a DSC analysis was conducted to calculate the crystallinity of the foam samples. All the foam samples were also compared to the virgin PLA prior to processing. In Figure 8, it can be observed that processing the foams causes a 75% reduction in polymer crystallinity, compared to the as-received PLA pellet. The polymer crystallinity is decreased further for the majority of biofiller foam samples, with 5RHf and 5CCf reaching the lowest crystallinities of 2.7% and 3.5%, respectively. Sample 10RHf is the exception, with crystallinity almost as high as the virgin polymer. The reason for this is currently not known. In general, however, it is clear that the biofiller particles do not generally act as crystal nucleation agents, and, therefore, the increased compression modulus cannot be attributed to polymer crystallinity. The FT-IR analysis (see Supplementary Materials Figure S1) revealed no obvious indicators of chemical interactions or hydrogen bonding [43], as the spectra for all the samples tested were essentially identical. Therefore, the mechanism for the change in mechanical performance with biofiller cannot be definitively identified with these results, and further research is needed. The current working hypothesis is that the increased mechanical strength in biofiller foam samples arose from reinforcing particle networks dispersed throughout the polymer matrix.
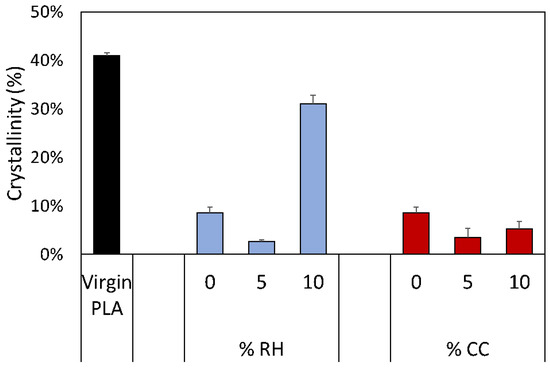
Figure 8.
Crystallinity data for the virgin PLA pellets as received from the supplier and for all foam samples. Foam samples are displayed in terms of weight percentage of each biofiller.
4. Conclusions
The PLA–biofiller blend extruded foams presented in this work are a promising sustainable alternative to traditional rigid petroleum-based foams. Despite the heterogeneity in particle size and morphology, no apparent agglomeration of the biofiller particles was observed. At 5 weight % loading, the biofiller does not cause significant changes to the foam density or insulation properties. The compression testing data indicated an increased modulus from both the rice hull and coffee chaff composites. Additions of 5 weight % rice hull and coffee chaff lead to a modulus increase of 73% and 99%, respectively, relative to the foam without added biofiller. This research indicates that these foams would be well suited for applications requiring mechanical robustness without a significant increase in density. Future work directly comparing these composite PLA foams with traditional foams would be beneficial towards identifying specific applications.
Both rice hulls and coffee chaff are viable as filler materials that can not only reduce the overall cost of the material, but also add value in the form of improved mechanical performance. These results are encouraging and warrant further investigation of other biofillers and increased concentrations. The dramatic increase in density of the 10CCf sample was of particular concern, especially if such increases were to continue with higher coffee chaff loading. An additional challenge is to reduce the heterogeneity in biofiller particle size and morphology. Though the biofillers were thoroughly ground and sieved, the anisotropic nature of the original material leads to broad size distributions.
This work serves as the foundation for future biobased foam studies, which may involve different types of biofillers, landfill-diverted fillers, and other types of polymer and foam materials. The application of biofillers could even be expanded beyond extrusion processing, to include other foaming techniques. The potential for coffee chaff and rice hull to be used as a value-adding filler material in PLA foams is clear from the results presented here. These filler materials should be considered as a means to develop more sustainable and cost-effective polymer composite foams.
Supplementary Materials
The following supporting information can be downloaded at: https://www.mdpi.com/article/10.3390/su14095521/s1, Figure S1: FT-IR spectra of foam samples.
Author Contributions
R.M.; experimental design, sample production, sample preparation, data collection, data analysis, investigation, writing—original draft preparation, writing—review and editing. E.P.; sample preparation, data collection. G.C.; supervision, writing—review and editing. S.J.; supervision, writing—review and editing. K.V.; funding acquisition, supervision, conceptualization, writing—review and editing. All authors have read and agreed to the published version of the manuscript.
Funding
This research was funded by the Polymer and Food Protection Consortium at Iowa State University under grant number GR-015218-00001 DD11523 and by the Agriculture and Home Economics Experiment Station HATCH Project 04202.
Institutional Review Board Statement
Not applicable.
Informed Consent Statement
Not applicable.
Data Availability Statement
The data in this study may be available upon request from the corresponding author.
Acknowledgments
Special thanks to Leistritz in Somerville, NJ, USA for allowing us to use their extrusion foaming facilities.
Conflicts of Interest
The authors declare no conflict of interest.
References
- Chandra, M.; Kohn, C.; Pawlitz, J.; Powell, G. Real Cost of Styrofoam; Saint Louis University: St. Louis, MO, USA, 2016. [Google Scholar]
- EUMEPS. EPS Recycling International. Available online: https://epsrecycling.org/global-recycling-access (accessed on 12 June 2020).
- Maga, D.; Heibel, M.; Aryan, V. A comparative life cycle assessment of meat trays made of various packaing materials. Sustainability 2019, 11, 5324. [Google Scholar] [CrossRef] [Green Version]
- Gabriel, C.-A.; Bortsie-Aryee, N.A.; Apparicio-Farrell, N.; Farrell, E. How supply chain choices affect the life cycle impacts of medical products. J. Clean. Prod. 2018, 182, 1095–1106. [Google Scholar] [CrossRef] [Green Version]
- Razza, F.; Degli Innocenti, F.; Dobon, A.; Aliaga, C.; Sanchez, C.; Hortal, M. Environmental profile of a bio-based and biodegradable foamed packaging prototype in comparison with the current benchmark. J. Clean. Prod. 2015, 102, 493–500. [Google Scholar] [CrossRef]
- Inagrao, C.; Lo Guidice, A.; Bacenetti, J.; Mousavi Khaneghah, A.; Sant’Ana, A.S.; Rana, R.; Siracusa, V. Foamy polystyrene trays for fresh-meat packaging: Life-cycle inventory data collection and environmental impact assessment. Food Res. Int. 2015, 76, 418–426. [Google Scholar] [CrossRef] [PubMed]
- Zabaniotou, A.; Kassidi, E. Life cycle assessment applied to egg packaging made from polystyrene and recycled paper. J. Clean. Prod. 2003, 11, 549–559. [Google Scholar] [CrossRef]
- Cleveland, C.J. Net energy from the extraction of oil and gas in the United States. Energy 2005, 30, 769–782. [Google Scholar] [CrossRef]
- Kale, G.; Kijchavengkul, T.; Auras, R.; Rubino, M.; Selke, S.E.; Singh, S.P. Compostability of bioplastic packaging materials: An overview. Macromol. Biosci. 2007, 7, 255–277. [Google Scholar] [CrossRef]
- Chiellini, E.; Solaro, R. Biodegradable polymeric materials. Adv. Mater. 1996, 8, 305–313. [Google Scholar] [CrossRef]
- Standau, T.; Zhao, C.; Castellon, S.M.; Bonten, C.; Altstadt, V. Chemical modification and foam processing of polylactide (PLA). Polymers 2019, 11, 306. [Google Scholar] [CrossRef] [Green Version]
- Rokkonen, T.; Peltola, H.; Sandquist, D. Foamability and viscosity behavior of extrusion based PLA-pulp fiber biocomposites. J. Appl. Polym. Sci. 2019, 136, 48202. [Google Scholar] [CrossRef]
- Gong, P.; Zhai, S.; Lee, R.; Zhao, C.; Buahom, P.; Li, G.; Park, C.B. Environmentally friendly polylactic acid-based thermal insulation foams blown with supercritical CO2. Ind. Eng. Chem. Res. 2018, 57, 5464–5471. [Google Scholar] [CrossRef]
- Ameli, A.; Jahani, D.; Nofar, M.; Jung, P.U.; Park, C.B. Development of high void fraction polylactide composite foams using injection molding: Mechanical and thermal insulation properties. Compos. Sci. Technol. 2014, 90, 88–95. [Google Scholar] [CrossRef]
- Mihai, M.; Huneault, M.A.; Favis, B.D. Crystallinity development in cellular poly(lactic acid) in the presence of supercritical carbon dioxide. J. Appl. Polym. Sci. 2009, 113, 2920–2932. [Google Scholar] [CrossRef] [Green Version]
- Suwanmanee, U.; Varabuntoonvit, V.; Chaisutthinan, P.; Tagan, M.; Mungcharoen, T.; Leejarkpai, T. Life cycle assessment of single use thermoform boxes made from polystyrene (PS), polylactic acid (PLA), and PLA/starch: Cradle to consumer gate. Int. J. Life Cycle Assess. 2013, 18, 401–417. [Google Scholar] [CrossRef]
- Nofar, M.; Scligil, D.; Carreau, P.J.; Kamal, M.R.; Heuzey, M.-C. Poly (lactic acid) blends: Processing, properties, and applications. Int. J. Biol. Macromol. 2019, 125, 307–360. [Google Scholar] [CrossRef]
- Zimmermann, M.V.; Paola da Silva, M.; Zattera, A.J.; Santana, R.M. Poly(lactic acid) foams reinforced with cellulose micro and nanofibers and foamed by chemical blowing agents. J. Cell. Plast. 2017, 54, 577–596. [Google Scholar] [CrossRef]
- Kmetty, A.; Litauszki, K.; Reti, D. Characterization of different chemical blowing agents and their applicability to produce poly(lactic acid) foams by extrusion. Appl. Sci. 2018, 8, 1960. [Google Scholar] [CrossRef] [Green Version]
- Chauvet, M.; Sauceau, M.; Baillon, F.; Fages, J. Mastering the structure of PLA foams made with extrusion assisted by supercritical CO2. J. Appl. Polym. Sci. 2017, 134, 45067. [Google Scholar] [CrossRef] [Green Version]
- Vadas, D.; Igricz, T.; Sarazin, J.; Bourbigot, S.; Barosi, G.; Bocz, K. Flame retardancy of microcellular poly(lactic acid) foams prepared by supercritical CO2-assisted extrusion. Polym. Degrad. Stab. 2018, 153, 100–108. [Google Scholar] [CrossRef] [Green Version]
- Li, S.; He, G.; Liao, X.; Park, C.B.; Yang, Q.; Li, G. Introduction of a long-chain branching structure by ultraviolet-induced reactive extrusion to improve cell morphology and processing properties of polylactide foam. RSC Adv. 2017, 7, 6266–6277. [Google Scholar] [CrossRef] [Green Version]
- Ludwiczak, J.; Kozlowski, M. Foaming of polylactide in the presence of chain extender. J. Polym. Environ. 2015, 23, 137–142. [Google Scholar] [CrossRef] [Green Version]
- Drury, J. Cheaper, greener, route to bioplastic. Innovation and Intellectual Property; Reuters: London, UK, 2016. Available online: https://reuters.com/article/us-belgium-cheaper-ecoplastic/cheaper-greener-route-to-bioplastic-idUSKCN0VO1E2 (accessed on 10 December 2021).
- Barrett, A. Advantages and Disadvantages of PLA; Bioplastics News, Brussels, Belgium. 2020. Available online: https://bioplasticsnews.com/2020/06/09/polylactic-acid-pla-dis-advantages/ (accessed on 10 December 2021).
- Wang, G.; Wang, L.; Mark, L.H.; Shaayegan, V.; Wang, G.; Li, H.; Zhao, G.; Park, C.B. Ultralow-threshold and lightweight biodegradable porous PLA/MWCNT with segregated conductive networks for high-performance thermal insulation and electromagnetic interference shielding applications. ACS Appl. Mater. Interfaces 2018, 10, 1195–1203. [Google Scholar] [CrossRef] [PubMed]
- He, T.; Liao, X.; He, Y.; Li, G. Novel electric conductive polylactide/carbon nanotubes foams prepared by supercritical CO2. Prog. Nat. Sci. Mater. Int. 2013, 23, 395–401. [Google Scholar] [CrossRef] [Green Version]
- Zhou, J.; Yao, Z.; Zhou, C.; Wei, D.; Li, S. Mechanical properties of PLA/PBS foamed composites reinforced by organic montmorillonite. J. Appl. Polym. Sci. 2015, 131, 40773. [Google Scholar] [CrossRef]
- Keshtkar, M.; Nofar, M.; Park, C.B.; Carreau, P.J. Extruded PLA/clay nanocomposite foams blown with supercritical CO2. Polymer 2014, 55, 4077–4090. [Google Scholar] [CrossRef]
- ASTM. D1621-16 Standard Test Method for Compressive Properties of Rigid Cellular Plastics; ASTM: West Conshohocken, PA, USA, 2016. [Google Scholar]
- Quero, E.; Muller, A.J.; Signori, F.; Coltelli, M.-B.; Bronco, S. Isothermal cold-crystallization of PLA/PBAT blends with and without the addition of acetyl tributyl citrate. Macromol. Chem. Phys. 2012, 213, 36–48. [Google Scholar] [CrossRef]
- Tessema, A.; Zhao, D.; Moll, J.; Xu, S.; Yang, R.; Li, C.; Kumar, S.K.; Kidane, A. Effect of filler loading, geometry, dispersion and temperature on thermal conductivity of polymer nanocomposites. Polym. Test. 2017, 57, 101–106. [Google Scholar] [CrossRef] [Green Version]
- Al-Saleh, M.H.; Sundararaj, U. Review of the mechanical properties of carbon nanofiber/polymer composites. Compos. Part A Appl. Sci. Manuf. 2011, 42, 2126–2142. [Google Scholar] [CrossRef]
- Schellenberg, J.; Wallis, M. Dependence of thermal properties of expandable polystyrene particle foam on cell size and density. J. Cell. Plast. 2010, 46, 209–222. [Google Scholar] [CrossRef]
- Williams, R.J.J.; Aldao, C.M. Thermal conductivity of plastic foam. Polym. Eng. Sci. 1983, 23, 293–298. [Google Scholar] [CrossRef]
- Chen, W.; Hao, H.; Hughes, D.; Shi, Y.; Cui, J.; Li, Z.-X. Static and dynamic mechanical properties of expanded polystyrene. Mater. Des. 2015, 69, 170–180. [Google Scholar] [CrossRef]
- Mort, R.; Vorst, K.; Curtzwiler, G.; Jiang, S. Biobased foams for thermal insulation: Material selection, processing, modelling, and performance. RSC Adv. 2021, 11, 4375–4394. [Google Scholar] [CrossRef] [PubMed]
- Hung Anh, L.D.; Pasztory, Z. An overview of factors influencing thermal conductivity of building insulation materials. J. Build. Eng. 2021, 44, 102604. [Google Scholar] [CrossRef]
- Kargarzadeh, H.; Mariano, M.; Huang, J.; Lin, N.; Ahmad, I.; Dufresne, A.; Thomas, S. Recent developments on nanocellulose reinforced polymer nanocomposites: A review. Polymer 2017, 132, 368–393. [Google Scholar] [CrossRef]
- Feng, Y.; Chen, X.; Li, Y.; Wang, Y.; Li, H.; Zhou, G. Comparison with experiment, model, and simulation for thermal conductive mechanism of polymer composites without particle network. Macromol. Chem. Phys. 2021, 222, 2100200. [Google Scholar] [CrossRef]
- Kadar, C.; Szlancsik, A.; Dombovari, Z.; Orbulov, I.N. Monitoring the failure states of a metal matrix syntactic foam by modal analysis. Mater. Lett. 2019, 257, 126733. [Google Scholar] [CrossRef] [Green Version]
- Szlancsik, A.; Katona, B.; Dombovari, Z.; Orbulov, I.N. On the effective Young’s modulus of metal matrix syntactic foams. Mater. Sci. Technol. 2017, 33, 2283–2289. [Google Scholar] [CrossRef]
- Socrates, G. Infrared and Raman Characteristic Group Frequencies: Tables and Charts, 3rd ed.; John Wiley & Sons: West Sussex, UK, 2001. [Google Scholar]


Publisher’s Note: MDPI stays neutral with regard to jurisdictional claims in published maps and institutional affiliations. |
© 2022 by the authors. Licensee MDPI, Basel, Switzerland. This article is an open access article distributed under the terms and conditions of the Creative Commons Attribution (CC BY) license (https://creativecommons.org/licenses/by/4.0/).