
A Comprehensive Sustainability Assessment of Battery Electric Vehicles, Fuel Cell Electric Vehicles, and Internal Combustion Engine Vehicles through a Comparative Circular Economy Assessment Approach


Abstract
:1. Introduction
2. Literature Review
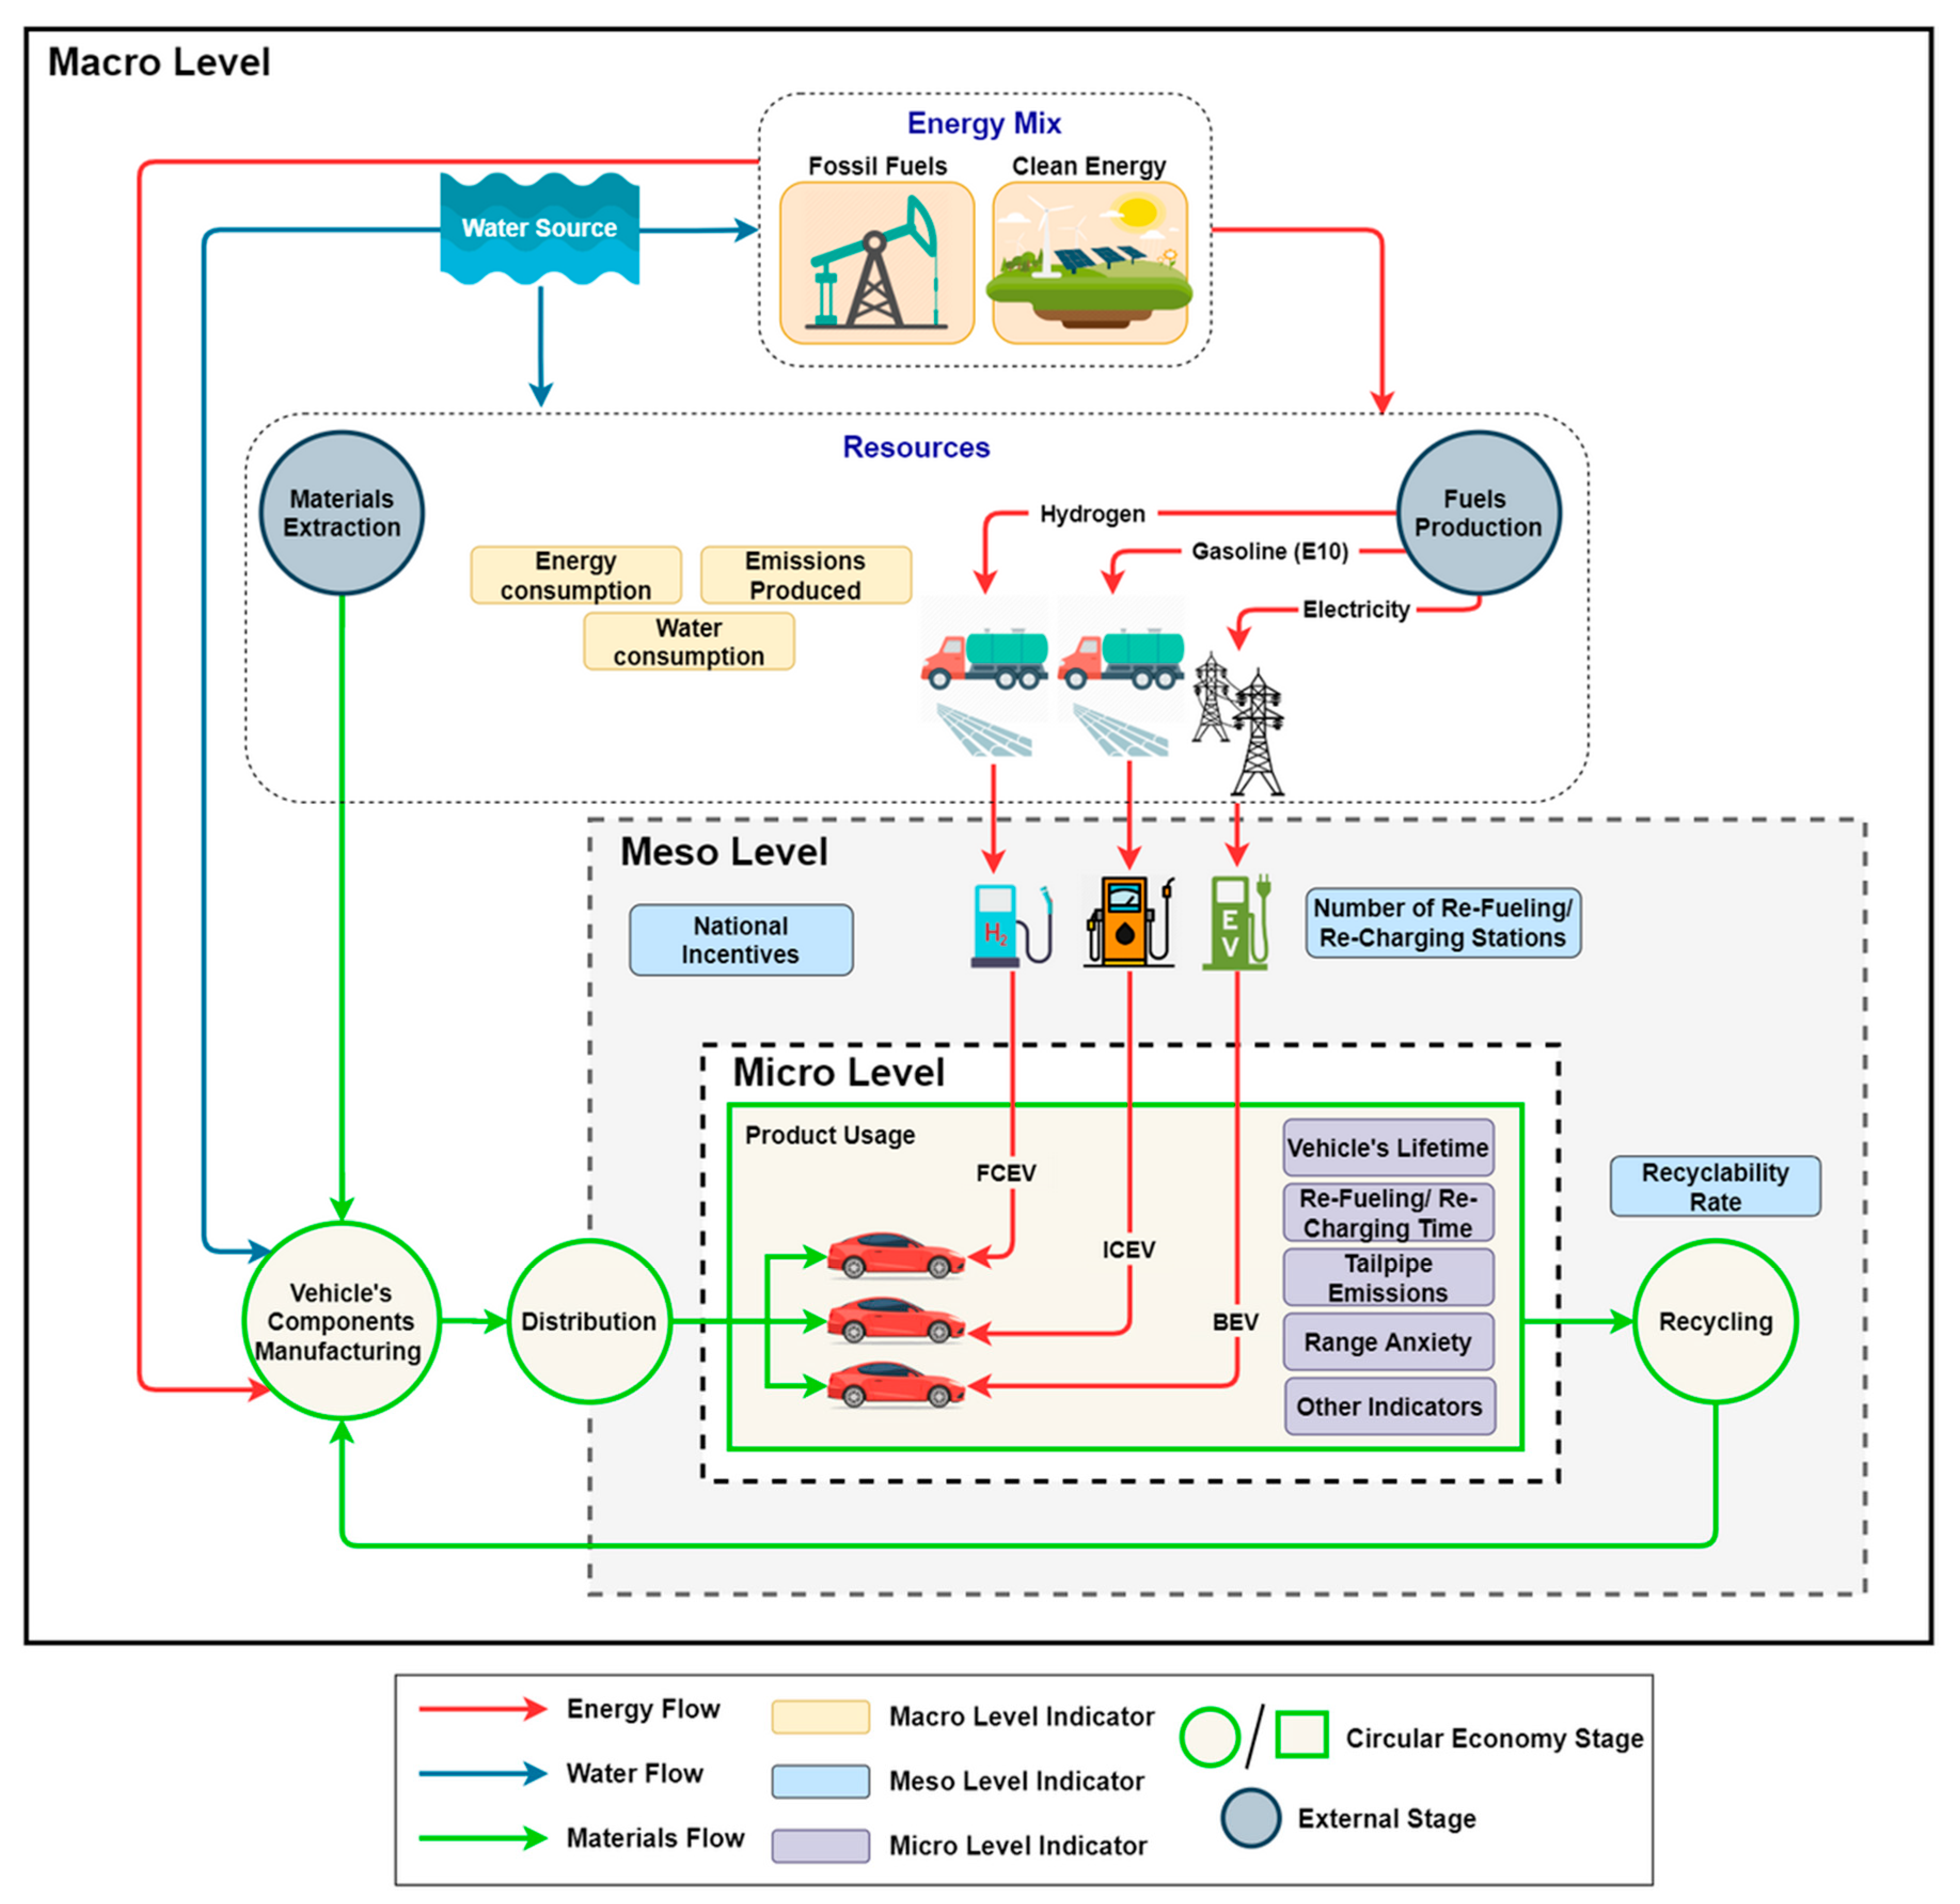
3. Materials and Methods
3.1. Macro Level Indicators
3.1.1. Fuel Production
3.1.2. Vehicle Components Material Production
3.1.3. Battery Production
3.2. Meso Level Indicators
3.2.1. Number of Refueling Stations across the U.S.
3.2.2. National Incentives
3.2.3. Recyclability Rate
3.3. Micro Level Indicators
3.3.1. Total Cost of Operation
3.3.2. Vehicle’s Lifetime
3.3.3. Refueling/Recharging Time
3.3.4. Tailpipe Emissions
3.3.5. Required Maintenance Frequency (RMF)
3.3.6. Vehicle Efficiency
3.3.7. Energy Source Utilization
3.3.8. Range on Full Tank/Battery
3.3.9. Technology Readiness Level (TRL) Scale
3.3.10. Range Anxiety
3.4. Circularity Scores Calculation
| Indicator 1 | Indicator 2 | Indicator 3 | Indicator 4 | |
| ICEV (r = 1) | x11 | x12 | …… | x1w |
| BEV (r = 1) | x21 | x22 | …… | x2w |
| FCEV (r = 1) | x31 | x32 | …… | x3w |
4. Results and Discussion
4.1. Macro Level Indicators
4.2. Meso Level Indicators
4.3. Micro Level Indicators
4.4. Final Circularity Scores
5. Conclusions
- –
- Results show that BEVs are the most suitable alternative to ICEVs to promote the transition to circular economies and to accelerate sustainable development.
- –
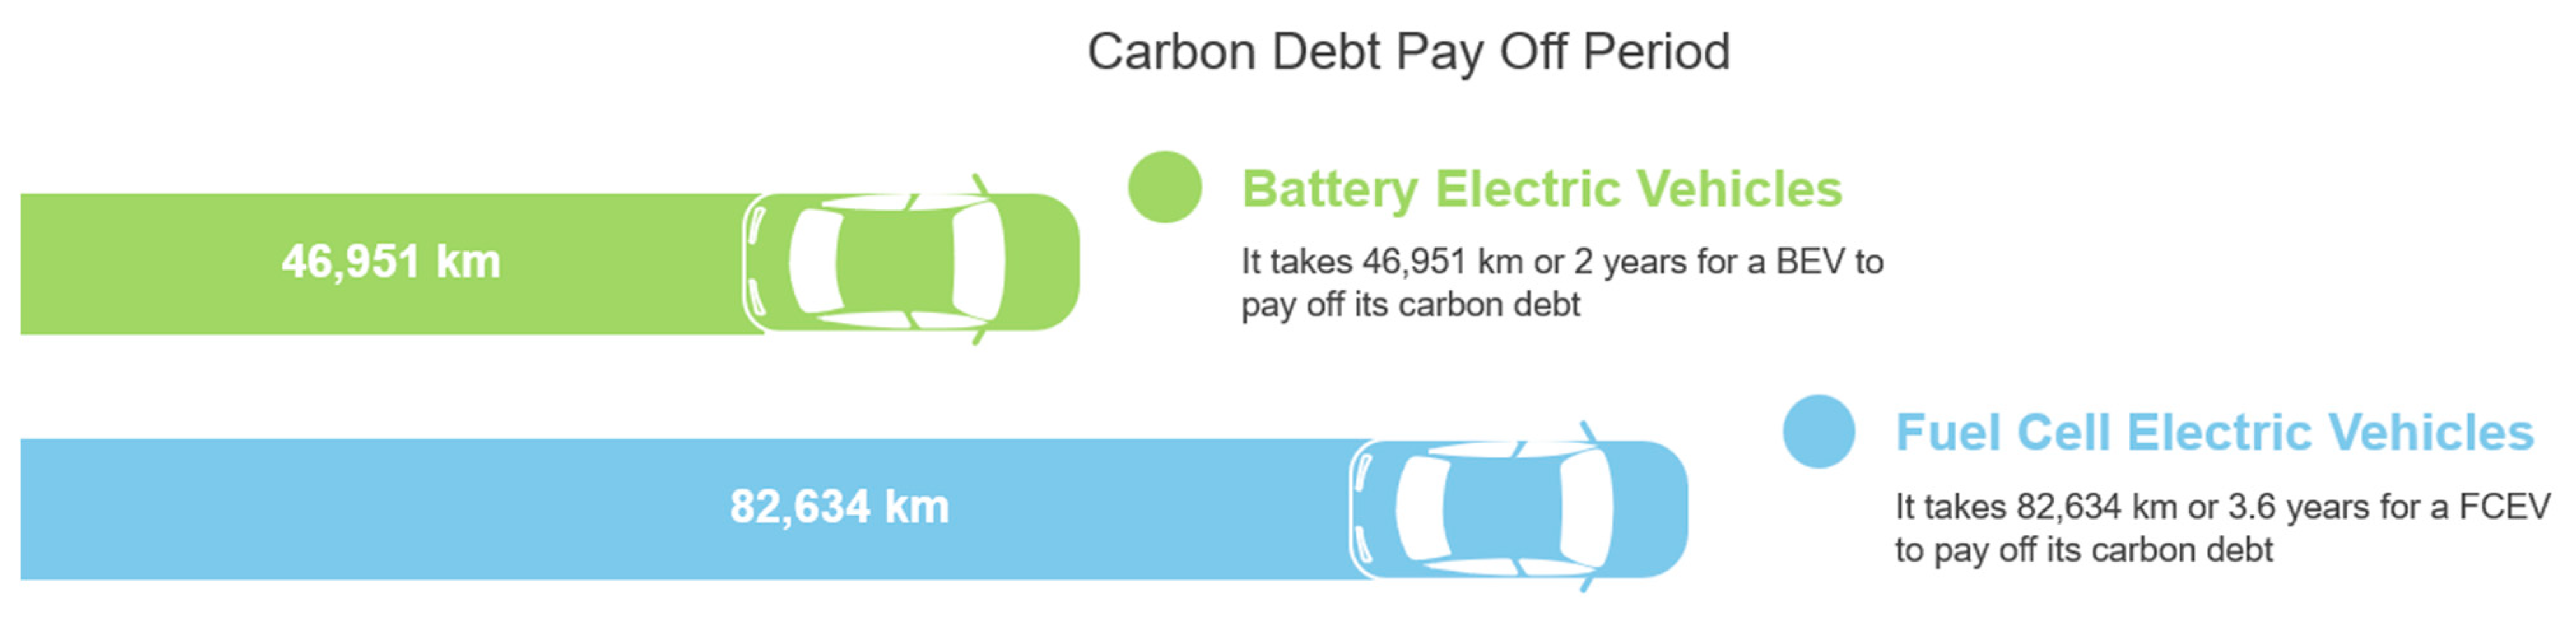
- The upstream processes involved in the production of BEVs and FCEVs fuels, produces substantial amounts of emissions.
- –
- To enhance the circularity of electricity production, clean energy share should increase in the energy mix used. However, by increasing the clean energy share in the energy mix, water consumption also increases. This is mainly due to the increase in the nuclear energy share.
- –
- Different energy mixes should be further investigated to obtain an optimum clean energy mix that will not use substantial amounts of resources.
- –
- Similarly, to increase the circularity of hydrogen production, natural gas should be substituted by water as the source of hydrogen. However, the process of electrolysis that produces hydrogen from water uses a considerable amount of electricity. Thus, electricity should be generated from clean energy sources only to sustain circularity.
- –
- The average costs of purchasing a BEV or FCEV are higher than that of an ICEV. However, by adding the operational costs of the three vehicles throughout the assessment period of 10 years, a BEV will only cost an additional 1573 USD. On the other hand, an FCEV will cost an additional 37,103 USD. These cost differences decrease as technologies improve.
- –
- BEVs enabling infrastructure is improving, making it socially more acceptable and convenient. Yet, FCEVs are not a convenient option at the time being, given the very limited available hydrogen refueling stations.
- –
- 95% of BEVs and FCEVs main components can be recycled making their end-of-life handling better than that of ICEVs.
- –
- Overall, BEVs are considered more circular than both ICEVs and FCEVs. However, several improvements are yet to be made to achieve the global environmental targets of carbon neutrality and sustainable development.
Supplementary Materials
Author Contributions
Funding
Institutional Review Board Statement
Informed Consent Statement
Data Availability Statement
Conflicts of Interest
References
- IEA. Greenhouse Gas Emissions from Energy: Overview. 2021. Available online: https://www.iea.org/reports/greenhouse-gas-emissions-from-energy-overview/emissions-by-sector#abstract (accessed on 1 March 2022).
- EPA. Fast Facts on Transportation Greenhouse Gas Emissions EPA, 11 February 2022. Available online: https://www.epa.gov/greenvehicles/fast-facts-transportation-greenhouse-gas-emissions (accessed on 24 March 2022).
- Victoria Transport Policy Institute. Transportation Cost and Benefit Analysis II—Air Pollution Costs; Victoria Transport Policy Institute: Victoria, BC, Canada, 2020. [Google Scholar]
- OECD. The Economic Consequences of Outdoor Air Pollution; OECD: Paris, France, 2016. [Google Scholar]
- EIA. Use of Energy in Transportation in Depth. IEA, 21 May 2021. Available online: https://www.eia.gov/energyexplained/use-of-energy/transportation-in-depth.php (accessed on 24 March 2022).
- EIA. U.S. Energy Information Administration—Annual Energy Outlook 2022. EIA, 2022. Available online: https://www.eia.gov/outlooks/aeo/data/browser/#/?id=49-AEO2022®ion=0-0&cases=ref2022&start=2020&end=2050&f=A&linechart=ref2022-d011222a.4-49-AEO2022~~~~~~~~~~~~~~~&ctype=linechart&sid=ref2022-d011222a.25-49-AEO2022&sourcekey=0 (accessed on 28 March 2022).
- European Commission. Paris Agreement, European Commission, 2019. Available online: https://ec.europa.eu/clima/eu-action/international-action-climate-change/climate-negotiations/paris-agreement_en (accessed on 2 April 2022).
- Greene, D.L.; Park, S.; Liu, C. Public policy and the transition to electric drive vehicles in the US: The role of the zero emission vehicles mandates. Energy Strategy Rev. 2014, 5, 66–77. [Google Scholar] [CrossRef]
- Wolfram, P.; Weber, S.; Gillingham, K.; Hertwich, E.G. Pricing indirect emissions accelerates low—carbon transition of US light vehicle sector. Nat. Commun. 2021, 12, 1–8. [Google Scholar] [CrossRef]
- UN. Report of the World Summit on Sustainable Development; United Nations: Johannesburg, South Africa, 2002. [Google Scholar]
- Zheng, G.; Peng, Z. Life Cycle Assessment (LCA) of BEV’s environmental benefits for meeting the challenge of ICExit (Internal Combustion Engine Exit). Energy Rep. 2021, 7, 1203–1216. [Google Scholar] [CrossRef]
- Candelaresi, D.; Valente, A.; Iribarren, D.; Dufour, J.; Spazzafumo, G. Comparative life cycle assessment of hydrogen-fuelled passenger cars. Int. J. Hydrogen Energy 2021, 46, 35961–35973. [Google Scholar] [CrossRef]
- Accenture. Roadmap for the automotive circular economy, Accenture, 1 March 2021. Available online: https://www.accenture.com/dk-en/insights/automotive/roadmap-circular-economy#:~:text=Circular%20economy%20approaches%20can%20help,to%20jointly%20drive%20transformative%20solutions (accessed on 30 March 2022).
- Ahmed, A.A.; Nazzal, M.A.; Darras, B.M. Cyber-physical systems as an enabler of circular economy to achieve sustainable development goals: A comprehensive review. Int. J. Precis. Eng. Manuf.-Green Technol. 2021, 9, 955–975. [Google Scholar] [CrossRef]
- Kenniskaarten. What are the Disadvantages of the Current Linear Economy?, Kenniskaarten, 2020. Available online: https://kenniskaarten.hetgroenebrein.nl/en/knowledge-map-circular-economy/ce-disadvantages-linear-economy/ (accessed on 30 March 2022).
- Alaerts, L.; Van Acker, K.; Rousseau, S.; De Jaeger, S.; Moraga, G.; Dewulf, J.; De Meester, S.; Van Passel, S.; Compernolle, T.; Bachus, K.; et al. Towards a more direct policy feedback in circular economy monitoring via a societal needs perspective. Resour. Conserv. Recycl. 2019, 149, 363–371. [Google Scholar] [CrossRef]
- Martins, A.V.; Godina, R.; Azevedo, S.G.; Carvalho, H. Towards the development of a model for circularity: The circular car as a case study. Sustain. Energy Technol. Assess. 2021, 45, 101215. [Google Scholar] [CrossRef]
- Bobba, S.; Tecchio, P.; Ardente, F.; Mathieux, F.; dos Santos, F.M.; Pekar, F. Analysing the contribution of automotive remanufacturing to the circularity of materials. Procedia CIRP 2020, 90, 67–72. [Google Scholar] [CrossRef]
- Shafique, M.; Luo, X. Environmental life cycle assessment of battery electric vehicles from the current and future energy mix perspective. J. Environ. Manag. 2021, 303, 114050. [Google Scholar] [CrossRef]
- Huo, H.; Cai, H.; Zhang, Q.; Liu, F.; He, K. Life-cycle assessment of greenhouse gas and air emissions of electric vehicles: A comparison between China and the U.S. Atmos. Environ. 2015, 108, 107–116. [Google Scholar] [CrossRef]
- Koroma, M.S.; Costa, D.; Philippot, M.; Cardellini, G.; Hosen, S.; Coosemans, T.; Messagie, M. Life cycle assessment of battery electric vehicles: Implications of future electricity mix and different battery end-of-life management. Sci. Total Environ. 2022, 831, 154859. [Google Scholar] [CrossRef]
- Choma, E.F.; Ugaya, C.M.L. Environmental impact assessment of increasing electric vehicles in the Brazilian fleet. J. Clean. Prod. 2017, 152, 497–507. [Google Scholar] [CrossRef]
- Sen, B.; Onat, N.C.; Kucukvar, M.; Tatari, O. Material footprint of electric vehicles: A multiregional life cycle assessment. J. Clean. Prod. 2018, 209, 1033–1043. [Google Scholar] [CrossRef]
- Xia, X.; Li, P. A review of the life cycle assessment of electric vehicles: Considering the influence of batteries. Sci. Total. Environ. 2022, 814, 152870. [Google Scholar] [CrossRef]
- Shi, S.; Zhang, H.; Yang, W.; Zhang, Q.; Wang, X. A life-cycle assessment of battery electric and internal combustion engine vehicles: A case in Hebei Province, China. J. Clean. Prod. 2019, 228, 606–618. [Google Scholar] [CrossRef]
- Tang, B.; Xu, Y.; Wang, M. Life Cycle Assessment of Battery Electric and Internal Combustion Engine Vehicles Considering the Impact of Electricity Generation Mix: A Case Study in China. Atmosphere 2022, 13, 252. [Google Scholar] [CrossRef]
- Shafique, M.; Azam, A.; Rafiq, M.; Luo, X. Life cycle assessment of electric vehicles and internal combustion engine vehicles: A case study of Hong Kong. Res. Transp. Econ. 2021, 91, 101112, in press. [Google Scholar] [CrossRef]
- Chen, Z.; Carrel, A.L.; Gore, C.; Shi, W. Environmental and economic impact of electric vehicle adoption in the U.S. Environ. Res. Lett. 2021, 16, 045011. [Google Scholar] [CrossRef]
- Abas, A.E.P.; Yong, J.; Mahlia, T.M.I.; Hannan, M.A. Techno-Economic Analysis and Environmental Impact of Electric Vehicle. IEEE Access 2019, 7, 98565–98578. [Google Scholar] [CrossRef]
- Ajanovic, A.; Haas, R. Economic and Environmental Prospects for Battery Electric- and Fuel Cell Vehicles: A Review. Fuel Cells 2019, 19, 515–529. [Google Scholar] [CrossRef]
- Miotti, M.; Hofer, J.; Bauer, C. Integrated environmental and economic assessment of current and future fuel cell vehicles. Int. J. Life Cycle Assess. 2015, 22, 94–110. [Google Scholar] [CrossRef] [Green Version]
- Melchiorre, D.A.; Küfeoğlu, S. Economic Assessment of Using Electric Vehicles and Batteries as Domestic Storage Units in the United Kingdom; Energy Policy Research Group, University of Cambridge: Cambridge, UK, 2018. [Google Scholar]
- Liao, F.; Molin, E.; van Wee, B. Consumer preferences for electric vehicles: A literature review. Transp. Rev. 2016, 37, 252–275. [Google Scholar] [CrossRef] [Green Version]
- Thomas, C. Fuel cell and battery electric vehicles compared. Int. J. Hydrogen Energy 2009, 34, 6005–6020. [Google Scholar] [CrossRef] [Green Version]
- Wang, Y.; Zhou, G.; Li, T.; Wei, X. Comprehensive Evaluation of the Sustainable Development of Battery Electric Vehicles in China. Sustainability 2019, 11, 5635. [Google Scholar] [CrossRef] [Green Version]
- Wong, E.; Ho, D.; So, S.; Tsang, C.-W.; Chan, E. Life Cycle Assessment of Electric Vehicles and Hydrogen Fuel Cell Vehicles Using the GREET Model—A Comparative Study. Sustainability 2021, 13, 4872. [Google Scholar] [CrossRef]
- Ahmed, A.A.; Nazzal, M.A.; Darras, B.M.; Deiab, I. A comprehensive multi-level circular economy assessment frame-work. Sustain. Prod. Consum. 2022, 32, 700–717. [Google Scholar] [CrossRef]
- FHWA. Highway Statistics 2019—Policy|Fedral Highway Administration. 2019. Available online: https://www.fhwa.dot.gov/policyinformation/statistics/2019/ (accessed on 10 March 2022).
- EPA. The 2020 EPA Automotive Trends Report; United States Environmental Protection Agency: Washington, DC, USA, 2021. [Google Scholar]
- EPA; DOE. Fuel Economy Guid; The U.S. Environmental Protection Agency (EPA): Washington, DC, USA; U.S. Department of Energy (DOE): Washington, DC, USA, 2021. [Google Scholar]
- DOE. DOE Hydrogen Program Record; U.S. Department of Energy (DOE): Washington, DC, USA, 2021. [Google Scholar]
- GREET. 2018 Net Software v1.3.0.13395, Greet Life Cycle Model 2018Argonne. Argonee National Laboratory. 2018. Available online: https://greet.es.anl.gov (accessed on 10 March 2022).
- EIA. Biofuels Explained, 24 August 2020. Available online: https://www.eia.gov/energyexplained/biofuels/ (accessed on 11 March 2022).
- EIA. Annual Energy Outlook 2019; U.S. Energy Information Administration: Washington, DC, USA, 2019. [Google Scholar]
- DOE. Hydrogen Strategy Enabling a Low-Carbon Economy; U.S. Department of energy: Washington, DC, USA, 2020. [Google Scholar]
- API. API Servive Station FAQ. 2021. Available online: https://www.api.org/oil-and-natural-gas/consumer-information/consumer-resources/service-station-faqs (accessed on 12 March 2022).
- DOE. Alternative Fuels Data Center: Alternative Fueling Station Counts by State; U.S. Department of Energy (DOE): Washington, DC, USA, 2022. Available online: https://afdc.energy.gov/stations/states (accessed on 13 March 2022).
- DOE. Federal and State Laws and Incentives; U.S. Department of Energy (DOE): Washington, DC, USA, 2021. Available online: https://afdc.energy.gov/laws/search (accessed on 14 March 2022).
- COLTURA. Gasoline Vehicle Phaseout Advances Around the World. Available online: https://www.coltura.org/world-gasoline-phaseouts (accessed on 14 March 2022).
- American Iron and Steel Institute. Sustainability: American Iron and Steel Institute. 2020. Available online: https://www.steel.org/sustainability/#:~:text=Steel%20is%20100%20percent%20recyclable,same%20quality%20again%20and%20again (accessed on 15 March 2022).
- Alumeco Group. Aluminium: More than 95% recycled. 2022. Available online: https://www.alumeco.com/knowledge-technique/general/recycling-of-aluminium (accessed on 15 March 2022).
- International Copper Association. Copper Recycling. 2017. Available online: https://copperalliance.org/wp-content/uploads/2017/03/ica-copper-recycling-201712-A4-HR2.pdf (accessed on 15 March 2022).
- Harper, G.; Sommerville, R.; Kendrick, E.; Driscoll, L.; Slater, P.; Stolkin, R.; Walton, A.; Christensen, P.; Heidrich, O.; Lambert, S.; et al. Recycling lithium-ion batteries from electric vehicles. Nature 2019, 575, 75–86. [Google Scholar] [CrossRef] [Green Version]
- Li-Cycle. Li-Cycle Services, Li-Cycle, 2022. Available online: https://li-cycle.com/services/ (accessed on 15 April 2022).
- Redwood Materials. Recycle with us—Redwood Materials, Redwood Materials, 2021. Available online: https://www.redwoodmaterials.com/recyclewithus (accessed on 15 April 2022).
- Lithion. Lithium-Ion Battery Recycling Solution, 2022. Available online: https://www.lithionrecycling.com/ (accessed on 15 April 2022).
- Ballard. Recycling PEM Fuel Cells, 2022. Available online: https://www.ballard.com/docs/default-source/web-pdf’s/recycling-technical-note_final.pdf (accessed on 15 March 2022).
- Liu, Z.; Song, J.; Kubal, J.; Susarla, N.; Knehr, K.W.; Islam, E.; Nelson, P.; Ahmed, S. Comparing total cost of ownership of battery electric vehicles and internal combustion engine vehicles. Energy Policy 2021, 158, 112564. [Google Scholar] [CrossRef]
- Grube, T.; Kraus, S.; Reul, J.; Stolten, D. Passenger car cost development through 2050. Transp. Res. Part D Transp. Environ. 2021, 101, 103110. [Google Scholar] [CrossRef]
- EIA. Gasoline and Diesel Fuel Update; U.S. Energy Information Administration: Washington, DC, USA, 2022. Available online: https://www.eia.gov/petroleum/gasdiesel/ (accessed on 16 March 2022).
- EIA. Electric Power Monthly—U.S; Energy Information Administration (EIA): Washington, DC, USA, 2021. Available online: https://www.eia.gov/electricity/monthly/epm_table_grapher.php?t=epmt_5_6_a (accessed on 16 March 2022).
- CaFCP. Cost to Refill, 2021. Available online: https://cafcp.org/content/cost-refill (accessed on 16 March 2022).
- Hartman, K.; Shields, L. Special Fees on Plug-in Hybrid and Electric Vehicles, 10 December 2021. Available online: https://www.ncsl.org/research/energy/new-fees-on-hybrid-and-electric-vehicles.aspx (accessed on 16 March 2022).
- NCSL. Vehicle Registration Fees by State, 2 April 2020. Available online: https://www.ncsl.org/research/transportation/registration-and-title-fees-by-state.aspx (accessed on 17 March 2022).
- ANL. Comprehensive Total Cost of Ownership Quantification for Vehicles with Different Size Classes and Powertrains; Energy Systems Division Argonne National Laboratory: Lemont, IL, USA, 2021. [Google Scholar]
- AFDC. Alternative Fuels Data Center: Developing Infrastructure to Charge Plug-In Electric Vehicles, 2020. Available online: https://afdc.energy.gov/fuels/electricity_infrastructure.html#level1 (accessed on 17 March 2022).
- Nicholas, M. Estimating Electric Vehicle Charging Infrastructure Costs Across Major U.S. Metropolitan Areas; The International Council on Clean Transportation: Washington, DC, USA, 2019. [Google Scholar]
- Kurtz, J.; Sprik, S.; Saur, G.; Onorato, S. Fuel Cell Electric Vehicle Durability and Fuel Cell Performance; National Renewable Energy Laboratory: Golden, CO, USA, 2019. [Google Scholar]
- UCSUSA. EV Batteries|Union of Concerned Scientists, 9 March 2018. Available online: https://www.ucsusa.org/resources/ev-batteries (accessed on 17 March 2022).
- Budd, K. How Today’s Cars Are Built to Last, AARP, 1 November 2018. Available online: https://www.aarp.org/auto/trends-lifestyle/info-2018/how-long-do-cars-last.html#:~:text=A%20typical%20passenger%20car%20should,Lyman%2C%20chief%20analyst%20at%20TrueCar (accessed on 2 April 2022).
- Rajendran, G.; Vaithilingam, C.A.; Misron, N.; Naidu, K.; Ahmed, R. A comprehensive review on system architecture and international standards for electric vehicle charging stations. J. Energy Storage 2021, 42, 103099. [Google Scholar] [CrossRef]
- API. API Staying Safe at the Pump, 2021. Available online: https://www.api.org/oil-and-natural-gas/consumer-information/consumer-resources/staying-safe-pump (accessed on 20 March 2022).
- Boloor, M.; Valderrama, P.A.; Statler, A.; Garcia, S. Electric Vehicles 101, 31 July 2019. Available online: https://www.nrdc.org/experts/madhur-boloor/electric-vehicles-101 (accessed on 23 March 2022).
- DOE. All-Electric Vehicles; U.S. Department of Energy (DOE): Washington, DC, USA, 2021. Available online: https://www.fueleconomy.gov/feg/evtech.shtml (accessed on 23 March 2022).
- DOE. Fuel Cells Fact Sheet; U.S. Department of Energy (DOE): Washington, DC, USA, 2015. Available online: https://www.energy.gov/sites/prod/files/2015/11/f27/fcto_fuel_cells_fact_sheet.pdf (accessed on 24 March 2022).
- Rocket HQ. How Much Does It Cost You to Fill Up? 6 October 2021. Available online: https://www.rockethq.com/learn/personal-finances/how-much-does-it-cost-you-to-fill-up#:~:text=Smaller%20cars%20generally%20have%20gas,15%2Dgallon%20tank%20costs%20%2457.75 (accessed on 3 March 2022).
- EV-Database. Useable Battery Capacity of Full Electric Vehicles. 2022. Available online: https://ev-database.org/cheatsheet/useable-battery-capacity-electric-car (accessed on 26 March 2022).
- DOE. Compare Fuel Cell Vehicles; U.S. Department of Energy (DOE): Washington, DC, USA, 2022. Available online: https://www.fueleconomy.gov/feg/fcv_sbs.shtml (accessed on 26 March 2022).
- IEA. Energy Technology Prespectives 2020; International Energy Agency: Washington, DC, USA, 2020. [Google Scholar]
- Liu, Y.; Sun, X.; Sethi, V.; Nalianda, D.; Li, Y.-G.; Wang, L. Review of modern low emissions combustion technologies for aero gas turbine engines. Prog. Aerosp. Sci. 2017, 94, 12–45. [Google Scholar] [CrossRef] [Green Version]
- Rauh, N.; Franke, T.; Krems, J.F. User experience with electric vehicles while driving in a critical range situation—A qualitative approach. IET Intell. Transp. Syst. 2015, 9, 734–739. [Google Scholar] [CrossRef] [Green Version]
- Saad, M.H.; N, M.A.; Darrasa, B.M. A general framework for sustainability assessment of manufacturing processes. Ecol. Indic. 2019, 97, 211–224. [Google Scholar] [CrossRef]
- DOE. NUCLEAR 101: How Does a Nuclear Reactor Work? Office of Nuclear Energy: Washington, DC, USA, 2021. Available online: https://www.energy.gov/ne/articles/nuclear-101-how-does-nuclear-reactor-work (accessed on 1 April 2022).
- Campbell, M. South America’s ‘lithium fields’ reveal the dark side of our electric future, Euronews, 11 February 2022. Available online: https://www.euronews.com/green/2022/02/01/south-america-s-lithium-fields-reveal-the-dark-side-of-our-electric-future (accessed on 2 April 2022).
- Narasipuram, R.P.; Mopidevi, S. A technological overview & design considerations for developing electric vehicle charging stations. J. Energy Storage 2021, 43, 103225. [Google Scholar] [CrossRef]
- Pathak, P.K.; Yadav, A.K.; Padmanaban, S.; Alvi, P.A. Design of Robust Multi-Rating Battery Charger for Charging Station of Electric Vehicles via Solar PV System. Electr. Power Compon. Syst. 2022, 1–11. [Google Scholar] [CrossRef]
- Mopidevi, S.; Narasipuram, R.P.; Aemalla, S.R.; Rajan, H. E-mobility: Impacts and analysis of future transportation electrification market in economic, renewable energy and infrastructure perspective. Int. J. Powertrains 2022, 11, 264–284. [Google Scholar] [CrossRef]
- Yong, J.Y.; Ramachandaramurthy, V.K.; Tan, K.M.; Mithulananthan, N. A review on the state-of-the-art technologies of electric vehicle, its impacts and prospects. Renew. Sustain. Energy Rev. 2015, 49, 365–385. [Google Scholar] [CrossRef]
- The Zebra. The Fastest Way to Compare Car Insurance Quotes. 2021. Available online: https://www.thezebra.com/zipentry/?insuranceline=auto (accessed on 2 April 2022).
- Lynch, A. Insurance Rates for Hybrid and Electric Cars. 9 October 2021. Available online: https://www.thezebra.com/auto-insurance/vehicles/insurance-rates-hybrid-electric-cars/ (accessed on 2 April 2022).
- Palmer, G. Mirai—Auto Insure Saving. 17 June 2021. Available online: https://www.autoinsuresavings.org/car-insurance/vehicles/toyota/mirai-insurance-rates/ (accessed on 2 April 2022).
- CaFCP. 2020. Available online: https://cafcp.org/sites/default/files/FCEV_factbooklet.pdf (accessed on 2 April 2022).


| Reference | Assessment Type | Vehicle(s) Assessed | Sustainability Pillar(s) Targeted | ||||
|---|---|---|---|---|---|---|---|
| ICEV | BEV | FCEV | Environment | Economy | Society | ||
| [19] | LCA | ✓ | ✓ | ||||
| [20] | LCA | ✓ | ✓ | ||||
| [21] | LCA | ✓ | ✓ | ||||
| [22] | LCA | ✓ | ✓ | ||||
| [23] | MF-LCA | ✓ | ✓ | ||||
| [24] | LCA | ✓ | ✓ | ✓ | |||
| [25] | LCA | ✓ | ✓ | ✓ | |||
| [26] | LCA | ✓ | ✓ | ✓ | |||
| [27] | LCA | ✓ | ✓ | ✓ | |||
| [28] | Other | ✓ | ✓ | ✓ | |||
| [29] | LCCA | ✓ | ✓ | ✓ | |||
| [30] | Review | ✓ | ✓ | ✓ | |||
| [31] | LCA | ✓ | ✓ | ✓ | ✓ | ||
| [32] | Other | ✓ | ✓ | ||||
| [33] | Other | ✓ | ✓ | ||||
| [34] | Other | ✓ | ✓ | ✓ | |||
| [35] | LCSA, LCA, LCC, SLCA | ✓ | ✓ | ||||
| [36] | LCA | ✓ | ✓ | ✓ | ✓ | ||
| Parameter | Value Used in the Study | Reference/ Assumption |
|---|---|---|
| Distance driven | 230,136 km | [38] |
| Fuel consumption (E10) | 21,055.4 L | [39] |
| Electricity Consumption | 43,610.8 kWh of electricity | [40] |
| Hydrogen Consumption | 2347 kg of hydrogen | [41] |
| Level | Indicator | Unit | ICEVs | BEVs | FCEVs | |
|---|---|---|---|---|---|---|
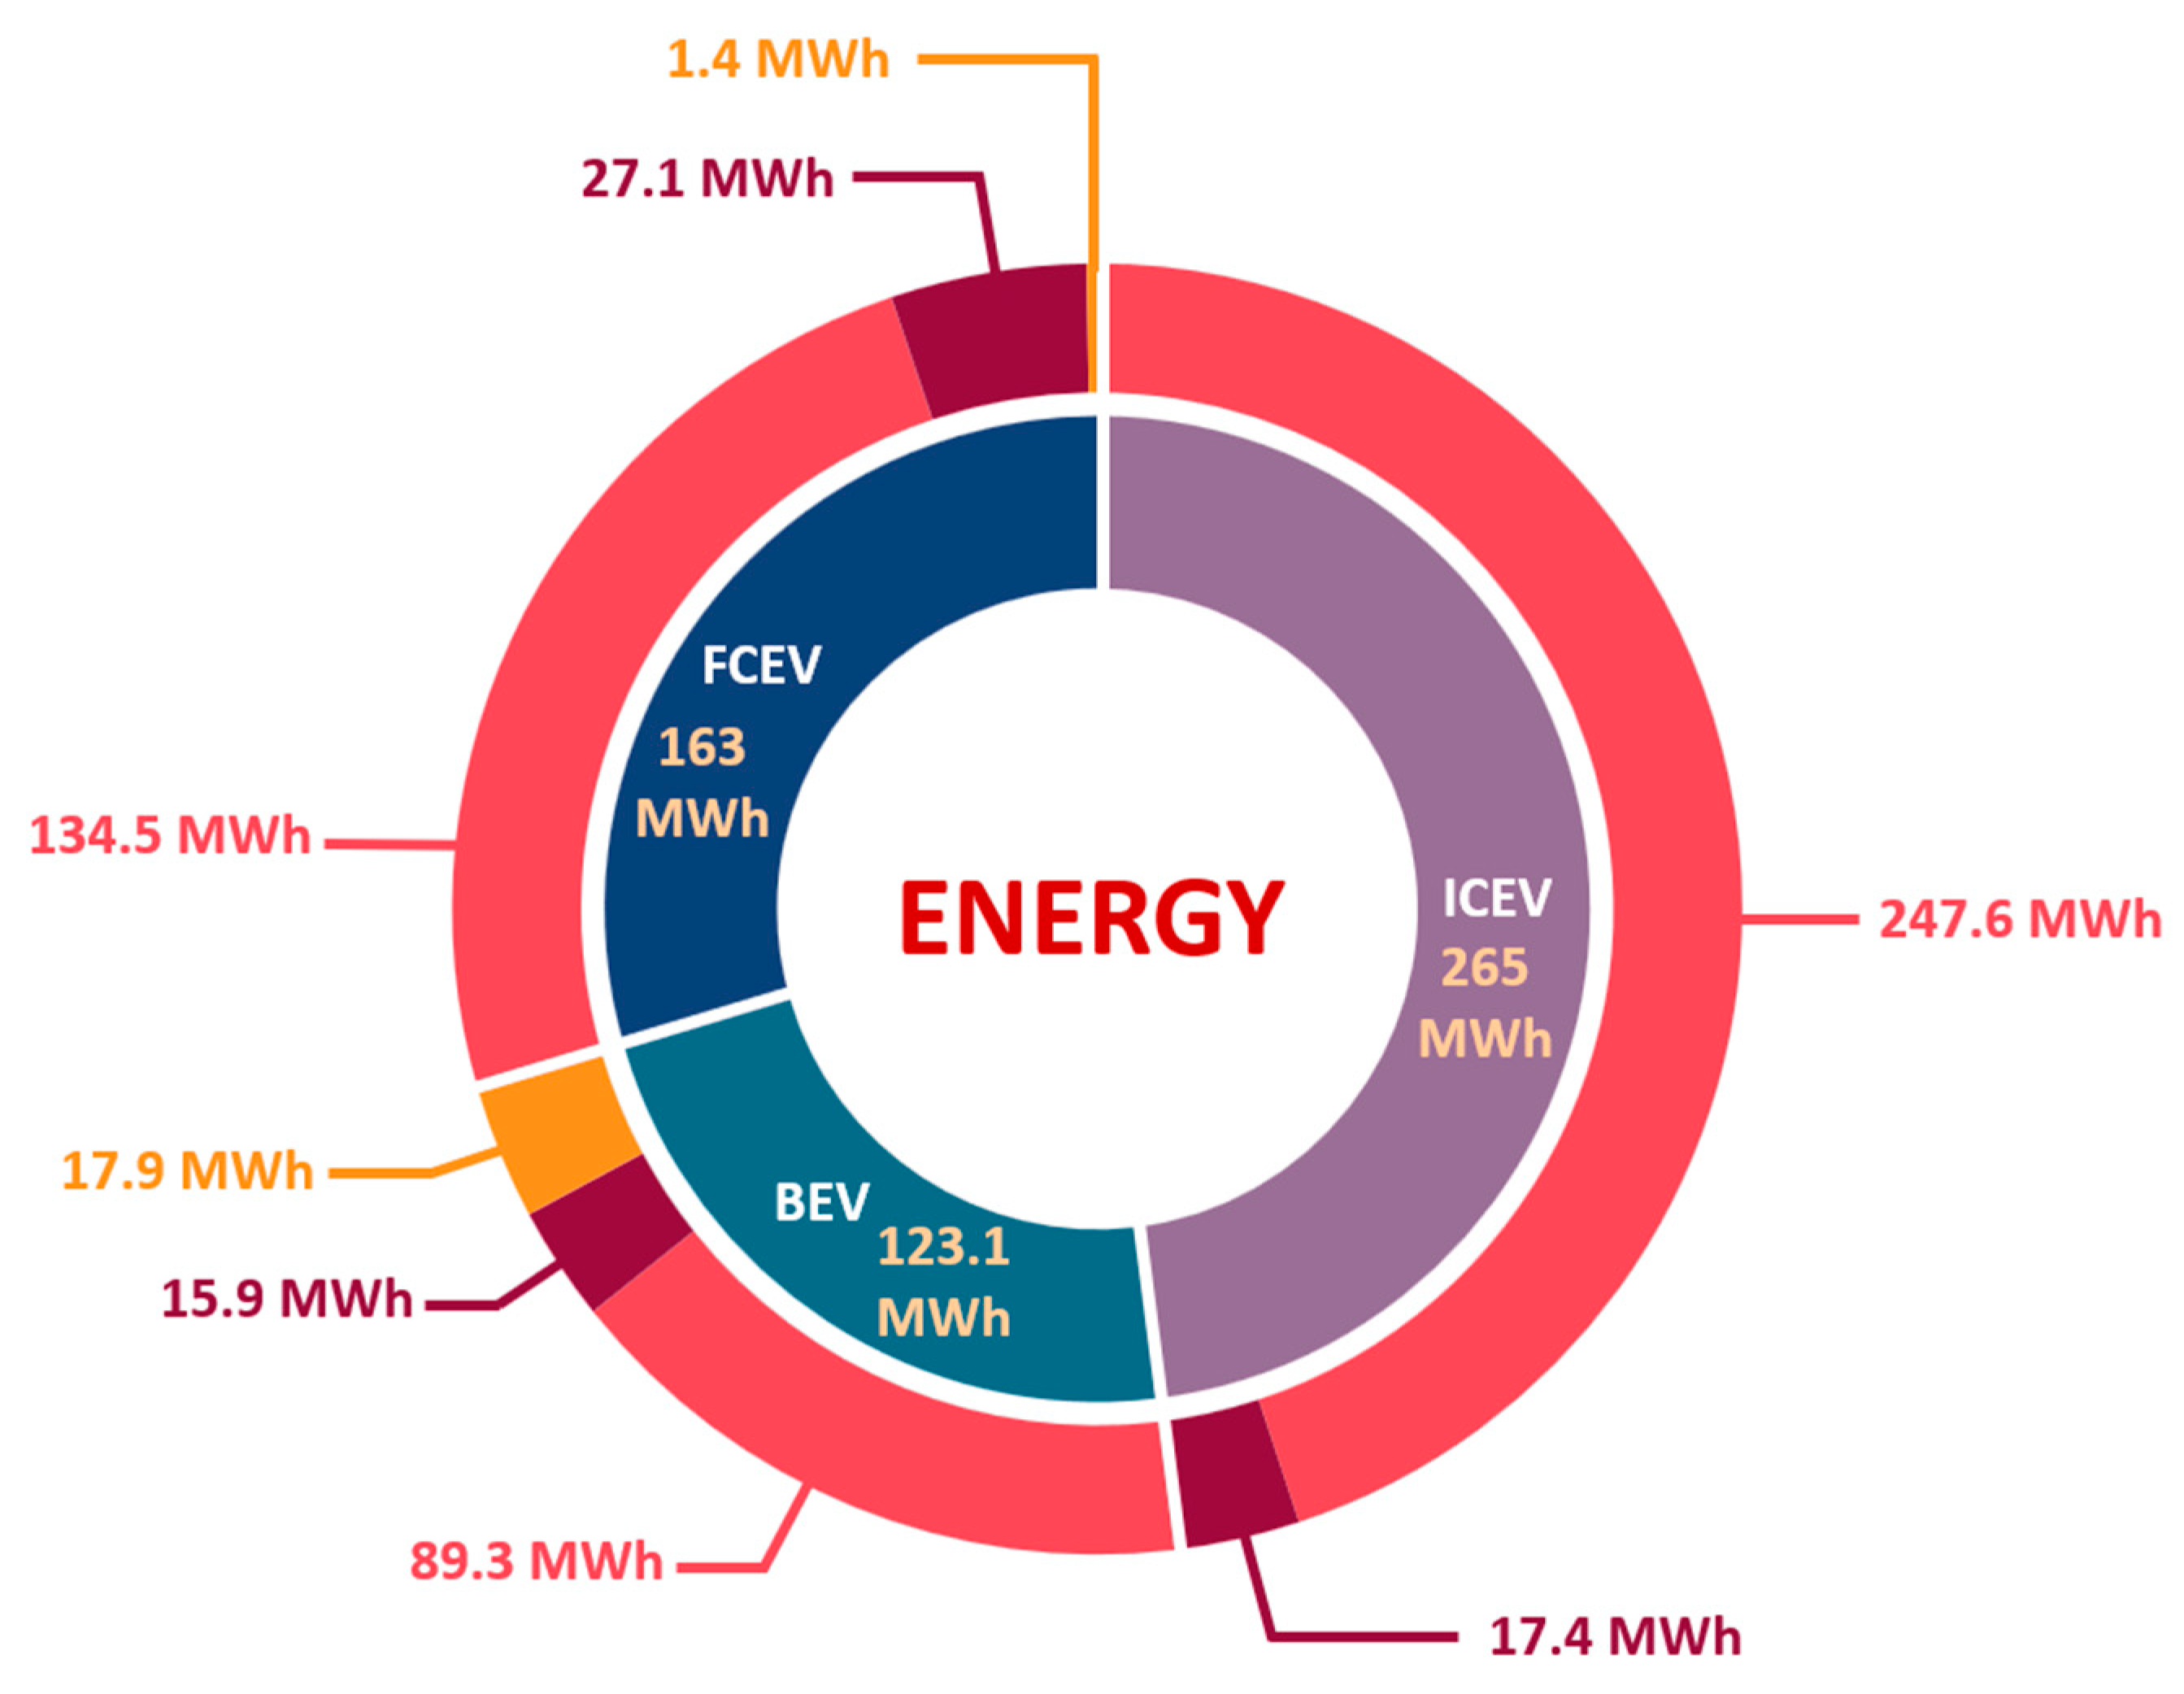
| Macro Indicators | 1 | Energy consumed during the production of fuels | MWh | 247.6 | 89.3 | 134.5 |
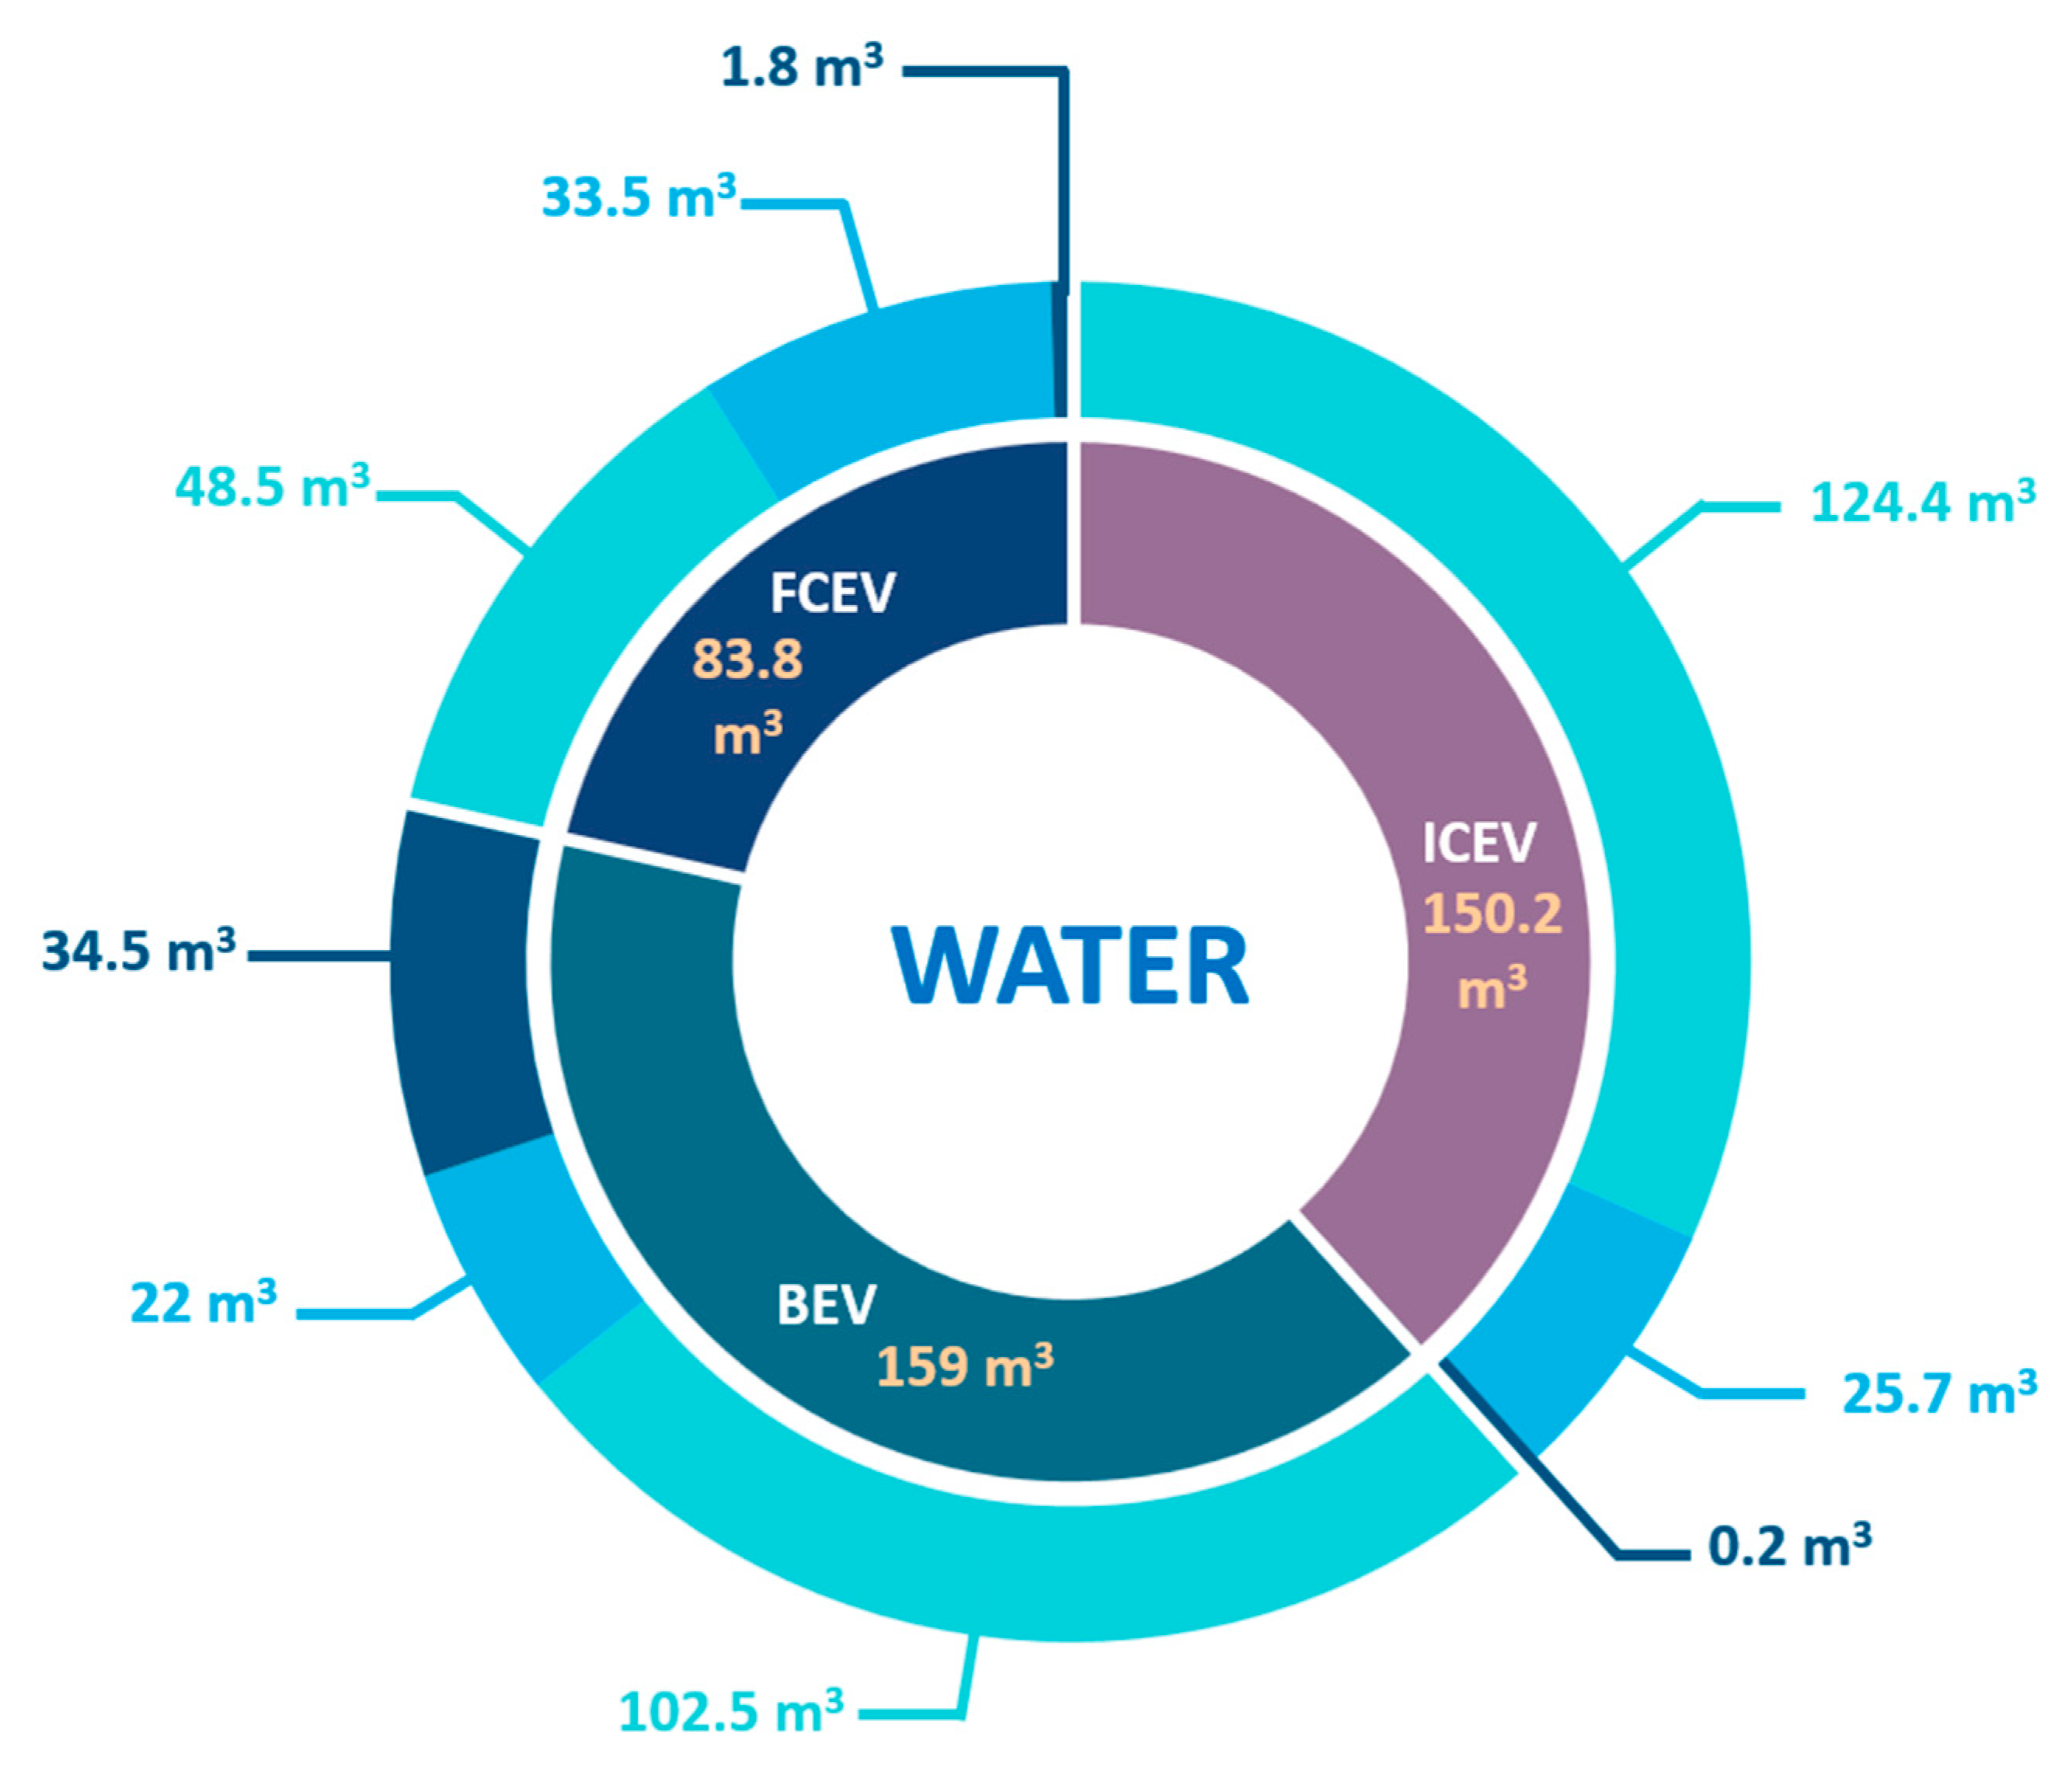
| 2 | Water consumed during the production of fuels | m3 | 124.4 | 102.5 | 48.5 | |
| 3 | Emissions produced during the production of fuels | tonne | 11.8 | 18.0 | 27.3 | |
| 4 | Energy consumed during the production of materials involved in the manufacturing of the vehicle | MWh | 17.4 | 15.9 | 27.1 | |
| 5 | Water consumed during the production of materials involved in the manufacturing of the vehicle | m3 | 25.7 | 22.0 | 33.5 | |
| 6 | Emissions produced during the production of materials involved in the manufacturing of the vehicle | tonne | 3.7 | 3.4 | 5.5 | |
| 7 | Energy consumed during the production of battery materials | kWh | 55.1 | 17,922.8 | 1423.1 | |
| 8 | Water consumed during the production of battery materials | m3 | 0.2 | 34.5 | 1.8 | |
| Meso Indicators | 10 | Number of refueling stations across the U.S. | # | 150,000 | 46,067 | 48 |
| 11 | National incentives | # | 0 | 286 | 35 | |
| 12 | Recyclability rate | % | 76 | 95 | 95 | |
| Micro Indicators | 13 | Total cost of ownership | USD | 63,286.0 | 64,859.0 | 100,381.0 |
| 13.1 | Capital cost | USD | 5000.0 | 20,500.0 | 30,871.2 | |
| 13.2 | Energy cost | USD | 17,694.2 | 5046.3 | 38,695.6 | |
| 13.3 | Insurance cost | USD | 13,968.0 | 21,471.0 | 20,648.4 | |
| 13.4 | Registration and state fees | USD | 655.7 | 1370.1 | 1417.1 | |
| 13.5 | Maintenance and repair costs | USD | 16,597.0 | 11,197.0 | 10,097.0 | |
| 13.6 | Home charging installation | USD | 0 | 1970.0 | 0 | |
| 14 | Vehicle’s lifetime | years | 14 | 14 | 10.5 | |
| 15 | Re-Fueling/Charging time | minutes | 2.5 | 155 | 2.5 | |
| 16 | Tailpipe emissions | kg Co2 | 48,036 | 0 | 0 | |
| 17 | Required maintenance frequency | km | 12,000 | 200,000 | 200,000 | |
| 18 | Vehicle’s efficiency | % | 40 | 85 | 85 | |
| 19 | Energy source utilization percentage | % | 77 | 60 | 30 | |
| 20 | Range on a full charge/tank | Km | 546.5 | 314.5 | 584.2 | |
| 21 | Technology readiness level | # | 9 | 7 | 8 | |
| 22 | Range anxiety | Low Medium High | Low | Medium | High | |
| MCDM Methods Scores | Rankings | Circularity Scores (Average) | |||||
|---|---|---|---|---|---|---|---|
| GRA | TOPSIS | COPRAS | GRA | TOPSIS | COPRAS | ||
| ICEV | 33.90 | 32.80 | 31.96 | 2 | 3 | 2 | 32.9 |
| BEV | 34.15 | 35.95 | 40.28 | 1 | 1 | 1 | 36.8 |
| FCEV | 31.95 | 31.26 | 27.76 | 3 | 3 | 3 | 30.3 |
Disclaimer/Publisher’s Note: The statements, opinions and data contained in all publications are solely those of the individual author(s) and contributor(s) and not of MDPI and/or the editor(s). MDPI and/or the editor(s) disclaim responsibility for any injury to people or property resulting from any ideas, methods, instructions or products referred to in the content. |
© 2022 by the authors. Licensee MDPI, Basel, Switzerland. This article is an open access article distributed under the terms and conditions of the Creative Commons Attribution (CC BY) license (https://creativecommons.org/licenses/by/4.0/).
Share and Cite
Ahmed, A.A.; Nazzal, M.A.; Darras, B.M.; Deiab, I.M. A Comprehensive Sustainability Assessment of Battery Electric Vehicles, Fuel Cell Electric Vehicles, and Internal Combustion Engine Vehicles through a Comparative Circular Economy Assessment Approach. Sustainability 2023, 15, 171. https://doi.org/10.3390/su15010171
Ahmed AA, Nazzal MA, Darras BM, Deiab IM. A Comprehensive Sustainability Assessment of Battery Electric Vehicles, Fuel Cell Electric Vehicles, and Internal Combustion Engine Vehicles through a Comparative Circular Economy Assessment Approach. Sustainability. 2023; 15(1):171. https://doi.org/10.3390/su15010171
Chicago/Turabian StyleAhmed, Aser Alaa, Mohammad A. Nazzal, Basil M. Darras, and Ibrahim M. Deiab. 2023. "A Comprehensive Sustainability Assessment of Battery Electric Vehicles, Fuel Cell Electric Vehicles, and Internal Combustion Engine Vehicles through a Comparative Circular Economy Assessment Approach" Sustainability 15, no. 1: 171. https://doi.org/10.3390/su15010171