Abstract
Currently, the major global economies have entered an aging society. The promotion of physical activity is an important way to improve the health level of the elderly, and the study of health geography is a popular interdisciplinary research topic. This study selected 12 representative districts in Guoyu City, Jiangsu Province, to conduct a questionnaire survey on the activity range and behavior pattern of leisure walking among the elderly. We analyzed the relationship between the environment factors of different blocks and the walking activities of the elderly. The results showed that: (1) A range of 800 m from home is the most important leisure walking space for the urban elderly, and a distance between 800 and 1500 m is an important optional leisure walking space. (2) The density of open green space, commercial facilities, and public service facilities has a significant impact on the elderly’s leisure walking activities. (3) The socioeconomic background and health status of the elderly have a significant impact on their leisure walking activities. Healthy physical conditions can motivate the elderly to form good exercise habits. The government must optimize the built environment elements in a targeted living space to encourage physical activity among the elderly.
1. Introduction
At present, more than half of the world’s population lives in urban areas, and the high concentration of the urban population poses a serious challenge to the level of national governance. According to international regulations, people over 60 years old are determined as the elderly [1]. According to Article 2 of the Law on the Protection of the Rights and Interests among the Elderly, all citizens of the People’s Republic of China who have reached the age of 60 are elderly [2]. It is estimated that by 2050, the elderly in China will account for 34.90% of the total population [3]. The Chinese government must provide more economic expenditure for the elderly and bear greater social and economic pressure. The aging society will be an important public health challenge for the Chinese government in the next 20 years. In response to this problem, the Chinese government has issued the Healthy Development Plan for Aging Society [4]. The plan will improve the quality of life of the elderly through the construction of a community pension system. In recent years, substantial changes have occurred in the urban transportation environment and the lifestyle among the elderly. The sedentary lifestyle is not conducive to physical activity among the elderly [5,6]. Sedentary lifestyles lead to a sharp decline in physical activity among the elderly. Inadequate physical activity increases the risk of chronic diseases such as hypertension, stroke, diabetes, and obesity and significantly reduces the life quality of the elderly. The lack of physical activity in the process of urbanization has caused public health problems. Different countries have conducted multi-level interventions on residents’ physical activity through diversification policies. For example, France’s policy includes three aspects: improving people’s awareness of healthy lifestyles at all ages, providing more convenient sports opportunities, and adhering to the lifestyle of combining healthy diet with reasonable exercise [7]. The policies of the United States include improving residents’ awareness of physical activity and improving the coverage of fitness facilities at the community level [8]. These policies have achieved remarkable results in areas such as public health and urban management. Physical activities mainly refer to energy-consuming sports produced by human skeletal muscles, including housework, transportation, leisure sports, and other forms [9]. Therefore, popular research topics focus on improving the participation of elderly in daily physical exercise [10]. Numerous studies have shown that physical activity can increase the body’s energy expenditure and maintain energy balance, reducing the risk of chronic diseases among the elderly. Physical activity can produce more positive health effects, thus effectively improving the quality of life of the elderly [11]. In addition, some studies believe that physical activity level of residents is not only affected by individual physiological and psychological activities, but also by urban built environment factors [12].
Walking, with moderate intensity, is the most common form of physical activity in the daily lives of the elderly [13]. There are two main types of walking activities: First, traffic walking activities such as living, shopping, working, and commuting and social communication. Second, leisure walking refers to walking, shopping, entertainment, and other walking activities for physical exercise. The existing studies usually regarded the block as the most basic management unit in the city and the minimum travel range of residents’ daily activities [14]. The block scale is generally used to measure the residential space environment and the level of medical resource allocation. This paper chooses the block as the research unit, which mainly refers to the area surrounded by four streets. The block can also be defined by other visible or invisible natural elements or human elements to count the population size [15]. In addition, the block scale is the most basic unit in urban planning. People generally make statistics on the land use structure, land development intensity and development type within the scope, and provide corresponding public facilities and resources. The scale of the block includes three aspects, namely, the living environment of the block, the social neighborhood environment, and the residential living environment [16]. The definition of the built environment of the street in this paper mainly refers to the combination of street space elements to meet the residents’ needs in daily life. The scope includes various living service facilities, road traffic environment, green space opening space and other public space elements [17].
Research on the walkability of existing blocks mainly focuses on objective spatial indicators such as land use mixing degree, residential density, block connectivity, and road intersection density. The findings indicate that improving the connectivity and walkability of blocks, as well as shortening the space distance of traffic travel, will help increase the likelihood of the elderly engaging in various walking activities [18]. At the same time, existing studies have found that an open block environment can provide more walking space, which is convenient for residents to conduct physical exercise and social interaction [19]. In addition, open blocks generally adopt the mixed commercial and residential development mode, which makes it more convenient for residents to carry out leisure walking activities [20,21]. Good block connectivity and mixed degree of land use will be conducive to improving the enthusiasm of the elderly toward physical activity and increasing their amount of walking activity [22].
Some studies believe that the elderly’s body function gradually degrades, their activity range is constantly shrinking, and the block neighborhood environment becomes their main walking space [23]. Existing studies have comprehensively measured the objective conditions and subjective perception of the built environment [24,25]. Research shows that the physical space quality of the block environment will affect residents’ physical activities, and the residents’ social and economic background will also affect their subjective cognitive feelings [26]. The index system constructs the walkability scale of the neighborhood environment. This scale measures residents’ perception level of features such as convenience, attraction, and safety of the walking environment. The results show that residents’ good perception of a walking environment will promote their daily physical activities [27]. In addition, age, gender, education level, marital status, income level, health status, and other socioeconomic attributes are also important factors affecting physical activity [7,17,22]. Specifically, good block connectivity and walkability of public space can effectively promote the elderly to carry out walking activities [28,29]. Furthermore, block safety will also affect residents’ subjective willingness to conduct outdoor activities [20,21]. In addition, residents’ perception of the accessibility of public service facilities directly affects their frequency of leisurely physical activity [30].
In general, studies on the correlation between the existing urban built environment and walking for the elderly mainly focus on the neighborhood block scale. The existing empirical studies mostly focus on international metropolises with a high urbanization rate, and there is a lack of studies on the adaptability of small town areas [29]. The current research is mostly in the phase of mapping between activity space and material space. The health factors mainly select morbidity, mortality, self-rated health status, and other indicators [31]. Few studies have focused on the deep potential impact of the built environment on residents’ daily physical activity from the perspective of healthy city management [27,32]. At the same time, the research on healthy cities in China is still in its initial stage. Most of the current work is focused on improving the number and density of service facilities. There are many problems with urban construction, such as excessive supply of facilities in terms of quantity and scale and insufficient quality and efficiency, which makes it difficult to effectively accommodate the specific needs of the elderly. This study focused on the elderly’s daily leisure walking activities, beginning with the elderly’s perception of the neighborhood-built environment and analyzed the impact of the block scale built environment on daily walking activities. This study revealed the effects of space demand, space opportunity, and space restriction on the leisure walking activities of the elderly at the mechanism level. The research conclusions will help guide urban planning and management departments to optimize the scale, function, and quality of the block-scale built environment to support the elderly to conduct daily leisure walking activities (Figure 1).
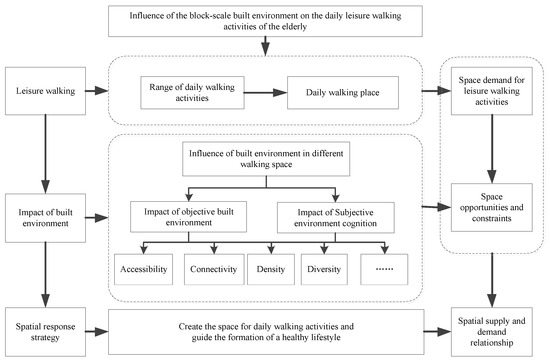
Figure 1.
Overall framework of this study.
2. Materials and Methods
2.1. Study Area and Data Source
2.1.1. Study Area
The main urban area of Gaoyou City in Jiangsu Province was chosen as the case study area; it has a population of approximately 330,000 and a built-up area of approximately 52.12 km2 (Figure 2). According to China’s seventh census, the population aged ≥60 in Gaoyou accounted for >30% in 2022. In the past 30 years, the proportion of the elderly population in Gaoyou City has been increasing, and the city has entered the deep aging stage. Urbanization is conducive to the rapid agglomeration of population, resources, and material factors and provides convenience to residents’ daily life [33,34]. However, there are also several negative effects on the elderly. On the one hand, the increase in residents’ income leads to an increase in their daily diet consumption and energy intake. On the other hand, the crowded living environment also leads to a decrease in residents’ physical exercise frequency and willingness. Although the average life expectancy of the elderly continues to increase, physical inactivity, an unbalanced diet, smoking, and alcohol consumption among the elderly have increased considerably. Living habits such as less movement and increased food consumption indirectly damage the health level of the elderly. Poor lifestyles lead to chronic diseases such as hypertension, diabetes, and cardiovascular and cerebrovascular diseases in the elderly [35]. Chronic diseases reduce the elderly’s quality of life and aggravate the economic burden of the entire society, which has become a major public health obstacle affecting the social economy and healthy development in Gaoyou [25]. This study focused on the range of daily walking activities of elderly people on a block scale. The block range includes the traffic road surface and the surrounding built-up area within a certain range. Based on the existing research, we widened the distance of urban express, main, secondary, and branch roads to both sides by 50 m, 35 m, 29 m, and 10 m, respectively. This scope is identified as the elderly’s activity space in the block scale built environment [22,27].
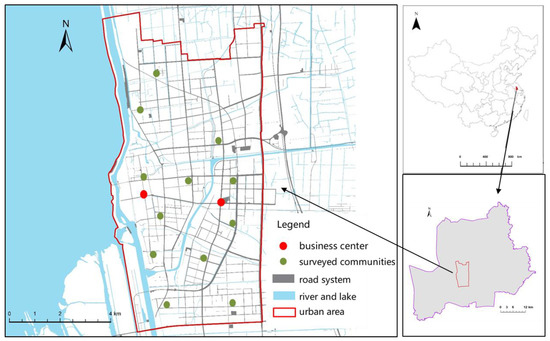
Figure 2.
Study area and distribution of the surveyed communities.
We have considered the potential impact of the COVID-19 in the questionnaire design stage. In general, the COVID-19 does not affect this study. There are three main reasons. First, from the end of 2020 to the beginning of 2021, the Chinese government had better control of COVID-19 than other countries in the world. The production and lives of residents were carried out in an orderly manner, and people’s daily travel activities were not affected [28]. Second, we chose Jiangsu Gaoyou as the case site. According to the announcement information released by Gaoyou Health Commission, from December 2020 to January 2021, there was no population infected with social epidemic in Gaoyou City, and Gaoyou City was not affected by the epidemic [29]. Third, we asked the elderly respondents whether their daily leisure travel was affected by the COVID-19 during the distribution of the questionnaire. Most of the elderly said that Gaoyou had not yet experienced an epidemic, and their daily travel activities were not affected.
2.1.2. Data Source and Processing
We selected 12 typical blocks in the study area and randomly selected sample points in each block for a questionnaire survey (Figure 2). The respondents were aged ≥60, and the survey took place between December 2020 and January 2021. These blocks have different location conditions, built environments, and socioeconomic backgrounds. According to China’s Law on the Protection of the Rights and Interests of Elderly Groups, “elderly people” generally refer to people over 60 years old [3]. Notably, the elderly people we investigated were permanent residents who have no serious diseases, could move easily, and could complete the questionnaire independently. The main contents of the questionnaire were the leisure walking activities of the elderly over the entire week, their own social and economic background, and their perception and evaluation of the surrounding built environment. It included the location, time, and frequency of activities such as walking, shopping, and exercise. We distributed a total of 1541 questionnaires and obtained 1275 valid questionnaires, with an effective recovery rate of 82.7%.
In the process of designing the questionnaire, several medical ethics standards from relevant studies were used for reference [36,37]. These ethical standards put forward a series of requirements for the investigation of special populations. We conducted an in-depth discussion on the specific contents of the questionnaire Therefore, we distributed 100 questionnaires for survey testing before the start of the survey phase. Specifically, a confidentiality option for the elderly privacy was added to the questionnaire content. The questionnaire informed the respondents of their rights and possible risks. To further protect participant privacy, we actively deleted name attributes when we obtained data through the questionnaire. This study only explored the characteristics and mechanisms of group activity and did not conduct a differential analysis of individual patients. Possible private information included the age, income, and residential address of the elderly. For the content of the questionnaire, we solicited guidance and advice from medical ethics experts. In addition, the content of the questionnaire was also authorized and approved by the Changshu Health Ethics Review and Management Committee (Approval Code: 2020030031). We kept the above information strictly confidential, and promised to use it only for this research.
In the elderly sample (Table 1), the proportion of men and women is balanced, and the age is mainly ≤70 years old (62.34%). Most respondents have high school/secondary education (79.46%), are married (82.37%), and are retired (92.08%). The monthly personal income is generally between 2000 and 4000 CNY (61.30%). The number of family members is mainly three or less (57.40%), and 77.5% of the respondents’ self-evaluation of health is at the general level or above. The objectively built environment factors mainly include urban road networks, facilities, urban green space, and administrative boundaries. Among them, the facility layout data was mainly obtained through web crawler software, which involves information such as the name, type, location, and scale of the facilities. The attributes of urban green space are extracted from remote sensing images, which mainly include attributes such as the number, shape, location, and area of elements. Further, we integrated the information about the elderly’s residential location and the distribution of daily activities on a unified space platform.

Table 1.
Descriptive information on the sample of the elderly in the study (N = 1275).
2.2. Variables and Indicator System
Elderly people’s subjective feelings of the external environment will affect their daily outdoor activities. The elderly associate with the urban built environment through walking activities. Therefore, we first defined the spatial scope and physical location of the elderly’s leisure walking activities. Furthermore, we constructed a multi-dimensional evaluation system of the built environment and organized the social and economic attributes of the elderly. Specifically, we evaluated the built environment elements from multiple dimensions, namely accessibility, agglomeration, and diversity.
2.2.1. Leisure Walking Activities
Walking requires the coordination of thigh, waist, and abdominal muscles and has a strong effect on the elderly. Leisurely walking refers to when people use their spare time to walk to a non-workplace. It includes shopping, walking, and physical exercise. The bodily function of the elderly is generally weaker than that of the young and middle-aged groups, and the elderly are more capable of carrying out physical activities with relatively gentle intensity [16]. The World Health Organization recommends that older people be physically active in their daily lives, with at least 150 min of moderate-intensity physical activity per week. This includes walking, dancing, and swimming [17]. Studies have shown that continuous walking for at least 10 min at a time is beneficial for adults to maintain their physical health [18,19]. Therefore, we surveyed whether elderly people engaged in walking, shopping, fitness, and other leisure walking activities during the week and the range, duration, and frequency of each walk. Notably, the walking activities that lasted >10 min each time in the questionnaire survey were considered as effective walking activities. Specifically, we used “whether to participate in leisure walking activities and whether the length of leisure walking activities was greater than 150 min/week” as the dependent variable.
2.2.2. Built Environment Elements
- (1)
- Subjective perception of the built environment
According to the place of residence and walking activities of the elderly in the questionnaire survey, we identified the range and place of walking activities of the elderly. We mapped the elderly’s subjective evaluation of the built environment elements in the objective physical space. People with different socioeconomic attributes have different resources and travel ranges. The spatial–temporal trajectory and activity space of the elderly’s physical activity also show different characteristics. Specifically, this study measured the factors of the built environment by combining subjective and objective methods. First, we constructed a table outlining the corresponding relationship between objectively built environment elements and subjectively built environment perception (Table 2). Then, we constructed a subjective perception index system of the built environment based on two aspects: spatial agglomeration and spatial connection (Figure 3).
Table 2.
Correspondence between objective organization and subjective perception of built environment at the block level.
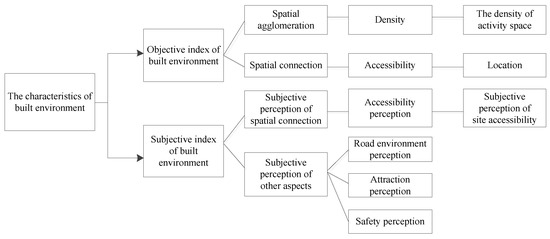
Figure 3.
Subjective and objective index system of built environment at the block level.
- (2)
- Establish an environmental assessment index system
We evaluated the characteristics of a built environment from both subjective and objective perspectives. The index system combines related research results of street walkability [16,18]. We summarized the constructed environmental indicators of the blocks that affect the leisure walking activities of the elderly from four aspects: patency, accessibility, comfort, and safety. Specifically, (1) block patency means that the pedestrian road network of urban blocks is continuous and unimpeded and is not affected by the cutting of other transportation modes. Unobstructed streets provide an adequate area for pedestrians to pass through as well as continuous and stable walkable spaces (Figure 4). (2) Block convenience means the city block can provide enough public service facilities for surrounding residents and walkers. These facilities can meet the diverse needs of the elderly for the block space. The coverage and diversity of public service facilities represent the convenience of walking space. (3) Comfort index means the block provides a comfortable walking experience and pleasant visual perception for the elderly. Comfort can be measured from both artificial environment and natural environment perspectives according to landscape components such as interface, paving, and vegetation. The higher the comfort of the natural and artificial environments, the higher the comfort of the neighborhood walking environment. (4) Security index is the most basic guarantee of walkable blocks. It is divided into two main aspects: individual safety and traffic safety. The indicators represent the safety attitudes of pedestrians to the neighborhood environment and the interference degree of other vehicles to walking. The higher the sense of security of pedestrians in the block space, the better the walkability of the block.
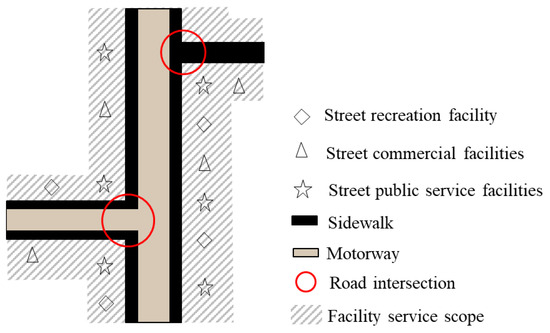
Figure 4.
Features organization in the daily life circle at the block level.
Based on the abovementioned first-level indicators, this study refined 13 s-level indicators (Table 3). We obtained the subjective evaluation of the neighborhood environment by the elderly through the questionnaire. The questionnaire was quantified according to the 5-level Likert scale, with scores of 1 indicating strong disagreement, 2 indicating strong disagreement, 3 indicating moderate feelings, 4 indicating strong agreement, and 5 indicating strong agreement.
Table 3.
Index system for walkability at the block scale.
2.2.3. Socio-Demographic Characteristics
In addition to the influence of the urban built environment, the daily walking activities of the elderly are also affected by individual socioeconomic attributes [7,17]. Therefore, to accurately estimate the impact of the urban built environment, we included social and economic factors such as gender, age, education background, family demographic structure, living with grandchildren, working status, monthly personal income, possession of a driving license, and chronic disease as control variables in the analysis model. We further interpreted the fitting effect of the model and identified the relationship between various factors.
2.3. Statistical Analyses
The Hierarchical Linear Model (HLM) is a statistical analysis technique used to analyze data with nested structures that can effectively affect organizational or background effects [38] and is mainly applied in the fields of medicine, public health, society, etc. [39,40]. On the one hand, different types of walking activities involve location differences and multiple co-linear characteristics of the built environment factors. On the other hand, the factors that affect the daily leisure walking activities of the elderly include the built environment, subjective cognition, and residents’ own socioeconomic background, and many other aspects have obvious multi-level nesting structure characteristics; therefore, they are more suitable for HLM models (Figure 5).
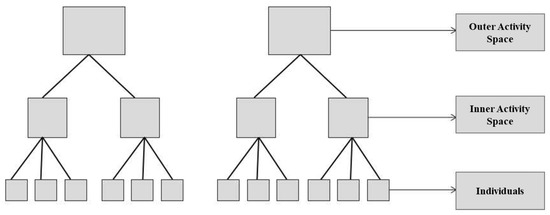
Figure 5.
Schematic representation of the hierarchical structure of the dataset.
We use MlwiN software as the statistical analysis platform, and select hierarchical linear model for statistical analysis [41]. The model can effectively distinguish between intra-group differences and inter-group differences of the explained variables. We use this model to measure the influencing factors of travel activities under the nested geospatial constraint environment. We use the Akaike Information Criterion (AIC) index in the Markov chain Monte Carlo method (MCMC) methodology to compare the fitting effects of different models. As a comprehensive indicator, AIC can not only measure the fitting degree of the model, but also consider the complexity of the model. The smaller the value, the higher the fitting degree of the model to the data.
For data with nested structure, the functional relationship between cross level variables is called organizational effect or background effect in social science research. In order to prevent collinearity among variables and ensure the stability of model analysis results, we introduce the above variables into the statistical model hierarchically. The differences of leisure walking activities among the elderly mainly come from the heterogeneity of individual levels. The heterogeneity of geospatial units will also affect the walking activities among the elderly. We respectively counted the model variance values in the inner and outer spheres [42]. When dealing with hierarchical data, the model first establishes regression equations for the first layer of characteristic variables. Then, the model takes the intercept and slope in the equation as dependent variables, and the characteristic variables in the second-level data as the independent variables. We put these variables into the model for quadratic regression. The basic formulas are as follows:
First level:
Second level:
Wj and Xij are characteristic variables for the first and second layers, respectively; μ0j, γij, and μ1j are random effect variables. The feature variables of the first layer are treated as total or group averages. The interception β0 is the average value of Yij and the slope β1j is the change amount produced by upgrading a unit of Xij. The characteristic variable W impacts the dependent variable Y by affecting the slope and intercept in the regression equation of the first level characteristic variable on the second level. Specifically, the outer activity circle may contain one or more inner activity circles, and there is a nested relationship between the two geospatial scopes. There are intergroup differences between inner active circles, and intra group differences between inner active circles and outer active circles. Therefore, the first level dependent variable Yij refers to the walking activities among the elderly in the outer activity space. Second-level dependent variable β0j refers to the average walking activity of the elderly in the inner activity space. Β1j refers to the number of changes in elderly walking activities caused by the intergroup differences among the inner activity space.
3. Results
3.1. Fractal Spatial Characteristics of Built Environment Element Set
The block-scale built environment of Gaoyou City presents different spatial distribution characteristics from four aspects: unobstructed, convenient, comfort, and safety (Figure 6). According to the subjective and objective scores in the questionnaire survey, we conducted a comprehensive evaluation of the built environment quality around the main roads of the city. (1) In terms of road network patency, the old urban area scored high, while the outer suburban area scored low. The interior of the old town along the canal formed the gravity center of the slow traffic system. Within the range of short distance walking, the high values of network selection degree and integration degree of blocks were concentrated in the inner city. The road network density in suburban areas was relatively low, the block scale was relatively large, the urban branch road system was incomplete, and the road patency was relatively low. (2) In terms of service convenience of the block, an overall structure of continuous agglomeration along the internal main road and point-like dispersion outside was presented. This morphological feature shows that the convenience of block service was significantly affected by the single center architecture of the city. The comprehensive score of the old city area was high, and the overall structural expansion was insufficient, showing the spatial characteristics of regional agglomeration.
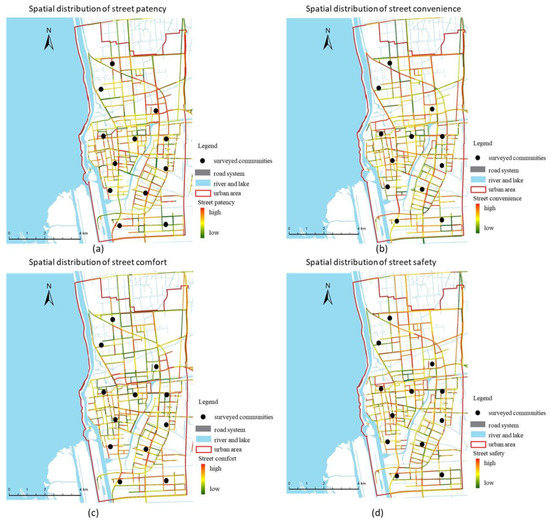
Figure 6.
Patency (a), convenience (b), comfort (c), and safety (d) of the built environment at the block scale.
(3) The comfort level of block roads was affected by the urban ecological pattern and built environment, showing a hollow structure that was low inside and high outside. Neighborhoods along canals and around the inner-city river network had higher landscape comfort scores. The inner blocks of the old city had a lower green visual rate, while the outer suburban areas had higher landscape comfort. The urban environmental quality was greatly affected by the wedge of external landscape and the corridor of the internal water system. (4) Regarding block safety, the score inside the city fluctuated at a high level, while the outer ring decreased sharply, showing a distribution feature of high inside and low outside. The results showed that the layout of security facilities in old city blocks is relatively good. The security facilities in the outer suburbs are insufficient, and the elderly have a weak perception of security in the outer blocks of the city.
3.2. Location and Scope of Daily Leisure Walking Activities for the Elderly
3.2.1. Spatial Range of Daily Walking Activities
Studies have shown that the daily activity radius of the elderly generally has two boundaries of 500 and 800 m [6,9,11]. Considering that most of the elderly’s leisure walking activities begin at home, we calculated the travel range of the elderly according to when the distance between home is <500 m, 500–800 m, 800–1500 m, and >1500 m. The probability and duration of leisure walking activities in different distance circles were analyzed. Since different surface types of the city have different walking speeds, we used the grid cost-weighted distance algorithm to calculate the walking distance, and the grid size was 100 × 100 m.
The results of questionnaire analysis showed that the occurrence rate of daily walking decreased significantly with the increase in distance within 1500 m. The results show that the longer the distance between the walking destination and the residence, the lower probability of the elderly walking to the destination. Among them, 800 m away from home (49.32%) is the core space of leisure walking activities for the elderly, which is called the inner activity circle. The space 1500 m (39.89%) from the home was the second most important choice, named the outer mobile sphere (Figure 7). In addition, the walking time of the elderly at different distances in the survey results also indirectly verified the above responses. The elderly spend an average of 232 min a week walking within 800 m of their homes. However, the walking time outside the 1500 m range was only 32 min, which was 1/8 of the time within the 800 m range (Figure 7). The results show that 800 m away from home is the core distance of daily leisure walking activities for the elderly, and 1500 m away is the second most important distance.
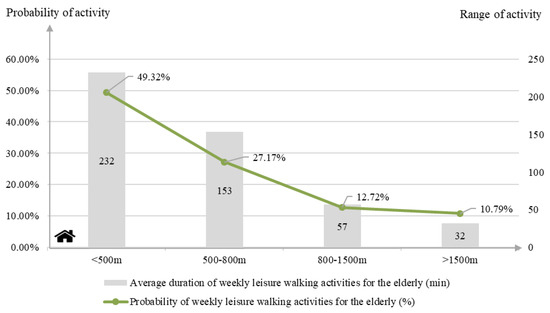
Figure 7.
Occurrence probability and activity time of leisure walking activities at different spatial distances among the elderly.
The research data in this paper comes from the questionnaire survey and does not deeply investigate the elderly’s walking path information. We consider the diversity and complexity of the elderly’s walking trajectory. We classify the range of walking activities among the elderly in the form of spatial circles. We set the walking range options to four space levels, which contain within 500 m, within 800 m, within 1500 m, and outside areas. In addition, walking time is an important index to measure the walking activities among the elderly. We asked the elderly for their weekly leisure walking time in different spaces. The time index is helpful to identify the walking activity circle of the elderly. We correspond the space range with the activity time. In the follow-up research work, we will deeply analyze the activity track among the elderly and then accurately identify the activity range among the elderly.
3.2.2. Locations of Daily Leisure Walking Activities
There were significant differences in the choice of leisure walking destinations among the elderly at different spatial distances (Table 4). The results of the questionnaire show that the main locations for the elderly to walk were the squares inside the community and public locations outside the community, such as parks, squares, and universities, which are less than 800 m away from home. Further, farmers’ markets, supermarkets, and other life service facilities were the secondary leisure and walking activity destinations for the elderly 800 to 1500 m from home. Some large parks, squares, large commercial complexes, etc. were the main leisure walking activity destinations for the elderly. Notably, within the same distance circle, the elderly may walk to multiple places. The sum of activity rates in older adults within the same spatial distance may be >100% (Table 4).
Table 4.
Occurrences of the elderly’s daily walking to major destinations at different spatial distances.
3.3. Influencing Factors of Leisure Walking among the Elderly in Inner Activity Space
The model controlled the influence of the socioeconomic attributes of the elderly. The results showed that there was a significant positive correlation between the density (1.036) and accessibility level (0.248) of the park within a walking range of 800 m from home. It shows that the improvement of this index is beneficial for increasing the participation rate of the elderly in leisure walking activities. Residential density (−0.037) and natural landscape comfort (−0.236) showed a significant negative correlation. The increase of this index will significantly reduce the participation rate of the elderly in leisure walking activities. In addition, the higher the park density (0.850) and the better the road lighting at night (0.333), the more likely the elderly were to spend >150 min per week on leisure walking. Residential density (−0.046), road flatness (−0.366), and natural landscape comfort (−0.237) showed a significant negative correlation (Table 5). The results show that increasing the supply of leisure space, such as parks, and improving the accessibility of leisure space within a walking distance from home will significantly improve the enthusiasm of the elderly to participate in leisure walking activities. However, high residential density will reduce the willingness of the elderly to walk for leisure, which is not conducive to the elderly walking for leisure. In addition, owing to the relatively few natural landscape resources in the surveyed area, the elderly generally have a low perception level of natural landscape comfort. Therefore, this index cannot be identified as a promoting factor to improve leisure walking among the elderly.
Table 5.
The Model Variance Estimation Results of Walking Activity Level Among the Elderly.
Table 5 shows the model α (introducing two levels of individual and inner activity circle) and model β (introducing three levels of individual, inner circle, and outer circle). In the Model β, the variance proportion of the inner activity circle is relatively large (32.7%), while that of the outer activity circle is relatively small (19.8%). The geographical environment factors in the model show typical multi-layer structure characteristics. The variance decomposition coefficient can explain the explanatory ability of circle differences in different geographical spaces on dependent variables [43,44]. The results show that the AIC value decreases more obviously when the spatial element variable is introduced. The results show that the model has better explanatory power for the elderly’s walking activity effect after introducing geographical range variables.
Table 6 shows the lowest and highest elderly walking activities probability prediction values in the two spatial levels of model β. In the inner activity circle, the probability difference of walking activity level among the elderly from the highest to the lowest is –7.5%, 4.7%, 6.7%, –2.2%, and –1.7%, respectively. In the outer active sphere, the difference is –24.8%, 14.2%, 17.8%, –1.2%, and –6%, respectively. The heterogeneity of the outer active circle is higher than that of the inner active circle. The variance of walking activities in the inner activity circle is small, which reflects that there is no obvious difference in walking activities among the elderly at this level, which verifies the rationality of setting the inner and outer space circles in this paper.
Table 6.
The predicted value of activity probability in different spatial units.
3.4. Influencing Factors of Leisure Walking among the Elderly in Outer Activity Space
When the leisure walking space of the elderly was expanded to 800−1500 m, park density (1.996) showed a significant positive effect on the participation of the elderly in leisure walking activities, and the significance level and influence degree increased significantly. However, the indices of park accessibility and park density had no significant effect on leisure walking activities. Residential density (−0.063), road flatness (−0.340), and natural landscape comfort (−0.205) still had significant influences on leisure walking activities; however, the change in influence degree was not obvious (Table 7). The results show that with the increase in walking range, the number and scale of public open space became an important promoting factor to improve the leisure walking activities of the elderly. In addition, the model did not detect the influence of other built environment quality factors, such as landscape comfort and road smoothness, within the walking range of 800−1500 m. The results showed that, in the current urban construction environment in China, road environmental quality (such as sanitation, barriers, and the setting of walking paths) did not significantly affect the walking activities of the elderly (Table 5). In addition, Akaike information criterion (AIC) is a standard to measure the goodness of statistical model fitting. Based on the concept of entropy, this index can balance the complexity of the model and the goodness of data fitting. In this paper, the 150 min/week models show more powerful than the simple “any participation in walking” models based on AIC. It showed that the model had a better fit for walking activities of more than 150 min per week.
Table 7.
Model analysis results of the built environment impact on leisure walking activities among the elderly.
4. Discussion
4.1. Differences in the Leisure Walking Locations of the Elderly under Different Distance Radii
We identified the built environmental elements within the range of leisure walking activities for the elderly. The combination of built environmental elements in different blocks reflects the construction level of them. Specifically, 800 m away from home was the most important daily leisure walking range for the elderly, and 800–1500 m was an important space for optional leisure walking. There were significant differences in the main walking places of the elderly under different distance radii. Among them, plazas, shopping malls, and public service facilities were the most important walking destinations. In addition, supermarkets, schools, banks, parks, and green spaces were the main locations for walking activities. This conclusion is consistent with the conclusions of other relevant studies [8,13,19].
Notably, the main range of leisure walking activities for the urban elderly in this study was 800–1500 m. Previous studies on foreign cities at the same scale identified 400–500 m or 800–1000 m as the main ranges [17], showing basic consistency with the results of this study. Green land rate, bus station density, park density, and park accessibility had a significant positive effect on the participation rate and activity amount of leisure walking activities. The residential density index had a significant negative impact on leisure walking activities, and this conclusion is basically consistent with those of other studies in foreign countries. This conclusion indicates that material conditions, such as good green environment, convenient and accessible traffic stations, and diversified leisure activity locations, can effectively increase the participation of the elderly in walking activities [19]. However, this study found that commercial facilities and public service facilities had a significant negative correlation with the leisure walking activities of the elderly. This conclusion is inconsistent with those of foreign studies [13]; however, it is somewhat consistent with the characteristics of the built environment around the selected communities and the actual walking activities of the elderly.
4.2. Correlation between the Participation in Leisure Walking Activity and Social and Economic Level of the Elderly
The results showed that the highly educated elderly walked less than other elderly, which was significantly influenced by working days and non-working days. Highly educated elderly people were mostly engaged in sedentary non-manual work. These elderly people engaged in more transactional work, their corresponding static work time was longer, and they lacked walking habits. In addition, the elderly with college/bachelor’s degrees (−0.142) or graduate degrees or above (−0.182) engaged in less leisure walking activity on weekdays than those with junior high school education or below. In the range of 800–1500 m, the amount of leisure walking activity by the elderly with college/bachelor’s degrees (−0.281, −0.137) and graduate degrees (−0.324) was lower than that of the lowest education group (Table 4). The results showed that the elderly with higher education (especially those with college/bachelor’s degrees) had longer office hours per week and were mainly sitting during the day. These elderly people had less exercise opportunities, resulting in insufficient leisure walking activities. Similarly, older adults with a monthly income of >4000 CNY (−0.369) reported less leisure walking activity than those in the lowest income group. The amount of leisure walking activity in the group with a monthly income of 2000–4000 CNY (−0.222) was relatively high. In general, the amount of leisure walking activity of the elderly with a monthly income between 2000 and 4000 CNY (−0.326, −0.322) and those with a monthly income >4000 CNY (−0.412, −0.345) was less than that of the group with a monthly income <2000 CNY on both working and non-working days. The results showed that higher earners were more likely to participate in mental work. This group is under more competitive pressure to participate in social and economic activities and has less leisure time. These older adults had relatively low levels of leisure walking activity.
4.3. Correlation among the Participation in Leisure Walking Activity, Health Status and Household Size
The results showed that the amount of leisure walking activity among the elderly in good physical condition (−0.237, −0.167) increased significantly than others. The amount of leisure walking activity on non-working days (−0.133) among the elderly in general physical condition was less than others. The results show that good physical condition helps the elderly to participate in more active leisure walking activities. On weekdays, the amount of leisure walking activity (−0.031) among the overweight elderly was lower than that of the normal weight elderly (Table 4). The physical condition of the elderly directly affects the development and maintenance of their leisure walking habit. In addition, the larger the household size, the lower the probability of the elderly engaging in leisure walking (−0.182). The results showed that the larger the household size, the longer the elderly were engaged in housework, and they lacked time for other physical activities. When older adults lived with their grandchildren, they were significantly less likely to engage in leisure walking activity than older adults without children. According to the model results, compared with the working elderly, the retired elderly have more significant probability and time to participate in leisure walking activities. Due to the 8 h of duty in China, the working elderly spend a lot of time and energy on work every day. Therefore, it is difficult for the working elderly to allocate more time in leisure walking activities such as fitness, shopping and visiting friends. They participate in less leisure walking activities than retired elderly people. According to the model results, compared with the educated group, the uneducated elderly are more likely to carry out leisure walking activities. Educated groups have more job opportunities, they are usually in a working state, and they don’t have enough time to carry out leisure walking activities. The uneducated people usually retire earlier, they have more time to carry out leisure walking activities. The results showed that the family life cycle is in a state of constant turnover when there are multiple generations living together. At this stage, there is much family housework, and the elderly lack time and energy to participate in leisure walking activities (Table 7).
4.4. Built Environment Elements and Enthusiasm
In the daily life among the elderly, street green squares, small commercial facilities and public service facilities are common living spaces. The closer these facilities are to the residence of the elderly, the larger the scale of facilities and the higher the density of facilities, which can significantly improve the probability of leisure walking among the elderly. Specifically, park density, park accessibility, green space rate, bus stop density, school density, road safety and road smoothness can significantly promote leisure walking activities among the elderly within 800m. The government needs to optimize the physical space planning of the block to meet the daily needs of the elderly. The government should provide public spaces for the elderly to walk to promote a healthy lifestyle. According to the influence degree of the leisure and walking habits of the elderly and the built environmental factors, the government should strengthen the supply level of public service facilities such as green spaces, parks, schools, and bus stops. The government should create a safe, comfortable, convenient, and high-quality neighborhood environment to encourage the elderly to participate in leisure walking activities. For example, the government should moderately improve the accessibility of community parks and squares and improves the connectivity between community and urban public service facilities to facilitate the elderly to participate in walking activities. Furthermore, according to the physiological and psychological characteristics of the elderly, the government should optimize the construction quality of the neighborhood environment. For example, the government can establish rest spots at intervals along the parkway and increase the supply of lighting facilities.
5. Conclusions
This study focused on the influence of built environment factors at the block scale on the leisure walking activities of the elderly. We identified the spatiotemporal scope of the elderly’s leisure walking activities. Based on urban multi-source data, we analyzed the spatial demand, spatial opportunity, and spatial restriction effect of built environment factors on the walking activities of the elderly. Then, we identified the differentiated effects of the built environment on walking activities at different spatial ranges. Finally, we proposed a planning strategy to effectively provide walking activity space and actively guide the healthy lifestyle of the elderly.
5.1. Key Findings
This study analyzed the spatiotemporal characteristics of the elderly leisure walking activities and identified the built environmental factors that hinder the elderly walking activities. The main conclusions are threefold.
- (1)
- The most important leisure walking space for the urban elderly is 800 m from home. The 800–1500 m range is an important alternative walking space. The extent of the pedestrian space for the elderly can serve as a boundary to help identify elements of the built environment that are relevant to daily life. Compared with the boundary range of physical places, the scope of activity space is more refined in the expression of residents’ daily behaviors. Based on the spatiotemporal survey data, we determined that there were differences in the length of leisure walking activities between the elderly on non-working days. There were differences in leisure walking destinations within different activity ranges. Among them, public open space and commercial and public service facilities were the main locations for walking activities. Compared with working days, the range of leisure walking activities of the elderly on non-working days had the characteristics of spreading to the periphery of the city.
- (2)
- The density of open green space, commercial facilities, and public service facilities had a significant impact on the leisure walking activities of the elderly. Among them, park density, park accessibility, green land rate, bus station density, and road safety were promoting spatial factors of leisure walking activities. Residential density, natural landscape comfort, supermarket density, and road intersection density were limiting spatial factors for leisure walking activities. With the expansion of the activity space, the influence of some subjective and objective built environment elements on the walking activity of the elderly showed varying degrees of enhancement or weakening.
- (3)
- The socioeconomic background and health status of the elderly have a significant impact on leisure walking activities. A healthy body condition can motivate the elderly to maintain good exercise habits, and older people who are overweight lacked the willingness to exercise outdoors. The physical condition of the elderly directly affected the development and maintenance of their leisure walking habits. The larger the family size, the longer the elderly engaged in housework and the lower the participation rate of leisure walking activities. In addition, highly educated older people spent more time at the office each week, mainly focusing on sitting and mental work, with few opportunities for exercise. Therefore, the amount of leisure walking activity in this group is obviously insufficient. Higher income groups are more likely to participate in mental work. They have more competitive pressure to participate in social activities and less leisure time. These older adults had relatively low levels of leisure walking activity.
5.2. Implications
This study enriched the research results of walking activity in the field of behavioral geography. This research focused on elderly leisure walking space range identification, choice of activity location, activity space perception, and other aspects. First, we quantified the complexity, diversity, and richness of the built environment. Second, we further identified the environmental factors affecting the elderly’s daily leisure walking activities. Third, we explored the interaction mechanism between built environment elements and walking activities of the elderly. This study analyzed the needs of the elderly for the urban built environment and the spatial opportunities and constraints provided by the built environment.
The results show that there is a close relationship between the urban built environment and residents’ walking activity, and it has profound health connotations and effects. Finally, using the elderly as the research object, we combined healthy city planning with the background of the aging society and proposed long-term, stratified, and concrete optimization strategies for built environment elements at the block scale. This study has certain practical significance from two aspects. On the one hand, our research on the interaction between built environment and residents’ behavior provides a theoretical basis for the planning and construction of healthy cities. This conclusion can be used as an important index to test the effect of healthy city planning and construction. On the other hand, the government has optimized and improved the elements of the built environment to promote the perception and adaptation of the elderly to the external environment. This is helpful to guide the elderly to form normal walking habits and develop good healthy life habits.
5.3. Limitations and Future Research Directions
During urban socioeconomic transformation, the living environment and lifestyle of the elderly have undergone substantial changes. Lack of physical exercise increases the risk of obesity, high blood pressure, diabetes, and other diseases among the urban elderly. In general, international research on the impact of the built environment on physical activity began early in the 1960s and has become more systematic, with more theoretical and empirical research results [6,7,13]. Relevant studies in China are still in the initial stage, and there is a lack of theoretical construction and case analysis based on Asian living habits and urban environmental characteristics.
There were some limitations in this study. The information on walking activity level and spatial location was obtained from the memory records of the elderly, and there may be some errors between them and the real activity situation. Different spatial scales and geographical unit ranges will lead to significant differences in research conclusions.
Although this data collection period is in the context of the global pandemic of COVID-19. However, the case located in a low-risk area of epidemic situation, and there is no diseased population, which does not affect the relevant conclusions in this paper. Specifically, the case located in Gaoyou City, Jiangsu Province, China, and belongs to a county-level unit with relatively low population density. During the data collection period, the case area belonged to a low-risk area for epidemic prevention and control (no people infected from the social side), and the government did not take closed control measures on public places and communities. Therefore, the elderly can maintain their existing living habits and behavior habits. However, the COVID-19 is an epidemic disease, and research shows that this kind of disease may have a certain impact on the psychological cognition and behavior among the elderly [39]. In the follow-up study, we will further discuss the impact of related variable factors such as the COVID-19 on leisure walking activities of the elderly.
In the study of the range of human activity, different ranges of activity will map to different physical geographical environment elements. Therefore, there will be a mathematical statistical bias in the results. In the future, we should attempt to capture the spatiotemporal process and level of complete walking activities of the elderly using spatial tracking technology, such as GPS and motion recorder technology. Therefore, the influence mechanism of the urban built environment on walking activity can be accurately measured. This can help to predict the walking activity level of the elderly. In addition, we will study the spatiotemporal dimensions and related factors of physical activity in the elderly. We will further explore the mechanisms underlying the relationship between health effects, built environment, and physical activity.
Author Contributions
Conceptualization, H.W. and H.W. (Hongbin Wang); Data curation, H.W. (Hao Wu) and Y.C.; Formal analysis, X.M.; Methodology, H.W. (Hao Wu); Visualization, Y.Z., Y.Q. and X.M.; Writing—original draft, Y.C.; Writing—review and editing, Y.C. All authors have read and agreed to the published version of the manuscript.
Funding
This research was funded by the Basic Research Fund of CAMS (Grant No. 2022Y023), the 333 Project of Jiangsu Province (BRA2018420), the Jiangsu Innovative and Enterpreneurial Talent Programme (JSSCBS20221645), the Beijing foundation of NJIAS (BJG202209), the Natural Science Foundation of the Jiangsu Higher Education Institutions of China (22KJB170012), and the Research Fundation of Jinling Institute of Technology (JIT-B-202108).
Institutional Review Board Statement
The study was conducted in accordance with the Declaration of Helsinki, and approved by the Ethics Committee of Changshu Health Ethics Review (protocol code No.: 2020030031 and date of approval: 16 March 2020).
Informed Consent Statement
Informed consent was obtained from all subjects involved in the study.
Data Availability Statement
The data is unavailable due to ethical restrictions.
Conflicts of Interest
The authors declare no conflict of interest.
References
- World Health Organization. Physical Activity. Available online: http://www.who.int/mediacentre/factsheets/fs385/zh/ (accessed on 8 January 2019).
- The People’s Republic of China. Law on the Protection of the Rights and Interests of the Elderly [EB/OL]. Available online: http://www.gov.cn/flfg/2012-12/28/content_2305570.htm (accessed on 28 December 2012).
- Dang, J.; Wei, Y.; Liu, N. Survey Report on the Living Conditions of China’s Urban and Rural Older Persons in 2018. Available online: http://baijiahao.baidu.com/s?id=1600769778405217262&wfr=spider&for=p (accessed on 8 January 2019).
- National Health and Family Planning Commission of PRC. Circular on Issuing the Thirteenth Five-Year Plan for Healthy Ageing. Available online: http://www.gov.cn/zhengce/content/2017-03/06/content_5173930.htm (accessed on 6 March 2017).
- Swartz, A.M.; Rote, A.E.; Cho, Y.I.; Welch, W.A.; Strath, S.J. Responsiveness of motion sensors to detect change in sedentary and physical activity behavior. Br. J. Sports Med. 2014, 48, 1043–1047. [Google Scholar] [CrossRef] [PubMed]
- Rojer, A.; Denneman, B.; Brouwer, P.; Ramsey, K.A.; Trappenburg, M.C.; Meskers, C.G.; Pijnappels, M.; Goonan, R.; Marston, C.; Kay, J.E.; et al. Determinants of instrumented sedentary and physical activity behavior in geriatric rehabilitation inpatients: RESORT. Exp. Gerontol. 2021, 154, 111524. [Google Scholar] [CrossRef] [PubMed]
- Willinger, M.; Dubois, D.; Bravaccini, S. Participation in sports competition closes the gender gaps in competition and in risk taking. J. Sports Econ. 2022, 13, 34. [Google Scholar] [CrossRef]
- Oliveira, J.; Frontini, R.; Jacinto, M.; Antunes, R. Barriers and Motives for Physical Activity and Sports Practice among Trans People: A Systematic Review. Sustainability 2022, 14, 5295. [Google Scholar] [CrossRef]
- Carlson, J.A.; Sallis, J.F.; Conway, T.L.; Saelens, B.E.; Frank, L.D.; Kerr, J.; Cain, K.L.; King, A.C. Interactions between psychosocial and built environment factors in explaining older adults’ physical activity. Prev. Med. 2012, 54, 68–73. [Google Scholar] [CrossRef]
- Van Holle, V.; Van Cauwenberg, J.; De Bourdeaudhuij, I.; Deforche, B.; Van de Weghe, N.; Van Dyck, D. Interactions between neighborhood social environment and walkability to explain Belgian older adults’ physical activity and sedentary time. Int. J. Environ. Res. Public Health 2016, 13, 569. [Google Scholar] [CrossRef]
- Todd, M.; Adams, M.A.; Kurka, J.; Conway, T.L.; Cain, K.L.; Buman, M.P.; Frank, L.D.; Sallis, J.F.; King, A.C. GIS-measured walkability, transit, and recreation environments in relation to older adults’ physical activity: A latent profile analysis. Prev. Med. 2016, 93, 57–63. [Google Scholar] [CrossRef]
- Cauwenberg, J.V.; Holle, V.V.; Simons, D.; Deridder, R.; Clarys, P.; Goubert, L.; Nasar, J.; Salmon, J.; De Bourdeaudhuij, I.; Deforche, B. Environmental factors influencing older adults’ walking for transportation: A study using walk-along interviews. Int. J. Behav. Nutr. Phys. Act. 2012, 9, 85. [Google Scholar] [CrossRef]
- Nathan, A.; Pereira, G.; Foster, S.; Hooper, P.; Saarloos, D.; Giles-Corti, B. Access to commercial destinations within the neighbourhood and walking among Australian older adults. Int. J. Behav. Nutr. Phys. Act. 2012, 9, 133. [Google Scholar] [CrossRef]
- Hu, H.; Xu, J. Analysis of urban health geography from the perspective of complex theory. Hum. Geogr. 2018, 33, 1–8. [Google Scholar]
- Qi, L.; Zhou, S.; Yan, X.; Gu, J. Trend and hot topics of medical geography. Prog. Geography. 2013, 32, 1276–1285. [Google Scholar]
- Lin, X.; Yang, J. A review of studies on the relationship between built environment and public health in north american metropolitan areas. Planner 2015, 31, 12–19. [Google Scholar]
- Sun, B.; Wu, J. The Impact of Commuting Time Consumption on Residents’ Health: Evidence from a Follow up Survey of Chinese Families. Res. Urban Dev. 2019, 26, 59–64. [Google Scholar]
- Nyunt, M.S.Z.; Shuvo, F.K.; Eng, J.Y.; Yap, K.B.; Scherer, S.; Hee, L.M.; Chan, S.P.; Ng, T.P. Objective and subjective measures of neighborhood environment (NE): Relationships with transportation physical activity among older persons. Int. J. Behav. Nutr. Phys. Act. 2015, 12, 108. [Google Scholar] [CrossRef] [PubMed]
- Sugiyama, T.; Thompson, C.W. Associations between characteristics of neighbourhood open space and older people’s walking. Urban For. Urban Green. 2008, 7, 41–51. [Google Scholar] [CrossRef]
- Li, F. Multilevel modelling of built environment characteristics related to neighbourhood walking activity in older adults. J. Epidemiol. Community Health 2005, 59, 558–564. [Google Scholar] [CrossRef]
- Zandieh, R.; Martinez, J.; Flacke, J.; Jones, P.; Van Maarseveen, M. Older adults’ outdoor walking: Inequalities in neighbourhood safety, pedestrian infrastructure and aesthetics. Int. J. Environ. Res. Public Health 2016, 13, 1179. [Google Scholar] [CrossRef]
- Hirsch, J.A.; Winters, M.; Clarke, P.; McKay, H. Generating GPS activity spaces that shed light upon the mobility habits of older adults: A descriptive analysis. Int. J. Health Geogr. 2014, 13, 51. [Google Scholar] [CrossRef]
- Gao, X.L.; Wu, D.X.; Xu, Z.N.; Yan, B. A review and framework setting of geographical research on aging in China. Prog. Geogr. 2015, 34, 1480–1494. [Google Scholar]
- Xin, X.; Yuan, Z.; Xinlin, Z. Research progress and prospects of Chinese geriatric geography. Prog. Geogr. 2018, 37, 1416–1429. [Google Scholar]
- Lin, L.; Shan, H.; Ying, Y. Self-rated health of the elderly based on the competence-press model: A case study on Guangzhou typical communities. Sci. Geogr. Sin. 2018, 38, 548–556. [Google Scholar]
- Ao, R.J.; Li, H.C.; Yang, Z. Spatial differentiation and influencing factors of health level of the elderly population: A case study of Hubei Province. Prog. Geogr. 2017, 36, 36–46. [Google Scholar]
- Spinney, J.E.L.; Millward, H.; Scott, D. Walking for transport versus recreation: A comparison of participants, timing, and locations. J. Phys. Act. Health 2012, 9, 153–162. [Google Scholar] [CrossRef] [PubMed]
- Xinhua News Agency. The Experience and Significance of Epidemic Resistance in China over the Past Two Years [EB/OL]. Available online: http://www.scjc.gov.cn/scjc/rdzx/2022/4/14/1689b58c83514e7596a8aa01d06ffd89.shtml (accessed on 18 August 2022).
- Gaoyou Municipal People’s Government. Fang Guilin Came to the Post to Supervise the Epidemic Prevention and Control [EB/OL]. Available online: http://gaoyou.yangzhou.gov.cn/gysxxgk/wjw/202001/683b1bf4947e46d5b6eef2b299361ae4.shtml (accessed on 17 January 2020).
- Cerin, E.; Mitáš, J.; Cain, K.L.; Conway, T.L.; Adams, M.A.; Schofield, G.; Sarmiento, O.L.; Reis, R.S.; Schipperijn, J.; Davey, R.; et al. Do associations between objectively-assessed physical activity and neighbourhood environment attributes vary by time of the day and day of the week? IPEN adult study. Int. J. Behav. Nutr. Phys. Act. 2017, 14, 34. [Google Scholar] [CrossRef] [PubMed]
- Ren, Y.; Deng, L.Y.; Zuo, S.D.; Song, X.D.; Liao, Y.L.; Xu, C.D.; Chen, Q.; Hua, L.Z.; Li, Z.W. Quantifying the influences of various ecological factors on land surface temperature of urban forests. Environ. Pollut. 2016, 216, 519–529. [Google Scholar] [CrossRef]
- Halonen, J.; Stenholm, S.; Kivimäki, M.; Pentti, J.; Subramanian, S.; Kawachi, I.; Vahtera, J. Is change in availability of sports facilities associated with change in physical activity? A prospective cohort study. Prev. Med. 2015, 73, 10. [Google Scholar] [CrossRef]
- Wang, X. Parameter Estimation in Mixed Effect Models. Ph.D. Thesis, Zhejiang University, Hangzhou, China, 2013. [Google Scholar]
- Hao, J.; Sun, C.; Guo, X.Y.; Wang, W.; Liu, F.T.; Dang, H.Y. Simulation of the spatio-temporally resolved PM2.5 aerosol mass concentration over the Inland Plain of the Beijing-Tianjin-Hebei region. Environ. Sci. 2018, 39, 1455–1465. [Google Scholar]
- Hurvitz, P.M.; Moudon, A.V.; Kang, B.; Fesinmeyer, M.D.; Saelens, B.E. How far from home? The locations of physical activity in an urban U.S. setting. Prev. Med. 2014, 69, 181–186. [Google Scholar] [CrossRef]
- Pielak, M.; Czarniecka-Skubina, E.; Trafiałek, J.; Głuchowski, A. Contemporary Trends and Habits in the Consumption of Sugar and Sweeteners—A Questionnaire Survey among Poles. Int. J. Environ. Res. Public Health. 2019, 16, 1164. [Google Scholar] [CrossRef]
- García-Torres, F.; Castillo-Mayén, R. Differences in Eysenck’s Personality Dimensions between a Group of Breast Cancer Survivors and the General Population. Int. J. Environ. Res. Public Health 2019, 16, 1240. [Google Scholar] [CrossRef]
- Poveda-López, S.; Montilla-Herrador, J.; Gacto-Sánchez, M.; Romero-Galisteo, R.P.; Lillo-Navarro, C. Wishes and perceptions about exercise programs in exercising institutionalized older adults living in long-term care institutions: A qualitative study. Geriatr. Nurs. 2022, 43, 167–174. [Google Scholar] [CrossRef] [PubMed]
- Grazuleviciute-Vileniske, I.; Seduikyte, L.; Teixeira-Gomes, A.; Mendes, A.; Borodinecs, A.; Buzinskaite, D. Aging, Living Environment, and Sustainability: What Should be Taken into Account? Sustainability 2020, 12, 1853. [Google Scholar] [CrossRef]
- Encarnao, S.; Moreira, O.C.; Fazolo, S.L.; de Oliveira, C.E.P.; da Encarnação, I.G.A.; Carneiro-Júnior, M.A. COVID-19 and Social Distancing of the Elderly: The Importance of Physical Exercise. Int. J. Phys. Educ. Fit. Sports 2021, 10, 88–108. [Google Scholar] [CrossRef]
- Rasbash, G.J. Improved Approximations for Multilevel Models with Binary Responses. J. R. Stat. Soc. Ser. A 1996, 159, 505–513. [Google Scholar]
- Browne, W.J. MCMC Estimation in MLwi N: Version 2.26; Centre for Multilevel Modelling University of Bristol: Bristol, UK, 2012. [Google Scholar]
- Dempster, A.P.; Laird, N.M.; Rubin, D.B. Maximum likelihood from incomplete data via the EM algorithm. J. R. Stat. Soc. 1977, 39, 1–22. [Google Scholar]
- Ewing, R.; Cervero, R. Travel and the Built Environment: A Meta-Analysis. J. Am. Plan. Assoc. 2010, 76, 265–294. [Google Scholar] [CrossRef]


Disclaimer/Publisher’s Note: The statements, opinions and data contained in all publications are solely those of the individual author(s) and contributor(s) and not of MDPI and/or the editor(s). MDPI and/or the editor(s) disclaim responsibility for any injury to people or property resulting from any ideas, methods, instructions or products referred to in the content. |
© 2022 by the authors. Licensee MDPI, Basel, Switzerland. This article is an open access article distributed under the terms and conditions of the Creative Commons Attribution (CC BY) license (https://creativecommons.org/licenses/by/4.0/).