Abstract
To explore the impact of dynamic changes in tourist demand on the digital transformation of tourism enterprises, this paper starts with demand-side changes, environmental influences, and technical support, based on theories of supply and demand equilibrium, regional innovation environment, technology gaps, and comparative advantage, and conducts a multiple regression analysis using a two-way fixed effects model on data from China’s Shanghai, Shenzhen and New Third Board-listed tourism companies, as well as 31 provincial administrative regions. The study found that dynamic changes in tourist demand significantly impacted the digital transformation of tourism enterprises. In addition, the regional innovation environment and the level of big data also contributed positively to the relationship between tourist demand and the digital transformation of enterprises. For regions with different tourism resource endowments, there is heterogeneity in the impact of dynamic changes in tourist demand on the digital transformation of enterprises. Finally, recommendations for practitioners regarding the digital transformation of enterprises are provided based on this. We suggest that enterprises should pay attention to the changing needs of travelers. They should also consider the regional innovation environment and the level of big data as key resources to facilitate transformation. This will help accelerate digital transformation in tourism.
1. Introduction
A wave of digitalization is sweeping the world, the integration of the digital economy with the tourism industry is deepening, and digitalization is reshaping the way the tourism industry operates—a process accelerated by the outbreak of the epidemic. The scale of online tourism transactions continues to expand, with diverse tourism digital products such as virtual scenic spots and cloud tours being launched one after another. However, the digitalization of enterprises has not been smooth, with the newly released 2022 China Enterprise Digital Transformation Index Study pointing out that the proportion of Chinese enterprises with significant transformation has risen to 17%, up from 16% last year. Leading companies have further widened the gap with other enterprises in terms of digital capabilities and business performance. Faced with the overall slow digitalization process of enterprises and the broad regional differences, how to promote the successful digital transformation of tourism enterprises has become a hot issue of common concern for academics and the industry [1].
As an emerging field of research, digital transformation refers to a systematic transformation process driven by information and communication technologies to change production methods, business models, and industrial organizations [2]. At the beginning of the 1990s, research on organizational change, triggered by the innovative development of digital technologies, opened up a new field of research on digital transformation. The main research topics on digital transformation at home and abroad have expanded from initial technological innovation, e-commerce, business models, and the digital divide to platforms, ecosystems, business strategies, digital innovation, service innovation, organizational change, and innovation performance [3,4,5,6]. For example, Liang Li et al. [3] examined the impact of entrepreneurs on the digital transformation of businesses; Xiaozhen Pan et al. [4]. studied the impact of the digital transformation of environmental enterprises from a spatial reciprocity perspective; Osmundsen [5] studied the factors influencing the successful digital transformation of companies; Robert Eller et al. [6] studied the impact of digitalization on the financial performance of companies. In the field of tourism, research on digital transformation has focused on, among other things, exploring digital transformation and the competitiveness of tourism destinations, the effects of digital empowerment, the application of digital technologies in various scenarios, and the process of interaction between tourists and digital services [7,8,9,10].
Digitalization is a natural fit for the tourism industry. The waning of the “demographic dividend” has made the capture and satisfaction of tourists’ individual and diverse needs fundamental to competition. In the process of increasing regional innovation capacity and the rapid development of big data technology, tourists have undergone a transformation from passive recipients of tourism products to collaborative creators, and then to leading players, in the tourism industry chain, and their tourism needs have become the main driving force for the digitized transformation of tourism enterprises [11]. Regarding the relationship between tourists’ needs and digitalization, most domestic and international research has focused on analyzing phenomena such as tourists’ psychological perceptions, behavioral characteristics, demand preferences, and experience satisfaction through the use of different digital technologies, as well as designing new products to meet tourists’ needs using digital technology capabilities. Examples include studying the behavioral characteristics of tourists’ decision-making through online information such as online reviews and online news [12,13], developing and offering unique service value products [14,15], meeting customer needs through various forms of digital products, and creating value for tourists, entrepreneurs, employees, and society at large by helping to identify destinations of interest [16,17].
The digital transformation of tourism enterprises is a promising research area, both in theory and practice. Since digital transformation has been incorporated into research, scholars at home and abroad have carried out a great deal of research on both the demand-side and supply-side digitalization of tourism, and have achieved fruitful results. However, the research literature on the impact of digital transformation on tourism enterprises based on the supply and demand perspective is not abundant. Therefore, based on these research gaps, this paper will answer the following questions: What impact does the dynamic change in tourist demand have on the digital transformation of tourism enterprises? Can the aforementioned impact effects be facilitated or suppressed by optimizing the regional innovation environment and the level of big data technology? What factors make the digital transformation gap for regional tourism enterprises more significant?
2. Literature Review and Research Hypothesis
2.1. Tourist Demand
As tourists pursue their own experiences and interests, the traditional tourism industry supply system is often unable to effectively meet tourists’ needs through the original resource system. Tourist demand is a subjective response with a multidimensional structure, including the cognitive, emotional, behavioral, and social responses of the tourist to the company [10]. The intangible nature of tourism services and the non-storable nature of customer involvement in the service process have led to difficulty in measuring the quality output of the tourist experience [11]. However, as information technology becomes more and more developed and it becomes more common for travelers to express their experience perceptions through the internet, the needs of travelers can be more visually reflected on the platform. For companies to better understand the needs of travelers, they need to fully and deeply analyze travelers’ sense of experience. This is closely related to the quality of tourism services. Travelers often reflect their needs through their discomfort during the experience, and negative experiences are associated with negative attitudes or behaviors such as tourist dissatisfaction, negative emotions, and negative word-of-mouth spread; negative experiences are increasingly being focused on by academics and tourism enterprises. For example, Cui Qingming et al. (2014) found that tourists’ negative experiences of Tibetan tourism (e.g., excessive commercialization and begging) reinforced tourists’ expectations of the “original authenticity” of Tibet and their dissatisfaction with “love abduction” [18]; Pavesi (2016) focused on the impact of negative experiences on tourists’ later destination choices [19], with negative experiences being one of the most direct manifestations of tourists’ needs.
The negative experience of travelers in the tourism process reflects the imbalance between supply and demand in tourism. According to the theory of tourism supply and demand equilibrium, it is this process of tourism supply and demand moving from imbalance to equilibrium that drives the continuous innovation and development of tourism enterprises. With the change in tourism demand, the connotation of tourism supply expands, and innovation becomes more prevalent. Amidst the new environment, tourism enterprises must increase the comprehensiveness of the tourist experience through digital transformation. This is also true for the content and structure of the tourism industry, so that tourists can access the personalized tourism goods they like. To achieve balanced tourism demand and supply, dynamic adjustment capabilities that continuously change with changing tourist demand must be enhanced. It is evident that the construction of a model of tourism supply and demand will be significant in promoting the equilibrium of the tourism system. This is because it could continuously promote the digital transformation of tourism and meet the changing needs of tourists. Therefore, this study argues that the commentary on the negative experiences of travelers on the internet is a reflection of their unsatisfied tourism demand. It is a driving force for tourism enterprises to carry out digital reforms and innovations. In particular, the fickleness and dynamism of travelers’ individualized needs in the internet environment further contribute to the dynamic optimization of the tourism industry.
Hypothesis 1 (H1).
Dynamic changes in the needs of travelers have a positive impact on the digital transformation of tourism enterprises.
2.2. The Moderating Role of the Regional Innovation Environment
The regional innovation environment promotes the digital transformation of tourism enterprises by influencing the innovation capacity of enterprises and facilitating the achievement of a balance between supply and demand. The study of the regional innovation milieu, which began in the 1990s and continues to this day, has become central to the study of the general innovation milieu. This is due to the regionalization of human development. The concept of the regional innovative milieu was first developed in the mid-1980s by the European Group for the Study of Innovative Milieus (Group de Recherche Europeén Sur Les Milieux Innovateurs). The core definition of a regional innovation milieu is a limited geographical area in which external and internal actors in a given market create informal and complex social relationships through a process of mutual synergy and collective learning, thereby enhancing regional innovation capacity [20]. For example, if government departments/research institutes/universities and market enterprises collaborate on a project to develop technological innovation in a particular field, the normative cooperation mechanism that emerges from this process allows for the development of a local regional innovation environment.
In fact, when changes in the needs of tourists are perceived by enterprises, they face a series of changes that require strong innovation capacity. The regional innovation environment, which has a significant impact on innovation activities in the region, is a combination of the region’s infrastructure environment, the market environment, the human environment, and the entrepreneurial environment. The differences in the regional innovation environment in each province have resulted in uneven innovation capacities in each province, causing differences in the economic environment in terms of the level of human capital, financial capital support, and information infrastructure in the supply of basic factors required by enterprises to face changes in the demand for tourists, as well as the institutional environment in terms of laws, regulations, property rights and patent systems to promote the spillover of scientific and technological knowledge, resulting in large differences in the equilibrium level of tourism supply and demand in each region [21].
At the same time, the competition mechanism, collaborative innovation mechanism, and innovation resource element allocation in the regional innovation environment enhance the competitive relationship between factor markets and market products in the region, enabling the leading industries in the region to develop from traditional industries to high-tech industries in order to compete for more market shares [22]. The regional innovation environment can guide enterprises to invest more in innovation and promote their digital transformation by achieving a balance between supply and demand for tourism. The regional innovation environment can provide good external infrastructure conditions to facilitate the digital transformation of enterprises.
In response, governments and international or regional official bodies should urge tourism businesses to adapt to new technologies and embrace “digital innovation”, enhancing the creation of and investment in new products and services. The European Commission has already implemented many actions to improve the regional innovation environment to help tourism businesses, such as tourism SMEs, to transform digitally. Indeed, there is a growing awareness of the close relationship between innovation capacity and tourism competitiveness at all levels [23]. Therefore, differences in the regional innovation environment make a difference in the ability of firms to respond to the perceived degree of tourist demand. This difference manifests in different degrees of impact on the digital transformation of firms.
Hypothesis 2 (H2).
The regional innovation environment has a positive moderating effect on the relationship between tourist demand and the digital transformation of the tourism business sector.
2.3. The Moderating Role of Big Data Technology
Tourism has a natural association with big data technology, and the increasingly personalized and diverse needs of travelers cannot be mined and realized without big data technology. Big data features can meet the needs of technology [24]. Technological advances (e.g., sensors, social media, and web-based tools) generate data at high speed (large-scale data) with high efficiency (high-speed real-time data), diversity (in the form of data variability, e.g., soft and hard data, text-based and digital data) and high accuracy (multiple interpretations and lots of “noise”), generating data that enable the capture and sharing of large volumes of traveler data in various forms, quickly and on the move. For example, online review platforms facilitate the rapid capture of big data, facilitating their enrichment, enhancement, and change. Technology also enables the rapid processing, visualization, and analysis of big data to aid and facilitate decision-making in day-to-day actions and the development of corporate strategies. Big data technology enhances the ability of tourism companies to meet the dynamic needs of travelers, and is one of the key technologies for the digital transformation of companies.
The ability to adapt and use new and innovative technologies is important in the tourism industry in the context of changing market conditions and exogenous shocks that can help companies to understand demand-side trends and enhance corporate value to varying degrees [25]. Destinations, tourism organizations, tour operators, hospitality businesses, theme parks, museums, event organizers, and other tourism-related businesses are increasingly streamlining their operations by integrating big data with other forms of technology to enable them to better engage with travelers, be more competitive, and increase their revenues [26,27]. One of the more applied aspects of big data technology is to add value to the customer experience, as value creation in tourism is closely linked to the visitor experience. [28]. Examples include the use of digital marketing to promote and launch tourism products [8], cities creating mobile apps for tourists [29], introducing multi-sensory technologies and virtual/augmented reality exhibitions in museums [30], artificial intelligence in hotels, and robotics and service automation in the US [31,32], all in different forms to meet the needs of tourists. Technological developments related to big data can contribute to the transformation and rapid innovation of tourism [33]. Big data uses new technologies and methods to capture application data for visualization and data aggregation [34], so as to provide businesses with tourist behavior and the latest activities, helping them to make rational inferences and predictions to better meet tourist demand [10]. Tourism demand determines the boundaries of tourism enterprises’ supply, and big data technology facilitates the digital transformation of tourism enterprises [35].
However, tourism companies are still in a situation where the underutilization of technology prevents the problem of tourist demand from being solved, and digital transformation is slow to develop [36,37]. The technology gap theory argues that a large part of the trade in industrial goods between industrialized countries is actually conducted on the basis of the existence of a technology gap. It is difficult to provide tourism services due to the technology gap between tourism firms. Individuals with higher levels of digital skills among tourists are 1.943 times more likely to be digital consumers than those with low or negligible levels of digital skills [38]. This also places a higher demand on tourism businesses to be able to provide digital products and services that satisfy travelers.
In summary, the powerful analytical capabilities of big data can provide timely and sensitive feedback to enterprises regarding the needs of travelers, thus helping them to achieve higher revenue and facilitating their digital transformation.
Hypothesis 3 (H3).
Big data analytics capabilities have a positive moderating effect on the relationship between travelers’ demand and tourism enterprises’ digital transformation.
2.4. Heterogeneity of Resource Endowment
When choosing destinations, tourists prefer areas with rich tourism resources and higher-quality services. They believe that areas with such advantages are more able to meet their needs and yield a more pleasant journey experience. According to the principle of comparative advantage theory, the comparative advantage of regional tourism resources is the result of comparing the main landscape entities that support the characteristics of tourism resources in one region with the corresponding resource entities in neighboring regions, and it is reflected through specific resource entities. In addition to the relative advantages resulting from the favorable or unfavorable development of production factors between regions, there is the absolute advantage resulting from factor differences between regions. The comparative advantage of regional tourism resources can be explained using the principles above. There is an absolute advantage if certain factors are limited in their spatial distribution to the extent that there is a difference between having and not having. This is the case with most human tourism resources. With a certain level of technology, there is an absolute cost advantage in production—if the elements are diverse and the distribution is extensive, but the visibility is general, or if there are differences in the advantages and disadvantages among them, or in the conditions of exploitation [39]. In this way, comparative advantages can still be established and a relative cost advantage in production can be achieved in the case of certain technologies. By applying this principle to the analysis of regional tourism resources, it is possible to establish the comparative advantage of regional tourism resources.
Depending on the type of comparative advantage tourism, the number of tourists attracted by the scale can also vary, and this thus affects the development of regional tourism resources. The 5A-grade scenic spots are the highest grade of tourist attractions in China, and are judged on three aspects: service and environmental quality, landscape quality, and tourist opinion, with scores up to 950, 90, and 90, respectively, to be given. It is also a dynamically adjusted scenic spot, representing China’s world-class tourist attractions. The number of 5A scenic spots in each province is uneven, and is a reflection of the comparative advantages of each province’s tourism resources. The comprehensive evaluation of scenic spots (Figure 1a) and scenic spot attention (Figure 1b) by ArcGIS for the 31 provincial administrative regions shows that the comprehensive evaluation of 5A scenic spots varies greatly from region to region, and the attention of tourists changes with the comprehensive evaluation of 5A scenic spots. According to the spatial distribution pattern of 5A-rated scenic spots, China can be divided into four major regions: the east, central, the west, and the northeast [40]. The eastern and central regions have higher tourism ratings and attention than the western and northeastern regions. This may be the result of a combination of rich natural resources and convenient amenities. More attention means more inflow of resources and more incentive for tourism enterprises to innovate and transform. Therefore, the following hypothesis is proposed in this paper.
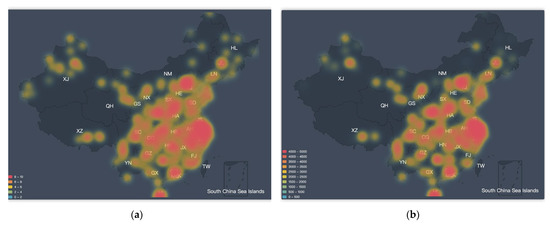
Figure 1.
(a) Heat map of comprehensive ratings of 5A scenic spots by provincial administrative regions. (b) Heat map of tourists’ attention to 5A scenic spots by provincial administrative regions.
Hypothesis 4 (H4).
The influence of tourism resources in different regions on the relationship between tourist demand and the digital transformation of enterprises is characterized by heterogeneity.
Based on the above theoretical explanation and hypothesis analysis, the theoretical model of this paper is shown in Figure 2.
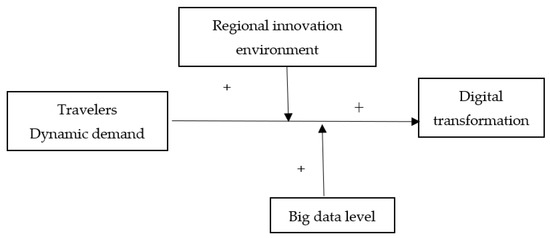
Figure 2.
The theoretical framework diagram.
3. Research Methodology
3.1. Data Collection
The data used in this study comprise panel data information for 31 provincial administrative regions in mainland China from 2008 to 2020. Data on the dependent variable were obtained from annual reports of listed companies. Data on the independent variable were obtained from web data crawlers. For the process of tourism dramatization, 1060 annual reports of 106 listed companies from Shanghai, Shenzhen, and New Third Board tourism were collected. Data on total tourism revenue and total regional output value for each provincial administrative region are cited from provincial government websites, databases such as the China Regional Innovation Capacity Evaluation Report, the China Big Data Regional Development Level Assessment White Paper, the China Informatization Development Level Assessment Report, and the China Sub-Provincial Marketization Index Report.
3.2. Variables
3.2.1. Dependent Variable: Digital Transformation (DG)
In this paper, following Zhao Chen-Yu et al. (2021) [41], text analysis was used to measure the degree of digital transformation of enterprises. In the specific operation, Python was first used to download the annual reports of listed companies in Shanghai, Shenzhen, and the New Third Board from 2010–2020 from the Juchao Information Website, and then text recognition and scanning of the annual reports of listed companies was carried out based on the keyword clusters of enterprise digital transformation. The number of occurrences of relevant keywords in each annual report was recorded. The word frequency obtained by summing up the number of occurrences of all keywords in the company’s annual report in that year is taken as the natural logarithm and used as a proxy variable for the degree of digital transformation of the company in that year. The annual reports of listed companies are issued by the core management of the company, and can reflect the management philosophy and development path of the company. The frequency of keywords related to digital transformation extracted from the annual reports of companies can reflect the current digital strategy characteristics of the company and its future development plan. Compared to determining whether an enterprise has undergone digital transformation, word frequency statistics can provide a more accurate and comprehensive measure of an enterprise’s propensity for digital transformation and the extent of digital transformation. In particular, the definition of digital transformation keyword clusters is mainly based on Wu Fei et al. (2021) [42], in which smart, cloud tourism, Internet of Things, cloud computing, internet, digitalization, 5G, big data, artificial intelligence, unmanned, virtual reality, smart guide, data monitoring, mobile, web, social, machine learning, blockchain, transformation and digital platform are set in relation to enterprise digital transformation in this paper’s keyword phrase cluster.
3.2.2. Independent Variables: Dynamic Traveler Needs
Tourist demand was mainly collected from the Ctrip.com platform. As an early-market tourism website, Ctrip.com has more than one million hits per day and attracts much academic attention. The website allows tourists to submit reviews earlier. Therefore, a Python crawler program collected 1,048,627 negative reviews of the top 5 5A scenic spots in the upper provinces. This has been used to reflect the dynamic changes in tourist demand in the last two decades.
As seen in Figure 3a, tourist demand from 2000 to 2010 is more focused on issues such as ticket prices, lagging management, queueing times, and poor service; while the analysis of tourist demand from 2011 to 2020 in Figure 3b reveals that in addition to the above issues, tourists also question the sense of experience at scenic spots. The negative tourist evaluations show that the development of scenic spots is relatively slow, and there are more negative issues persisting over time. With the development of big data technology, the number of travelers posting comments on platforms is increasing. The demand for trips is increasing, placing higher demand on scenic spots and on the continuous innovation and development of tourism enterprises. In addition, the digital transformation of enterprises cannot be delayed.
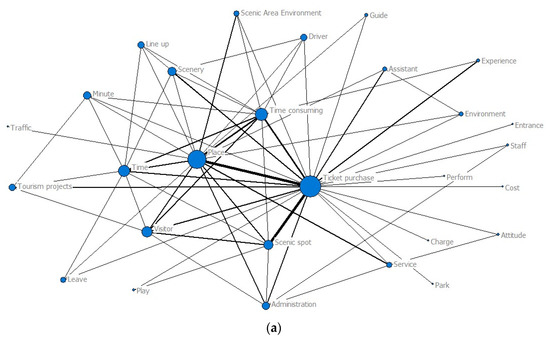
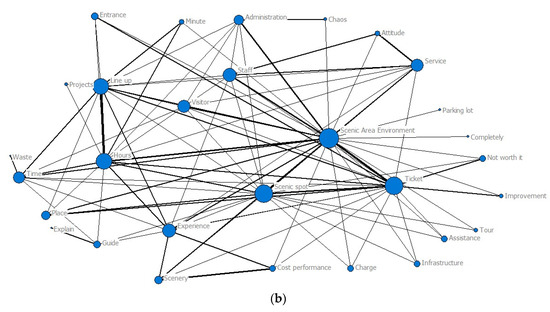
Figure 3.
(a) Demand analysis 2000–2010. (b) Demand analysis 2011–2020.
3.2.3. Moderating Variables
The indicator system of the China Regional Innovation Capacity Assessment Report consists of a comprehensive indicator of “innovation capacity” and five primary indicators. The “innovation environment”, as a first-level indicator, is measured on the basis of the government’s role in creating a climate for technological innovation, and therefore covers innovation infrastructure, market environment, labor quality, financial environment, entrepreneurship level, etc. The big data-level data come from the “White Paper on the Assessment of China’s Regional Development Level of Big Data”, and the indicators are constructed based on 3 primary indicators, 13 secondary indicators, and more than 30 tertiary indicators of the three main areas of big data development: the basic environment, industrial development, and industrial applications. Thus, these two indicators systematically and comprehensively evaluate the regional innovation environment and the level of big data.
3.2.4. Control Variables
To control for the impact of other variables on the digital transformation of tourism in different regions, control variables based on industrial development, institutional environment, and innovation inputs are introduced in this paper. At the level of industrial development, industrial concentration (IC), quality of labor (QW), rationalization of industrial structure (RS), and tourism size (TS) are introduced; at the level of the institutional environment, marketization index (MI) is introduced; at the factor level, internet penetration (IP) and scenic resources (SR) are introduced. The type, name, sign, and measure of each variable are detailed in Table 1.

Table 1.
Variable definition table.
3.3. Model Construction
Based on the F-test and Hausman test results, this paper should use a fixed-effects regression model, thus excluding both individual effects and time effects; based on the test results of variance inflation factors (VIF value) less than 10, it excludes the effects of multicollinearity, and by adding robust standard errors (Robust) to the fixed-effects model, it excludes the effects of heteroskeletonity. Drawing on the empirical research processes of Yang Zhenning, Zhao Hong [43] and Guo Tao et al. [6,44], the test models for this paper’s main and moderating effects are as follows:
DGi,j = β0 + β1 × TNi + ∑βi,j × Controli,j + ∑βk × Yeark + εi,j
Equation (1) tests the relationship between changes in tourist demand and the digital transformation of enterprises (i.e., H1). If β1 is significant, it indicates that tourist demand directly affects the digital transformation of tourism enterprises.
DGi,j = β0 + β1 × TNi + β2 × c_IE + β3 × XZ_c + ∑βi,j × Controli,j + ∑βk × Yeark + εi,j
DGi,j = β0 + β1 × TNi + β2 × c_BD + β3 × XD_c + ∑βi,j × Controli,j + ∑βk × Yeark + εi,j
Equations (2) and (3) test the moderating effects of the regional innovation environment and big data level (i.e., H2 If β3 is significant, it indicates that the regional innovation environment/big data level has a modifying effect on the relationship between tourism demand and the digital transformation of enterprises. In addition, the test of the moderating effect also draws on the practice of constructing interaction terms between the dependent and moderating variables after centralizing them, as proposed by Wen Zhonglin et al. [45], to eliminate the effects of differences in magnitude between different variables on the results.
4. Data Analysis and Results
4.1. Descriptive Statistical Analysis
As can be seen from Table 2, the enterprise digital transformation (DG) score of enterprises is 81.285, with a minimum value of 0, a maximum value of 564, and a mean value of 38.895, showing relatively large differences in the level of digitization of individual enterprises. The standard deviation of tourist demand is 114.32, with a minimum value of 0, a maximum value of 1250, and a mean value of 63.240. This indicates a large variation in tourist demand across regions. The standard deviation of the tourism scale by region is 3049.758, with a minimum value of 67.8, a maximum value of 14,300, and a mean value of 3743.506. This indicates a large difference in the tourism scale by region. Secondly, the standard deviation of internet coverage, big data usage, and innovation environment is between 9 and 14, showing that there are also relatively large differences in the levels of these three areas across regions. The differences between regions in several aspects, such as the marketability index, labor quality, industry concentration, and the degree of structural rationalization, are relatively small, with the biggest difference of 2.2 in the marketability index and the rest ranging from 0.09 to 0.15.
Table 2.
Descriptive statistical analysis of variables.
4.2. Main and Moderating Effects Tests
By testing each hypothesis between tourist demand, enterprise digital transformation, regional innovation environment, and the level of big data, the results of the multiple linear regression of the main and moderating effects are shown in Table 3. From model 1, it can be seen that the change in tourist demand has a significant positive effect on the digitization process of enterprises (β1 = 18.310, p < 0.01), and hypothesis H1 of this paper is verified. As a result of models 2 and 3, the interaction terms of the innovation environment in a region and big data level with changes in tourist demand have a significant positive impact on the level of digitalization in a company (β2 = 0.009, p < 0.05; β3 = 0.007, p < 0.05), and Hypotheses H2 and H3 are confirmed.
Table 3.
Results of multiple regression analysis.
4.3. Robustness Tests
In order to test the reliability of the above results, this paper applies the instrumental variables method, lagging one and two periods of tourist demand corresponding to the year to which the enterprise digital transformation observations belong, and again testing Hypotheses 1–3. The results in Table 4 show that the sign and significance level of the regression coefficients of the core variables do not change significantly, while the sign and significance level of the regression coefficients of some control variables alone change, thus excluding endogeneity problems and confirming the robustness of the model.
Table 4.
Dynamic test of the digital development process of tourism enterprises.
4.4. Heterogeneity Test
China is a vast country with uneven regional tourism resources and a long-standing imbalance in development, with the “horse-trading effect” continuing, and the “East being stronger than the West and the South weaker than the North” as the overall pattern. The eastern destinations are significantly better than the middle and western regions in terms of capacity, the richness of tourism products, and service levels. The central and western regions—especially the western region—have better ecological resources, which form a natural basis for tourism development but are limited by factors such as transport infrastructure and regional wealth levels, making tourism development relatively sloppy and market-oriented. However, with the shift of China’s industrial development to the central and western regions, the economic and tourism development in the central and western regions is showing a rapid growth trend, with the tourism industry developing at a significantly higher rate than in the west. Overall, the uneven development of tourism in China’s regions is still evident, with different situations in terms of basic conditions, economic development levels, financial support, etc. The results of the group test are shown in Table 5. A significant positive impact on the digitalization of enterprises can be attributed to the interaction between the regional innovation environment and the level of big data and changes in tourist demand. Due to recent government policies aimed at promoting the digital transformation of enterprises in the west, where resource endowment advantages are not strong, the tourism dynamic demand is also significantly positive, so Hypothesis H4 is essentially verified.
Table 5.
Analysis of the heterogeneity of the digital transformation of tourism enterprises.
5. Discussion
Our research shows that dynamic changes in tourist demand can have a positive impact on the digital transformation of tourism enterprises, that optimizing the regional innovation environment and the level of big data can contribute to the aforementioned impact effects, and that the different moderating effects of the innovation environment and the level of big data under differences in resource endowments can widen the gap in the degree of digital transformation in terms of the impact on tourist demand. Our research has four core points.
The first core point is that changing demand is the future direction of transformation, and meeting the needs of tourists is at the heart of the digital transformation of tourism enterprises. In the internet environment, the fickleness and dynamism of tourists’ individual needs further fuel the digitalization process of tourism enterprises [11]. Previous studies have typically looked at the impact of digitalization on tourists’ travel patterns, destination choices, satisfaction with tourism products, and so on, from the perspective of individual tourists at the micro level [15,17]. Our findings instead take a holistic enterprise development perspective, drawing on the experience of previous online reviews to capture the changes in tourists’ needs before and after enjoying digital services, a change that encompasses the entire service process of the enterprise. Interestingly, the digitalization of tourism businesses seems to be more forced than the tourists’ enthusiasm for digital adoption. We have analyzed the poor experiences of tourists during their travels over the last 20 years and found that some problems persist. Chinese tourism companies, which have long been immersed in the “demographic dividend”, seem to be under-appreciating the needs of tourists. The removal of some 5A scenic spots, such as the “Qiao Family Courtyard”, has also served as a warning to more tourism companies. The traditional tourism model has changed, and the digital skills of tourists are gradually improving, while the demand for digital services from tourism companies is also higher. The dynamic change in tourist demand is not only for digital products, but also for the continuous improvement of digital management and services, which will lead to the transformation of the digitalization of enterprises. We hope that tourism companies will establish a long-term vision of sustainable development, based on the increasingly diversified needs of tourists, and establish an all-around, whole-process transformation. In fact, companies that focus on the needs of tourists and are able to integrate their corporate strategy with the needs of travelers will be more focused on the process of corporate digitalization. It is by strengthening the digital development of the company that it will be able to gain better insight into the dynamics of tourists’ needs and continue to build up a competitive advantage.
The second central point is that regions with a positive regional innovation environment have a facilitating effect on the relationship between tourist demand and the digitalization of tourism firms. The influence of the environment on firm digitization has been recognized by a large number of scholars, with previous studies looking at the digital environment, the competitive environment, and the market environment, respectively, finding that the coping strategies of firms’ digital transformation depend to a large extent on the strength of the digital climate in these external environments [4,21,23]. Complexity is an important factor in innovation implementation, and our study considers digital transformation as a complex and integrated systemic shift. A comprehensive innovation environment is formed by the combination of innovation infrastructure, market environment, the quality of the workforce, financial environment, and the level of entrepreneurship. In fact, if a firm perceives that adopting innovation requires significant effort, they are less likely to do so, and digital transformation requires a certain level of innovation capability. China is a vast country, and there are huge disparities in innovation development capabilities between different regions. For example, Guangdong, Beijing, Jiangsu, Zhejiang, and Shanghai are regions with high innovation capacity, and they have become regions where digital transformation leaders are clustered. In the face of external uncertainty, many companies are focusing on reducing costs and increasing efficiency in their existing businesses, and holding back on future investments. However, the leaders are still determined to transform and invest fully in their digital innovation capabilities. This relates to the advantages that the innovation environment gives them. Leaders also perform significantly better than others in terms of sustained leadership (20%), and the further extension of their innovation advantage leads them to proactively tap into and meet the needs of their visitors, and to be more determined in their overall transformation. However, for Chinese companies, the regional innovation environment needs to be supported and facilitated by the government through the provision of funding, policies, advice, programs, and other forms of assistance in order to better drive the development and implementation of digital strategies in conjunction with demand-side changes. The government can also lead businesses on a digital path by developing appropriate guidelines and leading them to develop plans that are responsive to government developments.
The third core point is the positive moderating effect of big data. With the development of the internet, tourists can search, compare and make decisions anytime and anywhere through big data, and all travel-related planning and implementation are not limited by time and space, without the need to actually travel. Big data technology can help travelers plan their trips in the easiest and fastest way possible [46]. Businesses can also use big data technology for marketing and promotion. There is a growing demand for seamless online presentation and technical expertise from both tourists and travel businesses. Previous studies have proven the importance of big data technology in the tourism industry, showing that technology is a prerequisite for the digital transformation of tourism businesses and that digitizing a business is impossible without the right technology [25]. However, simply driving technology forward is not sufficient to reap the benefits of digitalization, and it is important to understand how to make the best use of corporate big data resources to support and drive digital strategy and transformation capabilities. This result is consistent with the comparative advantage theory view that big data resources by themselves cannot generate competitive advantages unless big data is effectively integrated with the firm’s availability and long-term interests, and evolves into an irreplaceable dynamic capability for realizing the value of big data [47]. Our study treats big data technology as a moderating variable, emphasizing its importance while integrating it with the changing needs of tourists and the digital transformation of firms. Today, travelers mostly use digital platforms and apps to plan their trips. Travel businesses face increasing competition and customer loyalty has become the key to success, requiring constant efforts to understand the vast amount of information that customers search for and use to make decisions on the platforms. The better the customer experience on a digital platform, the better it is for the business. Digital platforms need better and new features to continue to attract customers. Aligning technological developments with the fundamental interests of business development can truly create an internal drive for digital transformation. Technology helps users to understand customer needs and behavior in a better way, and helps to deliver better and improved products and services. Those tourism businesses that are not willing to invest in technology may lose their chances of survival in the near future, but investments that ignore the demand side of the equation will not really drive the digitalization of the tourism industry either. This could explain the fact that companies have clearly made significant investments but have not achieved the expected returns, thus wavering in their determination to transform. It is true that big data infrastructure and big data management capabilities have brought about changes in business innovation and competitive models, giving rise to new forms of business strategy and providing the necessary technical support required for the effective implementation of digital strategies. However, companies must know how to properly exploit the value of these tools in the form of big data capabilities, and compatibility between new technologies and digital strategies plays an important role in the implementation of digitalization. Big data management capabilities need to be combined with dynamic changes on the demand side, which can improve decision-making and efficiency, thus increasing the level of implementation of digital transformation.
The fourth core point is that regions with different tourism resource endowments show a wide gap in their abilities to perceive the needs of tourists, and this has significantly different impacts on the digital transformation of the businesses. Tourism relies heavily on natural resource endowments, and basic tourism resources, geographic conditions, and climatic conditions are fundamental conditions that influence tourism development, while determining the characteristics and direction of its survival and development. Tourism resource endowment and tourism specialization contribute to the establishment of brand advantages and capital accumulation in tourism destinations [48]. The asymmetry in the spatial pattern of regional tourism efficiency is more pronounced due to the large differences in tourism resource endowment and specialization in different regions. Previous methods of measuring tourism resource endowment were first based on indicators such as absolute abundance, relative abundance, total abundance, combination index, and overall dominance of tourism resources in each region [49], and later, as directly quoted from the database of the former National Tourism Administration’s “Quality Assessment Results of National Tourist Attractions (Points)” launched in 2000 [50], using the number of A-class tourist attractions, as well as the number of scenic spots above the provincial level, national historical and cultural cities, provincial-level forest parks above the provincial level, cultural heritage protection units above the provincial level, the sum of all levels of national tourist areas, and China’s excellent tourist cities [50,51]. Our study uses tourists’ comprehensive ratings of scenic spots on social media as the source of data, which is a reflection of tourists’ comprehensive feelings and offers large sample size. Using these data, researchers can obtain the extent of tourists’ perceptions of natural and human resources and accurately grasp the impact of resource advantages on tourists’ demand. According to the theory of the comparative advantage, regions rich in tourism resources are more able to attract tourists and give them a satisfying journey, and our research validates this theory. For example, the eastern region is richer in resources than the western region in natural resources, but tourists rate the eastern scenic areas higher than the western ones—this is related not only to natural resources, but the eastern scenic areas are also more digitized than the western, and tourists’ perceptions of human resources are thus strong. The government, relevant institutions, and enterprises should actively respond to the “horse-trading effect” formed by the different endowments of tourism resources. The government should guide more capital and professional investment institutions to invest in areas with poor resource endowments through policy, and encourage enterprises to use new technology to capture the dynamic changes in tourist demand in a timely manner, seeing this as a direction for improvement and a focus for innovation.
6. Conclusions
Compared to other industries, the digitalization of tourism enterprises has started earlier on the supply side to carry out digital transformation, and has achieved milestones in terms of platform applications and virtual applications, but the overall digitalization of the industry still needs to be improved. Therefore, our research is firstly based on the theory of supply and demand equilibrium, and from the demand side, we determine that the enhancement of tourists’ demands and the occurrence of negative experiences under changes in the internal and external environment will have an impact on the digitalization of enterprises. Tourism enterprises are prompted to value and face up to the information feedback given by travelers, overcome the gains derived from short-term scale effects, and develop a digitalization strategy that is in line with the long-term development of the enterprise. Secondly, combining the regional innovation environment and technology gap theory, it is found that optimizing the regional innovation environment and improving the level of big data can enhance the promotion of tourist demand and enterprise digitization, helping relevant government departments to better optimize the resources allocated to the transformation process, equipping enterprises with the ability to meet the dynamic demand changes on the demand side and developing more effective strategies to address the complexity arising from enterprise digitization. Finally, combined with the theory of the comparative advantage, it is verified that differences in resource endowments can cause different impacts related to tourist demand on the digital transformation of enterprises, providing lessons for the precise positioning of the digitalization of regional tourism enterprises. Our research provides new knowledge on how tourist demand influences the digital transformation of tourism enterprises, examining the ability of the regional innovation environment and the level of big data technology to moderate tourist demand and the digital transformation of enterprises, and conducting analyses that produce differentiated impacts based on differences in resource endowments.
7. Limitations and Future Research
Although this study provides new insights into the development of digital transformation in tourism companies and other enterprises, there are still certain limitations. Firstly, this study only examines the impacts of some factors on the digital transformation of tourism enterprises. It does not verify other more influential factors, thus reducing the complexity of digital transformation. In the future, more elements will be integrated, and a comprehensive analysis of the system configuration will be conducted. Secondly, this study only provides an in-depth analysis of the tourism industry. The differences between industries mean that transformation has its own characteristics, and the application of references to other industries has some limitations. Finally, although the negative experiences of tourists come from authoritative websites, their objectivity and accuracy still need to be strengthened.
Author Contributions
Conceptualization, N.L.; data curation, Z.L.; investigation, X.Z.; methodology, N.L.; validation, Z.L.; writing—original draft, N.L; writing—review and editing, N.L. and Z.L. All authors have read and agreed to the published version of the manuscript.
Funding
This research was funded by Shanxi Provincial Philosophy and Social Science Project OF FUNDER, grant number 2022YY130.
Institutional Review Board Statement
Ethical review and approval were waived for this study due to the use of publicly accessible secondary data with no identifiers. This research does not meet the regulatory definition of human subject research.
Informed Consent Statement
Not applicable.
Data Availability Statement
Not applicable.
Conflicts of Interest
The authors declare no conflict of interest.
References
- Chen, Q.; Du, Y.; Xue, M. Digital Transformation and Innovation and Development of Management Research and Practice in China in an Uncertain Environment: Review of the 11th “China, Practice and Management” Forum. Chin. J. Manag. 2021, 3, 337–342. [Google Scholar]
- Lu, Y.; Wang, C. Comparative analysis and latest progress of digital transformation quantitative evaluation research. Sci. Technol. Prog. Policy 2021, 9, 152–160. [Google Scholar]
- Li, L.; Su, F.; Zhang, W.; Mao, J.Y. Digital transformation by SME entrepreneurs: A capability perspective. Inf. Syst. J. 2017, 28, 1129–1157. [Google Scholar] [CrossRef]
- Pan, X.; Xu, G.; Zhu, N. Spatial Peer Effect of Enterprises’ Digital Transformation:Empirical Evidence from Spatial Autoregressive Models. Sustainability 2022, 14, 12576. [Google Scholar] [CrossRef]
- Osmundsen, K.; Iden, J.; Bygstad, B. Digital Transformation: Drivers, Success Factors, and Implications. In Proceedings of the MCIS 2018, Corfu, Greece, 28–30 September 2018; pp. 1–16. [Google Scholar]
- Eller, R.; Alford, P.; Kallmünzer, A.; Peters, M. Antecedents, consequences, and challenges of small and medium-sized enterprise digitalization. J. Bus. Res. 2020, 112, 119–127. [Google Scholar] [CrossRef]
- Le, L.H.; Ridderstaat, J. Crowding-out or crowding-in: The impact of Chinese tourists on selected tourist segments in Vietnam destinations. J. Destin. Mark. Manag. 2021, 22, 100655. [Google Scholar] [CrossRef]
- Tsourgiannis, L.; Valsamidis, S. Digital marketing in tourism: Why Greek tourists use digital marketing applications like Airbnb. Int. J. Cult. Tour. Hosp. Res. 2019, 13, 473–486. [Google Scholar] [CrossRef]
- Hadjielias, E.; Christofi, M.; Christou, P.; Drotarova, M.H. Digitalization, agility, and customer value in tourism. Technol. Forecast. Soc. Change 2022, 175, 121334. [Google Scholar] [CrossRef]
- Xu, F.; Nash, N.; Whitmarsh, L. Big data or small data? A methodological review of sustainable tourism. J. Sustain. Tour. 2020, 28, 144–163. [Google Scholar] [CrossRef]
- Yong, Y. Does the Internet Promote Dynamic Optimization of the Tourism Industry? Bus. Manag. J. 2019, 41, 156–170. [Google Scholar]
- Filieri, R.; Lin, Z.; Pino, G.; Alguezaui, S.; Inversini, A. The role of visual cues in eWOM on consumers’ behavioral intention and decisions. J. Bus. Res. 2021, 135, 663–675. [Google Scholar] [CrossRef]
- Wang, L.; Cao, X.; Li, T. The Structure of Tourist Flow Network and Its Different Characteristics from the Perspective of Different Travel Time: A Case Study of Xi’an City. Sci. Geogr. Sin. 2021, 41, 1437–1447. [Google Scholar]
- Dang, H. Value creation mechanism of tourism services driven by digital transformation. Econ. Issues 2022, 7, 122–129. [Google Scholar]
- Buonincontri, P.; Micera, R. The experience co-creation in smart tourism destinations—A multiple case analysis of European destinations. Inf. Technol. Tour. 2016, 16, 285–315. [Google Scholar] [CrossRef]
- Lalicic, L.; Marine-Roig, E.; Ferrer-Rosell, B.; Martin-Fuentes, E. Destination image analytics for tourism design—An approach through Airbnb reviews. Ann. Tour. Res. 2021, 86, 103476. [Google Scholar] [CrossRef]
- Bigné, E.; Zanfardini, M.; Andreu, L. How online reviews of destination responsibility influence tourists’ evaluations- an exploratory study of mountain tourism. J. Sustain. Tour. 2020, 28, 686–704. [Google Scholar] [CrossRef]
- Cui, Q.; Xu, H.; Yang, Y. Secular Pilgrimage: Tourist Experience in Tibet. Tour. Trib. 2014, 29, 110–117. [Google Scholar]
- Pavesi, A.; Gartner, W.; Denizci-Guillet, B. The Effects of a Negative Travel Experience on Tourists’ Decisional Behavior. Int. J. Tour. Res. 2016, 18, 423–433. [Google Scholar] [CrossRef]
- Teare, R. International Journal of Contemporary Hospitality Management. Mark. Intell. Plan. 1990, 8, 12–14. [Google Scholar] [CrossRef]
- Hou, P.; Liu, S.; Jian, L. Research on the impact of innovation environment on China’s regional innovation capacity and regional differences. Inq. Econ. Issues 2014, 11, 73–80. [Google Scholar]
- Yin, X. Research on the Impact of China’s Regional Innovative Milieu on Industrial Structure Upgrading. Ph.D. Thesis, Jilin University, Changchun, China, 2019. [Google Scholar]
- Xia, H.; Tan, Q.; Bai, J. Business Environment, Enterprise Rent-seeking and Market Innovation: Evidence from the China Enterprise Survey. Econ. Res. J. 2019, 54, 84–98. [Google Scholar]
- Lehrer, C.; Wieneke, A.; Vom Brocke, J.; Jung, R.; Seidel, S. How Big Data Analytics Enables Service Innovation: Materiality, Affordance, and the Individualization of Service. J. Manag. Inf. Syst. 2018, 35, 424–460. [Google Scholar] [CrossRef]
- Melián-Alzola, L.; Fernández-Monroy, M.; Hidalgo-Peñate, M. Information technology capability and organisational agility: A study in the Canary Islands hotel industry. Tour. Manag. Perspect. 2020, 33, 100606. [Google Scholar] [CrossRef]
- Capriello, A.; Riboldazzi, S. How can a travel agency network survive in the wake of digitalization? Evidence from the Robintur case study. Curr. Issues Tour. 2020, 23, 1049–1052. [Google Scholar] [CrossRef]
- Lam, C.; Law, R. Readiness of upscale and luxury-branded hotels for digital transformation. Int. J. Hosp. Manag. 2019, 79, 60–69. [Google Scholar] [CrossRef]
- Walmsley, A. Policy decisions and tourism: Unintended consequences or deliberate neglect reactions to the ban on term time holidays in the UK’s South West. J. Policy Res. Tour. Leis. Events 2019, 11, 179–192. [Google Scholar] [CrossRef]
- Ribes, J.F.P.; Baidal, J.I. Smart sustainability: A new perspective in the sustainable tourism debate. Investig. Reg. 2018, 42, 151–170. [Google Scholar]
- Loureiro, S.M.C.; Guerreiro, J.; Ali, F. 20 years of research on virtual reality and augmented reality in tourism context: A text-mining approach. Tour. Manag. 2020, 77, 104028. [Google Scholar] [CrossRef]
- Farmaki, A.; Christou, P.; Saveriades, A. A Lefebvrian analysis of Airbnb space. Ann. Tour. Res. 2020, 80, 102806. [Google Scholar] [CrossRef]
- Lu, L.; Zhang, P.; Zhang, T.C. Leveraging “human-likeness” of robotic service at restaurants. Int. J. Hosp. Manag. 2021, 94, 102823. [Google Scholar] [CrossRef]
- Sigala, M. New technologies in tourism: From multi-disciplinary to anti-disciplinary advances and trajectories. Tour. Manag. Perspect. 2018, 25, 151–155. [Google Scholar] [CrossRef]
- Gandomi, A.; Haider, M. Beyond the hype: Big data concepts, methods, and analytics. Int. J. Inf. Manag. 2015, 35, 137–144. [Google Scholar] [CrossRef]
- Bi, Y.; Choi, S.; Yin, J.; Kim, I. Stress on Frontline Employees from Customer Aggression in the Restaurant Industry: The Moderating Effect of Empowerment. Sustainability 2021, 13, 1433. [Google Scholar] [CrossRef]
- Bouchon, F.; Rauscher, M. Cities and tourism, a love and hate story; towards a conceptual framework for urban overtourism management. Int. J. Tour. Cities 2019, 5, 598–619. [Google Scholar] [CrossRef]
- Alford, P.J.R. The lone digital tourism entrepreneur: Knowledge acquisition and collaborative transfer. Tour. Manag. 2020, 81, 104139. [Google Scholar] [CrossRef]
- Dredge, D.; Mahadevan, G.P.R. Digitalisation in Tourism; Aalborg University: Aalborg, Denmark, 2018; pp. 1–37. [Google Scholar]
- Wang, Y.; Wu, Y.; Zhu, J. The tourism climate evaluation of Hubei province. J. Cent. China Norm. Univ. Nat. Sci. 2009, 43, 176–180. [Google Scholar]
- Ministry of Construction of the People’s Republic of China. Outline of the National Urban System Plan (2005–2020); Ministry of Construction of the People’s Republic of China: Beijing, China, 2005; pp. 63–67. [Google Scholar]
- Zhao, C. Digital Development and Service-oriented Transformation: Empirical Evidence from Listed Manufacturing Companies. Nankai Bus. Rev. 2021, 24, 149–163. [Google Scholar]
- Wu, F.; Hu, H.; Lin, H.; Ren, X. Enterprise Digital Transformation and Capital Market Performance:Empirical Evidence from Stock Liquidity. J. Manag. World 2021, 37, 130–144. [Google Scholar]
- Yang, Z.; Zhao, H. Chinese Enterprises’ Open Innovation: Institutional Environment, Co-Opetition Relationship and Innovation Performance. Manag. World 2020, 2, 139–160. [Google Scholar]
- Tao, G.; Xue Jiao, R.; Yun Fei, H. The Impact of Institutional Environment on New Venture Performance: A Research Perspective of Business Model. Forecast 2017, 36, 16–22. [Google Scholar]
- Wen, Z.; Hou, J.; Zhang, L. A comparison of moderator and mediator and their applications. Acta Psychol. Sin. 2005, 2, 268–274. [Google Scholar]
- Barykin, S.E.; Iqbal, K.M.J.; Poza, E.D. Tourism Industry: Digital Transformation; IGI Global: Hershey, PA, USA, 2021; pp. 414–434. [Google Scholar]
- Mahakittikun, T.; Suntrayuth, S.; Bhatiasevi, V. The impact of technologicalorganizational-environmental (TOE) factors on firm performance: Merchants perspective of mobile payment from Thailand’s retail and service firms. J. Asia Bus. Stud. 2020, 15, 359–383. [Google Scholar] [CrossRef]
- Paniccia, P.M.A.; Leoni, L. Co-evolution in tourism: The case of Albergo Diffuso. Curr. Issues Tour. 2017, 22, 1216–1243. [Google Scholar] [CrossRef]
- Wang, K. Analysis of inter-provincial differences in the endowment of major tourism resources in China. Geogr. Territ. Res. 1999, 15, 69–74. [Google Scholar]
- Sun, G.; Feng, M. Inbound tourism market competitive State and the relationship with resources and location factor in the West of China. J. Northwest Univ. Nat. Sci. Ed. 2003, 33, 459–464. [Google Scholar]
- Bian, X. An analysis of inter-city differences and abundance of tourism resources in the Yangtze River Delta cities. Jiangsu Bus. News 2006, 109–112. [Google Scholar] [CrossRef]


Disclaimer/Publisher’s Note: The statements, opinions and data contained in all publications are solely those of the individual author(s) and contributor(s) and not of MDPI and/or the editor(s). MDPI and/or the editor(s) disclaim responsibility for any injury to people or property resulting from any ideas, methods, instructions or products referred to in the content. |
© 2022 by the authors. Licensee MDPI, Basel, Switzerland. This article is an open access article distributed under the terms and conditions of the Creative Commons Attribution (CC BY) license (https://creativecommons.org/licenses/by/4.0/).