Abstract
We explore the requirements for adapting coastal protection EU-wide indicators nationally. The aim of this research is threefold: (a) to map coastal protection at the national level; (b) to assess the congruence between the regional and national coastal protection estimates; and (c) to qualitatively assess the congruence of our findings with subnational estimates. We assessed coastal protection capacity, exposure, and demand and adapted them for the coastal zone of Greece. We quantitatively compared our findings with the results of the EU model. Through visual interpretation, we compared national estimates with those for the coastal zone of Peloponnese. Most islands have lower protection capacity than the mainland areas, while the southern part of the country’s coastal zone is the most exposed to natural hazards. Higher coastal protection demand was detected in the country’s largest cities (Athens, Thessaloniki). Areas of attention for management were small and medium islands and urban centres, as they mostly revealed high demand and exposure but the lowest natural capacity. The differences observed in the modelling outputs across scales are attributed to the differences in the demarcation process of the coastal zone, the additional variables considered, the terminology used, and the experts involved. Such national adaptations should be considered in order to build or update EU-wide indicators for coastal protection and beyond, towards a rule-based rather than a one-size-fits-all methodology.
1. Introduction
Coastal protection is the ecosystem service derived from coastal ecosystems’ regulatory capacity to protect coastal zone against inundation, erosion, waves, storms, and sea level rise or other hazards and disasters [1,2,3]. Though the coastal zone provides natural protection against erosion, floods, and other natural disasters [4] globally, the most common practice for protecting coastal areas relies on “hard” measures such as building seawalls or bulkheads [5,6]. Those grey infrastructure measures are highly effective in many cases but require a huge quantity of resources for construction and maintenance [7,8]. However, coastal ecosystems through nature-based solutions provide such protection at the minimum cost. For instance, a coastal zone consisting of salt marshes, mangroves, or dense vegetation generates resistance capacity against wave energy, currents, turbulent flows, and erosion in the bank and increases sediment deposition, which may promote accretion and formation of new lands [9,10].
To fulfill the societal demand for coastal protection and limit the degradation of the coastal zone, many global and regional policies such as ‘UK Marine and Coastal Access Act 2009 (MCAA)’, ‘EU Marine Strategy Framework Directive 2008 (MSFD)’, ‘US National Ocean Policy 2013’, ‘EU Recommendation on Integrated Coastal Zone Management 2002’, ‘IMO Convention on Ballast Water Management 2004’, ‘UN Convention on Biodiversity 1992’ have been adopted [11]. For many of these policies, reliable estimates of current and expected trends of ecosystem services supply and their associated values are required for more well-informed decision making [12,13]. Examples of such guidance would be information on where and how to protect, manage, and restore coastal ecosystems, where resources can be best allocated, or where conflicts might emerge and how these can be mitigated [13].
Still, although the number of research initiatives towards mapping marine and coastal ecosystem services across scales is increasing, many marine and coastal ecosystem services are yet to be mapped and explored [14]. Due to the multidimensionality of the marine and coastal environment [15], many ecosystem services cannot be quantified directly, and proxies are mostly used [14]. Other limitations for mapping could be a lack of spatial data and difficulties in the identification of service providing and benefiting areas [16].
Most of the assessment and mapping targets provisioning ES [14], and to a lesser extent regulatory ecosystem services (such as climate regulation) [17,18], but the attempts to map regulating ES are more limited. Within regulating ES, Liquete et al., (2013b) [19,20] assessed and mapped coastal protection as an ecosystem service for the entire European coastal zone and suggested reproducing and testing the proposed approach across different spatial scales. Other research works tried to explore the nonlinearity and spatial and temporal variability in coastal protection services [21] and tried to incorporate coastal protection directly into management practice [22]. Many coastal countries have taken attempts towards nature-based solutions for tackling coastal vulnerability (e.g., erosion, flooding) while addressing the ecosystem’s capacity for protection across scales [23]. In other cases, coastal protection was mostly explored from the demand perspective and its associated economic value [24,25].
Still, research in this direction keeps growing, and several research and practice applications are emerging. Sophisticated tools and models have been developed, such as Integrated Valuation of Ecosystem Services and Tradeoffs (InVEST), or Artificial Intelligence for Ecosystem Services (ARIES), to assess risks from flooding and erosion and to estimate coastal protection benefits from natural habitats [26]. There is an overflow of large-scale, global, or regional models and indicators that could facilitate monitoring of the spatial–temporal change within the social–ecological systems of the coastal zone [27]. There are global initiatives such as GEOBON and its recently proposed essential variables for ecosystem services, [28] and regional initiatives at the EU level that require systematic quantification, mapping, and monitoring of ecosystems and their services. Examples of these are the new EU Biodiversity Strategy for 2030, or the reporting for EU Directives such as the Marine Strategy Framework Directive and the Water Framework Directive, which highlight the need for the generation, use, and validation of these indicators. Using and adapting high-level proposed models and indicators to the national and local level takes a lot more than finding the “right” data. Understanding and accounting for the local specificities is key, whether these relate to unique ecosystem attributes, or to the varying sociopolitical contexts within which decisions, choices, and lifestyles shape land- and seascapes. Efforts of adapting global or regional indicators to local- and national-level conditions, in order to be conducted in a coherent and systematic way, in many cases require as much time in which to be completed as developing new models from scratch.
The aim of this research piece is therefore threefold: (i) to map coastal protection at the national level; (ii) to assess the congruence between the regional and national coastal protection estimates for the coastal zone of Greece; and (iii) to qualitatively assess the congruence of our findings with subnational estimates. The overarching questions are therefore: can a Europe-wide model be used to inform decision making at the national or local level, and with what level of certainty? What is the minimum level of “resolution” required to “trust” a model output? In other words, “how much is enough”?
2. Materials and Methods
2.1. Study Area
We assess coastal protection for the coastal zone of Greece, with the longest coastline among all the Mediterranean countries, stretching over 18,000 km in length. With more than 9800 islands and islets stretching over the Ionian and Aegean seas [29], these locations are extremely vulnerable to climatic conditions and core recipients of the impacts of climate change and sea level rise [30]. Twelve out of the 13 administrative regions of the country are coastal, 70% of which are rocky, and the rest comprise of sandy beaches, dunes, coastal wetlands, and lagoons [31]. Over the last several million years, geological processes have guided the development of Greece’s current geomorphologically complex coastal areas [28]. There are broadly 13 geomorphology types present on the Greek coast [32] of which “rocks and/or cliffs with small beaches” and “small beaches separated by rocky capes” are the most prominent, covering more than 8500 km (58%) of the coastline of Greece. Coastal Greece has very high biogeographical heterogeneity, with at least 30 marine habitat types [33], ranging from pelagic to benthic, which can be further subdivided into rocky substrates, soft substrate habitats, and seagrass meadows [32]. The soft substrate is composed of shallow muds and shallow sands, which are the two most prominent coastal habitat types in the Hellenic seas.
The softer part of the Greek coasts is experiencing gradual erosion, and it is estimated that 28.6% of the Greek coastline is prone to high erosion [31]. Apart from sea level rise or human interventions, local factors such as supply of sediments, geology, morphology, wave height and tidal regime, storm surge, wind speed, and frequency and intensity of extreme weather events play a major role in the coastal erosion rates of Greece [34,35]. The softer part of the Greek coasts, such as sand dunes or wetlands, are considered highly productive, providing habitats for numerous species of marine mammals [28]. More than 600 marine macrophyte species hotspots are present in the Hellenic seas [28]. Moreover, 60% of the total country’s forest area is located within the coastal zone [30].
Greece has a typical Mediterranean climate, with mean maximum temperatures ranging between 29 and 35 °C and mean minimum temperature ranging between 5 and 10 °C near the coast, and 0–5 °C over the mainland [35]. The mean seawater temperature lies between 18 and 20 °C [36]. Greece is one of the 18 most vulnerable areas of the planet due to climate change [30]. With the changing climatic conditions and increasing human pressure, many marine ecosystem types are being lost in Greece. Hoegh-Guldberg et al. (2014) [37] pointed out that the effects of climate change and global warming in the coastal areas of Greece are already being visible in terms of sea level rise, increase in the storm surge height, sea temperature rises, and acidification of seawater. Different climatic models have forecasted that between 2015 and 2039 Greece will experience a 2 to 3 °C rise in temperature and a 5–10% decrease in rainfall [30]. According to the IPCC A2 scenario report, the temperature of the Aegean Sea might increase up to 3 °C by 2100, and the sea level might rise by 0.5 m causing flooding to 15% of the coastal wetlands [38].
Around 33% of the Greek population lives within 1–2 km from the coast, and the average population density of the Greek coast is 87 people per square km [29]. If the population living within 45 min driving distance or 50 km is considered, then the coastal population will be 85% of the total population of Greece [31]. However, the major concentration of population is seen in the major cities of the coastal areas such as Athens or Thessaloniki [39]. Moreover, 90% of the tourism and recreational activities, 80% of the industrial activities, 35% of agricultural activities, and most of the fishing and aquaculture activities can be seen in those coastal zones [31]. Apart from this, other infrastructures such as harbors, airports, roads, electricity networks, and telecommunications, are also located near the coastal zone. The physical setting and changing climatic conditions make this densely populated and highly attractive tourist coastal zone vulnerable in terms of erosion, floods, or other natural disasters. This vulnerability in coastal protection is posing threats to human wellbeing as well as to the state of the environment.
2.2. Delineation of the Coastal Zone
There is no universal consensus about the demarcation of the coastal zone, due to the great variation in geomorphological structures and the climatic and socioeconomic conditions. An adaptable framing of what constitutes the coastal zone results in a great diversity of demarcations among countries, or even at different locations within a country. Defining the coastal zone also depends on the problem to be addressed, the objective of the study, or the scale of analysis [19]. For Greece, according to the coastal zone law 2971/2001, the coastal zone consists of a “seashore” and a “beach zone” where private construction is prohibited [40]. The seashore is defined as the land zone where the maximum winter waves run up, and the beach is the land zone that is adjacent to the seashore and extends up to 50 m from the seashore to the inland area [40]. The beach acts as a communication area between the mainland and the sea. However, it has been argued that hydrodynamic conditions and coastal protection have not been appropriately considered in this demarcation of the coastal zone. Overall, up to now there is no commonly agreed-upon delineation of the coastal zone in the country, and in most cases, this is defined on a case-by-case basis.
The coastal zone is shaped by both the hydrodynamic condition of the ocean and the socioeconomic structure of the adjacent area [41,42]. Hydrodynamic condition is usually influenced by the geomorphological and biological condition of the ocean [43]. Following the works of Liquete et al. (2013b) [19] and Guisado-Pintado et al. (2016) [3], and considering the socioeconomic and hydrodynamic condition of coastal areas of Greece, the coastal zone for this study was considered as the areas that fall under the 100 m depth isobath and 100 m height contour line. However, to be able to also account for the local specificities, a digital elevation model (DEM) [44] of Greece and the bathymetry of the Aegean, Ionian, and Mediterranean Seas were used to improve the coastal zone demarcation. A minimum of one nautical mile and a maximum of two nautical miles offshore distance was considered for delimiting the seaward boundary. To delineate the coastal zone’s landward boundary, a minimum of 1 km inland distance from the coastline was considered. The presence of islands and islets within the country led us to include another adaptation to the demarcation of the coastal zone. Therefore, a maximum 5 km inland distance from the coastline was considered for those landmasses that have an area of more than or equal to 20,000 km2 and a maximum of 3 km inland distance from the coastline was considered for those landmasses that have an area of more than or equal to 3000 km2 but less than 20,000 km2 (Figure 1). For the rest of the areas of Greece, a minimum of 1 km inland distance or 100 m height contour line and 1 nautical mile or 100 m depth isobath rule were followed (Figure 1). As throughout the coastal zone there is a large variation of hydrodynamic, oceanographic, and socioeconomic conditions, the entire coastal zone Is divided into individual calculation units (7358), to encompass the variation in the analysis process (Figure 1). These calculation units capture those variations to assess the protection capacity, exposure, and demand of a particular area based on the hydrodynamic, oceanographic, and socioeconomic condition of that area.
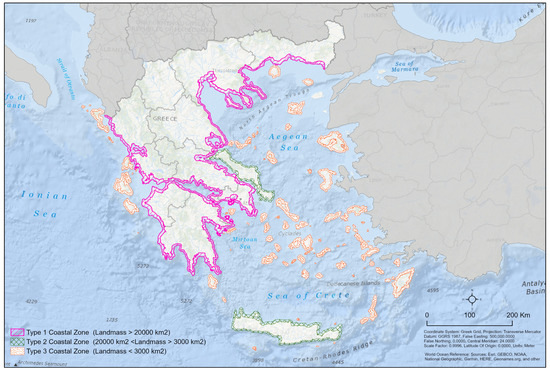
Figure 1.
Delineated coastal zone for the study.
2.3. Quantifying and Mapping Coastal Protection at the National Level
To map coastal protection for Greece, we adapted the coastal protection model proposed by [19,20] Liquete et al. Within their work, they modelled three indicators for coastal protection to capture the coastal zone’s capacity to protect, its exposure, and the societal demand for coastal protection. Based on the country’s attributes and scientific literature [3,14,19,45], a set of variables such as slope, geomorphology, submarine habitat, emerged habitat, and sediment accretion rate were chosen to assess coastal protection capacity. To assess the coastal protection exposure indicator, eight variables, namely sea-level rise, storm surge height, wave regime, tidal range, wind speed, ocean current (eastward and northward), and seawater potential temperature, were selected. Population density, settlement density, transportation network density, port area density, mineral extraction site density, cultural sites, and ecological site density were used to assess coastal protection demand for the Greek coastal zone. For those variables (Table 1), we calculated a set of indicators based on the models proposed by [19,20] Liquete et al. (2013).

Table 1.
Indicators and variables used in this study. ‘Wn’ in the equations refers to the weight of the associated variable that comes from expert opinion.
2.4. Expert Opinion
We assessed the relative contribution of these variables to the coastal protection indicators of the Greek coast through expert opinion. We developed a semistructured questionnaire, and experts were asked to weigh each variable according to their protection capacity, capacity to increase the exposure of the Greek coast, and capacity to generate demand for protection. We asked experts to provide weights separately to the subtypes of geomorphologies, emerged habitat, and seabed habitat. The assigned weights to the variables and subtypes of variables (when applicable) were given on a scale of 1 to 4, where “1 = very low capacity, 2 = low, 3 = moderate, 4 = high”. All raw data on the experts and the weights assigned are given in the supporting material of this manuscript (Supplementary Materials, Tables S1–S6). After receiving feedback from the experts, weight for each variable was converted to a scale of 1 using Equation (1).
where x is the weight that will be converted to a scale of 1, X is the sum of the weight of each variable from all experts, and Xi is the sum of all the summed weights of all the variables.
2.5. Model Construction
Constructing the indicators of ecosystem services for coastal protection of the Greek coast through capacity, exposure, and demand indicators requires a significant amount of data management to fill up the data gaps. To do so, we used focal statistics tools of ArcGIS software. The mean value of each variable was calculated for each calculation unit to obtain an average value for the entire calculation unit and make it comparable with other calculation units. Each calculation unit intersects with each variable; the mean value of each variable within the intersecting part of the calculation unit is calculated with the use of the “Zonal Statistics” tool of ArcGIS software. All values were normalized using the min–max equation to make the variables dimensionless, to be used for comparative analysis of coastal protection capacity, coastal protection exposure, and coastal protection demand indicators of the Greek coast (Supplementary Materials, Figure S1).
Equations (2)–(4) indicate the three indicators assessed.
CP_cap = W1_geo × geo + W2_slo × slo + W3_eh × eh + W4_sh × sh + W5_sar × sar
CP_exp = W1_slr × slr + W2_ssh × ssh + W3_wsh × wsh − W4_tide × tide + W5_wind × wind + W6_eoc × eoc + W7_noc × noc + W8_spt × spt
CP_dem = W1_popn × popn + W2_set × set + W3_trans × trans + W4_ports × ports + W5_mes × mes + W6_cul × cul + W7_eco × eco
2.6. EU-wide to National-Level Comparison of Coastal Protection Indicators
To compare the outcome of the regional-level model provided by Liquete et al. [19] with the outcome of the downscaled national-level model, we transformed the outcome of the regional-level model to the corresponding calculation unit of the national-level model by considering the intersected calculation unit of each model (Supplementary Materials, Figure S2). For the cases in which there was a mismatch of the calculation unit boundaries, due to the adaptation of the coastal zone at the national level, the average of those values of the regional-level model was calculated for that calculation unit of the national-level model. We then compared the outputs of the three indicators at the EU and national levels using root-mean-square error (RMSE) estimates (Equation (5)). RMSE shows the deviation that occurs from the regional-level model to the national-level model. We then identified the areas with high similarity and dissimilarity between the two spatial levels of the indicators and mapped the RMSE values for the sake of clarity and transparency (Equation (6)) (Supplementary Materials, Figure S2).
where = value from the regional-level model, = value from the national-level model. = number of cells considered to calculate the mean. = that specific calculation unit.
To interpret the differences between the two spatial levels of analysis, we also assessed the RMSE for each of the variables that contribute to the three indicators following the same methodology as for the indicators.
2.7. National- to Local-Level Comparison of Coastal Protection
To improve the understanding of the outcome of the nationally adapted model, we qualitatively compared the outcome of the coastal protection indicators to local estimates. We assessed the congruence between the national-level model outcomes with the outcomes of the work by Tragaki et al. (2018) [46], who assessed the physical and social vulnerability of the coastal zone at the coast of Peloponnese in Greece. Although the indicators calculated are not framed under the concept of ecosystem service indicators, they were selected, as both the variables used to inform the indicators and the methods used to calculate them bear many similarities. Since these indicators are different in terms of absolute values and structure, we assessed their similarities through visual interpretation of the outputs of our models and those of the outcome of the work of Tragaki et al. (2018) [46].
3. Results
3.1. Expert Opinion and Variable Weights
Expert opinion was collected from a total of seven experts by sending a semistructured survey by email. Experts were selected based on their domain knowledge and the years of experience on the topic of coastal protection after acquiring the highest degree that they possess. All the experts are quite familiar with the ecosystem services concept and have a substantial amount of work experience in coastal areas of Greece. Four out of the seven experts have marine ecology backgrounds, two have oceanography backgrounds, and one expert has a physical geography background. For six out of the seven experts, the highest level of education is a PhD in their respective field, and for one it is an MSc. Out of the seven experts, three experts have 10 to 15 years of experience, one expert has 15 to 20 years of experience, and the remaining three experts have more than 20 years of experience in conducting research in the marine and coastal environment domain. Each of them have contributed to more than 30 research articles, and five of them have more than 50 published research articles (based on literature search on databases such as Scopus and Google Scholar).
The significance and contribution of the selected variables in terms of coastal protection have been weighted using expert opinion. According to the provided weights by the experts for the variables of coastal protection, geomorphology and sediment accretion rate in the coast have the highest potentiality to protect the coast, followed by seabed habitat, slope, and emerged habitat of the Greek coast. Among the variables used to model coastal protection capacity, storm surge height has been recognized by the experts as the one with the highest potential to create vulnerability in the Greek coast, followed by wave height, sea-level rise, wind speed, tidal range, ocean current, and seawater temperature. Among the variables used for coastal protection demand, port area density had the highest priority from the experts in terms of demand analysis, followed by population and transport network density, settlement area, cultural sites, ecologically important site density, and mineral extraction site density.
3.2. Coastal Protection Capacity
By incorporating the variable weights for the coastal protection capacity indicator in Equation (3), the final equation was generated to calculate the coastal protection capacity indicator.
CP_cap = 0.218 × geo + 0.193 × slo + 0.160 × eh + 0.210 × sh + 0.218 × sar
Coastal protection capacity along the Greek coast shows a great variability, and no clear spatial patterns can be detected, most probably due to the high variability of data. Different areas of the coastal zone are influenced by different variables. Relatively high protection capacity is present in the southeastern coastal zone of Peloponnese, the southern coastal zone of Central Greece, the southeastern and northwestern coastal zone of Chalcis, the eastern coastal zone of Thessaly, and the southwestern coastal zone of Crete Island (Figure 2). High-to-medium coastal protection capacity is observed in the coastal zone of the Cyclades Islands, Ionian Islands, some parts of the coastal zone of Central Macedonia and Eastern Macedonia and Thrace, the northeastern coastal zone of Chalkis, the southern coastal zone of Attica, and the southeastern coastal zone of Crete Island. Medium-to-low coastal protection capacity is seen in the northern coastal zone of the Gulf of Patras, the northern and western coastal zone of Western Greece and Peloponnese and some of the southern coastal zone of Peloponnese, the northern coastal zone of Central Greece, both sides of the south Euboean Gulf, the southeastern coastal zone of Eastern Macedonia and Thrace, the northern coastal zone of Crete Island, the majority of the coastal zone of Rhodes and Lesvos Islands. Notably, small islands, especially the islands of Cyclades and Dodecanese, have a medium-to-high range of coastal protection capacity; a similar pattern is also observed in the Sporades and Ionian Islands. It is also notable that the landmasses within the Ionian Sea and Cretan Sea have lower protection capacity than those of the Aegean Sea. Moreover, due to the relatively large area selected as a calculation unit in the curved areas of the coastal zone, the continuity of the protection capacity pattern has been minimized, as seen in the western coastal zone of Western Greece and Peloponnese (Figure 2). It is also important to note that no drastic change in the spatial pattern is observed in those curved areas and this can be considered as the same category as their adjacent area with some difference in values.
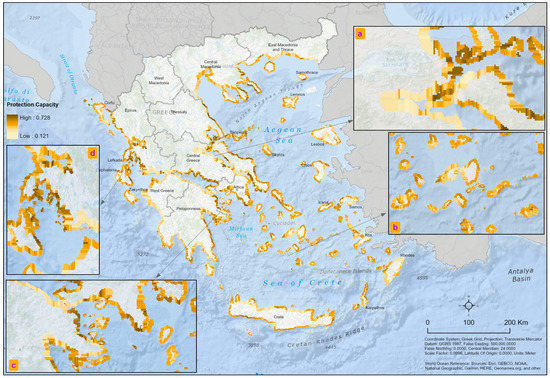
Figure 2.
Coastal protection capacity of the Greek coast. Inset maps are the zoomed view of coastal protection capacity value variation in the coastal areas of (a) Malian Gulf and north of Chalcis, (b) Cyclades islands, (c) south of Attica and southeastern Peloponnese, and (d) Ionian Islands area.
3.3. Coastal Protection Exposure
Similar to the coastal protection capacity indicator, the coastal protection exposure indicator was calculated as shown in Equation (8).
CP_(exp ) = 0.164 × slr + 0.179 × ssh + 0.172 × wsh − 0.127 × tide + 0.149 × wind + 0.075 × eoc + 0.075 × noc + 0.060 × spt
Unlike the coastal protection capacity indicator, the coastal exposure indicator has a continuous and distinct pattern. The coastal areas of small islands, such as the Cyclades Islands, Dodecanese Islands, Rhodes Island, the northern part of Crete Island, and Chios and Lesvos Islands, are highly exposed. On the other hand, the coastal zone located in the northern side of the Aegean Sea, especially the coastal areas of Thessaly, Central Macedonia and Eastern Macedonia and Thrace, the western part of the Pagasetic and north Euboean gulf, and both sides of the Gulf of Corinth and Gulf of Patras, have very low exposure values (Figure 3). Medium-to-low coastal exposure is seen in the coastal zone of the Ionian Islands, the western coastal zone of Western Greece and Peloponnese, the northwestern and southwestern coastal zone of Chalcis, the southern coastal zone of Attica, and the Sporades Islands. Medium-to-high coastal exposure is identifiable in the southern coastal zone of Crete Island, the southeastern coastal zone of Peloponnese and Attica, the southeastern and northeastern coastal zone of Chalcis, and Limnos Island. The enclosed areas, especially the gulf areas and the northern Aegean Sea areas, have low exposure, whereas open areas such as the Crete Sea, Mirtoan Sea, and Icarian Sea areas have higher exposure (Figure 3). On the other hand, there is no anomaly observed in the distribution of values within the large-sized calculation units that were generated for the curved coastal areas. This is not surprising, as all the variables of the coastal protection exposure indicator have continuous data, and no drastic change was seen in the pattern of values while calculating the mean value for each calculation unit.
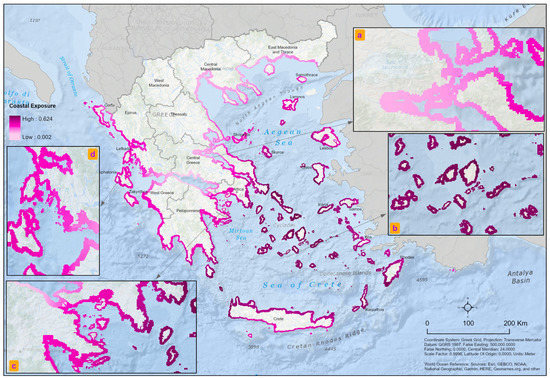
Figure 3.
Coastal protection exposure of the Greek coast. Inset maps are the zoomed view of coastal protection exposure value variation in the coastal areas of (a) Malian Gulf and north of Chalcis, (b) Cyclades Islands, (c) south of Attica and southeastern Peloponnese, and (d) Ionian Islands area.
3.4. Coastal Protection Demand
Coastal protection demand indicator was calculated using Equation 9 after incorporating the generated weights of each variable.
CP_dem = 0.155 × popn + 0.149 × set + 0.155 trans + 0.167 × ports + 0.077 × mes + 0.149 × cul + 0.149 × eco
The spatial pattern of the coastal protection demand indicator is completely different from the pattern of the coastal protection exposure indicator. Most of the areas of the Greek coast have no or very low protection demand due to the low density of either settlements, cultural sites, ecological sites, or mineral extraction sites. Moreover, even in the few locations where protection demand is quite high, this is pretty local, as the adjacent spaces to those areas in most cases show a very low protection demand. High demand for coastal protection is mostly present in the two largest cities of the countries, namely the capital city Athens and the second-largest city Thessaloniki (Figure 4). Medium-to-high coastal protection demand is observable in the northern and western coastal zones of Peloponnese and Western Greece, the southern coastal zone of Central Macedonia, near Pagasetic Gulf area, near Alexandroupolis city, and some areas in the northern part of Crete and Rhodes islands (Figure 4). The Cyclades Islands, Dodecanese Islands, Rhodes, Chios, Lesvos, Lemnos, Sporades, and Ionian Islands have medium-to-low—and most cases no—protection demand, which is also true for the southern part of Crete (Figure 4). Based on the outcomes, the core observation is that the model outputs are heavily driven by population and settlement density, which is expected.
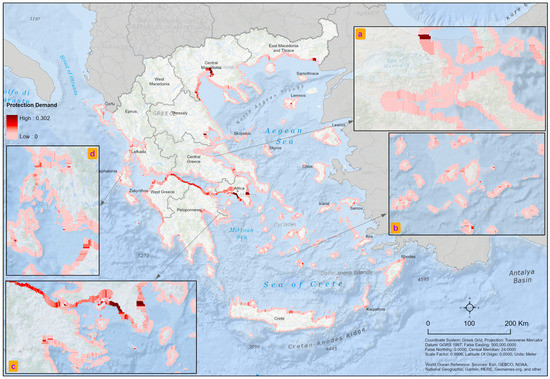
Figure 4.
Coastal protection demand of the Greek coast. Inset maps are the zoomed view of coastal protection demand value variation in the coastal areas of (a) Malian Gulf and north of Chalcis, (b) Cyclades Islands, (c) south of Attica and southwestern Peloponnese, and (d) Ionian Islands area.
3.5. Quantitative Comparison of the Outcome of the National- and Regional-Level Model
In the regional-level model, 12 variables were used to assess 3 indicators of coastal protection, whereas in the national-level model, a more detailed assessment was conducted using 20 variables for those 3 indicators, taking into account the national-level specificities of the coastal zone. In the national-level model, added variables were sediment accretion rate for the coastal protection capacity indicator; wind speed, eastward and northward ocean current, and seawater temperature for the coastal protection exposure indicator; and port area and ecologically important site and mineral extraction site density for the coastal protection demand indicator. Moreover, variables were also assigned with different weights based on expert opinion in these two models, which indicate the difference in significance of variables in coastal protection.
In both models, there are some coastal areas in which we detect similar coastal protection capacity patterns, and some areas also depict high discrepancies in terms of coastal protection. We observed high similarity in coastal protection capacity in the southeastern coastal zone of central Macedonia, especially near Thessaloniki city (Figure 5). The high discrepancy with high RMSE value can be seen near the Gulf of Patras, the northern coastal zone of Western Greece, the southern and southeastern coastal zone of Peloponnese, some northern and southern coastal areas of Crete Island, the eastern coastal zone of Rhodes, Samos, and Ikaria Islands, most of the areas of Lesvos Island, and near Mount Athos (Figure 5). Medium discrepancy or medium similarities in coastal protection can be observed in the coastal areas of Attica, south of Chalcis, the Cyclades Islands, the southern coastal zone of Eastern Macedonia and Thrace, and in the Ionian Islands region (Figure 5).
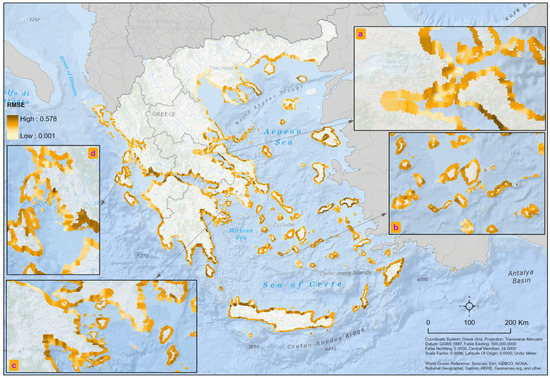
Figure 5.
This map indicates the values of the root-mean-square error (RMSE) of coastal protection capacity indicator, which is generated from the comparison between the outputs of the nationally adapted model and the EU-wide model by Liquete et al. [19,20]. Inset maps are the zoomed view of RMSE value variation in the coastal areas of (a) Malian Gulf and north of Chalcis, (b) Cyclades Islands, (c) south of Attica, and (d) Ionian Islands area.
In the case of the coastal protection exposure indicator, a high discrepancy with high RMSE value is seen in the Gulf areas, especially in the Ambracian Gulf, Gulf of Patras, both sides of the Gulf of Corinth, near Maliakos and the Pagasetic Gulf, and the southern part of Central Macedonia and Eastern Macedonia and Thrace (Figure 6). Some islands such as Samos, islands situated in the south of Attica, and the southern coastal zone of Rhodes also have a high level of discrepancy in both models (Figure 6). High similarity with low RMSE value in coastal exposure can be seen in the northern coastal zone of Crete Island, Cyclades, the northern coastal zone of Chalcis, and several of the Ionian Islands (Figure 6). A medium similarity or discrepancy is found in the southern coastal zone of Crete Island, the southern and western coastal zone of Peloponnese, the western and northern coastal zone of Western Greece, and the eastern coastal zone of Thessaly (Figure 6).
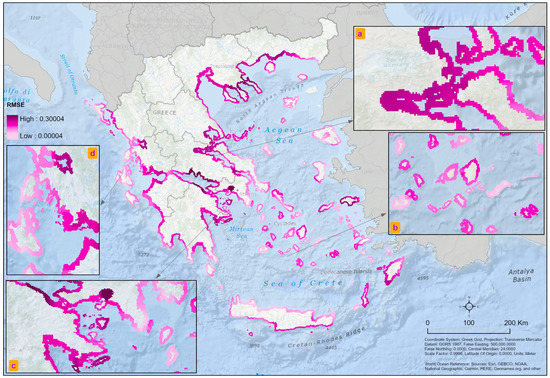
Figure 6.
This map indicates the values of the root-mean-square error (RMSE) of coastal protection exposure indicator, which is generated from the comparison between the outputs of the nationally adapted model with the EU-wide model by Liquete et al. [19,20]. Inset maps are the zoomed view of RMSE value variation in the coastal areas of (a) Malian Gulf and north of Chalcis, (b) Cyclades islands, (c) south of Attica, and (d) Ionian Islands area.
Both models showed high similarity in coastal protection demand throughout the Greek coast (Figure 7). Some dissimilarities can be identified in the southern coastal zone of Attica and Central Greece, the northern coastal zone of Rhodes, and the eastern coastal zone of Samos (Figure 7). This discrepancy occurred due to the difference in the extent of the calculation units in both models. In the regional-level model, the size of the calculation units was larger than the national-level model, which showed a high demand over a large area, whereas that demand is for a smaller area, which is more accurately represented in the national-level model. (Figure 7).
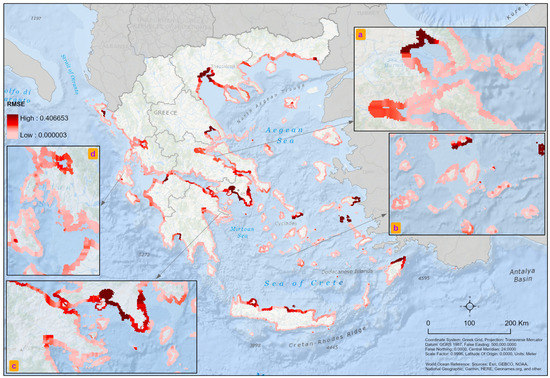
Figure 7.
This map indicates the values of the root-mean-square error (RMSE) of coastal protection demand indicator, which is generated from the comparison between the outputs of the nationally adapted model and the EU-wide model by Liquete et al. [19,20]. Inset maps are the zoomed view of RMSE value variation in the coastal areas of (a) Malian Gulf and north of Chalcis, (b) Cyclades islands, (c) south of Attica, and (d) Ionian Islands area.
3.6. Qualitative Comparison of the Outcome of the Local- and National-Level Model
In order to assess the degree of congruence of our adapted model, we compared the national-level findings of the three indicators with the work of [46] Tragaki et al. (2018), targeting the coast of Peloponnese, Greece. Based on the discrepancies we observed between the European and national-level indicators, we estimated whether our findings are congruent to local study findings. Tragaki et al. (2018) [46] framed coastal protection in terms of vulnerability, using a set of two indicators: the coastal vulnerability index (CVI) and the social vulnerability index (SVI). It is noteworthy to mention that CVI and SVI were the main inspiration sources for the coastal protection indicators that are used in this analysis and that were developed by Liquete et al. [19,20]. Hence, despite the different conceptualization and terminology used to define these indicators, the variables they used to construct CVI were shared to a large extent with the variables used for coastal protection capacity and exposure in our study. For instance, according to the experts interviewed for our adapted model, a high weighted geomorphology value has been seen in the southeastern part of the Peloponnese, as this area is either dominated by ‘rock/hard cliffs’ or ‘rock/hard cliffs (few erosion)’ geomorphology types. Our interviewed experts also identified that this type of geomorphology has a higher protection capacity, which is also evident in the work of Tragaki et al. (2018) [46], who identified that the southern part of Peloponnese is comprised of rock or cliffs, which causes lower vulnerability of that area. Contrarily, the northwestern part of the Peloponnese has a relatively low weighted value of geomorphology, as the main geomorphology types of these areas are ‘developed beaches’ or ‘soft strands’, which have been identified with relatively low protection capacity by the experts interviewed in our work. According to Tragaki et al., (2018) [46], these areas of the Peloponnese are more vulnerable in terms of coastal erosion. Moreover, the findings related to significant wave height by Tragaki et al. (2018) [46] match with the findings of this research work, where relatively low significant wave height was identified in the northern coastal zone of Peloponnese, which caused low vulnerability or exposure of that area in both studies.
Overall, relatively high protection capacity is present in the coastal areas of southeastern Peloponnese due to the combination of high weighted values of geomorphology, emerged habitat variables, and high mean values of slope variables. Tragaki et al. (2018) [46] in their study also found that the southeastern Peloponnese is less vulnerable due to the influence of geomorphology and slope variables. The northern and western parts of the Peloponnese have low-to-medium protection capacity due to the low values of the slope, geomorphology, and seabed habitat variables, which is also evident in Tragaki et al. (2018) [46].
In terms of coastal protection exposure, higher exposure in Peloponnese is seen in this work in the eastern and southern parts. Tragaki et al. (2018) [46] detected similar patterns, as the northeastern part of the Peloponnese has a higher SVI. The outcomes and variables used with SVI in the local case study shared similarities with the coastal protection demand indicator. High demand in Peloponnese was observed in the northern part of it, whereas this zone was identified with a low SVI value, which also indicates less vulnerable areas. Overall, our findings for the coastal protection exposure index are in general agreement with locally calculated CVI, and our findings on coastal protection demand are in accordance with the SVI index in Tragaki et al. (2018) [46].
4. Discussion
4.1. Modelling Coastal Protection in the Greek Coastal Zone
Across the Greek coastal zone, we assessed and mapped coastal protection using three complementary indicators of capacity, exposure, and demand. Interpreting these indicators individually reveals information on the variability of the data that populate them. For instance, the rate of sediment flow in the Greek coast is relatively low [47,48]; hence, areas such as the eastern part of Thessaly scored a higher protection capacity due to a higher sediment accretion rate compared to coastal areas in the rest of the country. Higher coastal exposure was observed in island spaces, such as the northern part of Crete, Cyclades, Karpathos, Rhodes, Samos, Ikaria, and Chios, indicating that these spaces are more vulnerable than inland areas due to high exposure to wind speed, significant wave height, and sea level height. This is not surprising, as small islands such as those mentioned above, with a total area from 255 to 1500 km2, are the ones more exposed and vulnerable to change [48]. Such islands are more prone to face the consequences of environmental and social change with a limited capacity, compared to the mainland, to cope with change [49,50,51]. This limited capacity makes them also more prone to emerging crises, from financial to resource crises related to food, water, or energy [49,50].
Most of the Greek coast was observed to have very low protection demand, which is also evident from the regional-level study by Liquete et al. (2013b) [19,20], as most of the coastal zone areas have very low population density. Higher demand was mainly observed in the coastal city areas, near the three major cities of the country—Athens, Thessaloniki, and Patras—where population and settlement density are relatively higher [52]. The stronger demand in these areas indicates a higher weight to the variable of population density, which indicates the level of social vulnerability [47]. These weights were of course assigned, due to the input of the group of experts who contributed to this study, which introduces a certain bias [53]. Another source of uncertainty in these findings comes from the fact that population density is estimated on an annual basis, considering only permanent residents of the areas. That could be misleading in the cases of most coastal areas, especially islands, with highly volatile population density, peaking during the summer months, due to tourism. Despite several available assessments on the topic at the local level (e.g., [54]), a lack of precise and homogeneous data on this matter, nationally, did not allow us to take information on seasonality into account. However, for future research, this would be a necessary step towards producing results, which consider interannual variability.
Looking at the three indicators synergistically, areas that require special attention in terms of management and action for decision making are revealed. In particular, areas with high demand for and high exposure to coastal vulnerability, such as the region of Attica (where Athens, the country’s capital is located), but with low protection capacity, might require extra attention for management. Such social–ecological systems are known to be vulnerable to change [48], and they bear a high risk to changes in the coastal zone, both in biophysical and social terms. However, our results showed that these areas have a relatively low resilience capacity (low-to-medium values for the capacity indicator), a fact indicating that planning measures need to take place to minimize the risk to the natural environment and to the society benefiting from it [55]. Such spaces could be highlighted as priority spaces also for spatial planning across the coastal zone, and or the design of nature-based solutions that are able to enhance coastal zone resilience [56] compared to artificial constructions such as seawalls [57].
4.2. Adapting EU-wide Models to National Specificities
Our findings allowed us to explore the capacity of regional (in our case EU-wide) models on ecosystem services to reveal accurate information on national- and local-level assessments. Large-scale ecosystem service models are widely used to produce assessments in a systematic and transparent way that allows for a shared understanding across regions, countries, and systems. The notion of having unified approaches in order to account for, assess, and map ecosystem services and nature’s contributions to people is becoming more and more prominent, in order to ensure that among countries, there are shared and transparent metrics and an understanding of the issues at stake and current state of human–nature interactions. Within the EU, the EU Biodiversity Strategy for 2030, as well as EU environmental directives and sectoral policies, have been promoting a systematic recording, assessment, modelling, quantification, and mapping of ecosystems and their services across EU Member States. At the global level, mainly in support of the post-2020 Global Biodiversity Framework, the call for interoperable and unified approaches has been expressed through the proposal of sets of harmonized variables and indicators, such as the Essential Ecosystem Service Variables [58] proposed by the GEOBON community. There is an expressed need for measures, models, and indicators shared across disciplines, research expertise, and countries that can provide a systematic approach towards assessing and monitoring ecosystem services.
Within this research, we explored the extent to which such supranational approaches are in fact informative at subregional levels, namely at the national and local levels. We assessed whether a model built on a large scale can be useful for identifying areas at stake at the national and local levels. Can EU-wide approaches inform nationwide decision makers? If yes, how should they be adapted and downscaled? To enhance our understanding, we adapted the existing model of coastal protection—developed to be used at the EU level [19,20]—to the national level, using Greece as a case study. The high variability of the coastal zone attributes within the country makes it ideal for such assessments, as within the country there is a great heterogeneity of geological, biophysical, and social structures. The quantitative comparison of model findings between the EU and the national model indicated that for all three indicators, there were areas of disagreement between the two levels of analysis. These areas were located near the densely populated parts of the country, revealing that complex urban–coastal dynamics [59,60] are inherent within the data used to populate these models. This in turn indicates that these dynamics need to be taken into account when such coastal protection models are to be used to inform decision making. Other areas of disagreement between the two models were those with complex coastlines, mostly island spaces, fact revealing that large-scale model assessments might be unable to reveal fine complexities inherent in the delimitation of the coastal zone of small and medium island spaces. The definition of the coastal zone, as conducted in the nationally adapted model, combined with the addition of nationally relevant variables within the indicators, accounted for these complexities, a fact also confirmed by the comparison of the national model findings with coastal vulnerability estimates of the local-level case study. Indeed, the adapted national model when qualitatively compared with the local case study showed an overall similar geographical pattern. Taking the above into account, we argue that EU-wide models are able to reveal generic patterns of indicators related to coastal protection, yet they bear limitations when it comes to local-level specificities. Hence, the used EU-wide model requires further adaptation in spatially heterogeneous and complex spaces such as the diverse coastlines of small and medium islands or coastal urban centres.
Overall, through the model adaptation process, we identified a set of core challenges that need to be taken into account, further explored when model structures are re-used and adapted, and identified some emerging opportunities for further clarification and research.
In particular, the core challenges and opportunities are summarized as follows:
- Delineation of the coastal zone: This was one of the core challenges of the adaptation process, as for the coastal zone, the definition used at the EU level was not applicable for the national model. For countries such as Greece, with a large complexity in the structure of its coastline, a large variation of the geophysical and biotic components of its coastal zone, and a large number of smaller land masses (i.e., islands), it is pretty challenging to adopt a generic approach. In our case, we developed a rule-based system, in which the coastal zone was delineated differently depending on the landmass extent. Although this requires some additional computational effort, our study shows that such specific approaches are able to indicate sensitivities and vulnerabilities in spaces, which would not be visible with a unified approach.
- Selected variables for the description of indicators: We identified some discrepancies between the EU and the national model in terms of variables used. In fact, at the national level, there were more variables taken into account, and their inclusion has also led to different results in terms of identifying the areas with higher or lower exposure or demand for coastal protection. On the contrary, there was quite some agreement in terms of the variables taken into account between the national- and local-level models, which despite having a different framing, indicated similar areas that are more exposed or more at risk in terms of coastal protection capacity. Through this comparison, we identified the well-known challenge of choosing what we have data for versus what really matters at the local and national levels. Our suggestion is that EU-wide models go through as many national-level adaptations as possible in order to help the EU Member States to identify which additional variables they should be using to inform nationwide models.
- Framing and terminology: Our nationwide model used the terminology and framing of the EU-wide approach. However, when comparing with the local case study, and while also taking into account similar pieces of literature in the country aimed at assessing coastal protection, we detected a large conceptual discrepancy. Within the ES framing used in this work, we refer to and use coastal protection indicators. However, traditionally in Greece, the research assesses coastal protection, framed under the concepts of vulnerability to natural or human-induced threats. This discrepancy could be interpreted in terms of research “tradition”, which is embedded in the research community, but also the community of decision makers who are using this information and the trust they might have in terms related to ES indicators. Our interaction with experts revealed once more the major challenge of introducing new concepts and new terminology within the decision-making community in order to convince them to use the “new” indicator concepts presented here.
- Expert knowledge: Within the used model, the role of experts who are knowledgeable to the area and the coastal protection functions of nature was very significant as it really defined the weights, and therefore the importance, that the different variables have within the studied country. However, bias was observed when it came to the comparison of the weights of the variables, and in some cases, differences in weight contributed to changes in the result of indicators; for instance, sediment accretion obtained the highest weights, along with geomorphology types in this study, whereas in the EU model, sediment accretion rate was not considered, which created variations in the coastal protection capacity in the eastern part of Thessaly. On the other hand, in the EU-level model, the number of variables was smaller compared to the national-level one, and the higher number of variables considered might have induced a higher fragmentation in weights (summation of the weights of variables under each indicator is 1), generating more detailed outputs at the national level compared to the EU-wide model.
5. Conclusions
Within this research, we adapted an EU-wide model of coastal protection to the national level, by adapting the variables that inform the model as well as the delimitation of the coastal zone. Coastal protection is a complex process, described here through three core indicators: capacity, exposure, and demand. These indicators, when looked at synergistically, can help identify points of management attention at the national level, in cases, for instance, where high exposure and high demand for coastal protection coexist with a low protection capacity, therefore indicating areas of potential risk under change.
EU-wide models can identify these points of attention for areas with relatively homogeneous coastlines and coastal zones. Still, due to the needs for generalization at large scales (i.e., the EU), these models cannot capture spatial complexities of spaces such as small and medium islands. In addition, the complex social–ecological dynamics of coastal cities are difficult to capture and generate mismatches between the EU-wide and national model outputs.
To conclude, EU-wide models could reveal generic patterns of coastal protection across the different countries. However, national-level adaptations need to be happening systematically by adapting the four modelling aspects that we identified: (i) the coastal zone delineation; (ii) the variables included in the analysis; (iii) the terminology used; and (iv) the experts included in generating the data. Similar attempts to validate such EU-wide models, in countries with different geomorphological, biophysical, and social attributes, could reveal additional model aspects that need further adaptations within such models.
We argue that such nationwide adaptations should be considered in order to build or update EU-wide indicators for coastal protection and also beyond, towards a rule-based rather than a one-size-fits-all methodology.
Supplementary Materials
The following supporting information can be downloaded at: https://www.mdpi.com/article/10.3390/su15010260/s1, Figure S1: Workflow to assess coastal protection capacity, exposure, demand, service flow and benefit of the coastal areas of Greece; Figure S2: Workflow to compare the regional and national level model; Figure S3: Expert’s profile: (a) academic background of the experts, (b) level of education of the experts, (c) work experience of the experts, (d) total number of publications by the experts; Table S1: Weights of the variables of coastal protection capacity indicator given by the experts; Table S2: Weights of the variables of coastal protection exposure indicator given by the experts; Table S3: Weights of the variables of coastal protection demand indicator given by the experts; Table S4: Weights of the subtypes of seabed habitat variable given by the experts; Table S5: Weights of the subtypes of geomorphology variable given by the experts; Table S6: Weights of the subtypes of emerged habitat variable given by the experts.
Author Contributions
Conceptualization, M.U.H. and E.G.D.; methodology, M.U.H., E.G.D. and C.L.; formal analysis, M.U.H.; data curation, M.U.H., E.G.D. and C.L.; writing—original draft preparation, M.U.H. and E.G.D.; writing—review and editing, M.U.H., E.G.D., E.K., A.T. and C.G.; visualization, M.U.H.; supervision, E.G.D. All authors have read and agreed to the published version of the manuscript.
Funding
This research is the outcome of the MSc thesis under the MSc programme of Geoinformation Science and Earth Observation under faculty ITC, University of Twente, and this MSc degree is supported by the OKP scholarship programme. M.U.H. is grateful to the authority for supporting the successful accomplishment of his master’s program.
Informed Consent Statement
Not applicable.
Data Availability Statement
Data is available upon request to the authors.
Acknowledgments
The authors would like to thank the anonymous reviewers for their input in shaping the manuscript.
Conflicts of Interest
The authors declare no conflict of interest.
References
- MEA. Millennium Ecosystem Assessment: Ecosystems and Human Well-Being, Synthesis. 2005. Available online: https://www.millenniumassessment.org/en/Reports.html (accessed on 14 November 2022).
- TEEB. The Economics of Ecosystems and Biodiversity: Ecological and Economic Foundations . Kumar, P., Ed.; 2010. Available online: https://books.google.com/books?hl=en&lr=&id=Py-IvHIcbDYC&oi=fnd&pg=PR9&dq=The+Economics+of+Ecosystems+and+Biodiversity:+ecological+and+economic+foundation&ots=M9bQkO3OlD&sig=yUTEchkUtAAndH3_lVjnTEDdmMs (accessed on 14 November 2022).
- Guisado-Pintado, E.; Navas, F.; Malvárez, G. Ecosystem Services and Their Benefits as Coastal Protection in Highly Urbanised Environments. J. Coast. Res. 2016, 75, 1097–1101. [Google Scholar] [CrossRef]
- Spalding, M.D.; Ruffo, S.; Lacambra, C.; Meliane, I.; Hale, L.Z.; Shepard, C.C.; Beck, M.W. The role of ecosystems in coastal protection: Adapting to climate change and coastal hazards. Ocean Coast. Manag. 2014, 90, 50–57. [Google Scholar] [CrossRef]
- Rosenzweig, C.; Solecki, W.D.; Blake, R.; Bowman, M.; Faris, C.; Gornitz, V.; Horton, R.; Jacob, K.; LeBlanc, A.; Leichenko, R.; et al. Developing coastal adaptation to climate change in the New York City infrastructure-shed: Process, approach, tools, and strategies. Clim. Chang. 2011, 106, 93–127. [Google Scholar] [CrossRef]
- Sterr, H. Assessment of Vulnerability and Adaptation to Sea-Level Rise for the Coastal Zone of Germany. J. Coast. Res. 2008, 242, 380–393. [Google Scholar] [CrossRef]
- Anthony, E.J.; Gratiot, N. Coastal engineering and large-scale mangrove destruction in Guyana, South America: Averting an environmental catastrophe in the making. Ecol. Eng. 2012, 47, 268–273. [Google Scholar] [CrossRef]
- Bosello, F.; Nicholls, R.; Richards, J.; Roson, R.; Tol, R. Economic impacts of climate change in Europe: Sea-level rise. Clim. Chang. 2012, 112, 63–81. [Google Scholar] [CrossRef]
- Gedan, K.B.; Kirwan, M.L.; Wolanski, E.; Barbier, E.B.; Silliman, B. The present and future role of coastal wetland vegetation in protecting shorelines: Answering recent challenges to the paradigm. Clim. Chang. 2011, 106, 7–29. [Google Scholar] [CrossRef]
- Shepard, C.C.; Crain, C.M.; Beck, M. The Protective Role of Coastal Marshes: A Systematic Review and Meta-analysis. PLoS ONE 2011, 6, e27374. [Google Scholar] [CrossRef]
- Börger, T.; Beaumont, N.J.; Pendleton, L.; Boyle, K.J.; Cooper, P.; Fletcher, S.; Haab, T.; Hanemann, M.; Hooper, T.L.; Hussain, S.S.; et al. Incorporating ecosystem services in marine planning: The role of valuation. Mar. Policy 2014, 46, 161–170. [Google Scholar] [CrossRef]
- Stępniewska, M. Ecosystem Service Mapping and Assessment as a Support for Policy and Decision Making. Clean–Soil Air Water 2016, 44, 1414–1422. [Google Scholar] [CrossRef]
- Maes, J.; Egoh, B.; Willemen, L.; Liquete, C.; Vihervaara, P.; Schägner, J.P.; Grizzetti, B.; Drakou, E.G.; La Notte, A.; Zulian, G.; et al. Mapping ecosystem services for policy support and decision making in the European Union. Ecosyst. Serv. 2012, 1, 31–39. [Google Scholar] [CrossRef]
- Liquete, C.; Piroddi, C.; Drakou, E.; Gurney, L.; Katsanevakis, S.; Charef, A.; Egoh, B. Current Status and Future Prospects for the Assessment of Marine and Coastal Ecosystem Services: A Systematic Review. PLoS ONE 2013, 8, e67737. [Google Scholar] [CrossRef] [PubMed]
- Drakou, E.G.; Liquete, C.; Beaumont, N.; Boon, A.; Viitasalo, M.; Agostini, V. Mapping marine and coastal ecosystem services. In Mapping Ecosystem Services; Burkhard, B., Maes, J., Eds.; Pensoft Publishers: Sofia, Bulgaria, 2017; pp. 250–255. [Google Scholar]
- Townsend, M.; Davies, K.; Hanley, N.; Hewitt, J.E.; Lundquist, C.J.; Lohrer, A.M. The Challenge of Implementing the Marine Ecosystem Service Concept. Front. Mar. Sci. 2018, 5, 359. [Google Scholar] [CrossRef]
- Donato, D.C.; Kauffman, J.B.; Murdiyarso, D.; Kurnianto, S.; Stidham, M.; Kanninen, M. Mangroves among the most carbon-rich forests in the tropics. Nat. Geosci. 2011, 4, 293–297. [Google Scholar] [CrossRef]
- Lal, R. Sequestration of atmospheric CO2 in global carbon pools. Energy Environ. Sci. 2008, 1, 86–100. [Google Scholar] [CrossRef]
- Liquete, C.; Zulian, G.; Delgado, I.; Stips, A.; Maes, J. Assessment of coastal protection as an ecosystem service in Europe. Ecol. Indic. 2013, 30, 205–217. [Google Scholar] [CrossRef]
- Liquete, C.; Piroddi, C.; Macías, D.; Druon, J.-N.; Zulian, G. Ecosystem services sustainability in the Mediterranean Sea: Assessment of status and trends using multiple modelling approaches. Sci. Rep. 2016, 6, 34162. [Google Scholar] [CrossRef]
- Koch, E.W.; Barbier, E.B.; Silliman, B.R.; Reed, D.J.; Perillo, G.M.; Hacker, S.D.; Granek, E.F.; Primavera, J.H.; Muthiga, N.; Polasky, S.; et al. Non-linearity in ecosystem services: Temporal and spatial variability in coastal protection. Front. Ecol. Environ. 2009, 7, 29–37. [Google Scholar] [CrossRef]
- Barbier, E.B.; Koch, E.W.; Silliman, B.R.; Hacker, S.D.; Wolanski, E.; Primavera, J.; Granek, E.F.; Polasky, S.; Aswani, S.; Cramer, L.A.; et al. Coastal Ecosystem-Based Management with Nonlinear Ecological Functions and Values. Science 2008, 319, 321–323. [Google Scholar] [CrossRef]
- EEA. The Changing Faces of Europe’s Coastal Areas. In Publications of the European Communities (Volume 6). 2006. Available online: https://www.eea.europa.eu/publications/eea_report_2006_6/at_download/file (accessed on 14 November 2022).
- Pascal, N.; Allenbach, M.; Brathwaite, A.; Burke, L.; Le Port, G.; Clua, E. Economic valuation of coral reef ecosystem service of coastal protection: A pragmatic approach. Ecosyst. Serv. 2016, 21, 72–80. [Google Scholar] [CrossRef]
- Alves, F.L.; Pinto, P.; Batista, P.; Alves, F.; Roebeling, P.; Pinto, P.; Batista, P. Valuing Ecosystem Service Losses from Coastal Erosion Using a Benefits Transfer Approach: A Case Study for the Central Portuguese Coast. J. Coast. Res. 2009, 56, 1169–1173. [Google Scholar]
- Kroeker, K.J.; Reguero, B.G.; Rittelmeyer, P.; Beckd, M.W. Ecosystem Service and Coastal Engineering Tools for Coastal Protection and Risk Reduction. In Managing Coasts with Natural Solutions; Wealth Accounting and the Valuation of Ecosystem Services Partnership(WAVES); World Bank: Washington, DC, USA, 2016; p. 75. [Google Scholar]
- Martínez-López, J.; Bagstad, K.J.; Balbi, S.; Magrach, A.; Voigt, B.; Athanasiadis, I.; Pascual, M.; Willcock, S.; Villa, F. Towards globally customizable ecosystem service models. Sci. Total. Environ. 2019, 650, 2325–2336. [Google Scholar] [CrossRef] [PubMed]
- Balvanera, P.; Quijas, S.; Karp, D.S.; Ash, N.; Bennett, E.M.; Boumans, R.; Brown, C.; Chan, K.; Chaplin-Kramer, R.; Halpern, B.S.; et al. Ecosystem services. In The GEO Handbook on Biodiversity Observation Networks; Walters, M., Scholes, R.J., Eds.; Springer Open: Cham, Switzerland, 2016; pp. 39–78. [Google Scholar]
- Simboura, N.; Maragou, P.; Paximadis, G.; Kapiris, K.; Papadopoulos, V.P.; Sakellariou, D.; Pavlidou, A.; Hatzianestis, I.; Salomidi, M.; Arvanitidis, C.; et al. Chapter 9—Greece. In World Seas: An Environmental Evaluation, 2nd ed.; Sheppard, C., Ed.; Academic Press: Cambridge, MA, USA, 2019; pp. 227–260. [Google Scholar]
- Demertzis, K.; Iliadis, L. The impact of climate change on biodiversity: The ecological consequences of invasive species in Greece. In Handbook of Climate Change Communication: Vol. 1: Theory of Climate Change Communication; Filho, W.L., Manolas, E., Azul, A.M., Azeiteiro, U.M., McGhie, H., Eds.; Springer Nature: Cham, Switzerland, 2018; pp. 15–38. [Google Scholar]
- Mourmouris, A.; Kasidi, E.; Vourvahis, M.; Grigoriou, E.; Kanellopoulou, K. Report of Greece on Coastal Zone Management; Ministry of the Environment, Physical Planning and Public Works: Athens, Greece, 2006.
- DG ENV. Geomorphology, Geology, Erosion Trends and Coastal Defence works. From Directorate-General for Environment website. 2016. Available online: https://www.eea.europa.eu/data-and-maps/data/geomorphology-geology-erosion-trends-and-coastal-defence-works (accessed on 28 March 2021).
- Davies, C.E.; Moss, D.; Hill, M.O. Eunis Habitat Classification Revised; European Environment Agency, European Topic Centre on Nature Protection and Biodiversity: Copenhagen, Denmark, 2004. [Google Scholar]
- Xeidakis, G.S.; Delimani, P. Coastal Erosion Problems in Northern Aegean Coastline, Greece. The Case of the Rhodope Prefecture coasts. In WIT Transactions on Ecology and the Environment; WIT Press: Southampton, UK, 2002; Volume 58. [Google Scholar]
- Giannakopoulos, C.; Kostopoulou, E.; Varotsos, K.V.; Tziotziou, K.; Plitharas, A. An integrated assessment of climate change impacts for Greece in the near future. Reg. Environ. Chang. 2011, 11, 829–843. [Google Scholar] [CrossRef]
- Velaoras, D.; Kassis, D.; Perivoliotis, L.; Pagonis, P.; Hondronasios, A.; Nittis, K. Temperature and salinity variability in the Greek Seas based on POSEIDON stations time series: Preliminary results. Mediterr. Mar. Sci. 2013, 14, 5–18. [Google Scholar] [CrossRef]
- Hoegh-Guldberg, O.; Cai, R.; Poloczanska, E.S.; Brewer, P.G.; Sundby, S.; Hilmi, K.; Fabry, V.J.; Jung, S.; Skirving, W.; Stone, D.A. The Ocean; Cambridge University Press: Cambridge, UK, 2014. [Google Scholar]
- IPCC. Climate Change 2007: Synthesis Report. Contribution of Working Groups I, II and III to the Fourth Assessment Report of the Intergovernmental Panel on Climate Change; Core Writing Team, Pachauri, R.K., Reisinger, A., Eds.; IPCC: Geneva, Switzerland, 2007; 104p. [Google Scholar]
- Polyzos, S.; Tsiotas, D. The Evolution and Spatial Dynamics of Coastal Cities in Greece. In Urban Development; Polyzos, S., Ed.; Intech Open: London, UK, 2012. [Google Scholar] [CrossRef]
- Giannakourou, G.; Balla, E. Coastal Protection and Management in Greece: From Laws and Policies to Actual Implementation. Mare Nostrum Academic Conference. 2015. Available online: https://www.researchgate.net/publication/310138910_COASTAL_PROTECTION_AND_MANAGEMENT_IN_GREECE_FROM_LAWS_AND_POLICIES_TO_ACTUAL_IMPLEMENTATION (accessed on 14 November 2022).
- Le Hir, P.; Roberts, W.; Cazaillet, O.; Christie, M.; Bassoullet, P.; Bacher, C. Characterization of intertidal flat hydrodynamics. Cont. Shelf Res. 2000, 20, 1433–1459. [Google Scholar] [CrossRef]
- Dronkers, J.; Stojanovic, T. Socio-Economic Impacts—Coastal Management and Governance. In North Sea Region Climate Change Assessment. Regional Climate Studies; Quante, M., Colijn, F., Eds.; Springer: Cham, Switzerland, 2016. [Google Scholar] [CrossRef]
- Jouon, A.; Douillet, P.; Ouillon, S.; Fraunié, P. Calculations of hydrodynamic time parameters in a semi-opened coastal zone using a 3D hydrodynamic model. Cont. Shelf Res. 2006, 26, 1395–1415. [Google Scholar] [CrossRef]
- European Digital Elevation Model (EU-DEM), Version 1.1. European Environment Agency (EEA) under the Framework of the Copernicus Programme. Available online: https://hub.sieusoil.eu/cat/record/basic/5e138630-dd30-476b-b045-174a0a000073 (accessed on 15 December 2021).
- Trégarot, E.; Catry, T.; Pottier, A.; El-Hacen, E.M.; Cheikh, M.A.S.; Cornet, C.C.; Maréchal, J.; Failler, P. Coastal protection assessment: A tradeoff between ecological, social, and economic issues. Ecosphere 2021, 12, e03364. [Google Scholar] [CrossRef]
- Tragaki, A.; Gallousi, C.; Karymbalis, E. Coastal Hazard Vulnerability Assessment Based on Geomorphic, Oceanographic and Demographic Parameters: The Case of the Peloponnese (Southern Greece). Land 2018, 7, 56. [Google Scholar] [CrossRef]
- Komi, A.; Petropoulos, A.; Evelpidou, N.; Poulos, S.; Kapsimalis, V. Coastal Vulnerability Assessment for Future Sea Level Rise and a Comparative Study of Two Pocket Beaches in Seasonal Scale, Ios Island, Cyclades, Greece. J. Mar. Sci. Eng. 2022, 10, 1673. [Google Scholar] [CrossRef]
- Skrimizea, E.; Bakema, M.; McCann, P.; Parra, C. Disaster governance and institutional dynamics in times of social-ecological change: Insights from New Zealand, the Netherlands and Greece. Appl. Geogr. 2021, 136, 102578. [Google Scholar] [CrossRef]
- The World Bank. The World Bank Annual Report 2017; World Bank: Washington, DC, USA, 2017. [Google Scholar]
- Papadakis, N.; Kyvelou, S. Greek Islands in crisis: Social vulnerability and the need for integrated territorial development strategies. Eur. Q. Political Attitudes Ment. 2017, 6, 67–88. [Google Scholar]
- Balzan, M.V.; Potschin-Young, M.; Haines-Young, R. Island ecosystem services: Insights from a literature review on case-study island ecosystem services and future prospects. Int. J. Biodivers. Sci. Ecosyst. Serv. Manag. 2018, 14, 71–90. [Google Scholar] [CrossRef]
- Giannakidou, C.; Diakoulaki, D.; Memos, C.D. Vulnerability to Coastal Flooding of Industrial Urban Areas in Greece. Environ. Process. 2020, 7, 749–766. [Google Scholar] [CrossRef]
- Martin, T.G.; Burgman, M.A.; Fidler, F.; Kuhnert, P.M.; Low-Choy, S.; Mcbride, M.; Mengersen, K. Eliciting Expert Knowledge in Conservation Science. Conserv. Biol. 2012, 26, 29–38. [Google Scholar] [CrossRef] [PubMed]
- Tourlioti, P.N.; Portman, M.E.; Tzoraki, O.; Pantelakis, I. Interacting with the coast: Residents’ knowledge and perceptions about coastal erosion (Mytilene, Lesvos Island, Greece). Ocean. Coast. Manag. 2021, 210, 105705. [Google Scholar] [CrossRef]
- Lazoglou, M. Strengthening the Resilience of Coastal Cities against Climate Change through Spatial Planning: Evidence from Greece. Curr. Urban Stud. 2022, 10, 639–654. [Google Scholar] [CrossRef]
- Grace, M.; Balzan, M.; Collier, M.; Geneletti, D.; Tomaskinova, J.; Abela, R.; Borg, D.; Buhagiar, G.; Camilleri, L.; Cardona, M.; et al. Priority knowledge needs for implementing nature-based solutions in the Mediterranean islands. Environ. Sci. Policy 2021, 116, 56–68. [Google Scholar] [CrossRef]
- Nunn, P.D.; Klöck, C.; Duvat, V. Seawalls as maladaptations along island coasts. Ocean Coast. Manag. 2021, 205, 105554. [Google Scholar] [CrossRef]
- Balvanera, P.; A Brauman, K.; Cord, A.F.; Drakou, E.G.; Geijzendorffer, I.R.; Karp, D.S.; Martín-López, B.; Mwampamba, T.H.; Schröter, M. Essential ecosystem service variables for monitoring progress towards sustainability. Curr. Opin. Environ. Sustain. 2022, 54, 101152. [Google Scholar] [CrossRef]
- Petropoulos, A.; Kapsimalis, V.; Evelpidou, N.; Karkani, A.; Giannikopoulou, K. Simulation of the Nearshore Sediment Transport Pattern and Beach Morphodynamics in the Semi-Enclosed Bay of Myrtos, Cephalonia Island, Ionian Sea. J. Mar. Sci. Eng. 2022, 10, 1015. [Google Scholar] [CrossRef]
- Theodora, Y.; Spanogianni, E. Assessing coastal urban sprawl in the Athens’ southern waterfront for reaching sustainability and resilience objectives. Ocean. Coast. Manag. 2022, 222, 106090. [Google Scholar] [CrossRef]


Disclaimer/Publisher’s Note: The statements, opinions and data contained in all publications are solely those of the individual author(s) and contributor(s) and not of MDPI and/or the editor(s). MDPI and/or the editor(s) disclaim responsibility for any injury to people or property resulting from any ideas, methods, instructions or products referred to in the content. |
© 2022 by the authors. Licensee MDPI, Basel, Switzerland. This article is an open access article distributed under the terms and conditions of the Creative Commons Attribution (CC BY) license (https://creativecommons.org/licenses/by/4.0/).