Article

The Use of Mobile Phones and Other Unsafe Behavior While Cycling in the Metropolitan Area of Mexico City

by
Jaime Santos-Reyes
*,
Yareli Pastenes-Medina
and
Diego Padilla-Pérez
Grupo de Investigación SARACS, SEPI-ESIME, Zac., Instituto Politécnico Nacional, Mexico City 07738, Mexico
*
Author to whom correspondence should be addressed.
Sustainability 2023, 15(1), 61; https://doi.org/10.3390/su15010061
Submission received: 14 October 2022 / Revised: 4 December 2022 / Accepted: 14 December 2022 / Published: 21 December 2022

Abstract

:
Unsafe behavior while driving contributes to road accidents. The paper addresses cyclists’ risky behavior by employing a questionnaire-based survey to a sample of n = 1136 in the metropolitan area of Mexico City. The main results are as follows: (a) 31.4% and 24.2% of the participants use a mobile phone for talking and text messaging while cycling, respectively, with males engaging in these unsafe acts more often than females; (b) a high percentage of participants are most likely to communicate with their parents, through either talking (48.9%) or text messaging (39.6%); (c) regarding the use of mobile phones for talking/texting (along with social network and gender) as predictors of a crash/fall while cycling, it was found that a one SD change in the frequency of talking while cycling increased the odds of a crash/fall by a factor of 1.198, as did a one SD increase in the frequency of texting by 1.232, while gender contributed to the outcome but not the individuals to whom cyclists talk or text; (d) cycling “without holding the handlebars” contributed significantly to the outcome. An education campaign or legislation enforcement (or both) may be needed to prevent single-bicycle crashes related to this unsafe act.

1. Introduction

Cycling may be regarded as the most important mode of nonmotorized transport. Moreover, cycling is not expensive and contributes to a reduction in pollution emissions and energy consumption compared to motorized transport systems [1,2,3,4,5]. However, the number of cyclist fatalities has increased, as has the number of serious injuries due to an increased number of single-bicycle crashes (SBCs) [2,3,5]. In the present study, the widely used definition of SBCs was adopted, i.e., falls or obstacle collisions (all crash types in which only the cyclist is involved, including talking to other cyclists; in the subsequent sections, the terms “crash/fall” and “fall/crash” are used). The crash type was characterized in relation to [5] physical infrastructure (road type and surface), cyclists’ riding behavior (or unsafe acts, e.g., doing a “wheelie”), bicycle malfunction, and others (e.g., cyclists’ age and gender).
The present study addresses riders’ unsafe acts while cycling by considering the use of a mobile phone (either talking or texting messages), listening to music, smoking, talking to other cyclists, and riding without holding the handlebars. According to [6], “unsafe acts” refer to errors and procedural violations arising “from aberrant mental processes such as forgetfulness, inattention, poor motivation, carelessness, negligence, and recklessness”; in the present work, “unsafe acts” and “unsafe behavior” are used interchangeably.

1.1. The Use of Mobile Phones While Riding

Modern society is undoubtedly characterized, among other things, by the use of mobile phones. As of 2022, it is believed that around 67% of the world’s population uses a mobile phone, with an increase of 1.8% compared to the previous year [7]. Their use has increased due to their handy nature; they can assist users in not only communicating, but also accessing information, regardless of the user’s location. According to [8], nearly half of teens and parents in Mexico consider themselves addicted to their mobile phones. However, the use of mobile phones raises the question as to whether society is aware of the negative effects of their use, e.g., on behavior and communicative practice, in the context of road safety.
Research has shown that the use of mobile phone, whether it is being used for talking or text messaging, while cycling makes the rider more vulnerable to collisions [9,10,11,12,13,14]. For example, it was found that the use of touchscreen smart phones and traditional keyboard phones while cycling both exhibited a negative impact on cycling, increasing the risk of crashes [13]. In general, mobile use while cycling causes cognitive [14], visual [15], and operational [16] distractions, which in turn affect the rider’s observation, perception, judgement, and manipulation [12].
An issue that arises in this regard is the persons with whom cyclists talk or text. Social norms and social networks have been found to be associated with mobile phone use [17,18,19,20]. Studies such as [19] have identified social norms among several significant predictors of distracted driving; furthermore, individuals that witnessed their peers engaging in distracted driving were more likely to engage in this behavior themselves [19]. In line with the social network theory, it has been argued that to be able to understand the relationship between mobile phone use and driving, it is necessary to consider the relationship between the driver and the person they are communicating with [17], i.e., the social relationship. The authors found that individuals were more likely to talk or send text messages using a mobile phone while driving when communicating with those socially closest to them. However, there are no published studies on this subject in relation to cyclists.
Lastly, it is worth mentioning that “the use of a mobile phone” includes handheld talking, handsfree talking (whether via speaker or over a headset, which has some (albeit potentially lower) cognitive demand, whether visual or manual), texting (which has very intense visual and manual demand), and browsing (e.g., social media browsing, with intense visual demand but potentially less manual demand). In the present work, the “use of a mobile phone” implies one or a combination of these tasks.

1.2. Other Unsafe Acts While Cycling

Not many studies have investigated the kinds of unsafe acts considered herein. Most of the studies on SBCs were related to infrastructure deficiencies [2,3,4,5], bicycle malfunction [3,5], etc. In relation to listening to music, it was found that cyclists that engage in this act while cycling exhibited more unsafe behavior than those that did not [11]. Moreover, it has been argued that listening to music can make the use of auditory cues challenging for bicycle riders [21]; for example, engine noises may help cyclists detect and locate approaching road users and prevent collisions. Regarding interaction with other cyclists, it was reported that talking with other cyclists led to more unsafe behaviors compared to not performing a secondary task [11]. The authors of [4] found that 10% of cyclists had performed evasive actions to prevent collisions when interacting with other road users.
Overall, a great deal of effort has been directed towards understanding the use of mobile phones while driving a car or riding a motorcycle, as well as the social relationship; however, very little research has been conducted to explore this relationship in the context of bicycle riders. The aim of this paper was twofold: (1) to explore the association of social networks with mobile phone use for talking and text messaging while cycling; (2) to identify the factors that contribute to crashes/falls when considering other unsafe acts while cycling, i.e., listening to music, chatting or talking with other cyclists, smoking, and riding “without holding the bicycle handlebars”.
In order to achieve the aims of the study, a survey of university students was undertaken in the metropolitan area of Mexico City. Relatively young individuals were selected as the target group given their higher propensity to use a mobile phone compared with older adults [22], along with their greater susceptibility to distracted driving [23,24]. According to [25], 35.9% of individuals own a bicycle in the metropolitan area of Mexico City, and 2.2% use the bicycle as mode of transport at least one of the segments of their trips on a weekday (3.3% were males and 0.09% females [25]).
The paper is organized as follows. Section 2 describes the materials and methods employed in the analysis, including the employed survey questionnaire, data collection, and a brief description of the statistical methods employed in the analysis of the collected data, e.g., the employ of a binary logistic regression to determine the contributory factors leading to a crash/fall. Section 3 presents the details of the main results of the analysis. A discussion of the main findings, limitations, and areas for future research is presented in Section 4. Finally, Section 5 presents the main conclusions and findings of the study.

2. Materials and Methods

2.1. Binary Logistic Regression

An expected value of a response variable, in a multiple regression, y, is modeled as a linear function of the explanatory variables:
E y = β 0 + β 1 x 1 + + β q x q
For a binary response taking the values 0 and 1 (crash/fall miss and crash/fall), the expected value is the probability, p, that the variable takes the value 1, i.e., the probability of a crash/fall. Given that the observed values do not follow a normal distribution, but rather a Bernoulli distribution [26], then a more suitable approach is to model p indirectly via a logit transformation of p, i.e., l n p / 1 p , i.e.,
l n p 1 p = β 0 + β 1 x 1 + + β q x q
The log-odds of crash/fall are modeled as a linear function of the explanatory variables (e.g., unsafe behavior while cycling). Therefore, in terms of p, the logistic regression (LR) model can be written as follows:
p = e x p β 0 + β 1 x 1 + + β q x q 1 + e x p β 0 + β 1 x 1 + β q x q
This function of the linear predictor is known as the logistic function. For further details, see [27].

2.2. Survey Design and Data Collection

The present study is part of a much larger cross-sectional research project related to accidents in the public transport system in the metropolitan area of Mexico City. The aim of the present study was to shed some light on the unsafe behavior of bicycle riders. The employed questionnaire survey was based on one used in a similar study on the use of mobile phones while riding a motorcycle [28]. Further, the questionnaire was augmented by the results of the observed risk behavior of cyclists in a preliminary study. That is, members of the research team spent four days observing cyclists at different times to determine the kinds of unsafe behavior while cycling, and the results are shown in Figure 1. Hence, the final version of the questionnaire contained three main sections, i.e., (a) the demographics of the participants (Section 3.1); (b) a section related to the frequency of unsafe behavior while riding a bicycle (Table 1 and Figure 1); and (c) the kinds of social networks with whom cyclists communicate (either talking or text messaging) while cycling (Table 2).
The questionnaire was administered to university students from 1 January–30 June 2019. Overall, there were 1275 participants in the study; however, the valid sample size was n = 1136 after 153 participants were removed due to missing and invalid data responses (e.g., those who do not own a bicycle). The questionnaire took 5 min to complete. All the participants completed the questionnaire anonymously and were assured of the confidentiality of their answers.

2.3. Statistical Analysis

Descriptive analysis was conducted by frequency and cross-tabulation analyses. The variables related to the frequency of unsafe behavior and the kinds of social network considered in the study were analyzed by employing Pearson Chi-square tests. One-way between groups ANOVA analyses were performed when comparing two groups where the independent variable has several levels. Further, post hoc analyses were conducted by employing Tukey’s HSD. The selection criteria for the explanatory variables were based on previous studies (e.g., [28]) and were tested for multicollinearity (see the Limitations section for more on this). An univariable analysis was conducted before any of the explanatory variables being considered in the analysis. The Statistical Package SPSS, ver. 25, has been employed in the analysis of the collected data. All the conducted tests were two-tailed, and the statistically significant results acceptance criteria were yielded at p < 0.05.

3. Results

3.1. Respondents Characteristics

The sample size of the study was n = 1136. The age range of the participants was from 14 to 27 years old (M = 19.96; SD = 2.441). Regarding the gender of the participants, 35.2% (400/1136) were females and 64.8% (736/1136) were males. Females appear to be underrepresented; however, according to a study on the origin–destination conducted in the metropolitan area of Mexico City [25], 75.5% of the trips in which the bicycle was used as a mode of transport were made by males.

3.2. The Use of Mobile Phones for Talking & Texting While Riding a Bicycle

Figure 2 shows the frequency data of unsafe behavior (or unsafe acts) and the kinds of social network with whom cyclists talk and text while cycling. For example, it has been found that 4.5%, 4.7%, and 3.3% of the respondents engaged in this unsafe act (talking on a mobile phone) monthly, weekly, and daily, respectively. Further, a relatively high percentage of university students used the mobile phone “a few times a year” (18.9%).
The results also highlighted that there is a significant association between the gender of the participants and the frequency of talks while cycling, to the extent that males perform this unsafe act weekly compared to females, who never do so (χ2 (4, n = 1136) = 12.932, p = 0.012, Cramer’s V = 0.107) (Table 3). The results also showed that there is a statistically significant difference at p < 0.05 level in age scores for the six groups related to the social network university students talk to while cycling (F(5, 1130) = 4.45, p = 0.001). Further, it has also been found that those who are most likely to talk to “other” (M = 20.82, SD = 2.31) were slightly older than those who are most likely to talk to a brother/sister (M = 19.53, SD = 2.023), parent (M = 19.76, SD = 2.35), or boyfriend/girlfriend (M = 20.48, SD = 2.73); see Figure 3a.
Regarding the use of mobiles phone for text messaging, the frequency data show that 4.2%, 3.7%, and 1.8% of the participants engaged in this unsafe behavior monthly, weekly, and daily, respectively (Figure 2). Further, there is a significant association between gender and the frequency of texting while cycling, to the extent that males perform this unsafe act “a few times a year” compared to females, who never do so (χ2 (4, n = 1136) = 10.705, p = 0.03, Cramer’s V = 0.097) (Table 4). In relation to the social network with whom the participants text messages while cycling, it has been found that women text their parents and males text their friends (χ2 (4, n = 1136) = 17.931, p = 0.003, Cramer’s V = 0.126) (Table 3).
Lastly, the results also showed that there is a statistically significant difference at p < 0.05 level in age scores for the six social network groups to whom university students text while cycling (F(5, 1130) = 4.45, p = 0.001). Participants who stated they were most likely to texting a parent (M = 19.64, SD = 2.41) were found to be slightly younger than those who are most likely to text message a ‘boyfriend/girlfriend or wife’ (M = 20.41, SD = 2.48). Those who are most likely to text message to ‘other’ were slightly older (M = 20.66, SD = 2.64) (Figure 3b).

3.3. Contributors to Crashes/Falls While Cycling

The section addresses the factors that influence crashes/falls while cycling. A binary logistic regression has been employed to conduct the analysis. In relation to the dependent variable, the following question was considered in the questionnaire: “In relation to the unsafe acts while cycling (Table 1), have you had a crash/fall?” Of the 1136 participants of the study, 32.4% indicated that they were involved in a crash/fall. The explanatory variables considered in the analysis were as follows: (a) talking on the mobile phone while cycling; (b) text messaging while cycling; in both cases, the variables related to gender and to whom participants talk to or text were considered in the analysis; and (c) unsafe behavior while cycling (i.e., those related to listening to music, smoking, chatting or talking to other cyclists, riding ”without holding the handlebars”, including the use of mobile phones; see Figure 2 and Table 1), and the gender of the participants.
Having addressed the use of mobile phones, Figure 2 also shows the frequency of engaging in other unsafe acts while cycling. For example, the percentage of university students who reported that they had never engaged in each of the considered variables ranged between 19.6% (“listening to music while cycling”) and 88.4% (“smoking while cycling”). The frequency of chatting or speaking to other cyclists was relatively high among cyclists, with 15.8%, 14.3%, and 7.7% engaging in this unsafe act on a monthly, weekly, or daily basis, respectively. Similarly, the percentage of cyclists riding “without holding the bicycle handlebars” was also relatively high among the participants, with 11.5%, 12.0%, and 10.1% engaging in this behavior on a monthly, weekly, or daily basis. Lastly, listening to music had also a high prevalence monthly (11.6%), weekly (15.6%), and daily (29.8%).

3.3.1. LR Model and the Frequency of Talking, the Social Network, and Gender as Explanatory Variables of a Crash/Fall

The results have highlighted that for every additional unit of frequency of talking by mobile phone, the odds of suffering a crash/fall increase by 20% (95% CI, 1.061–1.352) (Table 5). Regarding the gender of the participants, the odds of suffering a crash/fall while cycling are 1.596 times higher for males compared to females (95% CI, 1.212–2.101). However, the variable related to whom the participants talk to was not significant to the outcome variable.
(It should be noted that the variable age was not statistically significant in the univariable analysis, and therefore it was not included in the model (i.e., χ2 (1, n = 1136) = 0.394, p = 0.530); it should also be highlighted that there was no statistically significant interaction among the explanatory variables. The same applies for the case of the logistic regression models presented in the subsequent sections).

3.3.2. LR Model and the Frequency of Text Messaging, the Social Network, and Gender as Explanatory Variables to Crash/Fall

Table 6 shows the results regarding the factors related to texting while cycling; the findings have shown that for every additional unit of frequency of texting, the odds of suffering a crash/fall increase by 27% (95% CI, 1.105–1.455). In relation to the gender of the participants, the odds of suffering a crash or fall due to texting while cycling are 1.641 times higher for males compared to females (95% CI 1.217, 2.108). As with the previous case, the variable related to whom the participants text messaging was not significant (i.e., the related social network variable).
Lastly, to compare the influence of texting/calling on predicting the outcome variable, for standardized β coefficients, the results show that a one standard deviation (SD) change in the frequency of talking while cycling increases the odds of a fall/crash by a multiplicative factor of 1.198, while a one SD increase in the frequency of texting increased these odds by 1.232.

3.3.3. Logistic Model to Identify the Predictors to Crashes/Falls While Cycling

To identify the factors that contribute to falls/crashes, seven explanatory variables (including the gender of the participants) were considered in the first model, and the results are shown in Table 7. Only two variables were significantly associated with the outcome (i.e., riding a bicycle “without holding the handlebars” and gender). That is, for every additional unit of the frequency of cycling “without holding the handlebars”, the odds of suffering a fall/crash increase by 23.6% (i.e., a one standard deviation change in the frequency of cycling without holding the handlebars increases the odds of a fall/crash by a multiplicative factor of 1.336). When considering the gender of the participants, the odds of experiencing a crash/fall while cycling are 1.415 times higher for men than they are for women (95% CI, 1.065–1.880).
Table 7 also shows the results when considering a scale comprising the six unsafe acts as predictors (the unsafe act scale has an internal consistency, α = 0.684; M = 5.941; SD = 4.36), and the gender of the participants as explanatory variables. The results highlight that a one standard deviation change in the frequency of unsafe acts while cycling increases the odds of crash/fall by a multiplicative factor of 9.8. The odds of experiencing a crash/fall while cycling for men are 1.422 times higher than for women (95% CI, 1.148–1.993).

4. Discussion

4.1. On the Use of Mobile Phones for Talking/Text Messaging While Cycling

There has been a great deal of effort aimed at understanding the use of mobile phones while cycling [1,2,3,4,5,9,10,11,12,24]. However, there is little research on the use of mobile phones and the related social network while riding a bicycle. The present paper addresses this gap in a study of university students in the metropolitan area of Mexico City.
Overall, the results have highlighted that respondents of the study engage in unsafe acts while cycling. That is, 31.4% of the participants have used their mobile phone to talk while riding a bicycle, with only 3.3% doing so daily. Regarding text messaging, it has been found that 24.2% of the university students do this, with only 1.8% of them engaging in this activity daily. When considering the gender of the participants, males engage in the use of mobile phone while cycling more often (i.e., talking weekly, and text messaging “a few times a year”) than females.
In relation to whom respondents communicate with while cycling, the majority reported that they are most likely to communicate with their parents, through either talking on a mobile phone (48.9%) or by text messaging (39.6%). Moreover, respondents’ communication with a friend, either via talking or text messaging, came second, with 22.4% and 25.2%, respectively. An explanation of this may be due to a strong affiliation with the family, as one of the most common characteristics of Mexican parenting is communication between parents and adolescent-age children [29,30]. Similarly, a more recent study found that parents and teens consider the benefits of the use of mobile phones to ease communication (70% and 78%, respectively) and staying in touch with the extended family (62% and 61%, respectively) [8]. These findings are consistent with the theory on mobile phone distraction and social relationships [17]; that is, individuals are more likely to use their mobile phone either for text messaging or talking while driving with people who are socially close to them.
Overall, the findings are in line with some of the key characteristics of social network [18] and social norms [31,32,33] theories. That is, people who are more “homophilous” to each other are more likely to be socially connected and share similar attitudes to one another [18]. According to social norm theory, adolescents and young adults align with their peer group, which can heavily influence their own behavior [33].
Lastly, a logistic regression was employed to investigate whether talking and texting (and considering the social network and gender) while cycling contributed to the likelihood of a crash/fall (Table 5 and Table 6). When comparing the two LR models, the results highlighted that texting has a stronger influence on the outcome (crash/fall) than talking on a mobile phone while cycling. The finding is consistent with findings reported by [12,13,15,21]; for example, the authors of ([21], p. 11) argue that “Texting and searching for information are activities that do not require auditory but mainly visual perception and attention and are considered riskier than listening to music or talking on the phone”.
However, the variable related to those whom cyclists communicate with was not significant in the present study; in other words, whom they communicate with (either texting or talking), does not influence the outcome variable while cycling.

4.2. On the Influencing Factors to Crash/Fall While Cycling

Two LR models were built to investigate the influencing factors leading to the outcome variable (Table 7). When considering the seven explanatory variables, it has been found that the variable related to cycling “without holding the handlebars”, and the gender of the students were significant. It may be argued that keeping both hands on the handlebars while steering is safer than choosing not to do so. By performing this unsafe act, the bicycle rider may lose control quickly, which may result in a crash/fall. For example, it has been reported that 13% of the participants of a study were involved in a crash/fall due to an abrupt steering maneuver, and 2% of adolescents stunted (i.e., doing a “wheelie”) [5]. In short, by keeping both hands on the handlebars, the cyclist is in full control, and in any undesirable situation (e.g., a wet road surface) the rider’s reaction time will be shorter, preventing a fall/crash.
Lastly, when considering the unsafe behavior scale, as expected, it contributes significantly to the outcome. The results are in line with the fact that performing unsafe acts while cycling leads to crashes/falls [1,2,3,4,5].
The findings reported in the present work also raise the question as to why young adult cyclists engage in unsafe behavior while cycling? The theory of social norms may offer an explanation of the reasons why individuals engage in unsafe acts while cycling. A study conducted in Australia found that risky driving habits have a multidimensional nature and determined the situational factors that preclude them [34]. Hence, further research is needed to fully understand unsafe behavior while cycling to prevent undesirable consequences.

4.3. Limitations and Future Research

Some of the limitations and future research of the present work are as follows:
  • The findings of the present study should not be taken as definitive but should be viewed with caution. The employed data may not be reliable. Moreover, it is well known that there is a lack of single-bicycle crashes (SBCs) data [1,2,3,4,5]. In the present work, the data were self-reported by the students who participated in the study; it may well be the case that the reported prevalence of crash/fall is not accurate. That is, the findings may lead to bias given that participants, for example, did not use a mobile phone while cycling. More research is needed that considers data on actual crashes/falls while cycling. Police and emergency services may be a good source of SBCs records for further research.
  • This sample size was used for convenience, and therefore the findings should not be generalized to the whole population of the metropolitan area of Mexico City. Hence, other demographic characteristics of respondents should be considered for further analysis (e.g., socioeconomic status and to expand the age range of the participants).
  • In the present work, only six variables related to unsafe behavior were considered as contributing factors to a crash/fall while cycling; other unsafe acts may be considered in future research, e.g., riding on the opposite direction to the traffic, the use of helmets, among others. Further research may include the design of a reliable scale of unsafe acts while cycling by considering the aforementioned issues.
  • The present study did not consider other factors, such as those related to road conditions (e.g., dry, wet, loose objects on the road, uneven road surface), environmental conditions (e.g., season of the year, time of day, weather conditions), bicycle type (mountain, racing bikes), and bicycle malfunction (e.g., brake defects, too-low tire inflation, loose handlebars), among others. Moreover, the length of a trip plays an important factor, and the age of the cyclists may contribute to a fall/crash [5]. Furthermore, in the food delivery industry, time pressure to provide a service on time pushes the riders, for example, to bypass red lights [9]. More research on these issues is needed.

5. Conclusions

Published research in the literature has shown that unsafe behavior while cycling leads to collisions [1,2,3,4,5,9,10,11,12,24]. However, there are no studies explicitly addressing the relationship between the use of mobile phones while cycling with riders’ social network, and other unsafe acts leading to crashes/falls.
The paper has presented the results of a cross-sectional study addressing the unsafe behavior of cyclists with a sample size of n = 1136 in the metropolitan area of Mexico City. The unsafe acts considered in the study were as follows: listening to music, smoking, talking with other cyclists, riding “without holding the handlebars”, and the use of mobile phones for either talking or texting (Figure 1). The main conclusions are as follows: (a) there was an association between cyclists’ gender and the use of mobile phone for either talking or texting while cycling; (b) the use of mobile phones for talking and texting while cycling are contributing factors for a crash/fall, but the variable related to the social network (i.e., the person(s) to whom cyclists either talk or text to) has no impact; text messaging has a stronger influence on the outcome (crash/fall) than talking on a mobile phone while cycling; and (c) when considering the six unsafe acts (and gender) within a single LR model, only the factor related to riding ”without holding the handlebars” was significant to the outcome. When considering the unsafe acts scale, on the other hand, it contributed significantly to a crash/fall while cycling.
Some specific findings:
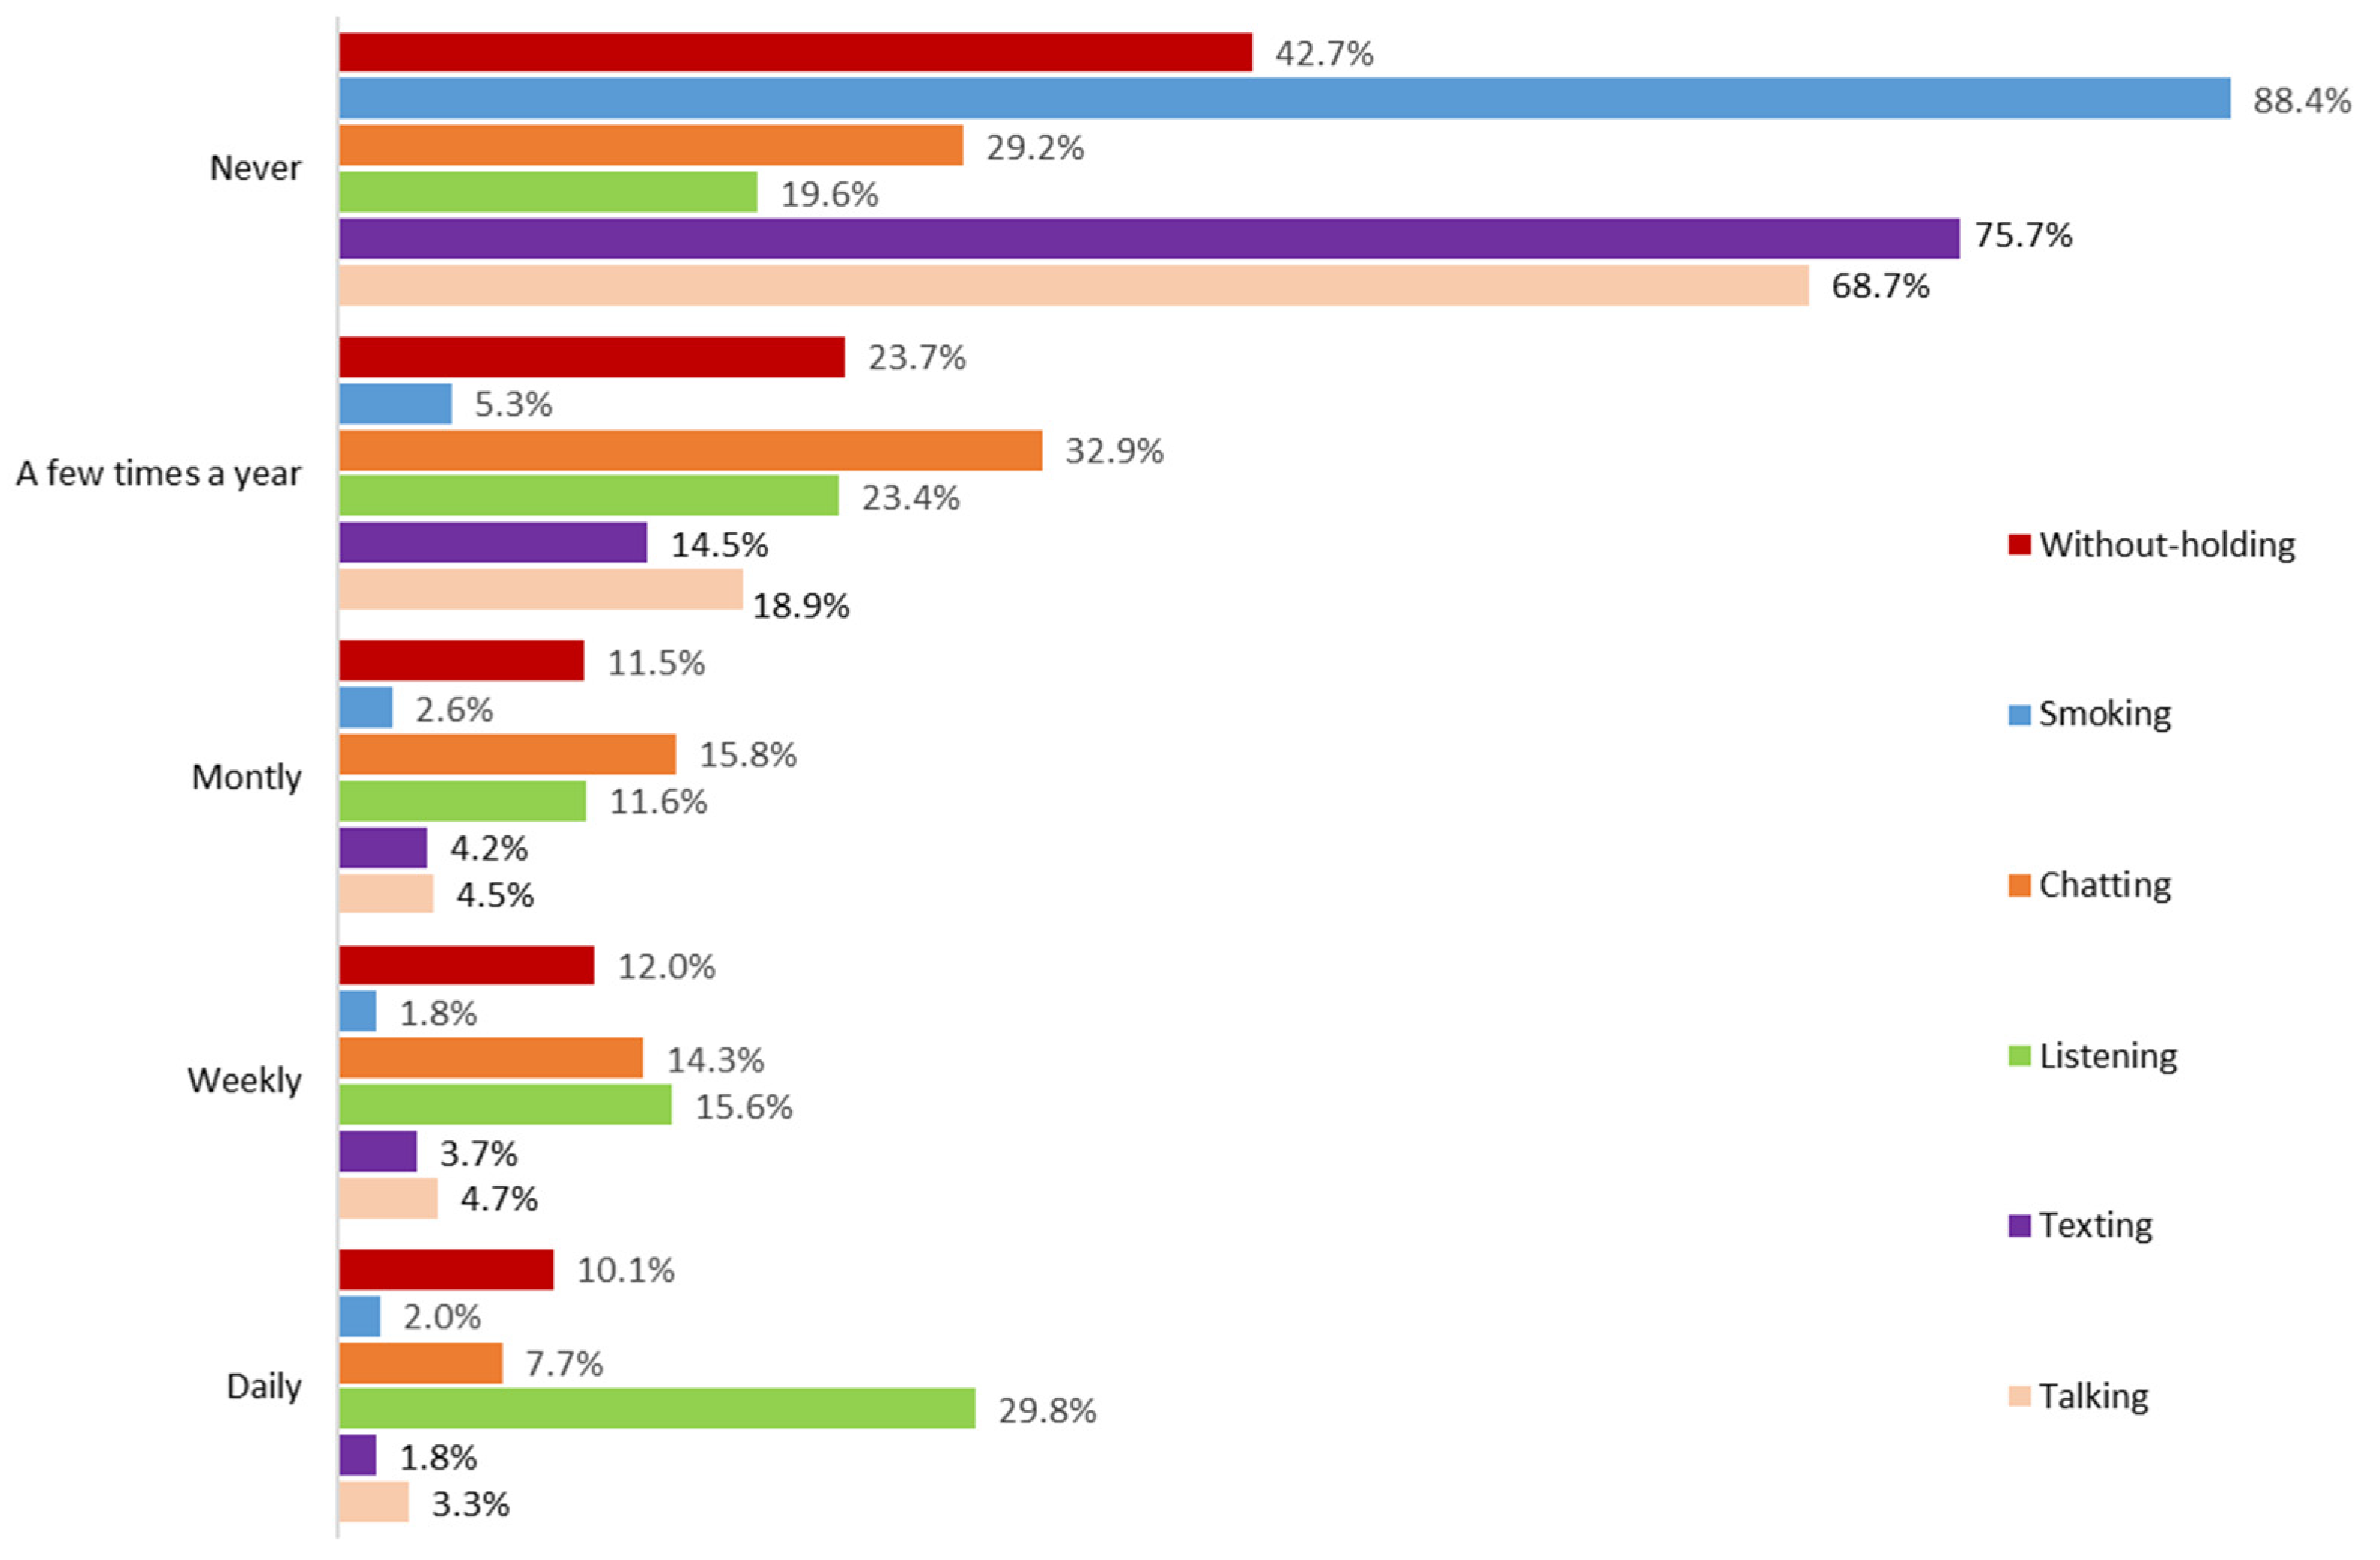
  • In total, 31.4% of the participants have used the mobile phone for talking while riding a bicycle with only 3.3% doing so on a daily basis.
  • In total, 24.2% of the students have used the mobile phone for text messaging, with only 1.8% doing so daily.
  • Males engage on these unsafe acts while cycling more often (i.e., talking weekly, and text messaging “a few times a year”) than females.
Some specific findings in relation to whom the respondents communicate with while cycling:
  • The majority reported that they are most likely to communicate with their parents, either talking on a mobile phone (48.9%) or by text messaging (39.6%).
  • Respondents’ communication with a friend either by talking or text messaging came second, at 22.4% and 25.2%, respectively.
Some specific findings in relation to the use of mobile phones for talking/texting (along with social networks and gender) as explanatory variables to crash/fall:
  • The results show that a one SD change in the frequency of talking while cycling increased the odds of fall/crash by a factor of 1.198, as did a one SD increase in the frequency of texting by 1.232.
The study highlighted the need for decision makers to address unsafe behavior while cycling in the metropolitan area of Mexico City. Our findings illustrated that cycling “without holding the handlebars” may be regarded as one of the most unsafe ways of riding a bicycle. An education campaign or legislation enforcement (or both) may be needed to prevent the occurrence of single-bicycle crashes (SBCs) associated with this unsafe act.

Author Contributions

The manuscript was conceptualized and written by J.S.-R. The data collection was conducted by Y.P.-M. and D.P.-P. The manuscript was critically reviewed by all the authors. All authors have read and agreed to the published version of the manuscript.

Funding

This research was funded by SIP-IPN under the following grant: SIP-IPN: No-20220766.

Institutional Review Board Statement

Not applicable.

Informed Consent Statement

Not applicable.

Data Availability Statement

Not applicable.

Conflicts of Interest

The authors declare no conflict of interest.

References

  1. Schepers, P.; Agerholm, N.; Amoros, E.; Benington, R.; Bjornskau, T.; Shondt, S.; Hagemeister, C.; Loo, B.P.; Niska, A. An international review of the frequency of single-bicycle crashes (SBCs) and their relation to bicycle modal share. Inj. Prev. 2015, 21, e138–e143. [Google Scholar] [CrossRef] [Green Version]
  2. Hosseinpour, H.; Madsen, T.K.O.; Olsen, A.V.; Lahrmann, H. An in-depth analysis of self-reported cycling injuries in single and multiparty bicycle crashes in Denmark. J. Saf. Res. 2021, 77, 114–124. [Google Scholar] [CrossRef]
  3. Olsen, A.V.; Madsen, T.K.O.; Hels, T.; Hosseinpour, H.; Lahrmann, H. Single-bicycle crashes: An in-depth analysis of self-reported crashes and estimation of attributable hospital costs. Accid. Anal. Prev. 2021, 161, 106353. [Google Scholar] [CrossRef] [PubMed]
  4. Eriksson, J.; Niska, A.; Forsman, A. Injured cyclists with focus on single-bicycle crashes and differences in injury severity in Sweden. Accid. Anal. Prev. 2022, 165, 106510. [Google Scholar] [CrossRef]
  5. Schepers, P.; Wolt, K.K. Single-bicycle crash types and characteristics. Cycl. Res. Int. 2012, 2, 119–135. [Google Scholar]
  6. Reason, J. Human error: Models and management. BMJ 2000, 320, 768–770. [Google Scholar] [CrossRef] [Green Version]
  7. Datareportal. Digital 2022: Global Overview Report. 2022. Available online: https://datareportal.com/reports/digital-2022-global-overview-report (accessed on 10 October 2022).
  8. Robb, M.B.; Bay, W.; Vennegaard, T. The New Normal: Parents, Teens, and Mobile Devices in Mexico; Common Sense: San Francisco, CA, USA, 2019. [Google Scholar]
  9. Oviedo-Trespalacios, O.; Rubie, E.; Haworth, N. Risky business: Comparing the riding behaviours of food delivery and private bicycle riders. Accid. Anal. Prev. 2022, 177, 106820. [Google Scholar] [CrossRef] [PubMed]
  10. Christie, N.; Ward, H. The health and safety risks for people who drive for work in the gig economy. J. Transp. Health 2019, 13, 115–127. [Google Scholar] [CrossRef]
  11. Terzano, K. Bicycling safety distracted behvior in the Hague, the Netherlands. Accid. Anal. Prev. 2013, 57, 87–90. [Google Scholar] [CrossRef]
  12. Jiang, K.; Yang, Z.; Feng, Z.; Sze, N.N.; Yu, Z.; Huang, Z.; Chen, J. Effects of using mobile phones while cycling: A study from the perspectives of manipulation and visual strategies. Transp. Res. Part F Psychol. Behav. 2021, 83, 291–303. [Google Scholar] [CrossRef]
  13. de Waard, P.S.; Wieke, O.; Brookhuis, K. Mobile phone use while cycling: Incidence and effects on behaviour and safety. Ergonomics 2014, 53, 30–42. [Google Scholar] [CrossRef] [PubMed]
  14. de Waard, P.S.; Lewis-Evans, B.; Jelijs, B.; Tucha, O.; Brookhuis, K. The effects of operating a touch screen smartphone and other common activities performed while bicycling on cycling behaviour. Transp. Res. Part F Psychol. Behav. 2010, 22, 196–206. [Google Scholar] [CrossRef] [Green Version]
  15. Ahlstrom, C.; Kircher, K.; Thorslund, B.; Adellb, E. Bicyclists’ visual strategies when conducting self-paced vs. system-paced smartphone tasks in traffic. Transp. Res. Part F Psychol. Behav. 2016, 41, 204–216. [Google Scholar] [CrossRef]
  16. de Waard, D.; Westerhuis, F.; Lewis-Evans, B. More screen operation than calling: The results of observing cyclists’ behaviour while using mobile phones. Accid. Anal. Prev. 2015, 76, 42–48. [Google Scholar] [CrossRef] [Green Version]
  17. LaVoie, N.; Lee, Y.-C.; Parker, J. Preliminary research developing a theory of cell phone distraction and social relationships. Accid. Anal. Prev. 2016, 86, 155–160. [Google Scholar] [CrossRef] [Green Version]
  18. Kadushin, C. Understanding Social Networks: Theories, Concepts and Findings; Oxford University Press: Oxford, UK, 2012. [Google Scholar]
  19. Hill, L.; Rybar, J.; Styer, T.; Fram, E.; Merchant, G.; Eastman, A. Prevalence of and attitudes about distracted driving in college students. Traffic Inj. Prev. 2015, 16, 362–367. [Google Scholar] [CrossRef] [PubMed]
  20. Truong, L.T.; Nguyen, H.T.T.; De Gruyter, C. Mobile phone use while riding a motorcycle and crashes among university students. Traffic Inj. Prev. 2019, 20, 204–210. [Google Scholar] [CrossRef]
  21. Stelling-Konzcak, A.; van Wee, G.P.; Commandeur, J.J.F.; Hagenzieker, M. Mobile phone conversations, listening to music and quiet (electric) cars: Are traffic sounds important for safe cycling. Accid. Anal. Prev. 2017, 106, 10–22. [Google Scholar] [CrossRef]
  22. Smith, A. Americans and Text Messaging; Pew Research Center: Washington, DC, USA, 2011. [Google Scholar]
  23. NHTSA. An Examination of Driver Distraction as Recorded in NHTSA Databases; National Highway Traffic Safety Administration (NHTSA): Washington, DC, USA, 2009.
  24. Lv, H.; Li, H.; Sze, N.N.; Ren, G. The impacts of non-motorized traffic enforcement cameras on red light violations of cyclists at signalized intersections. J. Saf. Res. 2022, 83, 310–322. [Google Scholar] [CrossRef]
  25. INEGI. Origin-Destination Survey in Households of the Metropolitan Zone of Valley of Mexico; INEGI: Mexico City, México, 2007.
  26. Everitt, B.S. Modern Medical Statistics: A Practical Guide; Arnold: London, UK, 2002. [Google Scholar]
  27. Howmer, D.W.; Lemeshow, R.X. Sturdivant. In Applied Logistic Regression; John Wiley & Sons: Hoboken, NJ, USA, 2013. [Google Scholar]
  28. de Gruyter, C.; Truonga, L.T.; Nguyen, H.T.T. Who’s calling? Social networks and mobile phone use among motorcyclists. Accid. Anal. Prev. 2017, 103, 143–147. [Google Scholar] [CrossRef]
  29. Soto Maciel, A.; de la Garza Ramos, M.I.; Esparza Aguilar, J.L.; San Martín Reyna, J.M. The influence of family relationships in the succession A factorial analysis of Mexican enterprises. J. Fam. Bus. Manag. 2015, 5, 238–256. [Google Scholar] [CrossRef]
  30. Solís-Cámara, P.; Fung, M.P.; Fox, R.A. Parenting in Mexico: Relationships Based on Love and Obedience. In Parenting Across Cultures: Childrearing, Motherhood and Fatherhood 349 in Non-Western Cultures, Science Across Cultures: The History of Non-Western Science 7; Selin, H., Ed.; Springer: Dordrecht, The Netherlands, 2014. [Google Scholar] [CrossRef]
  31. Beck, K.; Watters, S. Characteristics of college students who text while driving: Do their perceptions of a significant other influence their decisions? Transp. Res. Part F. 2016, 37, 119–128. [Google Scholar] [CrossRef]
  32. Nicolls, M.; Truelove, V.; Stefanidis, K.B. The impact of descriptive and injunctive norms on engagement in mobile phone use while driving in young drivers: A systematic review. Accid. Anal. Prev. 2022, 175, 106774. [Google Scholar] [CrossRef] [PubMed]
  33. Simons-Morton, B.G.; Farhat, T. Recent findings on peer group influences on adolescent smoking. J. Prim. Prev. 2010, 31, 191–208. [Google Scholar] [CrossRef] [PubMed] [Green Version]
  34. Love, S.; Truelove, V.; Rowland, B.; Kannis-Dymand, L.; Davey, J. Is all high-risk behaviour premeditated? A qualitative exploratory approach to the self-regulation of habitual and risky driving behaviours. Transp. Res. Part F Psychol. Behav. 2022, 90, 312–325. [Google Scholar] [CrossRef]
Figure 1. The observed cyclists’ unsafe behavior while cycling: (a) talking on a mobile phone; (b) texting using a mobile phone; (c) listening to music; (d) chatting or talking to other cyclists; (e) smoking; (f) riding “without holding the handlebars”.
Sustainability 15 00061 g001
Figure 2. Frequency of unsafe behavior while riding a bicycle.
Sustainability 15 00061 g002
Figure 3. The use of mobile phone while cycling (GB = girlfriend/boyfriend): (a) talking; (b) texting. (The actual difference in mean scores between the groups was quite small; the effect size, eta squared = 0.02; error bars: 95% CI. Post hoc analyses were conducted by employing Tukey’s HSD).
Sustainability 15 00061 g003
Table 1. Frequency of unsafe behavior (How often do you engage in the following behavior while cycling?).
VariableN Min 1Max 1MeanMedianSD
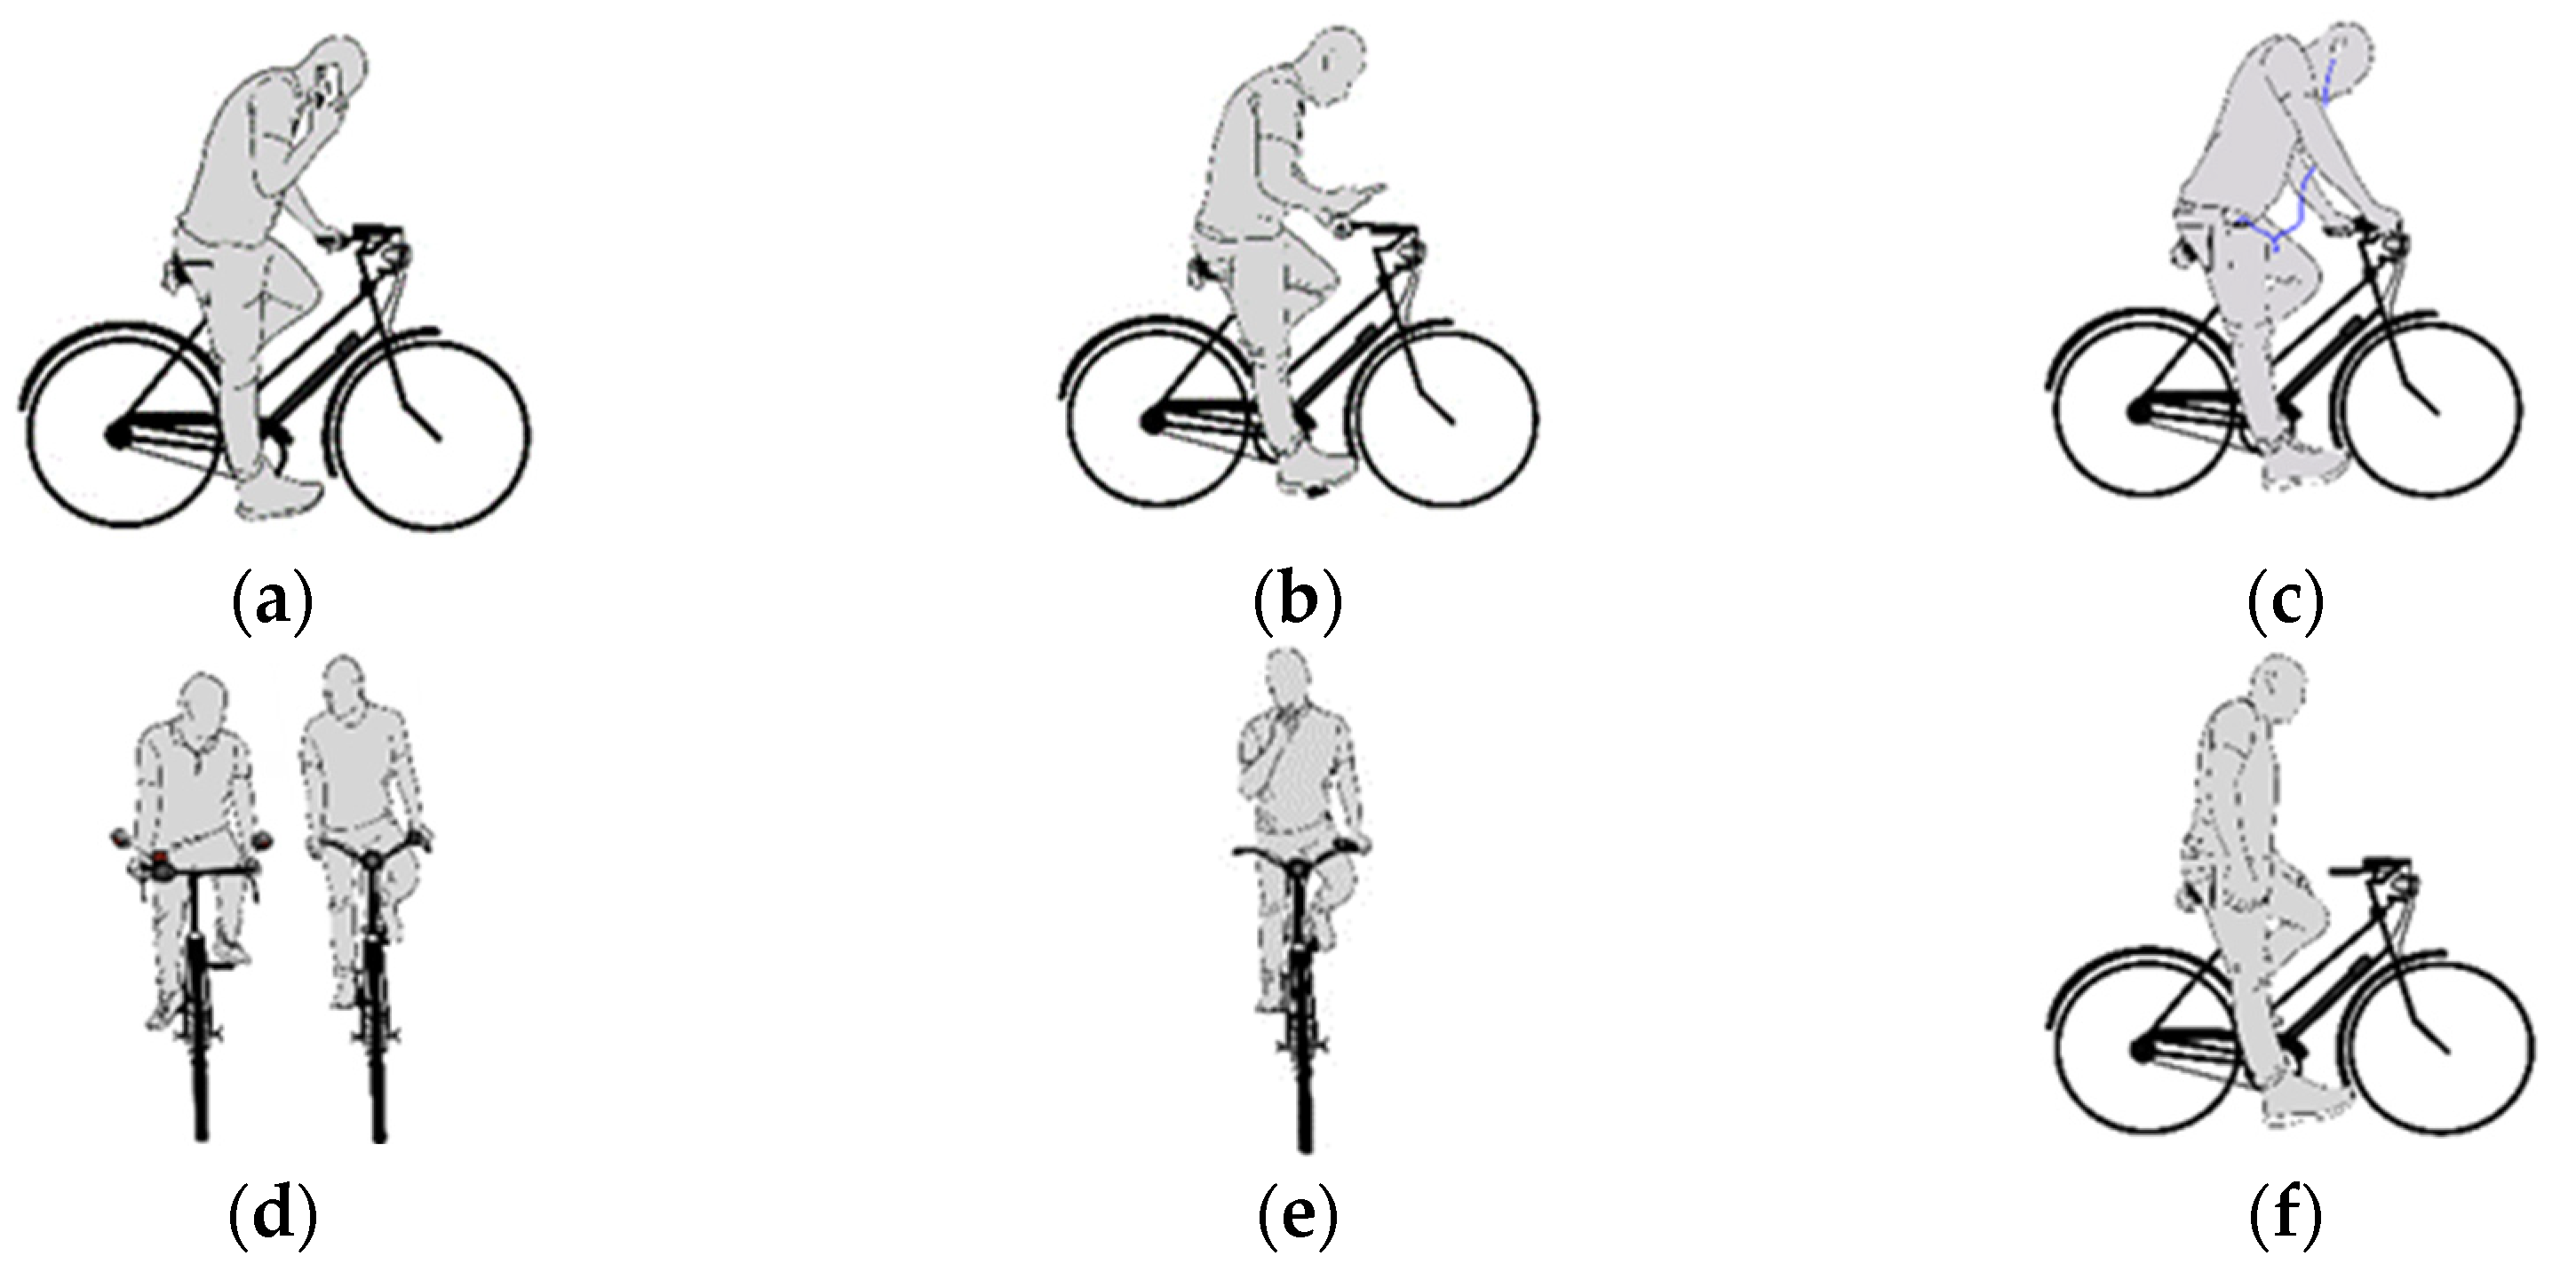
(a). Use a mobile phone for making or receiving a phone call while cycling (Figure 1a)1136151.54931.01.0045
(b). Use a mobile phone for texting while cycling (Figure 1b)1136151.41461.00.87838
(c). Use a mobile phone to listen to music while riding the bike (Figure 1c)1136153.12413.01.5336
(d). Chatting or talking to other cyclists while cycling (Figure 1d)1136152.38382.01.2539
(e). Smoking while riding the bicycle (Figure 1e).1136151.23771.00.76246
(f). Riding the bicycle “without holding the handlebars” (Figure 1f)1136152.23152.01.3712
1 1 = Never, 2 = A few times a year, 3 = Monthly, 4 = Weekly, 5 = Daily.
Table 2. Kinds of social networks associated with mobile phone use while cycling.
VariableMeasuresN (%)
If you use a mobile phone for
receiving or making a phone call while cycling, who are you most likely to talk to?
1 = Friend255 (22.4)
2 = Girlfriend/boyfriend/spouse156 (13.7)
3 = Parent556 (48.9)
4 = Brother/sister77 (6.8)
5 = Colleague42 (3.7)
6 = Other50 (4.4)
If you use a mobile phone for texting while cycling, who are you most likely to text?1 = Friend286 (25.2)
2 = Girlfriend/boyfriend/spouse181 (15.9)
3 = Parent450 (39.6)
4 = Brother/sister114 (10.0)
5 = Colleague48 (4.2)
6 = Other57 (5.0)
Table 3. Association between gender and the frequency of talking and texting while cycling.
VariableNever
N (%)
A Few Times a Year
N (%)
Monthly
N (%)
Weekly
N (%)
Daily
N (%)
Variable
N (%)
Never
N (%)
A Few Times a Year
N (%)
Monthly
N (%)
Weekly
N (%)
Daily
N (%)
Talking While
Cycling 1
Texting While
Cycling 2
Female299 (38.3)67 (31.2)13 (25.5)11 (20.8)10 (27.0)Female324 (37.7)45 (27.3)13 (27.1)10 (23.8)8 (38.1)
Male481 (61.7)148 (68.8)38 (74.5)42 (79.2)27 (73.0)Male536 (62.3)120 (72.7)35 (72.9)32 (76.2)13 (61.9)
Total780 (100)215 (100)51 (100)53 (100)37 (100)Total860 (100)165 (100)48 (100)42 (100)21 (100)
1 χ2 = 12.932, df = 4, p = 0.012; Cramer’s V = 0.107; 2 χ2 = 10.705, df = 4, p = 0.030; Cramer’s V = 0.097.
Table 4. Association between the gender of participants and the kinds of social networks they communicate with.
VariableFriend
N (%)
Boyfriend/
Girlfriend, or Wife
N (%)
Parents
N (%)
Brother/
Sister
N (%)
Colleague
N (%)
Other
N (%)
Female68 (26.7)55 (35.3)223 (40.1)29 (37.7)9 (21.4)16 (32.0)
Male187 (73.3)101 (64.7)333 (59.9)48 (62.3)33 (78.6)34 (68.0)
Total255 (100)156 (100)556 (100)77 (100)42 (100)50 (100)
χ2 = 17.931, df = 4, p = 0.003; Cramer’s V = 0.126.
Table 5. LR model results for crash/fall when using a mobile phone for talking while cycling.
Predictor VariableMeasuresβSEdfpOR95% CI
[Lower–Upper]
Frequency of talkingContinuous (Never–Daily)0.180 0.06210.0041.198[1.061–1.352]
Who students talk to while cyclingFriend (base) 50.498
Girlfriend/boyfriend, or wife0.2590.21610.2301.296[0.849–1.979]
Parents0.0610.16610.7131.063[0.768–1.470]
Brother/sister0.1810.27710.5151.198[0.696–2.063]
Colleague 0.3340.34510.3331.397[0.710–2.749]
Other−0.4110.37010.2660.663[0.321–1.369]
GenderMale0.4710.14010.0011.602[1.217–2.108]
Constant −1.4120.20010.0000.244
Model summary: −2LL = 1402.971; χ2 = 27.950; df = 7; p < 0.001; Nagelkerke R2 = 3.4%; Hosmer and Lemeshow test, p = 0.670.
Table 6. LR model results for crash/fall when using a mobile phone for texting while cycling.
Predictor VariableMeasuresβSEdfpOR95% CI
[Lower–Upper]
Frequency of texting Continuous (Never–Daily)0.2380.07010.0011.268[1.105–1.455]
Who students text while cyclingFriend (base) 50.447
Girlfriend/boyfriend, or wife0.0300.20610.8851.030[0.688–1.542]
Parents0.1650.16410.3141.180[0.855–1.627]
Brother/sister0.0880.23910.7121.092[0.684–1.744]
Colleague −0.1610.34510.6420.852[0.433–1.675]
Other−0.5000.35210.1560.607[0.304–1.210]
GenderMale0.4960.13910.0001.641[1.249–2.158]
Constant −1.4610.19510.0000.232
Model summary: −2LL = 1400.621; χ2 = 30.30; df = 7; p < 0.001; Nagelkerke R2 = 3.7%; Hosmer and Lemeshow test, p = 0.625.
Table 7. LR models for crash/fall when considering the six unsafe acts, the unsafe scale, and the gender of the participants as predictors.
Predictor Variable 2MeasurespUnstandardized 1Standardized 1
βORβOR
Frequency of unsafe actsMaking/receiving calls0.7730.0251.0250.02511.025
Texting0.4150.0791.0820.0701.072
Listening to music0.3550.0451.0460.0701.072
Talking to other cyclists0.0740.1011.1060.1271.135
Smoking0.989−0.0010.999−0.00070.9999
Without holding the handlebars0.0000.2121.2360.2901.336
GenderMale0.0170.3471.415
Constant 0.000−2.000.135
Model summary:
−2LL = 1374.027; χ2 = 56.90; df = 7; p < 0.001; Nagelkerke R2 = 7%; Hosmer & Lemeshow test, p = 0.391
Unsafe acts scaleUnsafe acts0.0000.5241.6892.2859.82
GenderMale0.0030.4141.513
Constant
Model summary:
−2LL = 1381.40; χ2 = 49.541; df = 2; p < 0.001; Nagelkerke R2 = 6%; Hosmer & Lemeshow test, p = 0.424
1 Apply only for continuous variables. 2 The variable age was not included because it was not significative in the univariable analysis.
Disclaimer/Publisher’s Note: The statements, opinions and data contained in all publications are solely those of the individual author(s) and contributor(s) and not of MDPI and/or the editor(s). MDPI and/or the editor(s) disclaim responsibility for any injury to people or property resulting from any ideas, methods, instructions or products referred to in the content.

