Article

Analysis of Inequality Levels of Industrial Development in Rural Areas through Inequality Indices and Spatial Autocorrelation

1
Department of Agricultural and Rural Engineering, Chungbuk National University, Chungdaero1, Cheongju 28644, Republic of Korea
2
Department of Agricultural Economics, Chungbuk National University, Chungdaero1, Cheongju 28644, Republic of Korea
3
Institutes of Green Bio Science and Technology, Seoul National University, Pyeongchang 08826, Republic of Korea
*
Author to whom correspondence should be addressed.
Sustainability 2023, 15(10), 8102; https://doi.org/10.3390/su15108102
Submission received: 10 April 2023 / Revised: 7 May 2023 / Accepted: 11 May 2023 / Published: 16 May 2023

Abstract

:
To achieve a balanced and sustainable rural development pattern, this study used the Theil index, Gini coefficient, and Spatial Autocorrelation method to analyze the inequality of industrial economic development between rural areas in South Korea. The results showed that considering the whole of South Korea, the inequality in industrial economic development level among rural areas was reasonably balanced, and the inequality level showed a trend of narrowing. Considering the first-level regions, the levels of inequality varied. The economic development level of the rural areas around the Capital Area and Metropolitan Cities was higher than that of other rural areas, and policies should be established to support the economic development of other rural areas.

1. Introduction

In recent years, in Korea, most rural areas appear to be in a state of economic recession owing to factors such as an aging population, rising unemployment, out-migration, and suboptimal infrastructure. However, research on rural areas in the European Union shows that this is not entirely the case—that is, some rural areas are again experiencing economic prosperity. This finding indicates that in Western developed countries, some rural areas are experiencing economic growth, whereas others are experiencing recession, and the level of economic development is unbalanced. In 2004, South Korea promulgated the “Special Law on National Balanced Development”, which means that South Korea attaches importance to regional balanced development. However, there remain various types of inequality among regions, the level of which is significant. Kim G.S. (2006) calculated the coefficient of variation and Gini coefficient of population, education, social welfare, culture, transportation, industrial economy, and living environment and concluded that the level of disparity among regions in Busan is relatively high [1]. Kim Y. et al. (2008) used the Theil-T index to study wage inequality in the Korean manufacturing industry, and the results showed a positive correlation between wage inequality and enterprise scale, location, R&D intensity, exports, and diversification [2]. Lee J. and Lee W. (2007) used regression analysis to determine the reasons for the characteristics of disparity between autonomous districts in Seoul [3]. According to Lee J. (2013), there is inequality in regional vitality, residents’ economic ability, and urbanization level for city (county), metropolitan city, and province, and the degree of inequality is in the order of regional vitality > residents’ economic ability > level of urbanization [4]. In a study of the relationship between economic growth and income inequality, Chun (2014) used the Gini coefficient, relative poverty rate, and quintile multiple to measure the degree of income inequality [5]. Kim T.-w (2020) showed that income inequality has deepened during the COVID-19 pandemic, and strengthening support for vulnerable groups by establishing relevant policies is necessary [6]. Akita (2003) used a two-stage nested Theil decomposition method to analyze regional income inequality in China and Indonesia, and the results showed that in these two countries, within-province inequality is more serious than between-province or between-region inequality [7]. De Maio (2007) has provided an overview of the methods to study income inequality, including the Gini coefficient, Atkinson index, Theil index, coefficient of variation, and decile ratios [8]. Fan and Zhang (2004) reported that rural infrastructure and education play an important role in explaining the difference in rural non-agricultural productivity [9]. Wang (2011) used the Generalized Entropy Index to measure the urban–rural income gap in Hunan Province (China) and found that the income gap showed a continuous trend of expansion, suggesting that the key to narrowing the income gap lies in narrowing the gap in the levels of economic development [10]. Fei (2014) used the Theil index to measure the urban–rural income gap in China after defining the attribution of migrant workers’ income [11]. Through a decomposition analysis of the Gini coefficient in China from 1978 to 2006, Chen et al. (2010) concluded that the income disparity between urban and rural inhabitants is the leading cause of national income inequality and that rapid urbanization is a key factor in addressing this inequality [12]. Jin et al. (2015) used the Gini coefficient to study medical health resource allocation in China and concluded that the equality in China’s demographically assessed distribution of healthcare resources is greater than that of its geographically measured distribution [13]. Chongvilaivan and Kim (2016) reassessed individual income inequality and its driving factors in Indonesia using the Theil decomposition method, and the findings highlighted that education reform is an effective redistribution policy [14]. Lee S.-H. et al. (2021) used the Gini coefficient to analyze economic inequality in Japanese prefectures and concluded that a few prefectures contributed significantly to GDP, and there was inequality in the level of economic development in these prefectures [15]. Li and Zhou (2009) used spatial autocorrelation to analyze the economic gap in the northwest region of China [16]. Tran et al. (2018) believed that economic inequality will reduce the life satisfaction of rural elderly, which is contrary to the concept of “people-oriented” development [17].
A summary of prior research presented in Table 1 shows that most of the existing studies have analyzed inequality from a macro-perspective, such as country, region, province, and city; however, there are few studies on inequality among rural areas from a micro-perspective. The authors of the present study believe that balanced economic development in rural areas is equally important. Excessive economic inequality will lead to the phenomenon of “the poor benefit from the poor and the rich benefit from the rich”. Ryser and Halseth (2010) argued that the out-migration of young families and the increasing number of elderly people have led to “aging in place” in many rural areas, thereby accelerating the decline or even extinction of poor rural areas [18]. Gardner (2005) proposed that the per capita GDP of all countries may increase, but it would not mean that the scale of the agricultural sector in all countries would increase. Therefore, the rural economy should be revitalized both within and outside the agricultural sector [19]. Rodríguez-Pose and Hardy (2015) hold a similar view that, to address poverty and inequality in rural economies, agricultural and non-agricultural development should go hand in hand [20]. Terluin (2003) believed that the broad concept of economic development incorporates social, cultural, and political elements; however, the current study adopts only the narrow concept of economic development [21]. Eliminating imbalances in rural areas is a means of sustainable development in rural areas and is also in line with the Korean government’s goal of pursuing national balanced development. However, most studies focus on the imbalance between the Capital Area and the non-Capital Area, as well as between urban and rural areas, with very little research on the imbalance between rural areas. Therefore, the research purpose of this article is to measure the inequality in economic development levels between rural areas and analyze its causes, providing a theoretical basis for policy establishment to narrow the inequality, and thus achieving a balanced and sustainable rural development pattern. The salient question is whether the level of economic development between rural areas in South Korea is balanced. Furthermore, if this is not the case, the level of inequality should be examined. In the present study, the level of industrial economic development was used to approximate the level of economic development in a narrow sense. Therefore, taking the rural areas in Korea as the research objects, we attempted to calculate and analyze the inequality in the level of industrial economic development among rural areas. The data on industrial sales and employment in rural areas were extracted based on the general economic survey data for 2010 and 2015 provided by the Korea Statistics Bureau. Using this data, the Theil-L index and Gini coefficient of each first-level region and entire Korea were calculated for 2010 and 2015 and the inequality in the level of industrial economic development among rural areas was interpreted based on the obtained results. Then the spatial autocorrelation analysis of sales and employment was carried out, and the reasons for the inequalities in the level of industrial economic development of various regions were analyzed from this perspective. Finally, a scientific basis is provided for formulating policies to promote balanced development in the regional economy and ensure rural economic revival.

2. Methodology

2.1. Theil Index

The Theil index is named after Theil (1967), who uses the entropy concept in information theory to calculate income inequality [22]. It is an indicator used to measure income inequality among individuals or regions. The Theil index ranges from 0 to 1. The larger the Theil index, the larger the inequality; the smaller the Theil index, the smaller the inequality. In addition, the Theil index can be used for regional decomposition analysis. According to the research needs, the overall region can be divided into several regions, the within-region and between-region inequalities can be calculated, and their contribution to the overall inequality can be obtained. This study uses the Theil-L index, defined below, with employment shares as weights. The expression is:
T = i j ( N i j N ) log ( N i j / N Y i j / Y )
T i   is a measure of the within-city inequality of the industrial economic development level for city i:
  T i = j ( N i j N i ) log ( N i j / N i Y i j / Y i )
Subsequently, the Theil-L index in Equation (1) can be decomposed into:
T R = T W C + T B C = i ( N i N ) T i + i ( N i N ) log ( N i / N Y i / Y )
where TR is the total regional inequality, which is the sum of the within-city component (TWC) and between-city component (TBC).   N i j   is the employment of Eup j in city i, N i is the total employment of city i, and N is the total employment of all Eups (Meyons).   Y i j is the industrial sales of Eup j in city i, Y i is the total industrial sales of city i, and Y is the total industrial sales of all Eups (Meyons).

2.2. Gini Coefficient

The Gini coefficient is an inequality indicator constructed on the basis of the Lorenz curve. As shown in Figure 1, the Lorenz curve is the curve of the cumulative percentage of income changing with the cumulative percentage of population. In the case of an absolute balance in income distribution, this curve is the uniform distribution line; the part above the Lorenz curve and below the uniform distribution line indicates the inequality in income distribution. Gini (1912) proposed using the proportion of the area above the Lorenz curve in the triangle below the uniform distribution line to represent the degree of income inequality [23], that is, the Gini coefficient, which is expressed as:
  G = A A + B
The Gini coefficient is a common indicator used to measure income inequality among residents of a country or region. The value of the Gini coefficient ranges from 0 to 1. The closer it is to 0, the higher the average income distribution. It is generally considered that when the value is less than 0.2, the income distribution is very balanced; between 0.2 and 0.3, it is relatively balanced; between 0.3 and 0.4, income distribution is reasonably balanced; between 0.4 and 0.5, the inequality is large; a value greater than 0.5 indicates severe inequality.

2.3. Spatial Autocorrelation

2.3.1. Global Moran’s I

Global Moran’s I measures spatial autocorrelation based on both feature locations and feature values simultaneously. Given a set of features and an associated attribute, it evaluates whether the pattern expressed is clustered, dispersed, or random. Global Moran’s I is defined as:
I = n i = 1 n j = 1 n W i j × i = 1 n j = 1 n W i j x i x ¯ x j x ¯ i = 1 n x i x ¯ 2
where n is equal to the total number of features, x i is the attribute value for feature i, W i j is the spatial weight between feature i and j. The value range of I is [−1, 1], Moran’s I > 0 indicates a positive spatial correlation (clustered), and the larger the value, the more obvious the spatial correlation; Moran’s I < 0 indicates a negative spatial correlation (dispersed), and the smaller the value, the larger the spatial difference; Moran’s I = 0 indicates random.

2.3.2. Anselin Local Moran’s I (ALMI)

Anselin (1995) proposed the Local Moran’s I which was derived from Global Moran’s I to analyze the local spatial pattern characteristics [24]. ALMI measures the degree to which a target value is similar to the values displayed by adjacent units and determines the relative contribution of an individual unit to the global index. Local Moran’s I is defined as:
I i = z i m 2 × j = 1 n W i j z j
where z i   and z j   are deviations from the mean value of variable X, m 2 = i z i 2 n   as a second moment, and W i j   is a binary spatial weight matrix in which each pair of neighbors is assigned a one and each non-neighbor pair is assigned a zero. The local Moran’s I is also called cluster and outlier analysis in ArcGIS. The analysis results of cluster and outlier are divided into four types, namely High-High Cluster (HH), High-Low Outlier (HL), Low-High Outlier (LH), and Low-Low Cluster (LL). HH indicates the clustering of high-value areas and high-value areas; HL indicates that high-value areas are surrounded by low-value areas; LH indicates that low-value areas are surrounded by high-value areas; LL indicates that low-value areas are clustered with low-value areas.

2.4. Study Area and Data

2.4.1. Regional Divisions

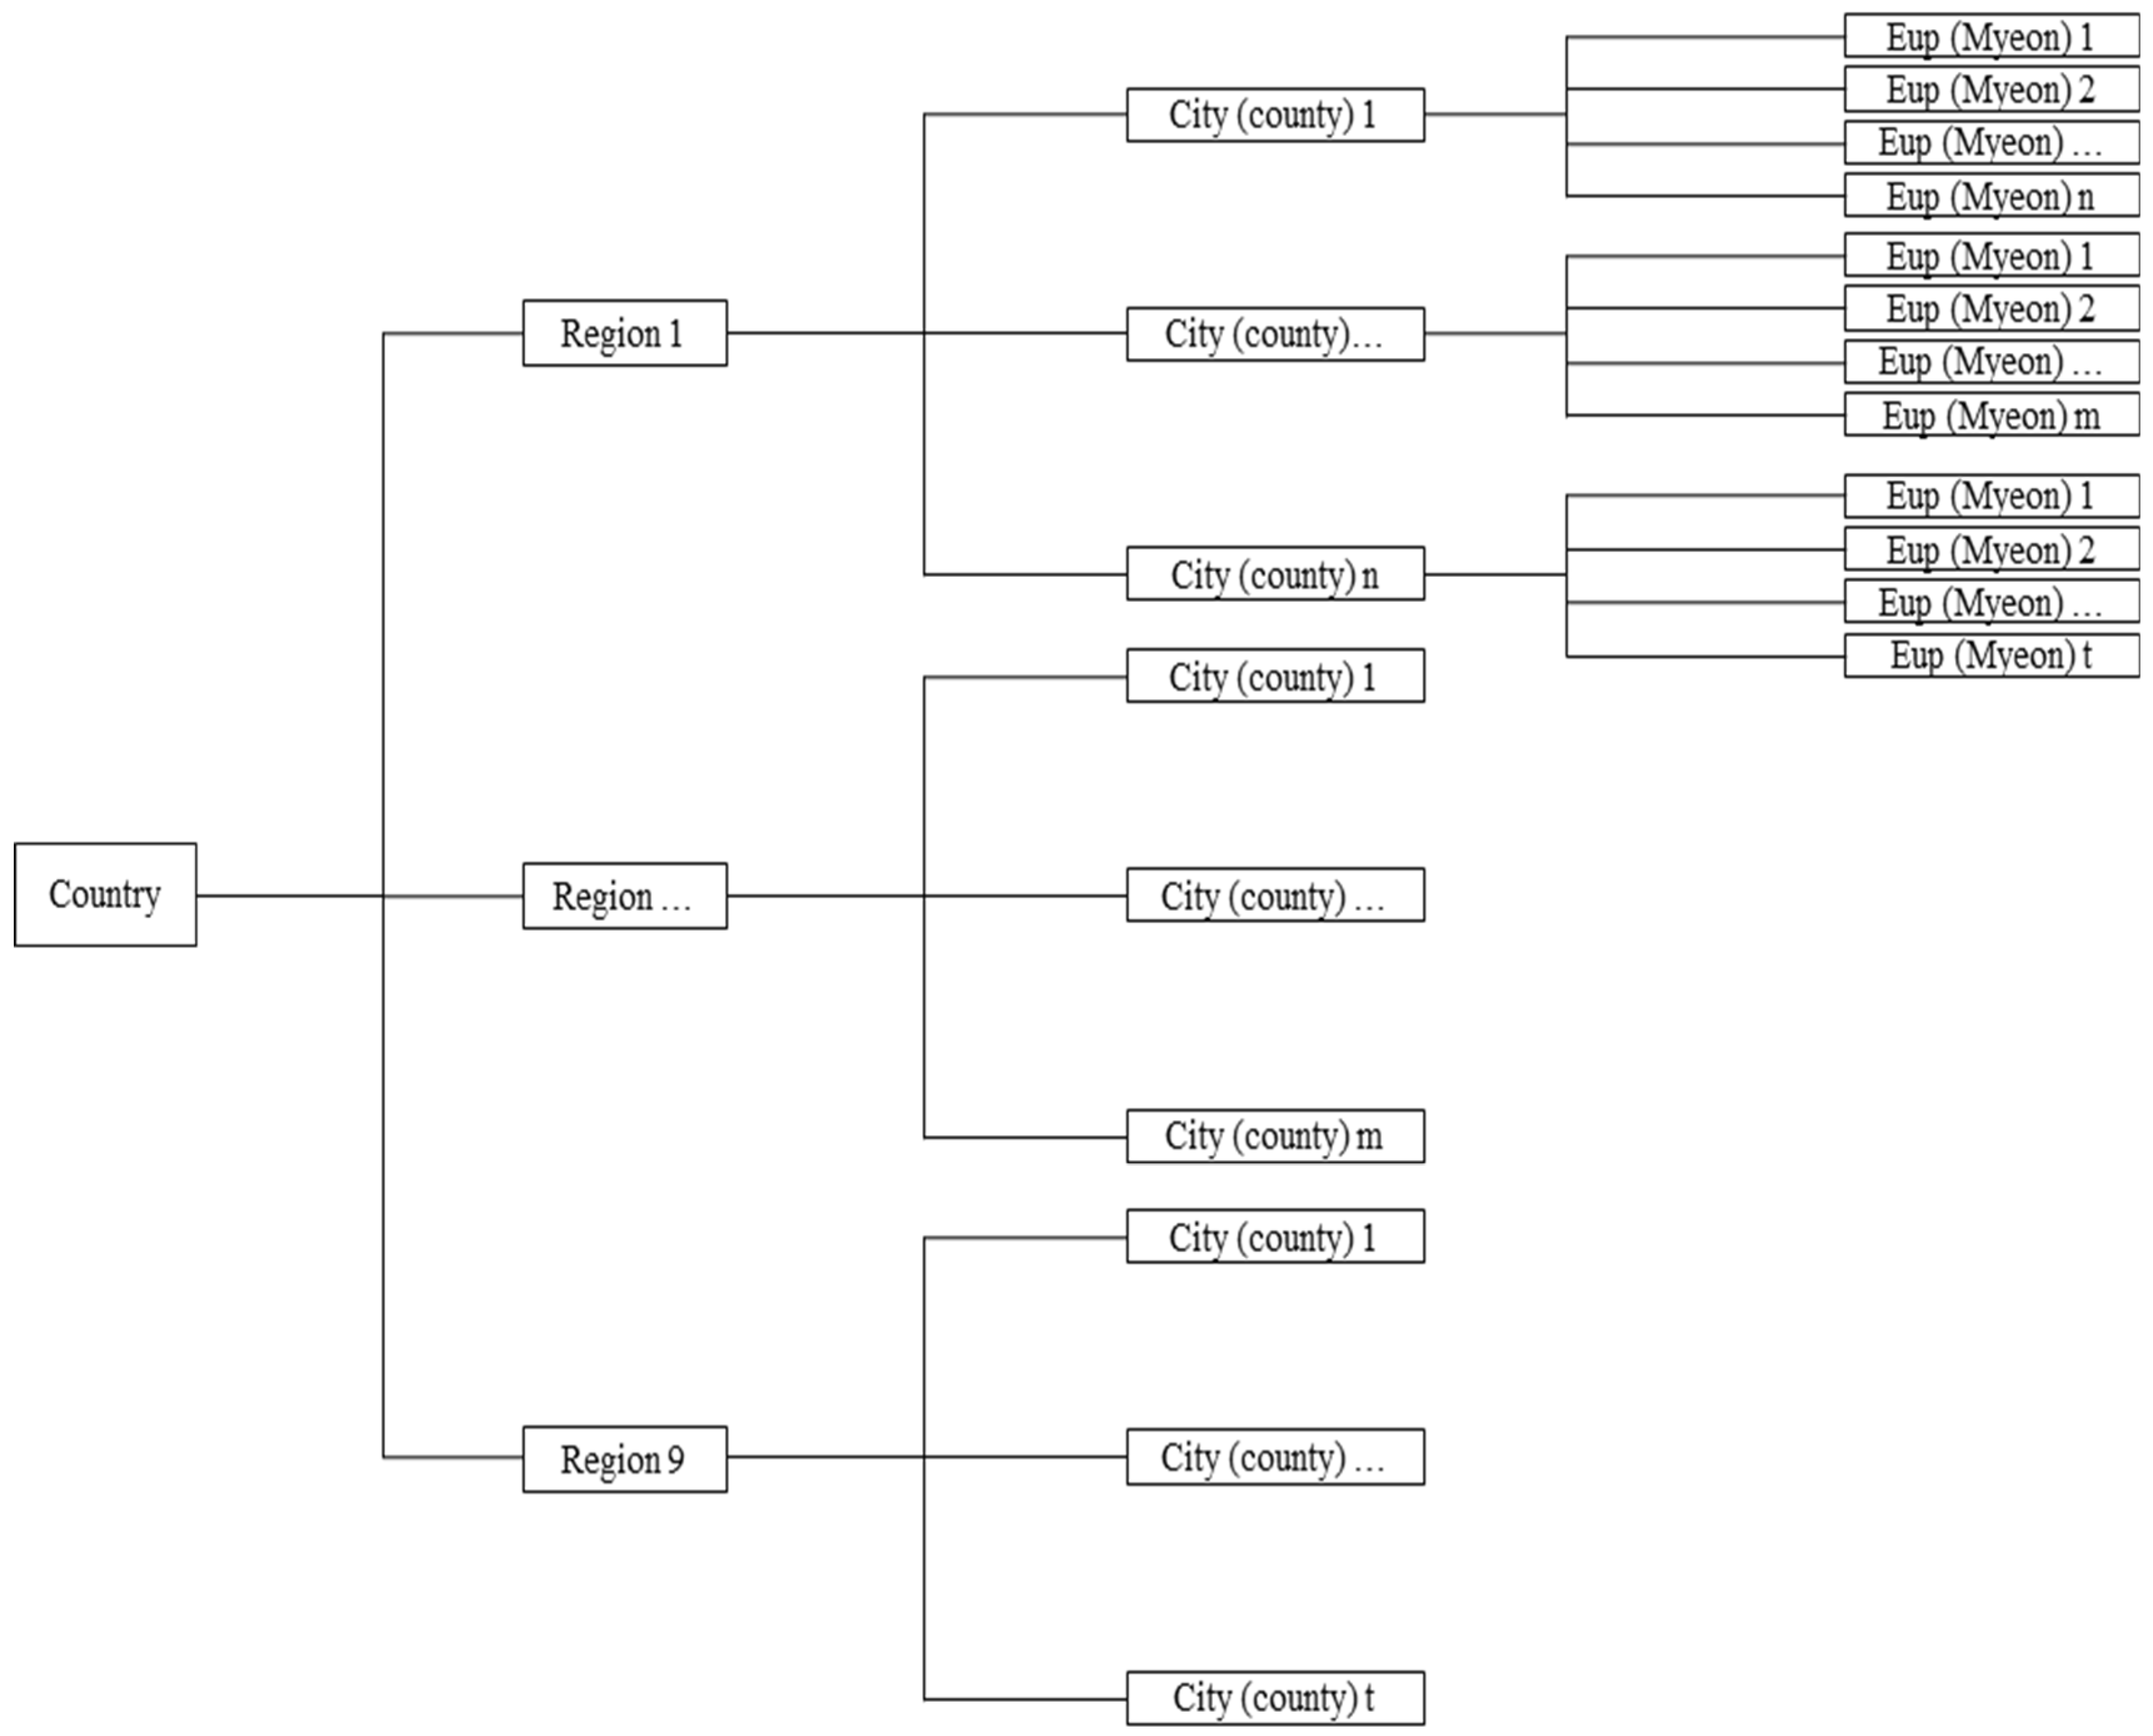
In the administrative division of South Korea, the country has been divided into one special municipality (Seoul), one special autonomous city (Sejong), six metropolitan cities, eight provinces, and one special self-governing province (Jeju). The primary study areas were the rural areas throughout Korea at the Eup and Myeon levels. The basic research object of this article is the administrative area at the Eup, Myeon level, not the most extreme unit Ri. This is because the scale of Ri is too small, and in the context of low birth rates and aging, the disappearance of Ri is also common. The future development trend of rural areas is to concentrate in a central area, so this paper takes Eup, Myeon rural area as the research unit. However, considering that there are few or no rural areas included in special and metropolitan cities, this study considers the province as the benchmark, based on its geographical location and historical evolution, and includes special and metropolitan cities in the province. South Korea was divided into nine first-level regions: Gyeonggi, Gangwon, Chungbuk, Chungnam, Gyeongbuk, Gyeongnam, Jeonbuk, Jeonnam, and Jeju; the regional composition is as shown in Table 2. According to the hierarchical structure of region-city (county)-Eup (Myeon), as shown in Figure 2, the inequality in the industrial economic development levels of each first-level region and the entire country was calculated and analyzed.

2.4.2. Data

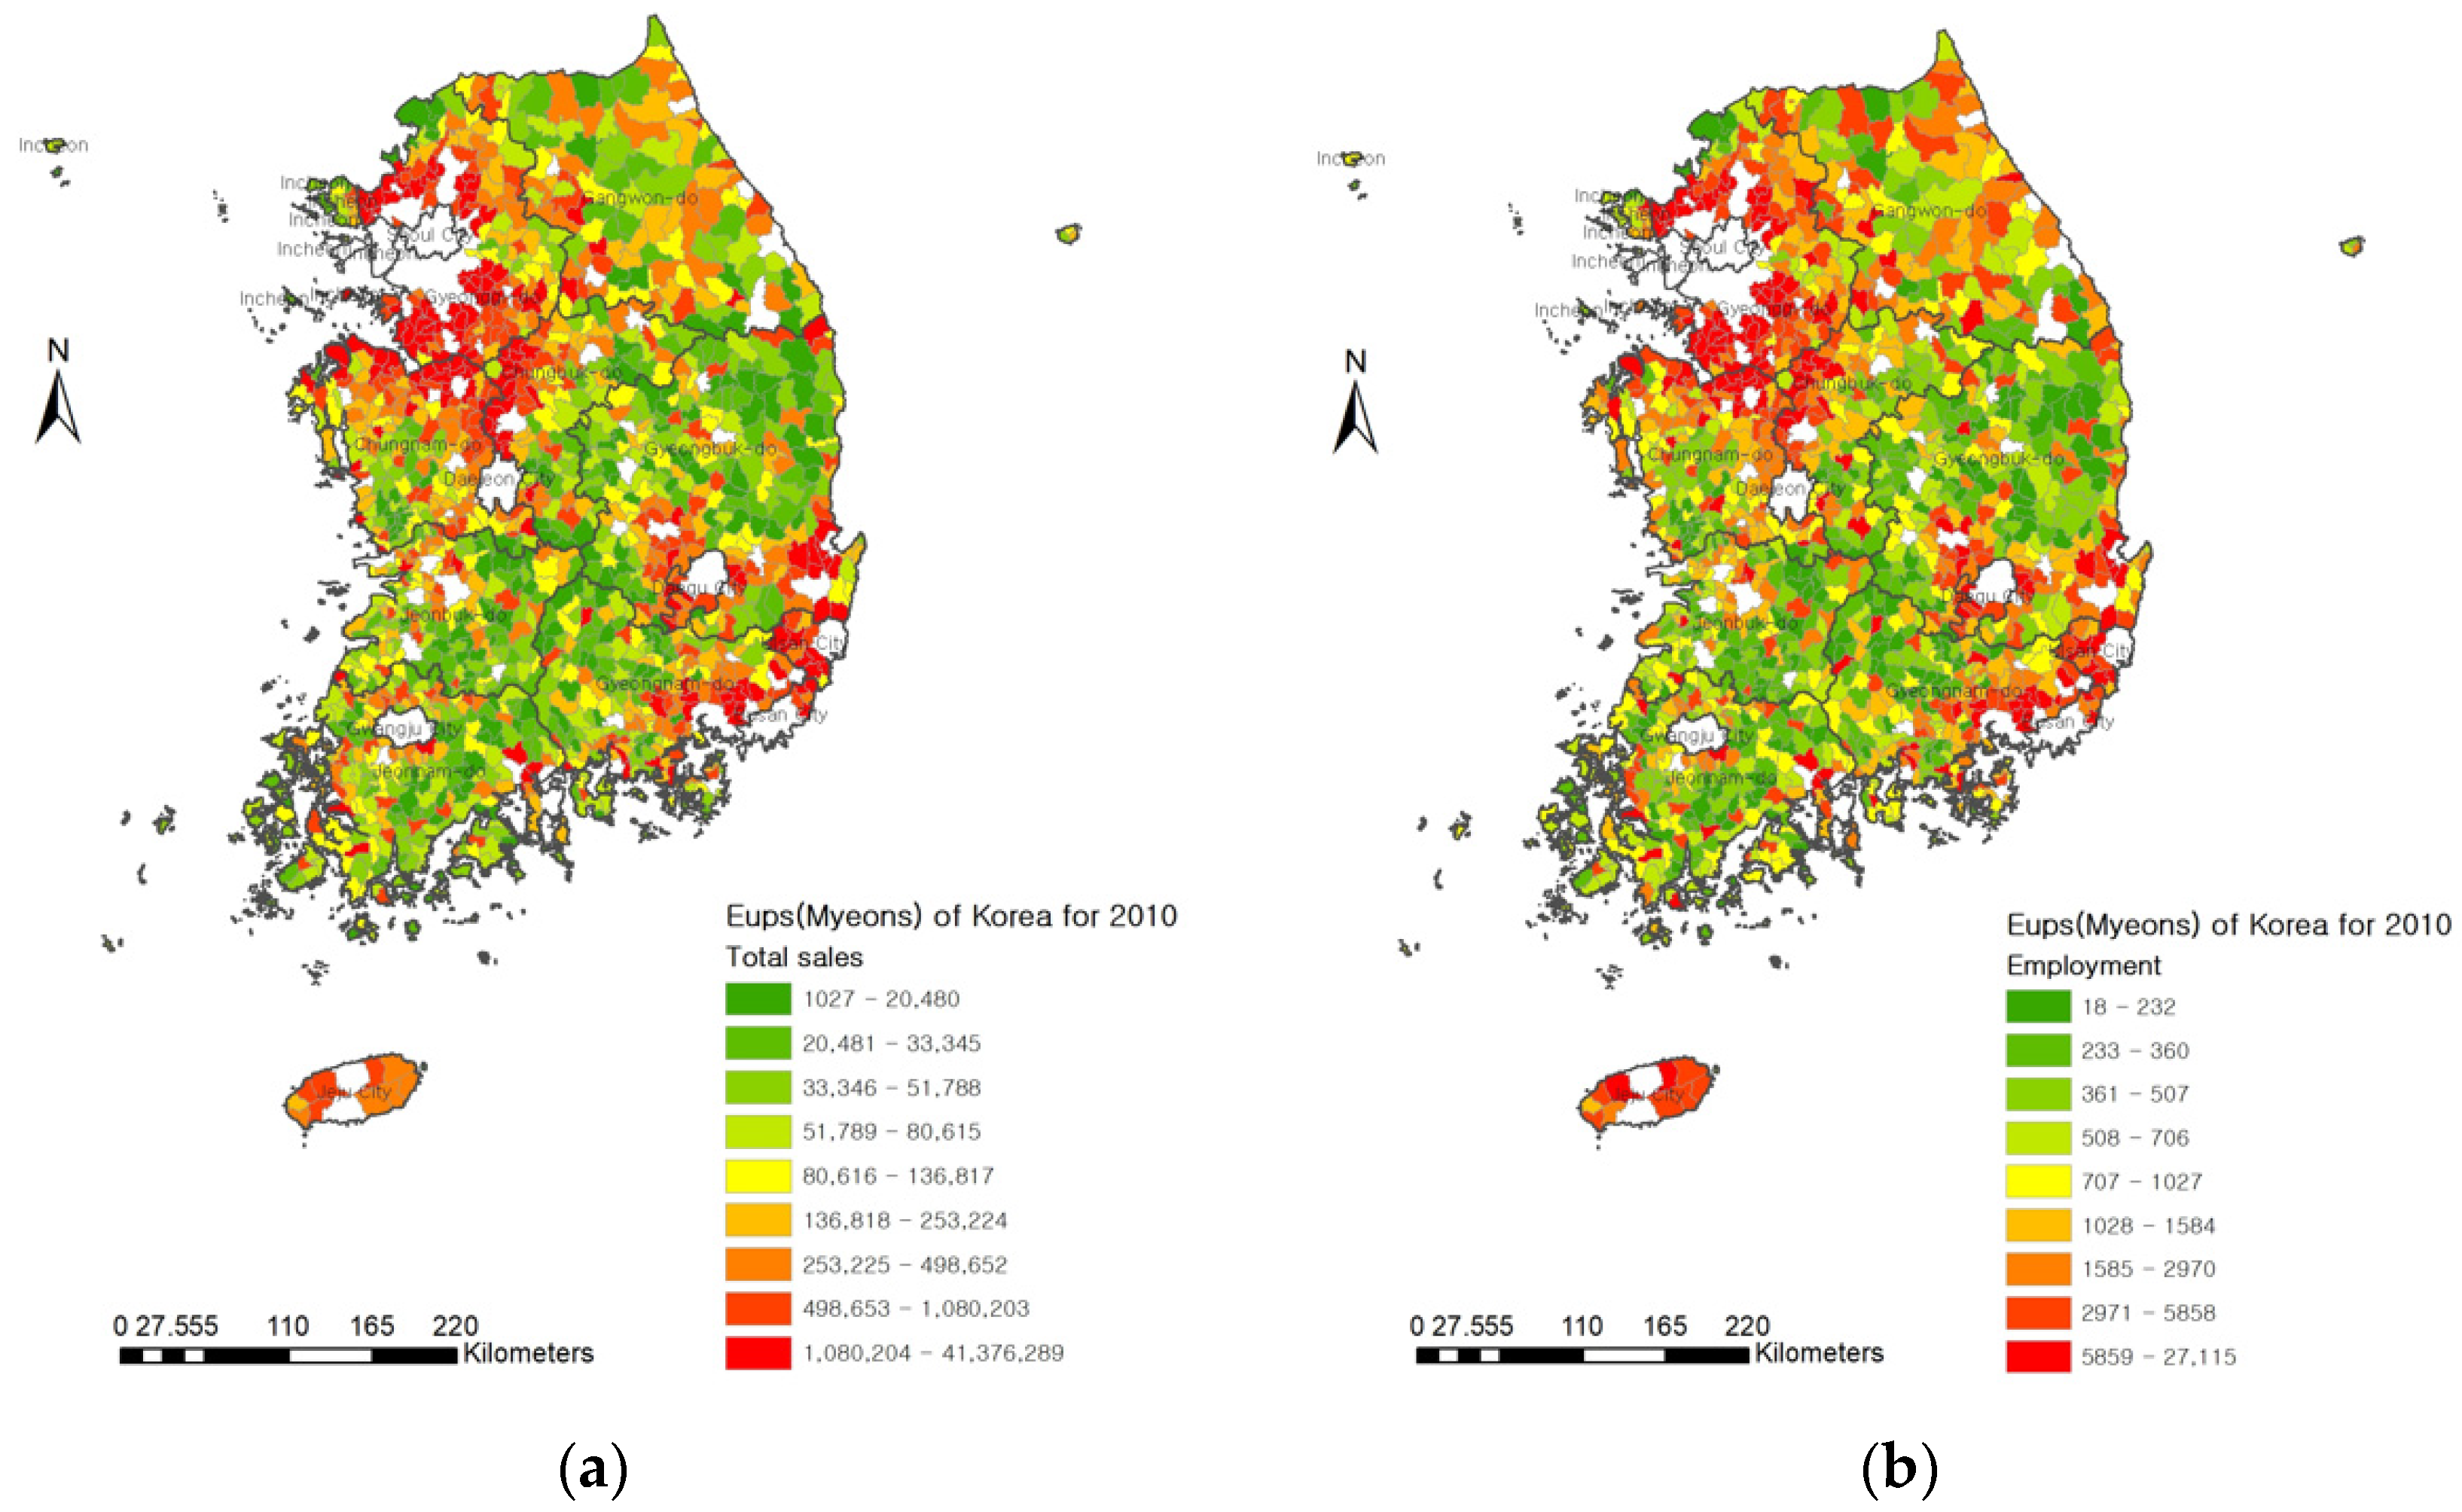
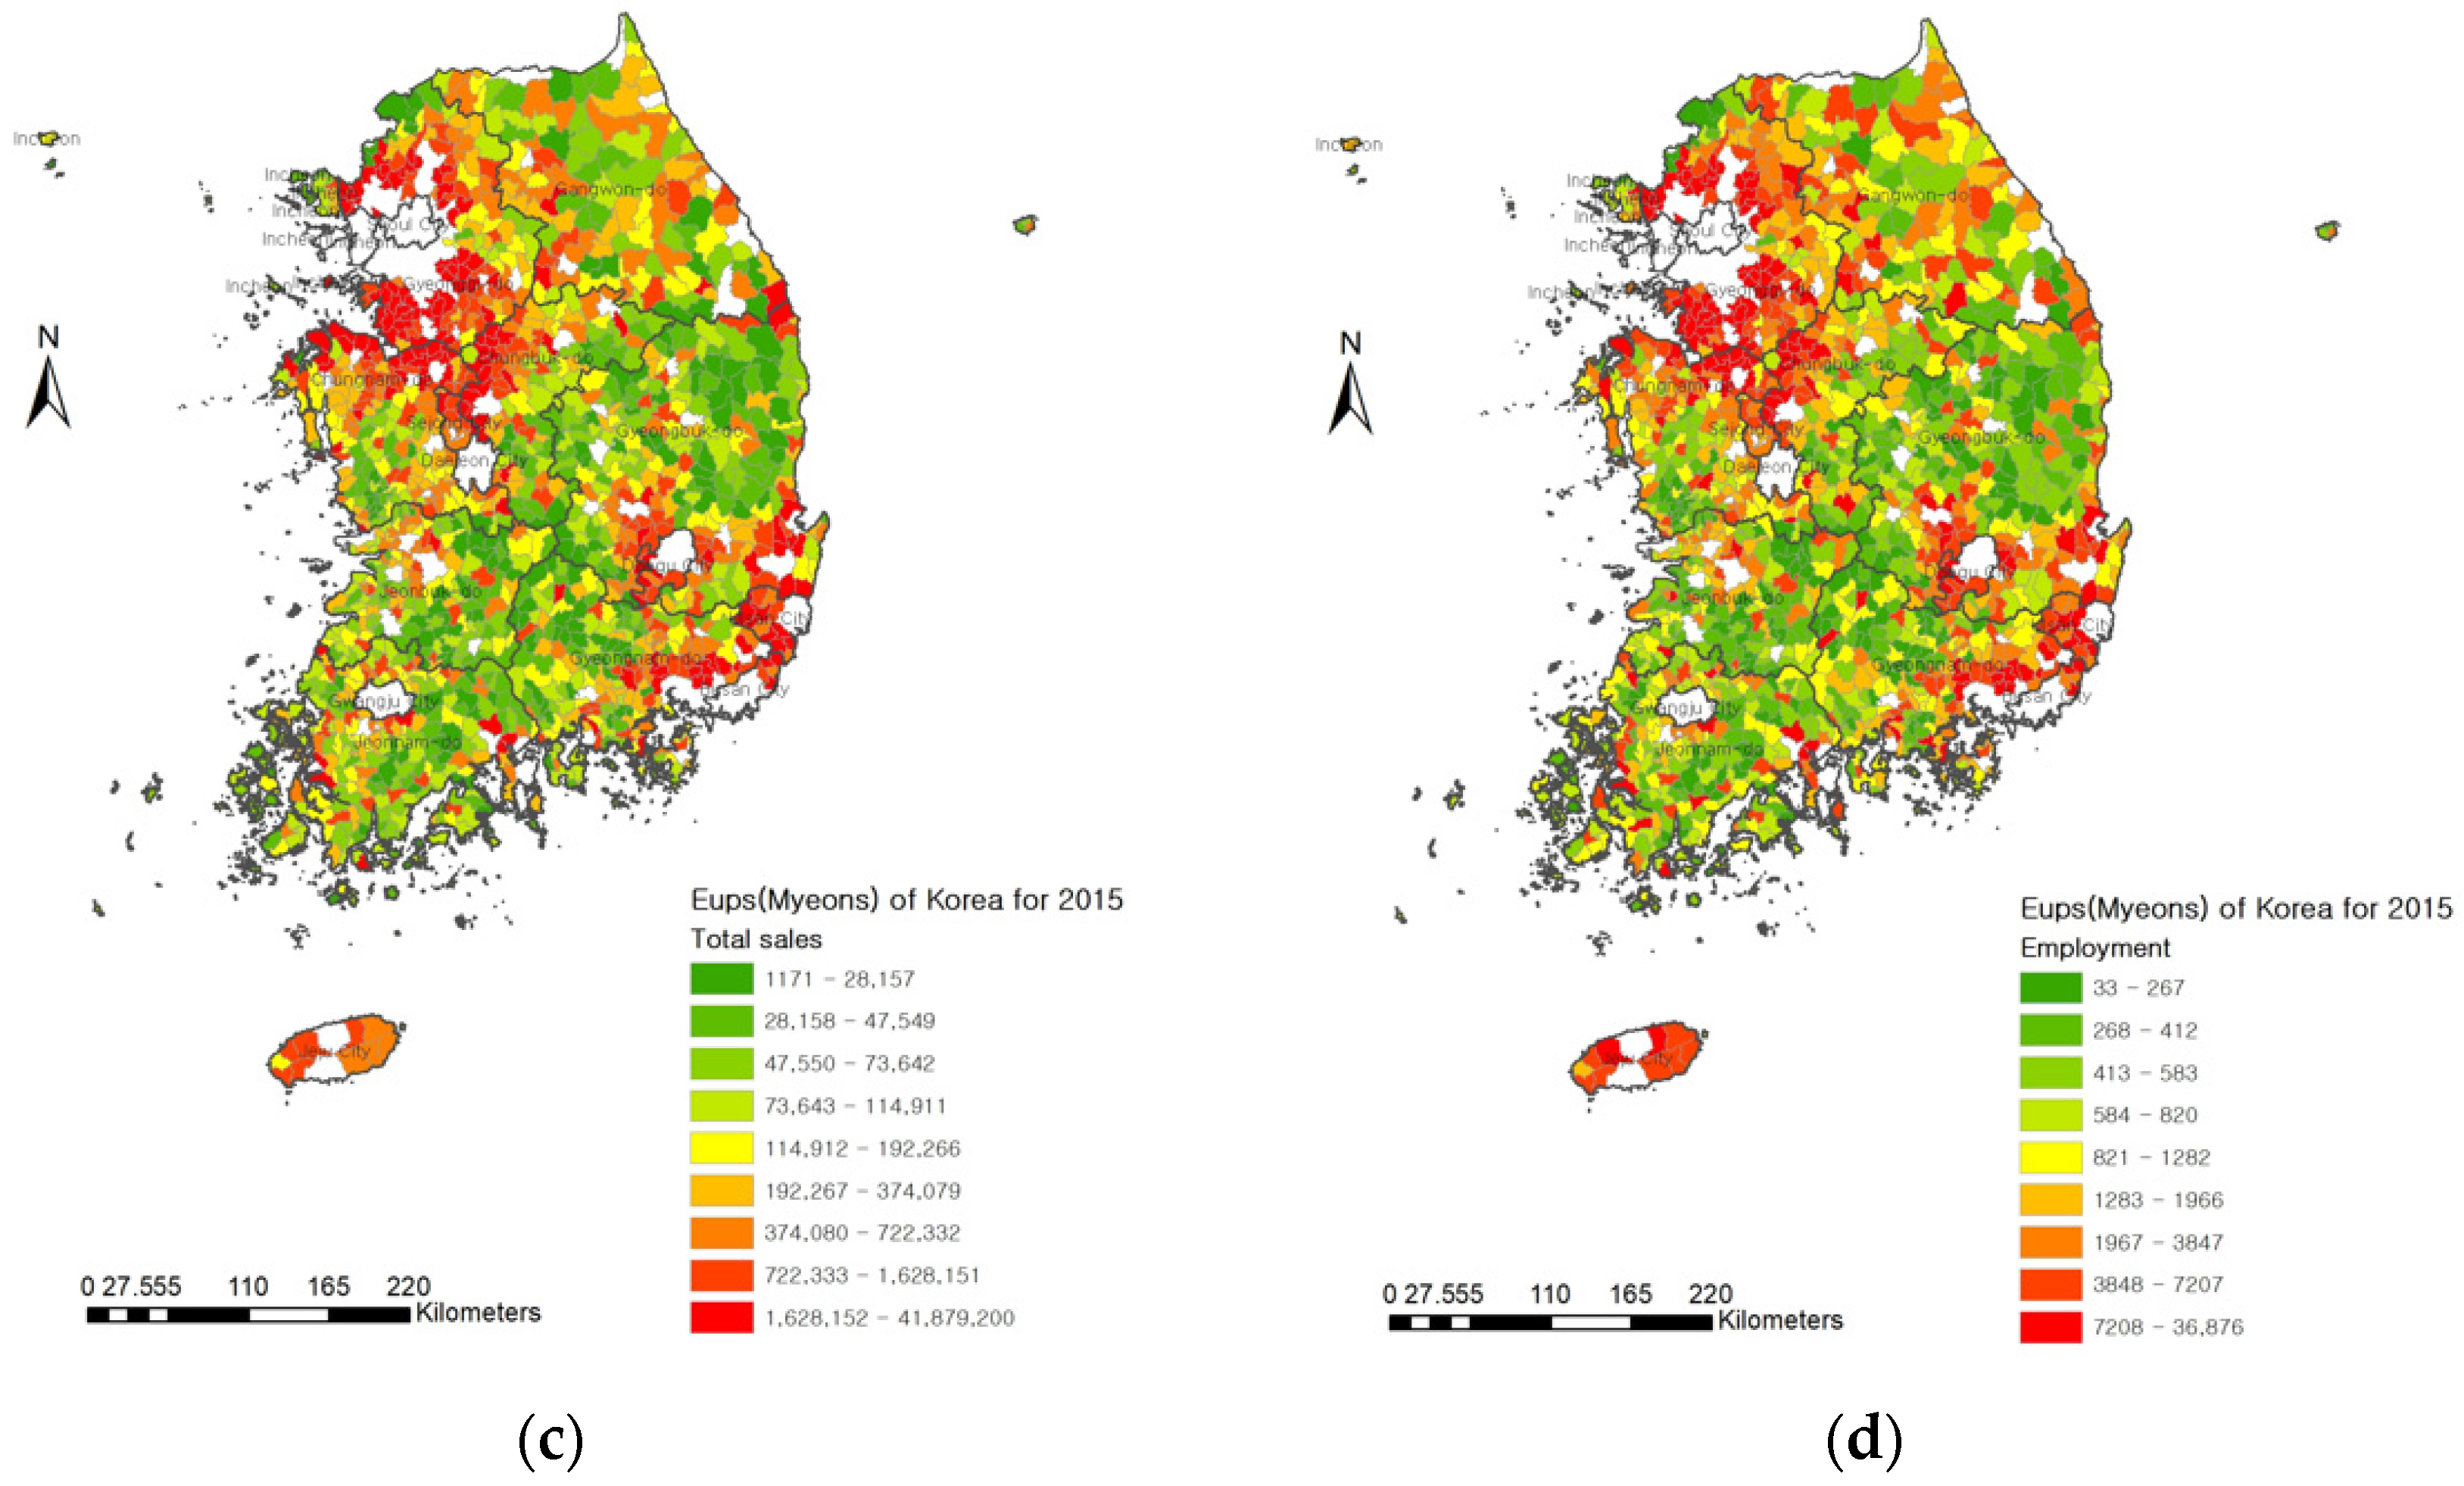
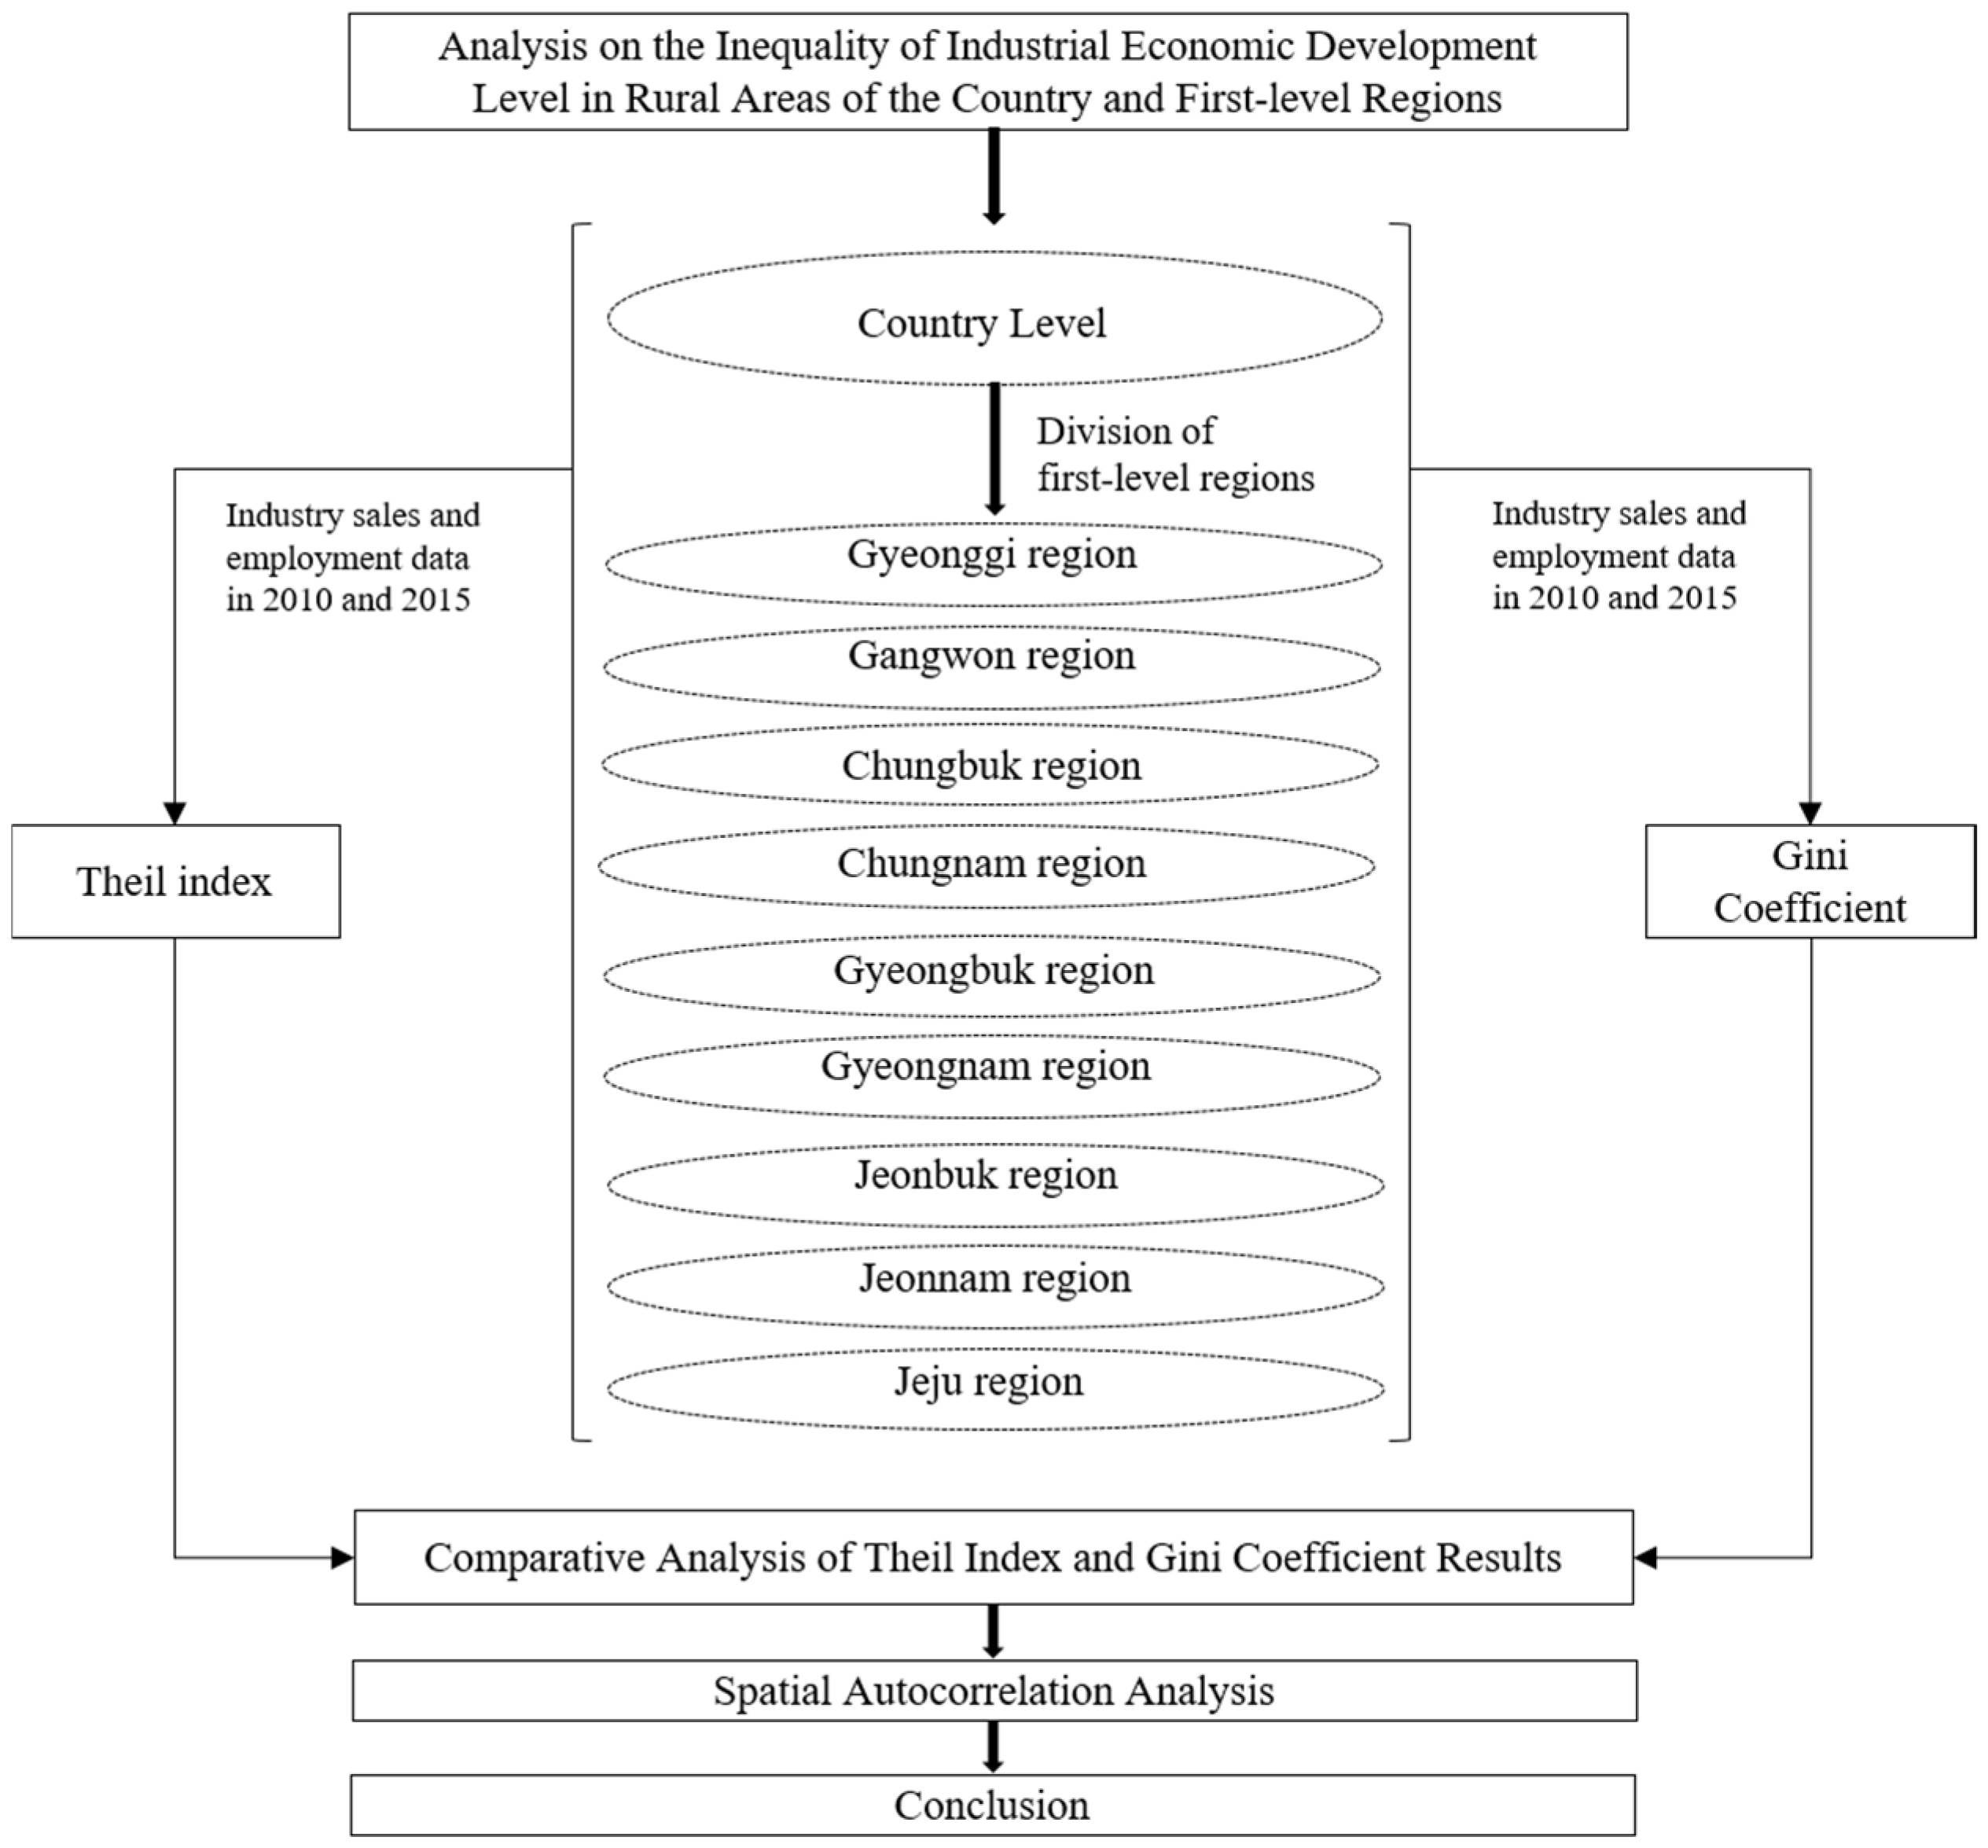
Based on the general economic survey conducted by the Korean Bureau of Statistics in 2010 and 2015, data on industrial sales and employment in rural areas were extracted for each Eup and Myeon. The inequality in industrial economic development levels in rural areas was examined by matching the degree of employment and industrial sales. Before this calculation, descriptive statistical analysis was performed on the data (Table 3). The number of Eups and Myeons in Korea in 2010 and 2015 were 1408 and 1407, respectively, which is not consistent. However, owing to the division of the first-level regions being the same for both years, the difference reflects only an internal change and reorganization of some Eups or Myeons. Therefore, this difference had little effect on the measurement results, which could be compared and analyzed. The distribution of sales and employment for 2010 and 2015 are shown in Figure 3. For 2010, sales and employment in the areas around the Capital Area, Daegu, Ulsan, and Busan Metropolitan City showed high-value distribution. The distribution of sales and employment in 2015 was similar to that in 2010. The research path is shown in Figure 4:

3. Results and Discussion

3.1. Analysis of the Inequality in Industrial Economic Development Levels of the First-Level Regions

3.1.1. Analysis of Regions with High Inequality in Industrial Economic Development Levels

The inequality levels of industrial economic development in the Chungnam and Gyeongnam regions were relatively high, and the Theil-L index and Gini coefficient are shown in Table 4. According to the Theil index: for 2010, the Theil index of the Chungnam region was the largest at 0.191; the contributions of within-city and between-city components were 47.35% and 52.65%, respectively, indicating that although between-city inequality exists in this region, there is also a considerable amount of within-city inequality. The Theil index of the Gyeongnam region was 0.143, ranking second. For 2015, the Theil index of Chungnam region was 0.119; the contribution of the within-city component decreased slightly to 45.59%, and that of the between-city component increased slightly to 54.41%, indicating that the degree of narrowing of inequality differences within cities is slightly larger than that between cities. Compared with 2010, the overall inequality was narrowing, and a potential reason for this finding is that the establishment of Sejong City injected new vitality into the region and promoted the balanced development of the region. However, the overall inequality in the level of industrial economic development in rural areas of the Chungnam region remained large. Formulation of relevant policies to narrow the gap in inequality levels and promote balanced development of the regional industrial economy is still necessary.
According to the Gini coefficient: for 2010, the Gini coefficient of Chungnam was 0.513, indicating that there is a severe inequality in the level of industrial economic development among rural areas in the Chungnam region. The Gini coefficient for 2015 was 0.409, although lower than that in 2010, the value remained at a level where inequality was large. For the Gyeongnam region, the Gini coefficient for 2010 was 0.438, indicating that the inequality in the level of industrial economic development in the rural areas of the Gyeongnam region in 2010 was large. In 2015, the Gini coefficient was 0.364, inequality gaps narrowed, and the inequality level was at a reasonably balanced stage. In general, the Chungnam and Gyeongnam regions ranked first and second, respectively, for inequality levels in 2010 and 2015, and the results of the Theil index and Gini coefficient are consistent.

3.1.2. Analysis of Regions with Middle Inequality in Industrial Economic Development Levels

Changes in the inequality of the industrial economic development levels of the five regions are similar, as shown in Table 5. According to the Theil index, for 2010, the Theil indices of the Gyeonggi, Chungbuk, Gyeongbuk, Jeonbuk, and Jeonnam regions were 0.072, 0.066, 0.065, 0.091, and 0.080, respectively. In 2015, the Theil indices of the Gyeonggi, Chungbuk, Gyeongbuk, Jeonbuk, and Jeonnam regions were 0.058, 0.056, 0.041, 0.056, and 0.038, respectively, with similar inequality levels. Compared with 2010, the inequality of both within-city and between-city components narrowed for the Gyeonggi region. However, the contribution of the between-city component decreased slightly, and that of the within-city component increased slightly. This shows that compared with the level of inequality within cities, the level of inequality between cities has narrowed to a great extent. For the Chungbuk region, the within-city inequalities in 2010 and 2015 were both 0.037 and the between-city inequalities were 0.029 and 0.019, respectively, indicating that the reduction in between-city inequality mainly caused the narrowing of differences in the total regional inequality. For the Gyeongbuk region, the inequality components within-city and between-city were reduced, but their contributions did not change significantly. This shows that, in this region, the inequality owing to these components had reduced to the same extent. For the Jeonbuk region, the inequality gaps within and between cities also narrowed; however, the contribution of the components between-city decreased whereas that of the within-city component increased. This indicates that inequality between cities has narrowed to a greater extent than within cities. For the Jeonnam region, although the inequalities of the within-city and between-city components decreased, their contributions were different, showing an increase and decrease, respectively. This demonstrates that inequality between cities narrowed more than within cities. In general, the inequality gap between cities narrowed more than within cities for most regions.
For the Gyeonggi region, the Gini coefficients for 2010 and 2015 were 0.319 and 0.284, respectively, which means that the overall regional inequality narrowed. The inequality level narrowed from a reasonably balanced stage to a relatively balanced stage. For the Chungbuk region, the Gini coefficients for 2010 and 2015 were 0.301 and 0.286, respectively. Consequently, the inequality level narrowed from a reasonably balanced stage to a relatively balanced stage. For the Gyeongbuk region, the Gini coefficients for 2010 and 2015 were 0.305 and 0.241, respectively. The inequality level gap narrowed from a reasonably balanced stage to a relatively balanced stage. For the Jeonbuk region, the Gini coefficients for 2010 and 2015 were 0.354 and 0.281, respectively. The inequality level narrowed from a reasonably balanced stage to a relatively balanced stage. Finally, for the Jeonnam region, the Gini coefficients for 2010 and 2015 were 0.333 and 0.232, respectively, with inequality levels improving from a reasonably balanced to a relatively balanced stage. In general, inequality in industrial economic development among rural areas in the five regions of Gyeonggi, Chungbuk, Gyeongbuk, Jeonbuk, and Jeonnam was similar. The inequality level in 2010 was at a reasonably balanced stage, and in 2015 was at a relatively balanced stage. The order of inequality levels in 2010 was Jeonbuk > Jeonnam > Gyeonggi > Chungbuk ≥ Gyeongbuk, and in 2015 it was Gyeonggi ≥ Chungbuk ≥ Jeonbuk > Gyeongbuk > Jeonnam.

3.1.3. Analysis of Regions with Low Inequality in Industrial Economic Development Levels

Table 6 lists the inequality in the level of industrial economic development in the rural areas of the Gangwon and Jeju regions. Among the nine regions, the total regional inequality level of the other regions showed a downward trend; in contrast, the Gangwon region showed an upward trend. The Gini coefficients for 2010 and 2015 were 0.236 and 0.266, respectively. Although the inequality level was relatively balanced, the Gini coefficient value increased slightly. From the Theil index decomposition results, the inequality of within-city and between-city components expanded, with their contributions increasing to 67.3% and decreasing to 32.7%, respectively. This shows that the level of inequality within cities expanded to a higher degree than between cities. The inequality in the level of industrial economic development in the rural areas of the Jeju region was the smallest. The Gini coefficients for 2010 and 2015 were 0.148 and 0.111, respectively, which are less than 0.2, which is the stage of very balanced inequality. The Theil index results showed that the total inequality primarily originates from city differences. This is because there are only two cities in the Jeju region.

3.2. Analysis of Inequality in Industrial Economic Development Levels among Rural Areas of South Korea

In this study, the Gini coefficient and Theil-L index were used to measure inequality in the level of industrial economic development in the rural areas of South Korea. When using the Theil index for calculation, the hierarchical structure used was “country–region (first-level)”. The advantage of the Theil index is that it can help decompose and analyze total inequality; however, only the relative size of the inequality can be identified, and the specific stage of the inequality level cannot be determined. The advantage of the Gini coefficient is that it can be divided into five intervals which allows a comparison of different stages of inequality from a very balanced economic development to severe inequality levels. The results of the Theil-L index and Gini coefficient for South Korea are presented in Table 7. The Gini coefficients for 2010 and 2015 were 0.401 and 0.334, respectively. According to the interval division of the Gini coefficient, in 2010, the inequality of the industrial economic development level among rural areas in the entire country was large; in 2015, the Gini coefficient dropped to 0.334, and the inequality level was at a reasonably balanced stage. In other words, compared with 2010, in 2015, the inequality in the level of industrial economic development among rural areas in the entire country shows a downward trend, and the inequality level has changed from large to a reasonably balanced stage, realizing a qualitative change. The Theil indices for 2010 and 2015 were 0.019 and 0.013, respectively. Overall, compared with 2010, inequality in the level of industrial economic development among rural areas of South Korea in 2015 is gradually reducing.

3.3. Spatial Autocorrelation Analysis of Sales and Employment in Rural Areas of South Korea

3.3.1. Global Moran’s I Analysis of Sales and Employment

Table 8 shows the Global Moran’s I result for sales and employment. In 2010, the global Moran’s I of sales in Korea’s Eup and Myeon areas was 0.136, indicating a positive spatial correlation (clustered) of sales. The global Moran’s I of employment was 0.310, indicating that employment has a positive spatial correlation (clustered). In 2015, the global Moran’s I of sales in the Eup and Myeon areas of South Korea was 0.201, indicating a positive spatial correlation (clustered) of sales. In contrast, the global Moran’s I of employment was 0.346, and there was a positive spatial correlation (clustered) of employment. A vertical and horizontal comparison of 2010 and 2015 shows a positive spatial correlation between sales and employment distribution in rural South Korea in 2010. However, the spatial correlation of employment distribution was stronger. In addition, 2015 showed a positive spatial correlation between sales and employment. As a result, the spatial correlation of employment distribution was stronger. Compared to 2010, the spatial correlation of sales and employment distribution improved in 2015.

3.3.2. Anselin Local Moran’s I Analysis of Sales and Employment (ALMI)

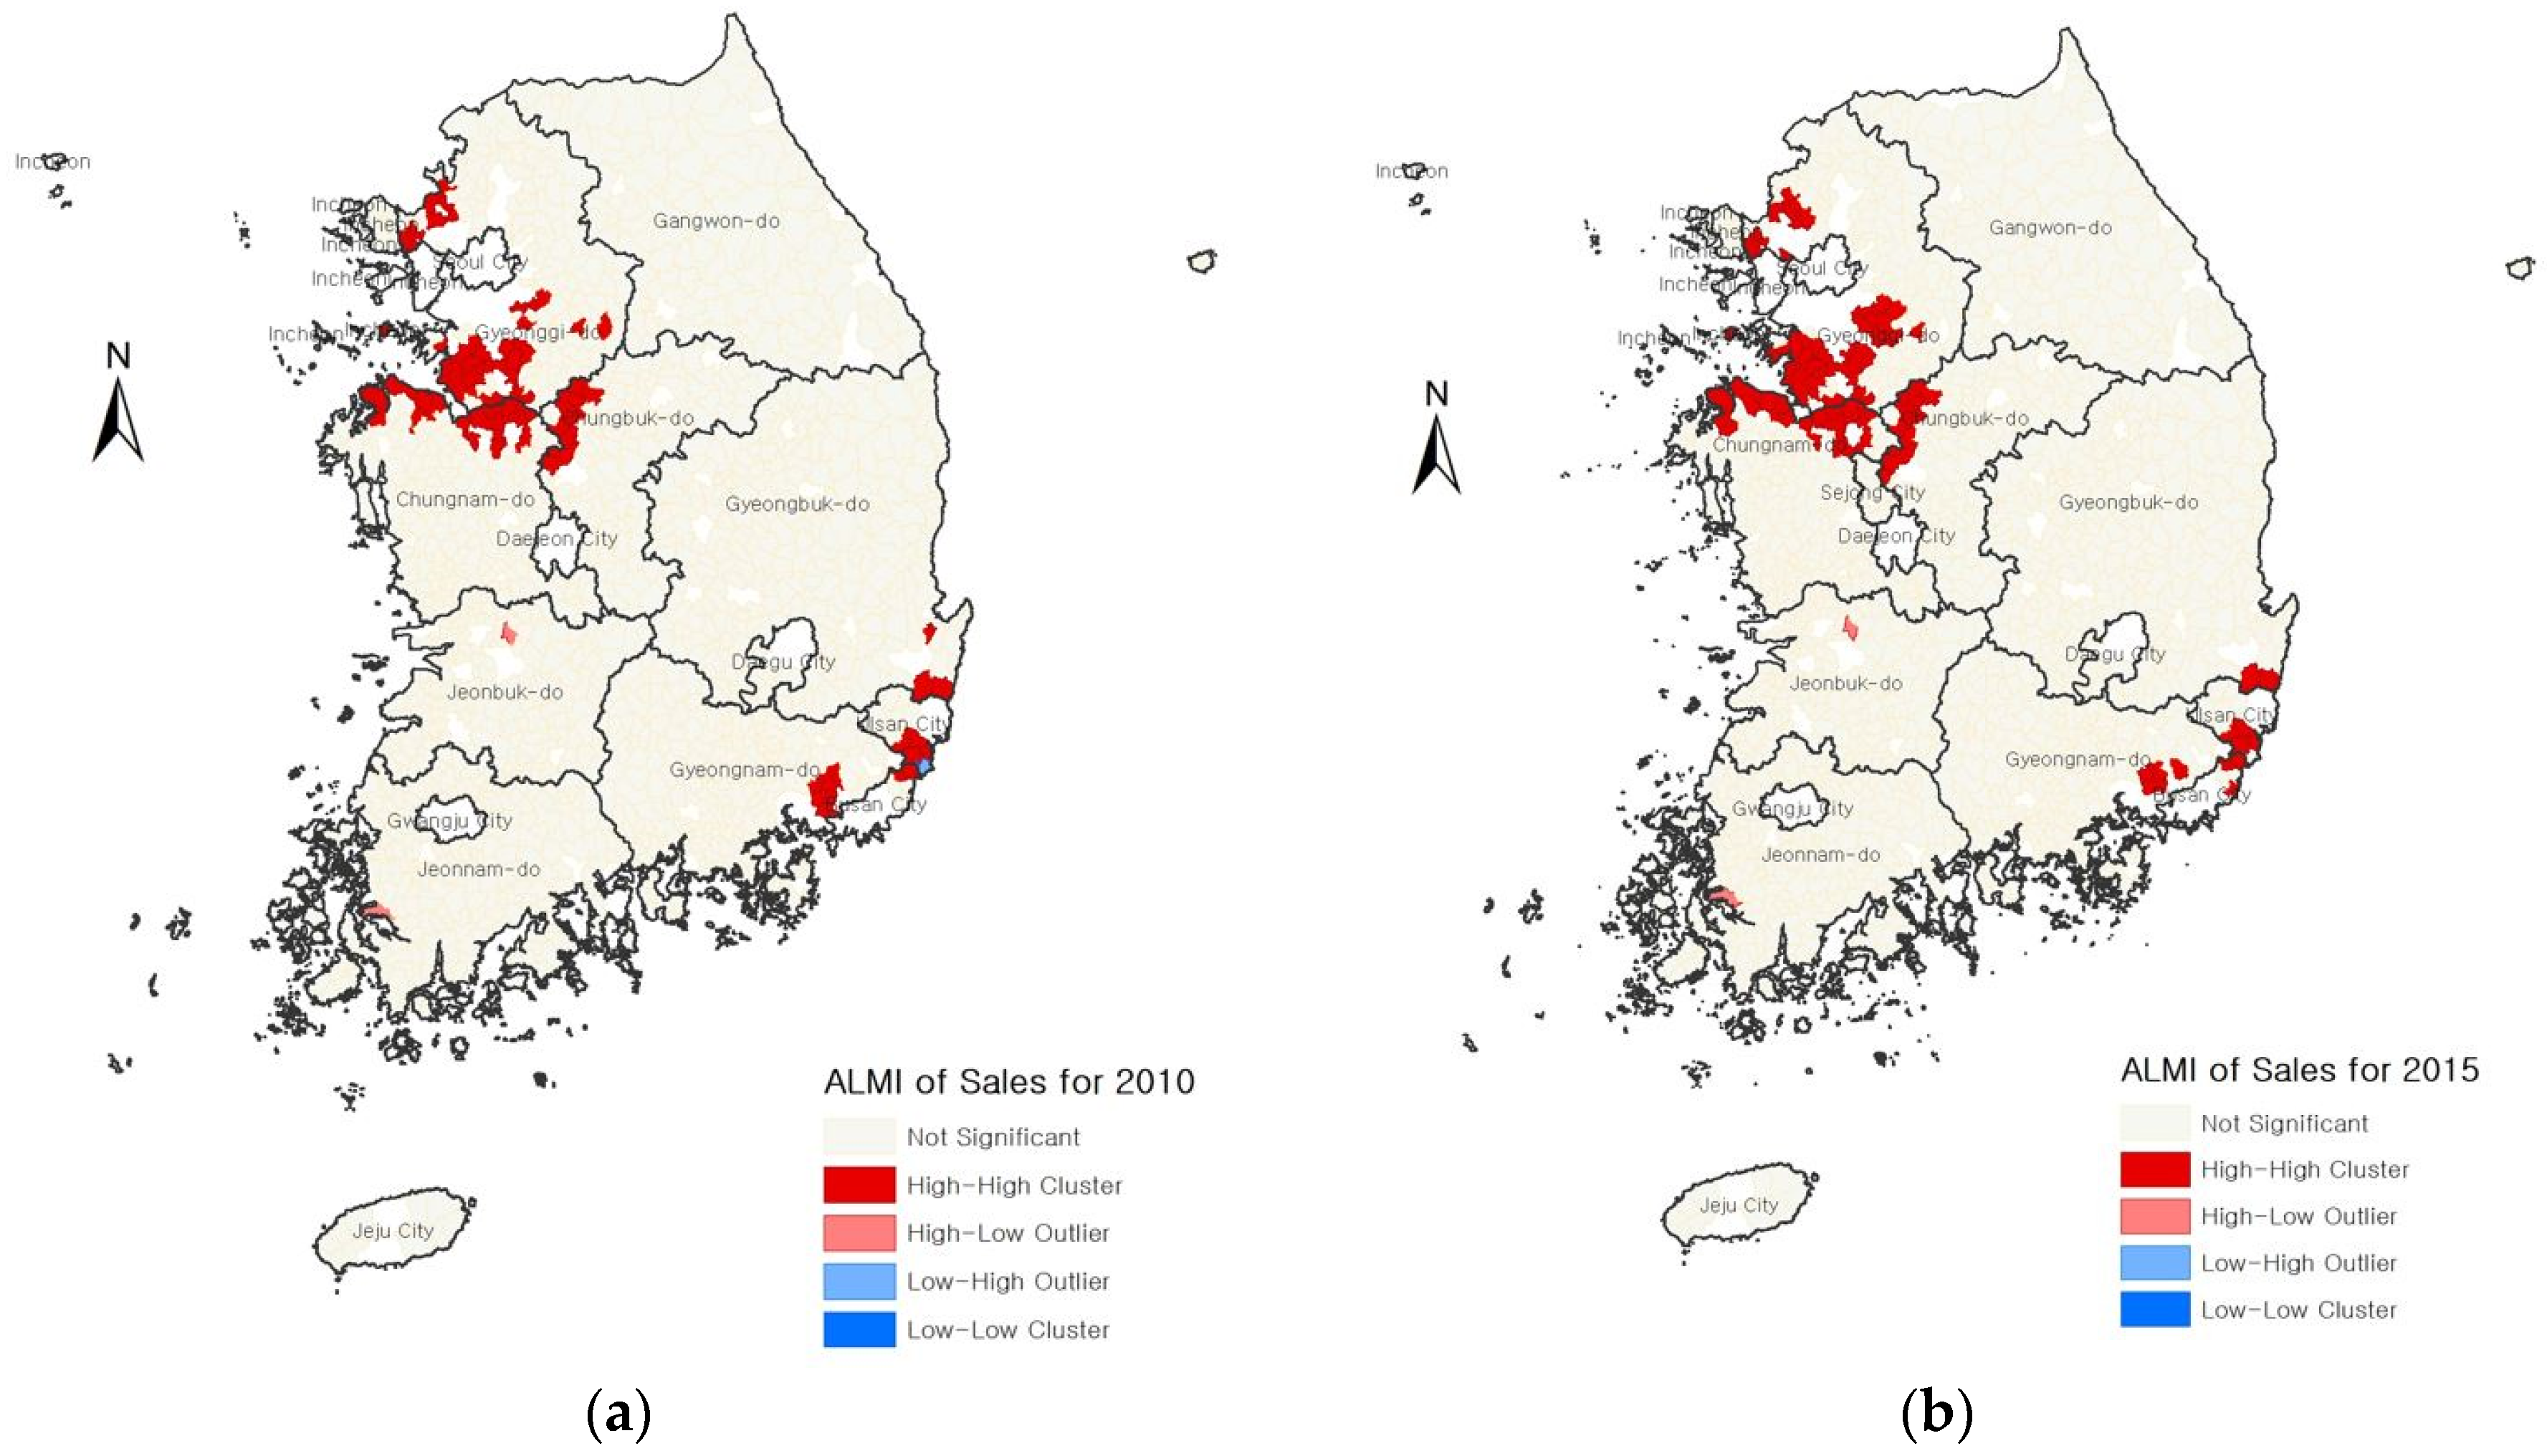
According to the Global Moran’s I results, the distribution of sales and employment showed spatial clustering. To understand the specific areas where clustering occurred, a local Moran’s I analysis was required. The analysis results for the ALMI of sales for 2010 and 2015 are shown in Figure 5. In 2010, 34 rural areas in Incheon and Gyeonggi-do showed HH clustering. A total of 28 rural areas showed HH clustering around Gyeonggi-do, of which 10 were located in northwestern Chungbuk and 18 in northern Chungnam, which is adjacent to Gyeonggi-do. In addition, the 15 rural areas in and around Ulsan and Busan Metropolitan City showed HH clustering. Seventy-seven HH clustered areas were found, and there was no clustering or outliers in the Gangwon and Jeju regions.
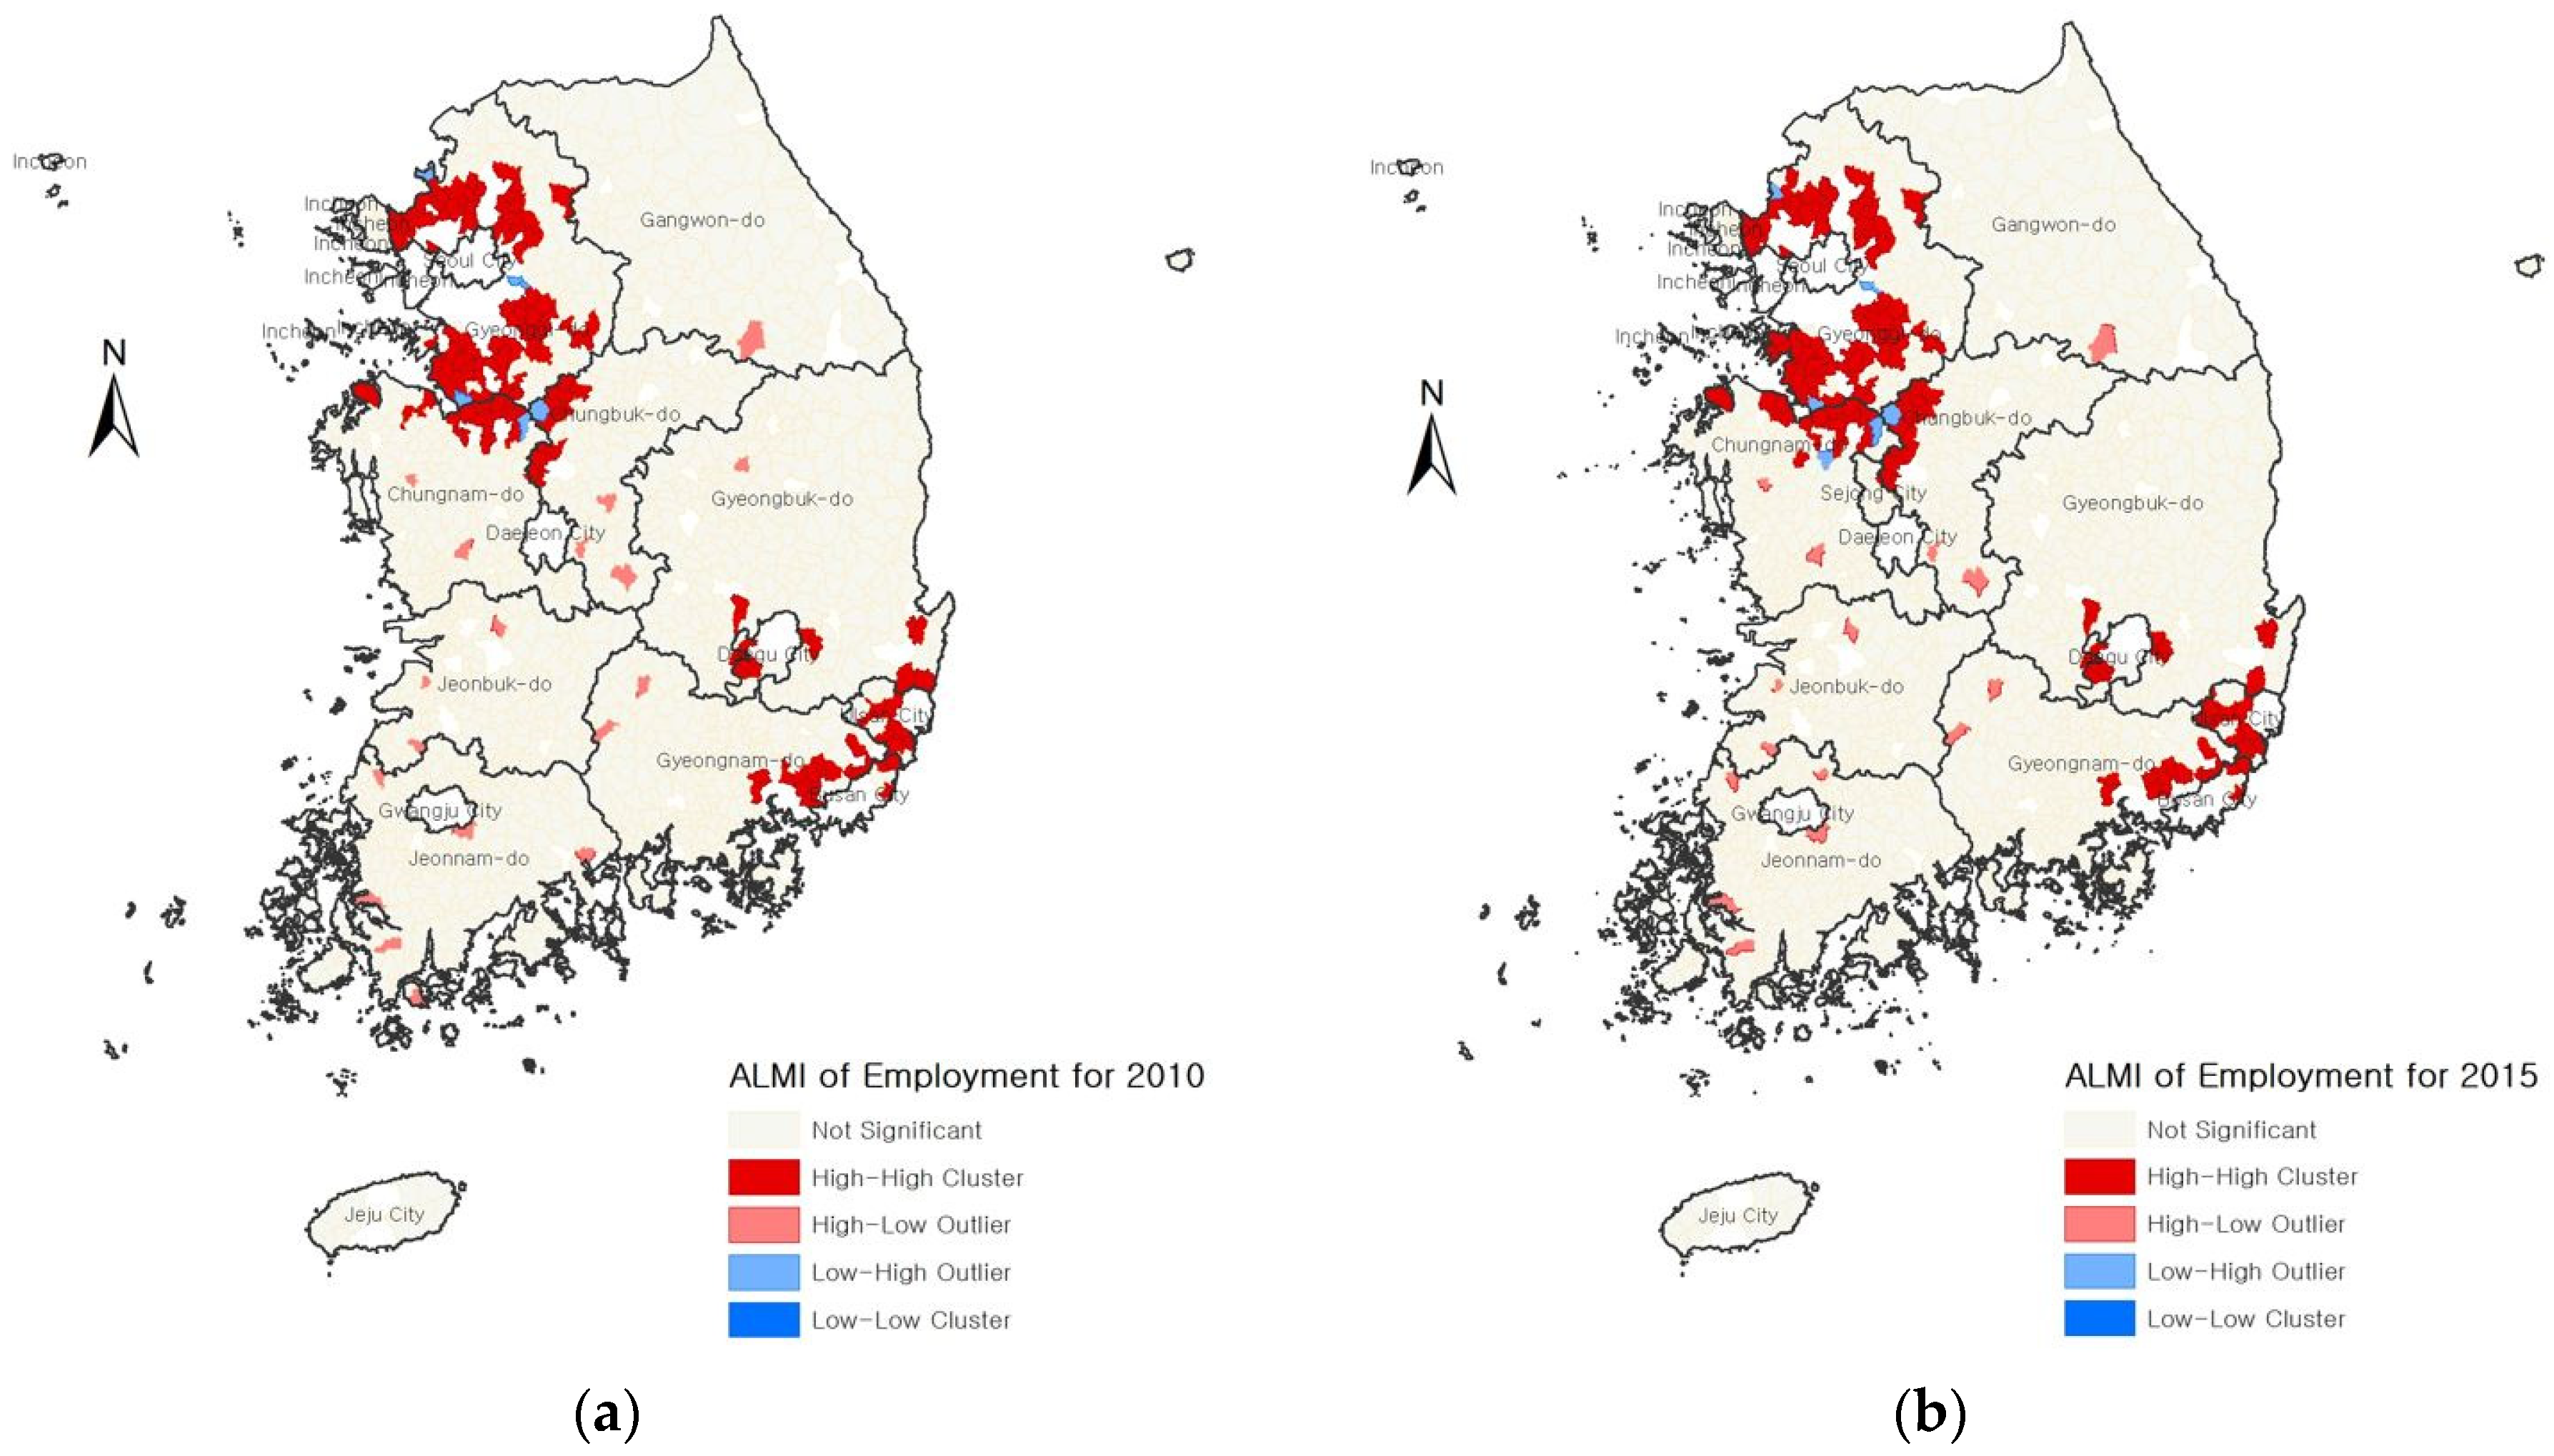
The analysis results for the ALMI of employment for 2010 and 2015 are shown in Figure 6. In 2010, 69 rural areas in Gyeonggi-do, located around Seoul and Incheon, showed HH clustering. A total of 27 rural areas showed HH clustering around Gyeonggi-do, of which 11 were located in northwestern Chungbuk and 16 in northern Chungnam, which bordered Gyeonggi-do, and there were a few LH outliers in the Gyeonggi, Chungbuk, and Chungnam regions. The 36 rural areas in and around Daegu, Ulsan, and Busan Metropolitan City also exhibited HH clustering. A total of 132 HH clustering areas were there, and only the Jeju region showed clustering or outliers. In summary, the spatial clustering of sales and employment was similar, and the degree of clustering tended to increase. Due to the highly developed economy in the Capital Area and metropolitan cities, the economic development in the rural areas in and around the Capital Area, including Daegu, Ulsan, and Busan Metropolitan City, has been positively affected. Thus, it can be concluded that geographic location is one of the factors affecting the economic development of rural areas.
Combining the results of the Theil index and Gini coefficient, the reason for the large inequality in the level of economic development in rural areas of the Chungnam region is likely to be due to the fact that the northern Chungnam rural areas are adjacent to the economically developed Gyeonggi-do, and their economies are positively affected. Whereas the economic development in other rural areas of Chungnam is relatively slow, which leads to a large economic inequality. The inequality in the level of economic development in rural areas of Gyeongnam is reasonably balanced. Since the southeastern rural areas of Gyeongnam are bordered by the economically developed Ulsan and Busan Metropolitan Cities, their economies are positively affected, but the impact may be small. There are many HH clustering areas in Gyeonggi-do, and the inequality in the level of economic development in rural areas of the Gyeonggi region is relatively balanced, indicating that the overall level of economic development in rural areas of the Gyeonggi region is relatively high. The favorable location adjacent to the city of Seoul is one of the main reasons for the rapid economic development. Though there are a few HH clustering areas in northwestern Chungbuk, the inequality in the level of economic development in rural areas of Chungbuk is relatively balanced, indicating that the economic development levels of other rural areas are relatively balanced. There are a few HL Outliers in the Gyeongbuk, Jeonbuk, Jeonnam, and Gangwon regions, and these outliers may become the core of economic development that radiated to the surrounding areas. There are not any clustering or outliers in the rural areas of the Jeju region, which once again verifies that the level of economic development in this region is very balanced.
Compared to existing research, this article mainly has the following two differences. First, the research object is different. Most of the existing research results have elucidated the significant inequalities in population, economy, social welfare, and other aspects between the Capital Area and non-Capital Area, as well as between urban and rural areas. However, research on the inequalities between rural areas is still blank. This article studied the economic development inequality among rural areas in South Korea and its possible influencing factors, which fills in the research gap. Second, the research method is different. Most studies either only use inequality indicators to quantify the level of inequality, or only use spatial autocorrelation analysis to analyze spatial distribution imbalances. This paper combined the two methods skillfully, not only quantifying the level of inequality but also analyzing the causes of inequality from the perspective of spatial distribution. The research results showed that the economic development level of the rural areas around the Capital Area and Metropolitan Cities was much higher than that of others. If the gap level cannot be effectively controlled, the Capital Area will further expand, while rural areas will further decline, and land inequality will further aggravate.

4. Conclusions

The purpose of this study was to analyze whether inequality exists in the level of industrial economic development among the rural areas of Eups and Myeons in South Korea. Furthermore, if this was the case, we aimed to determine the level of this inequality. Whether the distribution of industrial economy was clustered in space? What was the specific clustering situation? To this end, this study considered the rural areas of Eups and Myeons in Korea as the basic research object and extracted the industrial sales and employment data of each rural area for 2010 and 2015 according to the general economic survey conducted by the Korea Statistics Bureau. The inequality in the level of industrial economic development among rural areas was examined through matching of the degree of employment and industrial sales, that is, the Theil-L index and Gini coefficient were used for these calculations and analyses. Then, the spatial autocorrelation analysis of industrial economy was carried out. The following conclusions are drawn.
First, at the scale of South Korea as a whole, inequality in the level of industrial economic development among rural areas is at a reasonably balanced stage. At the scale of first-level regions, the level of inequality varied among regions. In Chungnam, the inequality level was still large. According to the decomposition results of the Theil index, the contribution of the between-city component was 54.41%. Therefore, it is possible to begin from the municipal level and establish relevant policies to increase support for backward rural areas to reduce inequality and promote balanced development in all regions. Inequality levels in the Gyeongnam region changed from large to reasonably balanced, and the contributions of the between-city and within-city components were similar. The level of industrial economic development in the rural areas of Gyeonggi, Chungbuk, Gyeongbuk, Jeonbuk, Jeonnam, and Gangwon was relatively balanced, especially that of the Jeju region was very balanced. However, owing to a lack of competitiveness, a very balanced level of inequality alone is not sufficient for the further development of the regional economy. The calculated results of the Gini coefficient and Theil index were consistent.
Second, the distribution of sales and employment has a positive spatial correlation, that is, the distribution of the industrial economy has a positive spatial correlation; and the rural areas around the Capital Area, Daegu, Ulsan, and Busan Metropolitan City show HH clustering. There are many HH clustering areas in the Gyeonggi region, and the economic development level among the rural areas of Gyeonggi is relatively balanced, so it can be concluded that the economic development level in the rural areas of Gyeonggi is generally high. Therefore, rural areas adjacent to economically developed regions are more likely to obtain favorable opportunities for economic development, and geographical location is one of the factors affecting economic development.
Finally, this study also had certain limitations. As the general economic survey including rural areas of Eups and Myeons was conducted only every five years. Therefore, this study only obtained data for two periods for calculation and analysis. However, to accurately reflect the changing trend in inequality at the level of industrial economic development, additional data are needed. In addition, apart from geographical factors, other factors may affect inequality, and how these inequalities relate to economic growth in rural areas has yet to be determined. These issues need to be studied in depth in the future to better realize the revival of rural areas and find a balance between inequality and economic growth.

Author Contributions

Conceptualization, R.Q., S.-H.L. and S.-j.B.; methodology, R.Q., S.-H.L., Z.R. and S.-j.B.; formal analysis, R.Q.; writing—original draft preparation, R.Q.; writing—review and editing, R.Q., S.-H.L. and Z.R.; visualization, R.Q. All authors have read and agreed to the published version of the manuscript.

Funding

This study was supported by the National Research Foundation of Korea (NRF) (grant No. 2021R1I1A3050249), and the Cooperative Research Program for Agriculture Science and Technology Development in Rural Development Administration, Republic of Korea (grant No. PJ017105).

Institutional Review Board Statement

Not applicable.

Informed Consent Statement

Not applicable.

Data Availability Statement

Data obtained in this study are freely available by contacting the corresponding author.

Conflicts of Interest

The authors declare no conflict of interest regarding this publication.

References

  1. Kim, G.S. Analysing the Regional disparity for Balanced regional development: Focusing the case Busan Metropolitan City. Korean Assoc. Local Gov. Stud. 2006, 18, 129–149. [Google Scholar]
  2. Kim, Y.; Lee, J.-D.; Heshmati, A. Analysis of pay inequality and its impacts on growth and performance in the Korean manufacturing industry. In Proceedings of the KDI-KAEA Conference on Enhancing Productivity and Sustaining Growth 2008, Seoul, Republic of Korea, 8 July 2008; Korea Development Institute: Seoul, Republic of Korea, 2008. [Google Scholar] [CrossRef]
  3. Lee, J.; Lee, W. A study on the characteristics of disparity between autonomous districts in Seoul. J. Korean Plan. Assoc. 2007, 42, 81–94. [Google Scholar]
  4. Lee, J. A Study on the Improvement of Under-Developedness Index; Korea Development Institute (KDI): Sejong-si, Republic of Korea, 2013. [Google Scholar]
  5. Chun, H.J. An Empirical Analysis on the Relationship between Economic Growth and Income Inequality. Seoul Stud. 2014, 15, 95–111. [Google Scholar] [CrossRef]
  6. Kim, T. The Increasing Income Inequality in Times of COVID-19 and Its Policy Implications. Health Welf. Policy Forum 2020, 290, 20–33. [Google Scholar] [CrossRef]
  7. Akita, T. Decomposing regional income inequality in China and Indonesia using two-stage nested Theil decomposition method. Ann. Reg. Sci. 2003, 37, 55–77. [Google Scholar] [CrossRef]
  8. De Maio, F.G. Income inequality measures. J. Epidemiol. Community Health 2007, 61, 849–852. [Google Scholar] [CrossRef] [PubMed]
  9. Fan, S.; Zhang, X. Infrastructure and regional economic development in rural China. China Econ. Rev. 2004, 15, 203–214. [Google Scholar] [CrossRef]
  10. Wang, G. MLD index measurement and decomposition of regional income gap in Central China—A case study of Hunan Province. Seeker 2011, 45–47. [Google Scholar] [CrossRef]
  11. Fei, S. Improvement on the Measure of China’s Urban-Rural Income Gap and its Decomposition. Ph.D. Thesis, Zhejiang University, Zhejiang Province, Hangzhou, China, 2014. [Google Scholar]
  12. Chen, J.; Dai, D.; Pu, M.; Hou, W.; Feng, Q. The Trend of the Gini Coefficient of China; BWPI Working Paper 109; Brooks World Poverty Institute (BWPI), The University of Manchester: Manchester, UK, 2010. [Google Scholar] [CrossRef]
  13. Jian, J.; Jianxiang, W.; Xiaoyi, M.; Yuding, W.; Renyong, L. Equality of medical health resource allocation in China based on the Gini coefficient method. Iran. J. Public Health 2015, 44, 445. [Google Scholar]
  14. Chongvilaivan, A.; Kim, J. Individual income inequality and its drivers in Indonesia: A Theil decomposition reassessment. Soc. Indic. Res. 2016, 126, 79–98. [Google Scholar] [CrossRef]
  15. Lee, S.-H.; Taniguchi, M.; Masuhara, N.; Mohtar, R.H.; Yoo, S.-H.; Haraguchi, M. Analysis of industrial water–energy–labor nexus zones for economic and resource-based impact assessment. Resour. Conserv. Recycl. 2021, 169, 105483. [Google Scholar] [CrossRef]
  16. Li, F.; Zhou, C. Spatial autocorrelation analysis on regional economic disparity of northeast economic region in China. Chin. J. Popul. Resour. Environ. 2009, 7, 27–31. [Google Scholar] [CrossRef]
  17. Tran, T.Q.; Nguyen, C.V.; Van Vu, H. Does economic inequality affect the quality of life of older people in rural Vietnam? J. Happiness Stud. 2018, 19, 781–799. [Google Scholar] [CrossRef]
  18. Ryser, L.; Halseth, G. Rural economic development: A review of the literature from industrialized economies. Geogr. Compass 2010, 4, 510–531. [Google Scholar] [CrossRef]
  19. Gardner, B.L. Causes of rural economic development. Agric. Econ. 2005, 32, 21–41. [Google Scholar] [CrossRef]
  20. Rodríguez-Pose, A.; Hardy, D. Addressing poverty and inequality in the rural economy from a global perspective. Appl. Geogr. 2015, 61, 11–23. [Google Scholar] [CrossRef]
  21. Terluin, I.J. Differences in economic development in rural regions of advanced countries: An overview and critical analysis of theories. J. Rural Stud. 2003, 19, 327–344. [Google Scholar] [CrossRef]
  22. Theil, H. Economics and Information Theory; North-Holland Publishing Company: Amsterdam, The Netherlands, 1967. [Google Scholar]
  23. Gini, C. Variabilità e mutabilità: Contributo allo studio delle distribuzioni e relazioni statistiche. Studi Econ.-Giuridici dell’Univ. Cagliari 1912, 3, 1–158. [Google Scholar]
  24. Anselin, L. Local indicators of spatial association—LISA. Geogr. Anal. 1995, 27, 93–115. [Google Scholar] [CrossRef]
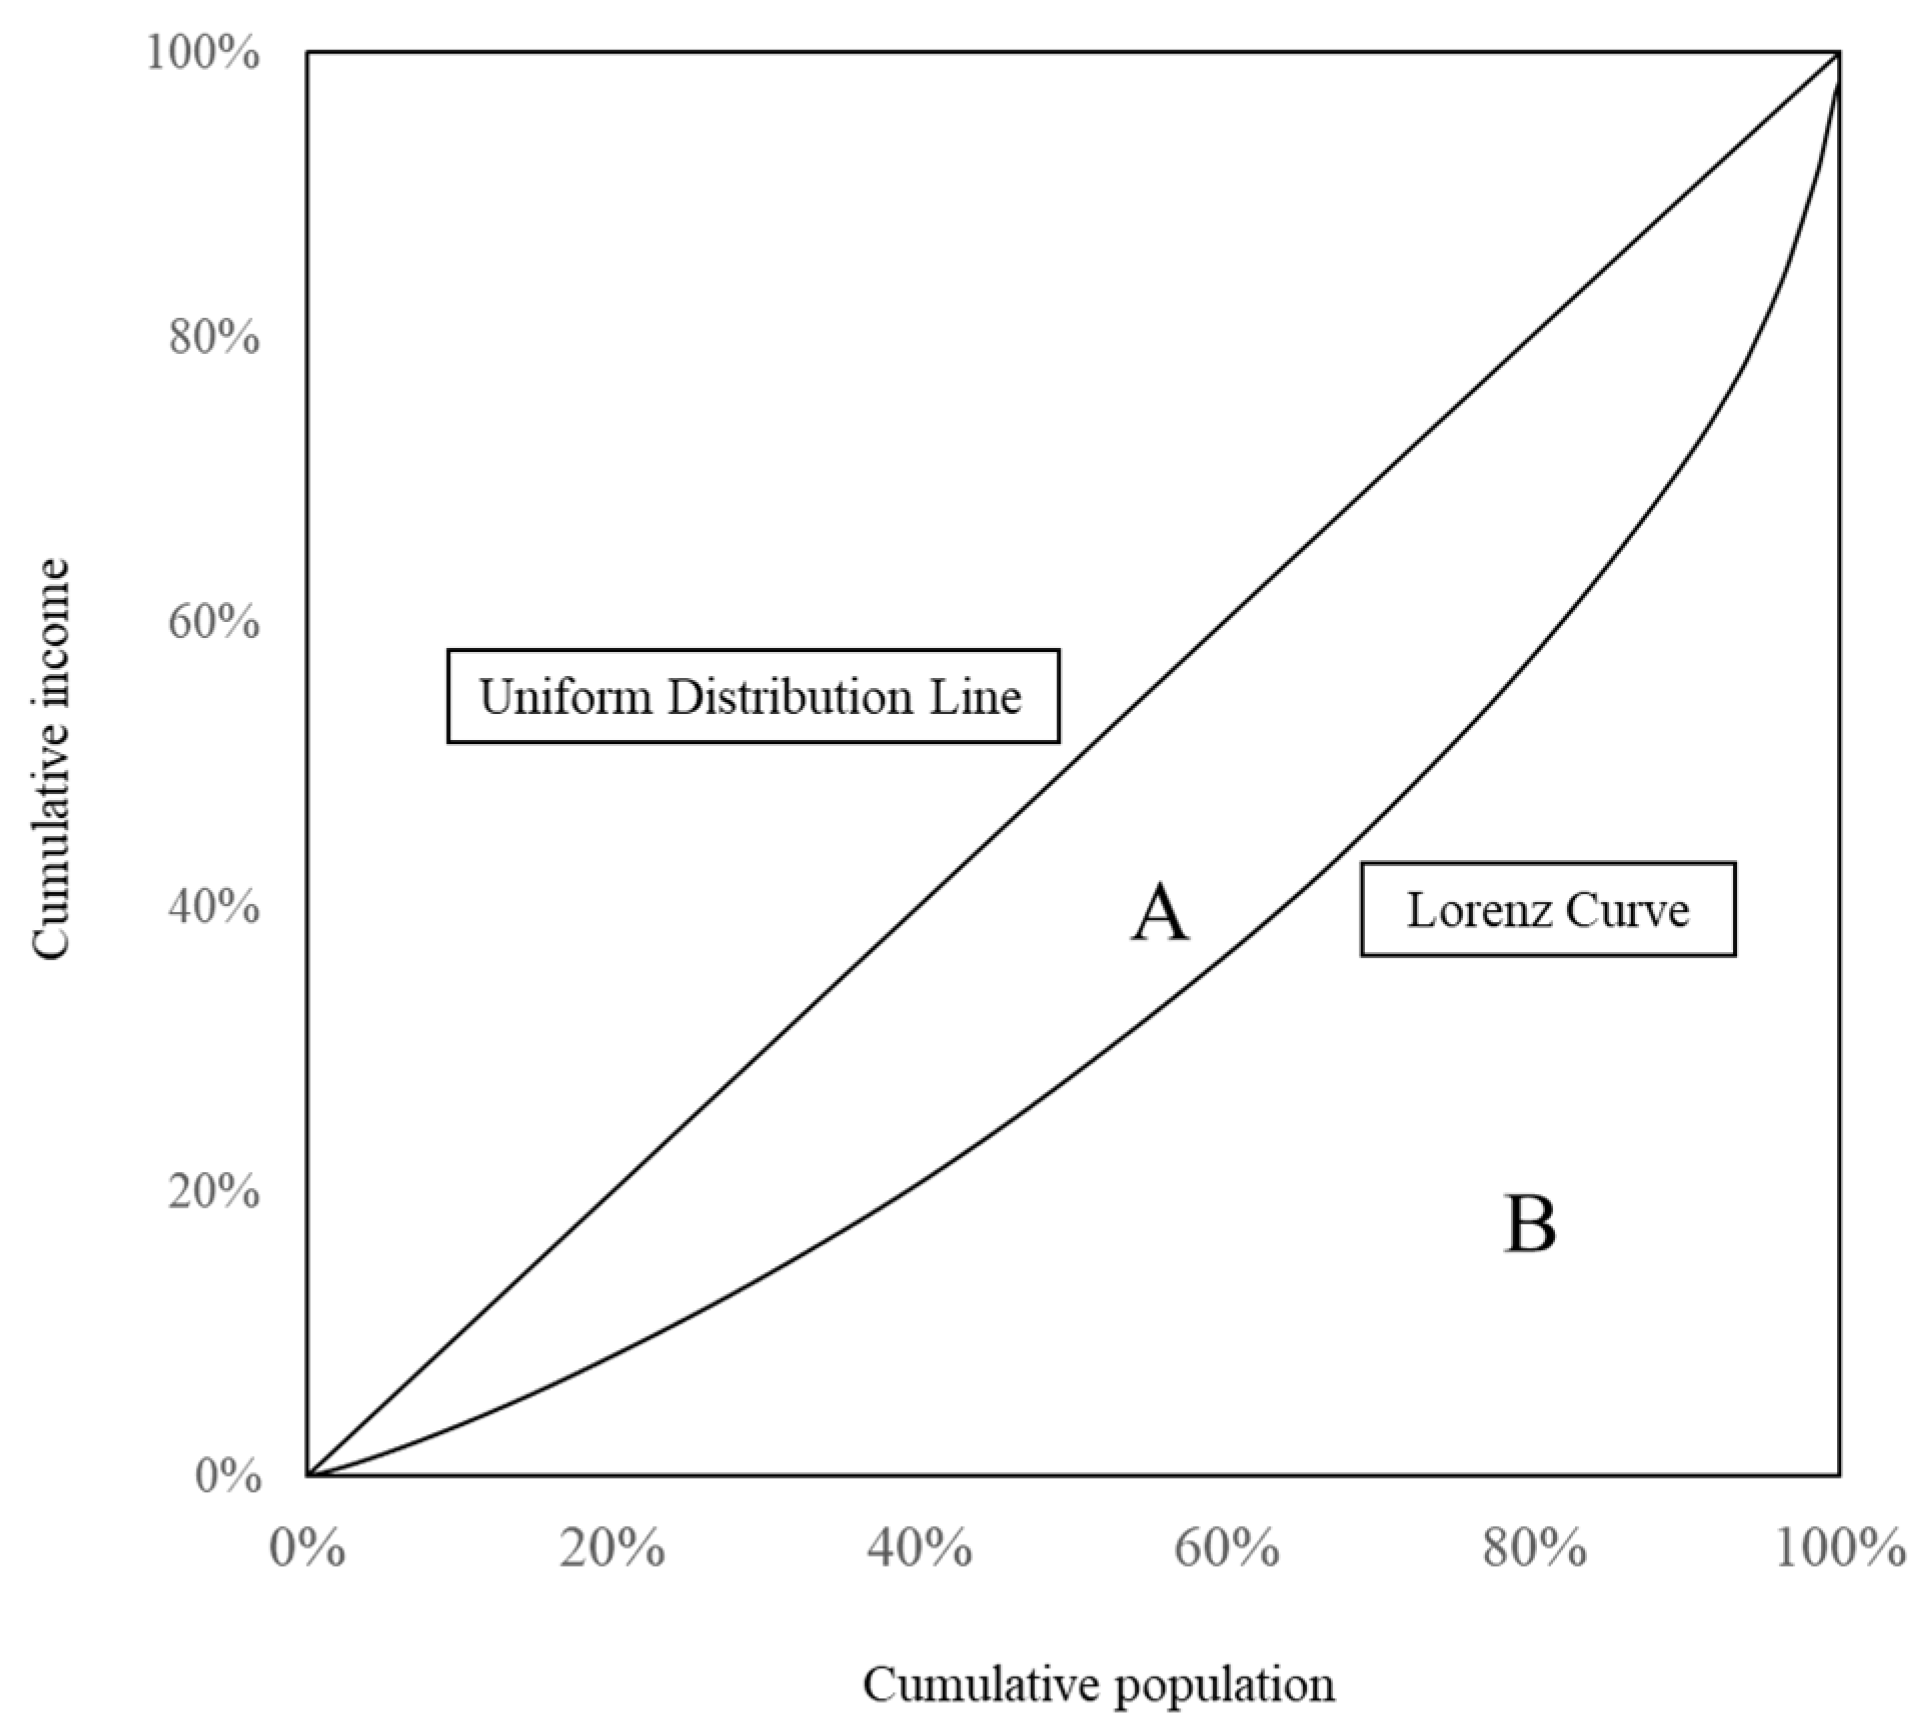
Figure 1. Lorenz curve.
Sustainability 15 08102 g001
Figure 2. Three-level hierarchical structure of Region-City (County)-Eup (Myeon).
Sustainability 15 08102 g002
Figure 3. (a) Sales distribution for 2010; (b) Employment distribution for 2010; (c) Sales distribution for 2015; (d) Employment distribution for 2015.
Sustainability 15 08102 g003aSustainability 15 08102 g003b
Figure 4. Research flow.
Sustainability 15 08102 g004
Figure 5. (a) ALMI Analysis of Sales for 2010; (b) ALMI Analysis of Sales for 2015.
Sustainability 15 08102 g005
Figure 6. (a) ALMI Analysis of Employment for 2010; (b) ALMI Analysis of Employment for 2015.
Sustainability 15 08102 g006
Table 1. Summary of previous studies of inequality in development levels.
ResearcherResearch ContentResearch MethodsIndicator Selection
Kim G.S. (2006) [1].Analysis of the disparity among districts in Busan Metropolitan City in terms of population, education, social welfare, culture, transportation, industrial economy, and living environment.
(1)
Gini coefficient
(2)
Coefficient of variation
Indicators used in the industrial economy part:
(1)
number of manufacturers;
(2)
local tax scale;
(3)
financial independence;
(4)
local tax collection per capita, etc.
Kim Y. et al. (2008) [2].Analysis of pay inequality in manufacturing in South Korea.Theil-T indexIncome and number of employees
Lee J. and Lee W. (2007) [3].Study on the characteristics of disparity between autonomous districts in Seoul.Factor analysis and cluster analysisIndicators used in the economy part:
(1)
number of enterprises;
(2)
number of financial and insurance companies;
(3)
number of enterprises with more than 300 employees.
Lee J. (2013) [4].Analysis of the inequality of level of under-development.
(1)
Theil index
(2)
Gini coefficient
(3)
20:20 ratio
(4)
McLoone index
Indicators used in the economy part:
(1)
per capita local income tax;
(2)
per capita gross regional domestic product;
(3)
ratio of total employment to population over 15 years old.
Chun (2014) [5].Analysis of the relationship between economic growth and income inequality.
(1)
Gini coefficient
(2)
20:20 ratio
Income and population
Akita (2003) [7].Analysis of decomposing regional income inequality in China and Indonesia.
(1)
One-stage Theil decomposition method
(2)
Two-stage nested Theil decomposition method
GDP and population
Wang (2011) [10].Analysis of the urban-rural income gap in Hunan Province.Theil-L index (GE(0))GDP, income, andpopulation
Fei (2014) [11].Analysis of the urban-rural income gap in China.Theil indexIncome and population
Chen et al. (2010) [12].Analysis of Gini coefficient trend in China.Gini coefficientIncome and population
Jin et al. (2015) [13].Analysis of equality of medical health resource allocation in China.Gini coefficient
(1)
population;
(2)
geographic areas;
(3)
number of healthcare institutions;
(4)
number of beds in health care institutions and the number of medical personnel.
Chongvilaivan et al. (2016) [14].Analysis of individual income inequality and its drivers in Indonesia.Theil decomposition methodIncome and number of individuals
Lee S.-H. et al. (2021) [15].Analysis of economic inequality among prefectures in Japan.Gini coefficientGross regional products and number of prefectures.
Tran et al. (2018) [17].Analysis of the influence of economic inequality on quality of life of the rural elderly.
(1)
Gini coefficient
(2)
Theil-T index
(3)
Theil-L index
(4)
Decile ratio
Household consumption expenditure and population
Li and Zhou (2009) [16].Spatial Autocorrelation Analysis on Regional Economic Disparity of Northeast Economic Region in China
(1)
Global Moran’s I
(2)
Local Moran’s I
GDP per capita
Table 2. Regional division and composition in South Korea.
RegionCompositionNumber of Eups and Myeons
Gyeonggi Seoul, Incheon Metropolitan City, and Gyeonggi-doSeoul: 0, Incheon: 20, Gyeonggi-do: 140, 160 in total.
Gangwon Gangwon-doGangwon-do: 114, 114 in total.
Chungbuk Chungcheongbuk-doChungcheongbuk-do: 102, 102 in total.
Chungnam Daejeon Metropolitan City, Sejong Special Self-governing City, and Chungcheongnam-doDaejeon: 0, Sejong: 10, Chungcheongnam-do: 161, 171 in total.
Gyeongbuk Daegu Metropolitan City, Gyeongsangbuk-doDaegu: 9, Gyeongsangbuk-do: 238, 247 in total.
Gyeongnam Ulsan Metropolitan City, Busan Metropolitan City, and Gyeongsangnam-doUlsan: 12, Busan: 5, Gyeongsangnam-do: 196, 213 in total.
Jeonbuk Jeollabuk-doJeollabuk-do: 159, 159 in total.
Jeonnam Gwangju Metropolitan City, Jeollanam-doGwangju: 0, Jeollanam-do: 229, 229 in total.
Jeju JejuJeju: 12, 12 in total.
Note: Owing to the reorganization of administrative boundaries, the number of Eups and Myeons in 2010 and 2015 are different, and Table 2 is for 2015. “do” = “province”.
Table 3. Descriptive statistical analysis of the data.
20102015
Number of EmployeesIndustrial Sales (Million Won)Number of EmployeesIndustrial Sales (Million Won)
Minimum181027331171
Maximum27,11541,376,28936,87641,879,200
Mean2323577,3432955766,996
Median831102,1981010148,406
Standard deviation37402,032,37148722,269,497
Sample size1408140814071407
Table 4. Theil-L index and Gini coefficient results for Chungnam and Gyeongnam.
RegionYearTWCTBCTRWithin-City Component
(% Contribution)
Between-City Component
(% Contribution)
GINI
Chungnam20100.0910.1010.19147.35%52.65%0.513
20150.0540.065 0.11945.59%54.41%0.409
Gyeongnam20100.0690.0730.14348.61%51.39%0.438
20150.046 0.045 0.09050.61%49.39%0.364
Note: The total inequality level is subject to the Theil index because the Gini coefficient has a slight deviation owing to the different calculation methods.
Table 5. Theil-L index and Gini coefficient results for Gyeonggi, Chungbuk, Gyeongbuk, Jeonbuk, and Jeonnam.
RegionYearTWCTBCTRWithin-City Component
(% Contribution)
Between-City Component
(% Contribution)
GINI
Gyeonggi20100.0340.0380.07247.03%52.97%0.319
20150.028 0.030 0.058 48.13%51.87%0.284
Chungbuk20100.0370.0290.06655.79%44.21%0.301
20150.037 0.019 0.056 66.54%33.46%0.286
Gyeongbuk20100.0470.0180.06572.67%27.33%0.305
20150.030 0.011 0.041 72.74%27.26%0.241
Jeonbuk20100.0550.0360.09160.33%39.67%0.354
20150.038 0.018 0.056 68.43%31.57%0.281
Jeonnam20100.0430.0360.08054.34%45.66%0.333
20150.023 0.014 0.038 62.30%37.70%0.232
Note: The total inequality level is subject to the Theil index because the Gini coefficient has a slight deviation owing to the different calculation methods.
Table 6. Theil-L index and Gini coefficient results for Gangwon and Jeju.
RegionYearTWCTBCTRWithin-City Component
(% Contribution)
Between-City Component
(% Contribution)
GINI
Gangwon20100.0260.0140.04063.95%36.05%0.236
20150.034 0.017 0.051 67.30%32.70%0.266
Jeju20100.0180.000010.01899.89%0.11%0.148
20150.009 0.000020.009 99.94%0.06%0.111
Note: The total inequality level is subject to the Theil index because the Gini coefficient has a slight deviation owing to the different calculation methods.
Table 7. National Theil index and Gini coefficient results.
YearTheil-LGINI
20100.0190.401
20150.0130.334
Table 8. Global Moran’s I result of sales and employment.
AttributeYearMoran’s I
Sales20100.136
20150.201
Employment20100.310
20150.346
Disclaimer/Publisher’s Note: The statements, opinions and data contained in all publications are solely those of the individual author(s) and contributor(s) and not of MDPI and/or the editor(s). MDPI and/or the editor(s) disclaim responsibility for any injury to people or property resulting from any ideas, methods, instructions or products referred to in the content.