Abstract
With the continuous development of the social economy, carbon emissions from various buildings are increasing. As the most important category of building carbon emissions, the rapid peaking of public buildings is an important part of achieving carbon peak and carbon neutrality. This paper is based on the industrial background of the energy consumption structure of Henan Province, a central province in the developing country of China. Firstly, the energy consumption intensity of buildings and public buildings in Henan Province from 2010 to 2020 was calculated according to the energy balance sheet. The Kaya–LMDI decomposition method was also used to analyse the carbon emissions of public buildings, determining the impact of each influencing parameter on public buildings. Secondly, the scenario prediction model Monte Carlo was run 100,000 times to set the stochastic parameters of the variables in the model to predict the time of carbon peak and carbon emissions. The analysis results indicated that: ① Carbon emissions in Henan Province have exhibited a steady growth trend, increasing from 1533 t in 2010 to 6561 t in 2020; ② The primary factors influencing carbon emissions of public buildings in Henan Province were urbanization rate, public floor area per capita, and energy intensity per unit of public floor area; and ③ Carbon emissions of public buildings in Henan Province followed an inverted U-shaped distribution and are expected to peak at approximately 7423 t by the year 2035. The research method in this paper can guide the simulation study of peak carbon emission prediction in Henan Province based on the influencing parameters of carbon emission from different types of buildings. Moreover, the results of this paper can provide a reference for a more precise study of building carbon reduction in similar regions of developing countries.
1. Introduction
Since the 21st century, rapid economic growth and yearly increase in energy consumption have led to a dramatic increase in overall CO2 emissions, resulting in a series of climate hazards [1,2,3,4]. As a global consensus, “carbon peaking and carbon neutrality” [5] is also a major strategy to implement the concept of developing a green economy worldwide. As a responsible country, China has committed to peaking its carbon emissions by 2030 and achieving carbon neutrality by 2060, making energy conservation and emission reduction an urgent task.
The achievement of the “Double Carbon” goal requires the concerted efforts of all industries. Some studies have shown that carbon emissions from buildings account for a large proportion of total emissions. In China, the whole process of building energy consumption is high, and carbon emissions account for more than half of the national total. The total construction scale of China ranks first in the world. The existing total urban building stock is about 65 billion square meters, and the new construction area is expected to be about two billion square meters every year. Carbon emissions show a rising trend. At the same time, with the acceleration of the urbanization process, due to the continuous expansion of the construction scale, the construction of energy consumption and carbon emissions are increasing, and the high energy consumption, high emissions problems are becoming more serious [6]. Therefore, the low-carbon development of the construction industry is closely related to the realization of the “two-carbon” goal. Carbon emissions from public buildings [7,8,9] are the most dominant category of building carbon emissions, mainly from office buildings, hotels, shopping malls, health care centres, educational institutions, and other buildings, so its peak research is the key link in our “double carbon” work. There is a significant gap in the development speed between the coastal regions and the central and western regions of China. In order to achieve nationwide carbon emission reduction [10], each province needs to accurately identify the current status of energy consumption and analyse the factors affecting carbon emissions. In addition, various analysis models need to be adopted to accurately predict the carbon peak of each province for a proper transformation of the industrial structure.
Henan Province has the largest population in China, with a resident population of 98.72 million and a population density of about 595 inhabitants/km2. Its public building construction has the highest CO2 emissions in the country [11]. Therefore, it is important to accurately identify the factors affecting the carbon emissions from public buildings in Henan Province and predict the carbon peak. Accurate prediction is key to deploying the emission-peaking path for public buildings in Henan Province and maintaining synergistic carbon reduction and economic development, providing implications for other similar regions around the world.
According to the existing studies, the calculation of building energy consumption [12,13] mainly focuses on: Wholesale, Retail Trade, Accommodation and Catering Services; Others; Residential Life Consumptions. In the study of the factors influencing carbon emissions of buildings within China and its provinces [14,15,16], the methods mainly used by researchers are EKC curve analysis, the Kaya equation [17,18,19,20], and the LMDI (Logarithmic Mean Divisia Index) model. For the prediction of carbon emission, the frequently used methods are the STIRPAT model, LEAP model, and scenario prediction. By using the STIRPAT model, Zhao et al. [21], Wu et al. [22], and Ma et al. [23] demonstrated that Henan province is also the priority for the future reduction of household CO2 emission, and the potential for energy climate change mitigation depends on the emission factors and changes in energy structure. The LEAP model was a “bottom-up” model proposed by Zou et al. [24] for analysing the CO2 emissions and CO2 peaks in Shanxi Province for 2019–2035 under different scenarios. The time to peak CO2 emissions under different reduction measures was analysed. In addition, Dong et al. [25,26] conducted a scenario prediction analysis of China’s carbon emissions to characterise the future development of carbon emissions in Jiangsu Province (a coastal province in China). The obtained data were more accurate than that of the LEAP model, offering some implications for China’s central and western regions. However, these carbon emission prediction models only considered variables such as energy consumption intensity, population, and energy emission coefficient. The uncertainties of variables such as GDP per capita and urbanisation level were not considered. Therefore, the measurement of carbon emissions and the study of emission reduction pathways have certain limitations.
This paper focuses on the peak carbon emissions of public buildings in Henan Province, a central province in China’s developing country. The energy consumption intensity of buildings and public buildings from 2010 to 2020 was calculated using an energy balance sheet, and factors influencing carbon emissions during this period were analyzed. The Kaya–LMDI [27,28,29] decomposition method was employed to compute the carbon emissions of public buildings in Henan Province. By conducting 100,000 Monte-Carlo [30,31] dynamic and static simulations, the timing of carbon peak and carbon emissions from public buildings in Henan Province were accurately predicted. Finally, an analysis was conducted on the carbon emission factors of public buildings in Henan Province with corresponding peak and off-peak interval distributions. On this basis, the potential for reducing carbon emissions in the construction industry of Henan Province was estimated. Furthermore, the future carbon emission trajectories of public buildings in Henan Province were predicted to address gaps in existing research and provide theoretical references for making emission reduction decisions in other regions worldwide
2. Literature Review
2.1. Research on Influencing Factors of Carbon Emission of Public Buildings
In most studies on public building carbon emission, the parameters mainly include energy consumption intensity, population [32,33], energy emission factors, etc. Influencing factors, such as GDP per capita and urbanisation level, are not considered.
Wang et al. [34] constructed a decomposition model of macroscopic carbon emission factors to identify the main driving factors affecting the change in carbon emission from public buildings in China. Based on the decomposition results, a system dynamics model was further constructed to predict the peak carbon emissions from public buildings in China. Based on existing public buildings in the hot-summer and cold-winter regions of China, Huang et al. [35] identified the best combination of energy efficiency strategies through global sensitivity analysis and dynamic simulation. The optimal solution for energy saving and emission reduction was obtained using a time-of-use tariff strategy. Liu et al. [36] analysed existing public buildings based on GBRS and proposed 15 measures in six areas: materials, energy, management, innovation, facilities, and water. Among these measures, energy and materials were the most important measures, accounting for 18.3% and 17.7%, respectively. Nevertheless, all of the above scholars mainly considered the impact of energy intensity on energy saving and emission reduction in public buildings, while ignoring other driving factors that inhibit the growth of carbon emissions from public buildings.
2.2. Research on Carbon Emission Model of Public Buildings
The primary models used to study carbon emissions from public buildings are Kaya, STIRPAT, and LMDI.
The Kaya equation proposed by Japanese scholars expressed four factors (social, economic, energy, and carbon emissions) in a simple mathematical equation, with the advantages of strong explanatory power for determinants, simplicity of form, and no decomposition residuals. This equation has become the basis for the IPCC (Intergovernmental Panel on Climate Change) emission scenarios [37]. Based on an open discussion of China’s medium- and long-term economic and social development goals, Liu et al. [38] developed models of energy consumption and associated CO2 emissions. The trends for the main drivers of CO2 emissions were also analysed. The results indicated that continued energy efficiency reforms, industry restructuring, and energy restructuring are the three main drivers for achieving carbon neutrality. Different scenarios for 2020–2060 were predicted based on the Kaya constant equation. In 2019, Peng et al. [39] analysed the share of construction and construction-related carbon emissions in the total carbon emissions of Chinese society, with construction carbon emissions accounting for 16%. Due to the size and high energy consumption per unit area, the consumption of public buildings accounted for 38% of all building energy consumption or 8% of the national total energy consumption. The Kaya model based on different types of public buildings/municipalities with improved energy efficiency and full use of renewable energy can contribute to reducing carbon emissions in China’s construction industry. However, using only the Kaya model to detect changes in carbon emissions makes it difficult to determine the actual impact on total emissions, and differences in economic and social trends cannot be accurately described.
Chen et al. [40] calculated energy consumption and carbon emissions in the construction phase of large public buildings based on an improved STIRPAT (Stochastic Impacts by Regression on Population, Affluence, and Technology) model. Multiple influencing factors related to energy consumption and carbon emission during the construction process were identified, and the effects of population and engineering machinery performance on energy consumption and carbon emission intensity were analysed. Based on the results of the STIRPAT model for environmental pollution and carbon emissions in Fujian Province, Zhao et al. [41] developed a 3E system model to simulate three development scenarios in Fujian Province and explore the EKC (Environmental Kuznets Curve). The results of the STIRPAT model showed that population, economic structure, and energy structure were the main influencing factors of environmental pollution and carbon emission in Fujian Province. However, the STIRPAT model overemphasises the role of energy structure and fails to explain the impact mechanism of GDP per capita and urbanisation level on the environment in more detail.
Raza [42] used the LMDI model to analyse the factors affecting carbon emissions. The key drivers were examined in three main aspects: First, the LMDI between population, activity, electricity intensity, total electricity, generation mix, energy efficiency, and fuel emission factor effects was used to measure CO2 emissions from the electric power sector. Second, the relationship between electricity CO2 emission and the economy was analysed through the Tapio decoupling index. Third, a decoupling index for each factor was analysed to provide references for the green economy and policy. Chen et al. [43] analysed the coupled coordination of carbon emissions and the ecological environment in China. The coordination of carbon emissions and the ecological environment from 2009–2015 were examined. In addition, LMDI was used to identify the key factors affecting the coordination. Different scenarios were simulated to show the impact of changes in government priorities on the level of coordination. However, the separate use of the LMDI model still has shortcomings in the elasticity analysis.
This study considers the effects of energy consumption intensity, population, energy emission factor, GDP per capita, urbanisation level, and tertiary industry. The new Kaya–LMDI model is constructed based on the Kaya constant equation and the LMDI model to analyse the CO2 emissions in Henan Province.
3. Data Sources
Henan Province is located in the central region of China (see Figure 1), which is rich in mineral resources. It has the largest population, with a resident population of 98.72 million and a population density of about 595 inhabitants/km2. Its unbalanced industrial structure leads to a more prominent energy consumption, with CO2 emissions accounting for about 5% of the country’s total relevant carbon emissions and an emission intensity about four times that of Beijing.
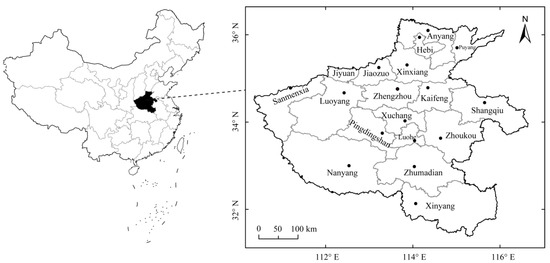
Figure 1.
Geographical Location Map of Henan Province.
Carbon emission is a prerequisite for peak prediction. For the prediction of carbon peak, this study calculates carbon emissions from public buildings in Henan Province by retrieving data from the China Energy Statistical Yearbook and the Henan Provincial Statistical Yearbook.
4. Energy Consumption Calculation Methods
The research in this paper relies on long-term and continuous time series data for building energy consumption and carbon emissions. By comparing two accounting methods for building energy consumption, it is found that the top-down energy balance sheet splitting method provides easily accessible and authoritative data, as well as a continuous time series. The energy consumption and carbon emission data obtained through this method are deemed reliable and highly comparable, making it the preferred source of data for this paper.
4.1. Building Energy Consumption Analysis
The end-use energy sectors are divided into seven categories in China’s energy balance sheet: Agriculture, Forestry, Animal Husbandry and Fisheries; Industry; Construction; Transportation, Storage and Postal Services; Wholesale, Retail Trade, Accommodation and Catering Services; Others; and Residential Life. Since there are no detailed statistics on building energy consumption, the building energy consumption was first separated based on China’s energy balance sheet in the statistical yearbook.
where —building energy consumption;
—energy consumption in public buildings;
—household energy consumption;
—energy consumption in transportation, warehousing, and postal services;
—industrial energy consumption;
—energy consumption in the construction industry;
—part of the transportation energy consumption.
The building energy consumption is mainly calculated based on Wholesale, Retail Trade, Accommodation and Catering Services, Others, and Residential Life consumptions after deducting part of the transportation energy consumption (consumptions of gasoline and diesel [44]). Energy consumption generated by industry and construction is not considered here. Building energy consumption [45] can be generally expressed by the following equations:
where —transportation energy consumption of wholesale, retail, accommodation, and catering;
—other transportation energy consumption;
—Transportation energy consumption for residential life.
4.2. Analysis of Energy Consumption in Public Buildings
Based on previous studies and historical data, the energy consumption of public buildings in Henan Province is analysed, and a basic measurement model can be obtained. Currently, three methods are commonly used to calculate building energy consumption. In this study, the calculation is based on a statistical yearbook, which contains authoritative and reliable data that can be accurately accessed. However, this method requires extracting the scope involved in the energy consumption of public buildings. Therefore, the energy consumption of public buildings in this study is based on Wholesale, Retail Trade, Accommodation and Catering Services, and Others, excluding Residential Life Consumption. Since most areas in Henan Province are centrally heated [46], the heating energy consumption is corrected to be equal to the difference between the heat from central heating and the heat consumption from Wholesale, Retail Trade, Accommodation and Catering Service and Others in the energy balance sheet.
In this study, the calculation method of energy consumption in public buildings in Henan Province is based on the theoretical analysis method summarised by Ma et al. [22], Cai et al. [47], and Xie et al. [48]. The energy consumption in public buildings can be generally expressed by the following equations:
In Equation (4), indicates the energy consumption of Wholesale, Retail Trade, Accommodation and Catering Services; indicates the energy consumption of Others; indicates the corrected heating energy consumption. In Equation (5), indicates the coal consumption in the building energy consumption of transportation and storage; indicates the electricity consumption in the building energy consumption of transportation and storage.
4.3. Basic Calculations
The total energy consumption of public buildings in Henan Province from 2010 to 2020 [49,50] was calculated based on the energy balance sheet (Table 1).

Table 1.
Energy consumption data of Henan Province, 2010–2020. (Unit: 10,000 tonnes of standard coal).
Since the data in the energy balance sheet are physical quantities, they need to be converted using energy conversion factors. The converted standard coal coefficients for various energy sources are shown in Table 2.
Table 2.
Converted standard coal coefficient for various energy sources.
The calculation results in Table 1 show that the energy consumption of buildings is increasing every year. The emergence of new buildings, such as office buildings, hotels, and shopping malls, led to a rapid increase in energy consumption. In addition, the pursuit of a more comfortable living environment also increased energy consumption. In 2017, the People’s Government of Henan Province issued a comprehensive work plan on energy conservation [51] and emission reduction for the 13th Five-Year Plan, resulting in a slight decrease in energy consumption in public buildings.
5. Calculation of Carbon Emissions
The carbon emission research institute of public buildings primarily employs models such as Kaya, STIRPAT, and LMDI. The Kaya equation is the basis of current CO2 analysis, with the advantages of the strong explanatory power of determinants, simple form, and no decomposition residue. The LMDI model also has good symmetry and simplicity. While some researchers have utilized the STIRPAT model to calculate energy consumption and carbon emissions during the construction phase of large public buildings, it falls short of providing a detailed analysis of how per capita GDP and urbanization levels impact the environment. Similarly, the inadequacy of elasticity analysis is also evident when using the LMDI model separately to establish an analysis of China’s carbon emission and ecological environment coupling and coordination. Combining the advantages of these two models, the Kaya–LMDI model was constructed to analyse the influencing factors of CO2 emissions in Henan Province.
5.1. Construction of Kaya–LMDI Model
The Kaya equation is as follows [47]:
where —carbon emissions from public buildings;
—carbon emission factors for energy in public buildings;
—energy consumption intensity per unit of public floor area;
—public floor area per capita;
—urbanisation rate;
—non-urban population.
The carbon emission process of a building has a complete life cycle, which can be broadly divided into four stages: production stage, construction stage, operational stage, and dismantling stage. Some scholars conducted a quantitative analysis of the carbon emissions of buildings in Henan Province and proposed emission reduction countermeasures. In this way, the total carbon emissions of public and residential buildings in Henan Province from 2010 to 2020 were obtained [52]. The calculated energy consumption of buildings and the carbon emissions of buildings in this study are mainly for the operational stage.
The LMDI decomposition method includes LMDI-I and LMDI-II. LMDI-I decomposition method is the most widely used method with the advantages of convenient decomposition of the form, no residuals on decomposition results, independent analysis path, and uniqueness of analysis results. Based on the Kaya constant equation and LMDI decomposition method for energy consumption and CO2 emissions in the building life cycle, this study investigates the factors that reduce the carbon emission intensity of public buildings in Henan Province and the contribution of each factor to the change of building carbon intensity. The factor decomposition of LMDI based on the additive form for the time interval [0, T] can be expressed by Equation (8):
where represents the sum of the influencing factors; represents the total public building emissions generated in period T; represents the total public building emissions generated during the initial period.
Specifically, each parameter on the right side of Equation (8) can be further expressed to reflect the contribution of influencing factors:
5.2. Calculation Methods of Total Carbon Emission and Carbon Emission Intensity
Public buildings are a major part of the building system. Therefore, controlling emissions from public buildings is an important part of reducing the overall growth of CO2 emissions from buildings. The total historical emission reduction and emission intensity of public buildings in the time interval [0, T] can be expressed by Equations (14) and (15), respectively:
where indicates historical carbon emissions from public buildings; indicates historical carbon intensity of public buildings; contains , .
5.3. Analysis Results of the Kaya–LMDI Decomposition Method
The results in Table 3 suggest that:
Table 3.
Analysis results of the Kaya–LMDI decomposition method for carbon emissions of public buildings in Henan Province from 2011 to 2020.
- (1)
- Per capita area of public buildings and urban and rural population structure has a significant effect on the carbon emission of public buildings in Henan Province, with an increasing effect year by year. Due to the impact of the Covid pandemic, the growth trend of carbon emissions from public buildings in industry and services significantly slowed down in 2020.
- (2)
- In recent years, the carbon emissions from public buildings have been increasing yearly with the expansion of building scale. In order to facilitate the “carbon peak and carbon neutrality”, Henan Province has issued the 13th Five-Year Energy Development Plan to implement low-carbon and green transformation strategies and explore green development models for various industries (Table 3) [53,54]. As a result, the influencing coefficient of energy intensity per unit area of public buildings significantly decreases.
6. Analysis of Influencing Factors
Uncertainty analysis and Kaya analysis of public buildings in Henan Province show that the energy intensity of each public building and the public floor area per capita is closely related.
In the statistical yearbook, there is a lack of directly available data on the public floor area. In addition, public buildings include various types of buildings, such as office buildings, shopping malls, hotels, cultural and educational buildings, and healthcare buildings. Therefore, the calculation of public floor area is critical for the subsequent analysis of public floor area per capita.
According to previous studies, there are two main methods for calculating the public floor area [55,56]. This study measured the public floor area per capita in the service industry. The public floor area depends on the number of personnel in the service sector and the public floor area per capita. The number of personnel is closely related to GDP per capita, and the public floor area per capita is closely associated with the tertiary industry. In general, the expansion of the service sector directly causes rapid growth in the number of public buildings. Based on the above analysis, this study used the public building calculation model developed by McNeil [57] and Hong [58] to estimate the area of public buildings in Henan Province, thus calculating the public floor area per capita.
The area of public buildings can be calculated as follows:
In Equation (16), denotes the public floor area in year t; and denote the number of personnel in year t and the public floor are per capita in year t, respectively; value is set as 40 m2; I is defined as GDP per capita, is determined as , respectively. GDP per capita and the number of personnel in the service sector can be found in the statistical yearbooks for the relevant years.
By using the ratio between the carbon emission of public buildings and the energy consumption of public buildings in Henan Province from 2010 to 2020, the energy emission coefficient of Henan Province each year can be obtained. The influencing factors of carbon emissions from public buildings in Henan Province are shown in Table 4.
Table 4.
Influencing factors of carbon emissions from public buildings in Henan Province from 2010 to 2020.
The results in Table 4 suggest that:
- (1)
- Population size, public floor area per capita, urbanisation rate, and energy intensity per unit of public floor area have a significant effect on carbon emissions from public buildings.
- (2)
- Energy emission factors continuously increase, with significant emission reductions occurring only in 2014 and 2020. This reduction trend also indirectly indicates the improvement of energy productivity, providing Henan Province with an ideological strategy to promote the “Double Carbon” path by focusing on improving energy efficiency and changing the energy structure.
- (3)
- Currently, the scale of services and public buildings and urbanisation rate are significantly increased. In addition, the implementation of policies such as the two-child policy has led to a slight increase in population size. These changes have significantly affected the public floor area per capita.
- (4)
- The values of influencing factors steadily increase from 2010–2019. However, the downward trend in 2020 shows that greenhouse gas emissions are effectively managed, demonstrating the effect of optimising the energy structure.
7. Peak Scenario Analysis Model
Scenario analysis [59] refers to the process of identifying and assessing the potential impact of possible future scenarios under uncertainty [60] and then optimising the future direction through the analysis results. In this study, the scenario analysis method includes a static scenario analysis model and a dynamic scenario analysis model. The dynamic analysis model can better analyse the future trend of carbon emissions in Henan Province and the potential peak distribution [61] by determining the changes in the probability distribution of individual parameters. From a national perspective, 2030 is a critical moment for carbon peaking [62], with several factors contributing to the change in building carbon emissions. This result demonstrates the importance of scenario analysis prediction.
7.1. Static Scenario Analysis Model
The static scenario analysis model is a relatively traditional method, which focuses on assigning a deterministic value to each variable that influences the carbon emissions of public buildings. In this paper, three scenarios were set for predicting the peak carbon emissions of public buildings in Henan Province: low carbon scenario; baseline scenario; high carbon scenario. Firstly, the values of 2030 and 2050 were set based on literature research [63]. Secondly, the data for the intermediate years were complemented based on polynomial fitting. After obtaining the parameters for each year, the parameter values in the model are replaced to predict the total carbon emissions from public buildings. Finally, the predicted carbon emissions of public buildings in Henan Province under different static scenarios are obtained (Table 5).
Table 5.
Setting of key parameters for static scenarios of total carbon emissions of public buildings in Henan Province.
The carbon emission trends of public buildings in the above three scenarios are shown in Figure 2a–d.
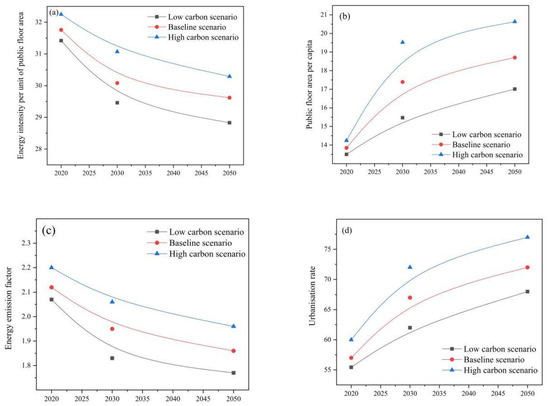
Figure 2.
Change trend of various parameters in Henan Province from 2020 to 2050 under different static scenarios. (a) Energy intensity per unit of public floor area; (b) public floor area per capita; (c) energy emission factor; (d) Urbanization rate.
7.2. Dynamic Scenario Analysis Model
The dynamic scenario analysis adopts the method of Monte Carlo simulation based on the baseline scenario in the static scenario analysis. The core of a Monte Carlo simulation is the random assignment of values to each explanatory variable in the model. The dynamic simulation focuses on the peak time and analyses the key factors affecting the peak by varying the probabilities among the variables, providing a reference for achieving the “Double Carbon” goal in Henan Province. The specific steps for dynamic scenario design are as follows:
The simulation results for predicting the future carbon emission changes of public buildings are mostly normally distributed. In addition, the following rules are set for the values of the normal distribution on for random parameters of different variables at the 95% confidence level: future changes for each variable in the model should be in the 2 interval. According to the above rules, the variable results for total carbon emissions from public buildings can be obtained, as shown in Table 6.
Table 6.
Setting of immediate parameters for each variable in the dynamic scenario analysis model.
7.3. Simulation Results of Carbon Emission Peaking in Buildings under Static and Dynamic Scenarios
(1) Analysis results under static scenarios
By investigating carbon emissions of public buildings in Henan Province from 2010 to 2020 under three static scenarios (low carbon scenario, baseline scenario, and high carbon scenario), the development trend can be identified. It can be seen from Figure 3 that the variation in carbon emissions exhibits an inverted U-shaped curve. Currently, carbon emissions in Henan Province continue to grow and are expected to peak after 2035, with a slow decline after that. The changes in carbon emissions from public buildings in Henan Province from 2010–2050 are plotted in Figure 3. Carbon emissions with different probabilities are simulated by scaling up the original curves and using different levels of error bands.
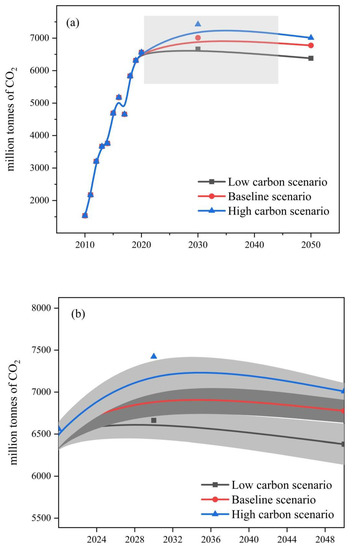
Figure 3.
Static scenario analysis and dynamic simulation range prediction in Henan Province. (a) Carbon emission trend of public buildings in Henan Province from 2010 to 2050; (b) Range of dynamic scenarios for different probabilities of carbon emissions from public buildings in Henan Province, 2020–2050.
(2) Analysis results under dynamic scenarios
In this study, 100,000 simulations were conducted using a Monte Carlo model to determine dynamic scenarios of future peak levels and peak times of CO2 emissions. Based on the simulation results, the corresponding “Double Control” objectives are adopted. As shown in Figure 4a, the carbon dioxide emissions from public buildings in Henan province peaked at about 74.23 million tons of carbon dioxide. Figure 4b shows that the peak time of public buildings in Henan province is about 2035 (±3). Moreover, the results of the dynamic scenario analysis can verify the rationality of the static scenario analysis model.
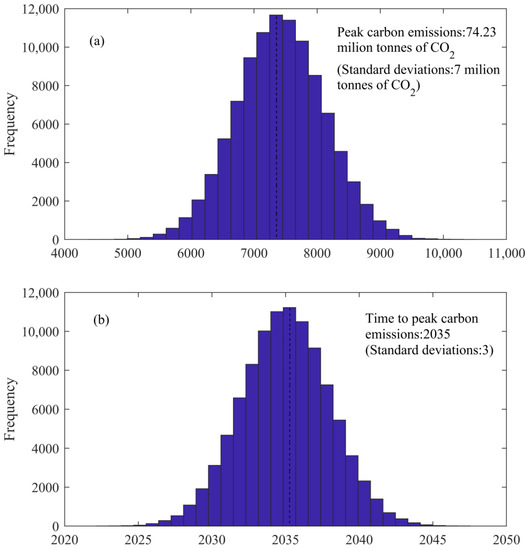
Figure 4.
Distribution of peak and peak time of carbon emissions from public buildings in Henan Province. (a) The carbon dioxide emissions from public buildings in Henan province peaked at about 74.23 million tons of carbon dioxide; (b) the peak time of public buildings in Henan province is about 2035 (±3).
Since all simulated peak times are normally distributed at the 95% confidence level. The future peak interval for carbon emissions from public buildings in the building sector, excluding industrial buildings, is 2035–2040. If the peak is in 2037, the country may also meet the “Double Carbon” goal by 2030, even if the peaks of the construction sector are later than the country’s 2030 carbon emissions target [64]. In response to the current situation, active measures should be taken to optimise the energy structure and promote transportation and various low-carbon technologies.
According to the sensitivity analysis in Figure 5, the peak carbon emission and the peak time of public buildings in Henan Province are significantly influenced by the public floor area per capita, with a contribution rate of about 57%. The urbanisation rate has a minimum impact of about 0.2%, and the energy intensity of public buildings and the population size have a moderate impact. This result indirectly reflects the focus on construction emission reduction in Henan Province.
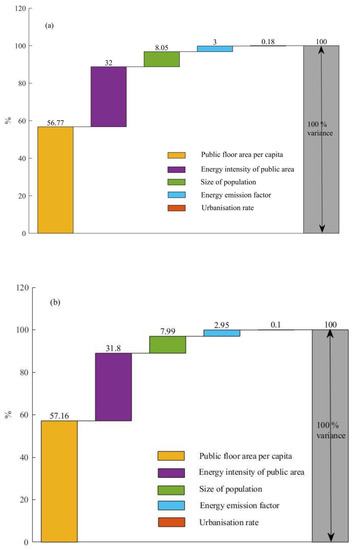
Figure 5.
Sensitivity analysis of the uncertainty of peak carbon emission and peak emission time of public buildings in Henan Province. (a) The uncertainty of peak carbon emissions; (b) The uncertainty of peak carbon emission times.
8. Discussion and Conclusions
As the largest developing country, China is actively implementing The Paris Agreement, striving to peak CO2 emissions by 2030 and achieve carbon neutrality by 2060, demonstrating China’s determination to combat climate change. In January 2021, the China Development and Reform Commission (CDRC) announced six aspects of China’s effort to achieve the “Double Carbon” goal at a press conference, including adjusting the energy structure; promoting the transformation of industrial structure; improving energy utilisation efficiency; facilitating the research and development of low-carbon technology; improving the institutional mechanism for low-carbon development; increasing ecological carbon sinks. As the most populous province in China, Henan has an expanding scale of office buildings, shopping malls, hotels, and other public buildings, which has become its future development trend. Therefore, it is essential to save energy and reduce carbon emissions from public buildings. This study can provide new ideas for making a green and low-carbon transition and developing an effective emission reduction path for public buildings in Henan Province. Furthermore, it can guide similar regions in other countries around the world and help to achieve the “Double Carbon” goal in a concerted manner.
- (1)
- Based on the Kaya–LMDI decomposition method, this study reveals the influencing factors on the growth of carbon emission intensity from public buildings in Henan Province during 2010–2020. The increasing trend of public building emissions during this period is also evaluated. Carbon emissions increased from 1533 t in 2010 to 6561 t in 2020. The emergence of new buildings, such as office buildings, hotels, and shopping malls, has led to a rapid increase in energy consumption. In addition, the pursuit of a more comfortable living environment also increases energy consumption. According to the Kaya–LMDI model of energy consumption in Henan Province and the scenario prediction analysis, the main factors influencing the carbon emissions of public buildings are population size, public floor area per capita, urbanisation rate, and energy intensity per unit area of public buildings. The development of the tertiary sector, the expansion of the building area, and the increasing population size also significantly increase each parameter. Based on the technical system implemented in the current demonstration projects, the main technical paths for developing ultra-low energy buildings in China are as follows: Improve building insulation performance through efficient building envelope structure and overall building airtightness; improve overall building energy efficiency through reasonable optimisation of building energy consumption system to realise ultra-low energy consumption building.
- (2)
- This study adopts the “static + dynamic” scenario analysis model to simulate the trends of energy consumption intensity per unit of public building area, public building area per capita, and energy emission coefficient of public buildings in Henan Province from 2020 to 2050 under different static scenarios. The results show that the variation trajectory of future carbon emissions exhibits an inverted U-shaped curve, with an expected carbon emission peak in 2030 and a slow decline after that. Using the Monte Carlo model with 100,000 simulations at a 95% confidence level to predict the peak CO2 and the peak time. Based on the simulation results, the corresponding “Double Control” objectives are implemented, suggesting that Henan Province could achieve a carbon peak with 7423 t around 2035. In addition, the sensitivity uncertainty analysis shows that the factor with the most significant influence on the carbon peak from public buildings in Henan Province is the public floor area per capita, with a contribution rate of about 57%. The least influencing factor is the urbanisation rate. These results provide some theoretical references for further exploration of carbon emission pathways and subsequent energy-saving and emission-reduction strategies for public buildings in Henan Province.
- (3)
- From international experience, some developed regions have already established a relatively complete carbon tax subsidy policy. China should first strengthen the supervision of building operational performance based on the Public Building Construction Operational Performance Standards. In addition, demand-side emission reduction should be promoted to drive the supply-side green and low-carbon transformation. Energy system optimisation is essential for provinces with high energy consumption, such as Henan Province. In addition to energy saving and carbon reduction, it is also necessary to vigorously develop clean energy, thus facilitating overall structural optimisation and innovation. Finally, the maintenance of existing public buildings (such as the renovation of heating, lighting, cooling, and other facilities) should be implemented to stop energy-intensive industries and promote “Double Carbon” goals (carbon peak and carbon neutrality).
- (4)
- This study complements the knowledge of carbon estimation and maximum model research in Henan Province. However, due to limited data from the Energy Statistics Yearbook and the subjective nature of the variable selection in each scenario related to urban development planning, the accuracy of energy consumption data and the quantification of model parameters need to be further improved. At present, the emission factor method is the most common method of carbon accounting. According to the formula, the product of the emission factor and fossil fuel consumption is the total carbon emissions. However, there are some errors in emission factors and consumption statistics. Carbon emissions calculated based on the energy balance sheet can not only cover the energy consumption generated in the process of processing and conversion, but also avoid the double calculation of thermal power generation and heating. It is a common accounting method for carbon emissions accounting for energy consumption in provincial and urban areas. Therefore, it is particularly important to formulate an authoritative emission factor coefficient and strengthen the formulation of energy low heating value. The level of energy balance sheet preparation should be improved, and the statistical deviation of carbon emission data should be narrowed. Energy statistics of major emitters should be strengthened. Rational energy monitoring plans should be put in place. Energy data statistics of key emitters should be strengthened. The accuracy of carbon verification data should be improved to ensure that the construction of carbon data system is fair, standardized, and scientific.
Author Contributions
Methodology, H.L.; Software, G.G.; Writing—original draft, Y.Z.; Writing—review & editing, H.G. All authors have read and agreed to the published version of the manuscript.
Funding
This work was supported by the Nanhu Scholars Program for Young Scholars of XYNU and Youth Sustentation of Xinyang Normal University (Grant No.2022-QN-043).
Conflicts of Interest
The authors declare no conflict of interest.
References
- Jiang, X.; Guan, D. Determinants of global CO2 emissions growth. Appl. Energy 2016, 184, 1132–1141. [Google Scholar] [CrossRef]
- Ma, M.; Cai, W. What drives the carbon mitigation in Chinese commercial building sector? Evidence from decomposing an extended Kaya identity. Sci. Total Environ. 2018, 634, 884–899. [Google Scholar] [CrossRef] [PubMed]
- Huang, L.; Krigsvoll, G.; Johansen, F.; Liu, Y.; Zhang, X. Carbon emission of global construction sector. Renew. Sustain. Energy Rev. 2017, 81, 1906–1916. [Google Scholar] [CrossRef]
- Liu, Y.; Guo, B.; Lu, M.; Zang, W.; Yu, T.; Chen, D. Quantitative distinction of the relative actions of climate change and human activities on vegetation evolution in the Yellow River Basin of China during 1981–2019. J. Arid Land 2023, 15, 91–108. [Google Scholar] [CrossRef]
- Li, Y. An empirical analysis of the impact of rail transit construction on urban consumption. J. Xinyang Norm. Univ. (Nat. Sci. Ed.) 2022, 35, 432–437. [Google Scholar]
- Wang, H.; Chen, W.; Shi, J. Low carbon transition of global building sector under 2- and 1.5-degree targets. Appl. Energy 2018, 222, 148–157. [Google Scholar] [CrossRef]
- Gan, L.; Liu, Y.; Shi, Q.; Cai, W.; Ren, H. Regional inequality in the carbon emission intensity of public buildings in China. Build. Environ. 2022, 225, 109657. [Google Scholar] [CrossRef]
- Wang, Y.; Liang, Y.; Shao, L. Regional differences and influencing factors of the carbon emission efficiency from public buildings in China. Front. Environ. Sci. 2022, 10, 962264. [Google Scholar] [CrossRef]
- Li, L.; Duan, M.; Gu, X.; Wang, Y. The stimulation and coordination mechanisms of the carbon emission trading market of public buildings in China. Front. Energy Res. 2021, 9, 715504. [Google Scholar] [CrossRef]
- Ma, M.; Ma, X.; Cai, W.; Cai, W. Carbon-dioxide mitigation in the residential building sector: A household scale-based assessment. Energy Convers. Manag. 2019, 198, 111915. [Google Scholar] [CrossRef]
- Lu, M.; Lai, J. Review on carbon emissions of commercial buildings. Renew. Sustain. Energy Rev. 2020, 119, 109545. [Google Scholar] [CrossRef]
- Wang, P.; Yang, Y.; Ji, C.; Huang, L. Influence of built environment on building energy consumption: A case study in Nanjing, China. Environ. Dev. Sustain. 2023. [Google Scholar] [CrossRef] [PubMed]
- Qiao, R.; Liu, T. Impact of building greening on building energy consumption: A quantitative computational approach. J. Clean. Prod. 2020, 246, 119020. [Google Scholar] [CrossRef]
- Li, R.; Yu, Y.; Cai, W.; Liu, Q.; Liu, Y.; Zhou, H. Interprovincial differences in the historical peak situation of building carbon emissions in China: Causes and enlightenments. J. Environ. Manag. 2023, 332, 117347. [Google Scholar] [CrossRef] [PubMed]
- Liu, Q.; Xia, C.; Zhang, M. Research on the calculation and influencing factors of industrial green development efficiency in Henan Province. J. Xinyang Norm. Univ. (Nat. Sci. Ed.) 2021, 34, 394–400. [Google Scholar]
- Li, X.; Zhao, X. An empirical analysis on the impact of air pollution on green transportation consumption. J. Xinyang Norm. Univ. (Nat. Sci. Ed.) 2022, 35, 591–596. [Google Scholar]
- Kaya, S.; Kaya, C. A new equation based on ionization energies and electron affinities of atoms for calculating of group electronegativity. Comput. Theor. Chem. 2015, 1052, 42–46. [Google Scholar] [CrossRef]
- Eskander, S.; Nitschke, J. Energy use and CO2 emissions in the UK universities: An extended Kaya identity analysis. J. Clean. Prod. 2021, 309, 127199. [Google Scholar] [CrossRef]
- Georgios, M.; Kristina, O.; Peter, R.; Jan, C. A strategy for reducing CO2 emissions from buildings with the Kaya identity—A Swiss energy system analysis and a case study. Energy Policy 2016, 88, 343–354. [Google Scholar]
- Ortega-Ruiz, G.; Mena-Nieto, A.; García-Ramos, J.E. Is India on the right pathway to reduce CO2 emissions? Decomposing an enlarged Kaya identity using the LMDI method for the period 1990–2016. Sci. Total Environ. 2020, 737, 139638. [Google Scholar] [CrossRef]
- Zhao, L.; Zhao, T.; Yuan, R. Scenario simulations for the peak of provincial household CO2 emissions in China based on the STIRPAT model. Sci. Total Environ. 2021, 809, 151098. [Google Scholar] [CrossRef] [PubMed]
- Wu, R.; Wang, J.; Wang, S.; Feng, K. The drivers of declining CO2 emissions trends in developed nations using an extended STIRPAT model: A historical and prospective analysis. Renew. Sustain. Energy Rev. 2021, 149, 111328. [Google Scholar] [CrossRef]
- Ma, M.; Yan, R.; Cai, W. An extended STIRPAT model-based methodology for evaluating the driving forces affecting carbon emissions in existing public building sector: Evidence from China in 2000—2015. Nat. Hazards 2017, 89, 741–756. [Google Scholar] [CrossRef]
- Zou, X.; Wang, R.; Hu, G.; Rong, Z.; Li, J. CO2 emissions forecast and emissions peak analysis in Shanxi Province, China: An application of the LEAP Model. Sustainability 2022, 14, 637. [Google Scholar] [CrossRef]
- Jia, D.; Li, C. Scenario prediction and decoupling analysis of carbon emission in Jiangsu Province, China. Technol. Forecast. Soc. Chang. 2022, 185, 122074. [Google Scholar]
- Mu, T.; Geng, G.; Wang, C.; Zou, R. Evaluation approach of terminal energy consumption of public buildings based on a standardized model. Indoor Built Environ. 2022, 31, 1066–1078. [Google Scholar] [CrossRef]
- Li, X.; Wang, J.; Zhang, M.; Ouyang, J.; Shi, W. Regional differences in carbon emission of China’sindustries and its decomposition effects. J. Clean. Prod. 2020, 270, 122528. [Google Scholar] [CrossRef]
- Peng, D.; Liu, H. Measurement and driving factors of carbon emissions from coal consumption in China based on the Kaya-LMDI model. Energies 2022, 16, 439. [Google Scholar] [CrossRef]
- Yang, J.; Cai, W.; Ma, M.; Li, L.; Liu, C.; Ma, X.; Li, L.; Chen, X. Driving forces of China’s CO2 emissions from energy consumption based on Kaya-LMDI methods. Sci. Total Environ. 2020, 711, 134569. [Google Scholar] [CrossRef]
- Yu, H.; Wang, J.; Cao, L.; Bai, R.; Wang, P. Effects of the number of simulation iterations and meshing accuracy in monte-carlo random finite-difference analysis. Front. Earth Sci. 2023, 10, 1041288. [Google Scholar] [CrossRef]
- Tahmasebinia, F.; Jiang, R.; Sepasgozar, S.; Wei, J.; Ding, Y.; Ma, H. Implementation of BIM energy analysis and monte carlo simulation for estimating building energy performance based on regression approach: A case study. Buildings 2022, 12, 449. [Google Scholar] [CrossRef]
- Zhou, G.; Wu, M.; Tai, Y. Spatio temporal pattern analysis of coupling and coordination between rural development and urbanization from the perspective of rural revitalization a case study of Henan Province. J. Xinyang Norm. Univ. (Nat. Sci. Ed.) 2021, 34, 68–75. [Google Scholar]
- Xu, J.; Chen, Z. Research progress on urbanization affecting carbon emission. J. Hubei Univ. Econ. 2022, 20, 83–97. [Google Scholar]
- Wang, Y.; Liang, Y.; Shao, L. Driving factors and peak forecasting of carbon emissions from public buildings based on LMDI-SD. Discret. Dyn. Nat. Soc. 2022, 2022, 4958660. [Google Scholar] [CrossRef]
- Huang, H.; Wang, H.; Hu, Y.; Li, C.; Wang, X. Optimal plan for energy conservation and CO2 emissions reduction of public buildings considering users’ behavior: Case of China. Energy 2022, 261, 125037. [Google Scholar] [CrossRef]
- Liu, K.; Tian, J.; Chen, J.; Wen, Y. Low-Carbon retrofitting path of existing public buildings: A comparative study based on green building rating systems. Energies 2022, 15, 8724. [Google Scholar] [CrossRef]
- Kaya, Y. Impact of carbon dioxide emission on GNP growth: Interpretation of proposed scenarios. In Response Strategies Working Group; IPCC: Geneva, Switzerland, 1989. [Google Scholar]
- Liu, H.; Zhang, J.; Yuan, J. Can China achieve its climate pledge: A multi-scenario simulation of China’s energy-related CO2 emission pathways based on Kaya identity. Environ. Sci. Pollut. Res. Int. 2022, 29, 74480–74499. [Google Scholar] [CrossRef]
- Peng, C.; Wei, Q.; Wei, W. Decarbonization path of China’s public building sector from bottom to top. Carbon Neutrality 2022, 1, 39. [Google Scholar] [CrossRef]
- Chen, Y.; Wu, Y.; Chen, N.; Kang, C.; Du, J.; Luo, C. Calculation of energy consumption and carbon emissions in the construction stage of large public buildings and an analysis of influencing factors based on an improved STIRPAT model. Buildings 2022, 12, 2211. [Google Scholar] [CrossRef]
- Zhao, L.; Pan, W.; Lin, H. Can Fujian achieve carbon peak and pollutant reduction targets before 2030? Case study of 3E system in southeastern China based on system dynamics. Sustainability 2022, 14, 11364. [Google Scholar] [CrossRef]
- Raza, M.; Lin, B. Analysis of Pakistan’s electricity generation and CO2 emissions: Based on decomposition and decoupling approach. J. Clean. Prod. 2022, 359, 132074. [Google Scholar] [CrossRef]
- Chen, J.; Li, Z.; Dong, Y.; Song, M.; Muhammad, S.; Xie, Q. Coupling coordination between carbon emissions and the eco-environment in China. J. Clean. Prod. 2020, 276, 123848. [Google Scholar] [CrossRef]
- Zhang, G.; Sandanqyake, M.; Setunge, S.; Li, C.; Fang, J. Selection of emission factor standards for estimating emissions from diesel construction equipment in building construction in the Australian context. J. Environ. Manag. 2017, 187, 527–536. [Google Scholar] [CrossRef] [PubMed]
- State Administration for Market Regulation. General Principles of Energy Consumption Calculation Comprehensive; China Statistics Press: Beijing, China, 2021. [Google Scholar]
- Korolija, I.; Zhang, Y.; Marjanovic-Halburd, L.; Hanby, V.I. Regression models for predicting UK office building energy consumption from heating and cooling demands. Energy Build. 2013, 59, 214–227. [Google Scholar] [CrossRef]
- Cai, W.; Pang, T.; Lang, N.; Zhao, Y.; Wu, Y. Calculation and analysis of provincial building energy consumption in China. HVAC 2020, 50, 66–71+116. [Google Scholar]
- Xie, J. Discussion on Peak Carbon Emissions and Energy Saving-Emission Reduction of Public Buildings in Chongqing Based on LEAP Model; University of Chongqing: Chongqing, China, 2019. [Google Scholar]
- Lin, B.; Liu, H. China’s building energy efficiency and urbanization. Energy Build. 2015, 86, 356–365. [Google Scholar] [CrossRef]
- Institute of Standards and Quotations, Ministry of Housing and Urban-Rural Development. Strategies for Controlling the Total Energy Consumption of Civil Buildings in China; China Construction Industry Press: Beijing, China, 2016. [Google Scholar]
- Song, M.; Liu, X.; Hu, S. Building a greener future—Progress of the green building technology in the “13th Five-Year Plan” of China, Building simulation. Build. Simul. 2022, 15, 1705–1707. [Google Scholar] [CrossRef]
- Bai, L. Quantitative analysis of building carbon emissions and research on emission reduction counterm easures in Henan Province under the double carbon target. Henan Sci. Technol. 2022, 41, 129–132. [Google Scholar] [CrossRef]
- Zhai, H.; Zhang, Z.; Zhao, X.; Xie, W.; Chen, Q.; Hu, Y. Optimization of green infrastructure in Xinyang City based on network structure analysis. J. Xinyang Norm. Univ. (Nat. Sci. Ed.) 2021, 34, 260–266. [Google Scholar]
- Guo, B.; Lu, M.; Fan, Y.; Wu, H.; Yang, Y.; Wang, C. A novel remote sensing monitoring index of salinization based on three-dimensional feature space model and its application in the Yellow River Delta of China. Geomatics. Nat. Hazards Risk 2023, 14, 95–116. [Google Scholar] [CrossRef]
- Wang, X. Study on the Influencing fa Actors and Prediction of Civil Building Floor Space in China; Tianjin University: Tianjin, China, 2020. [Google Scholar]
- Cong, X. Study of Carbon Dioxide Emissions of Buildings in Different Regions of China Based on Climatic Factors; Dalian University of Technology: Dalian, China, 2014. [Google Scholar]
- McNeil, M.; Feng, W.; du Can, S.; Khanna, N.; Ke, J.; Zhou, N. Energy efficiency outlook in China’s urban buildings sector through 2030. Energy Policy 2016, 97, 532–539. [Google Scholar] [CrossRef]
- Hong, L. Building stock dynamics and its impacts on materials and energy demand in China. Energy Policy 2016, 94, 47–55. [Google Scholar] [CrossRef]
- Ma, M. Impact Factors and Peaking Simulation of Carbon Emissions in the Chinese Building Sector; Chongqing University: Chongqing, China, 2020. [Google Scholar]
- Peng, F. Short-term carbon emission prediction method of green building based on IPAT model. Int. J. Glob. Energy Issues 2023, 45, 1–13. [Google Scholar]
- Zhang, S.; Wang, K.; Yang, X.; Xu, W. Research on emission goal of carbon peak and carbon neutral in building sector. Build. Sci. 2021, 37, 189–198. [Google Scholar]
- Dong, K.; Jiang, H.; Sun, R.; Dong, X. Driving forces and mitigation potential of global CO2 emissions from 1980 through 2030: Evidence from countries with different income levels. Sci. Total Environ. 2019, 649, 335–343. [Google Scholar] [CrossRef]
- Li, B.; Liang, Q.; Wang, J. A comparative study on prediction methods for China’s medium-and long-term coal demand. Energy 2015, 93, 1671–1683. [Google Scholar] [CrossRef]
- Shao, S.; Zhang, X.; Zhao, X. Empirical decomposition and peaking pathway of carbon dioxide emissions of China’s manufacturing sector-generalized divisia index method and dynamic scerhario analysis. China Ind. Econ. 2017, 3, 44–63. [Google Scholar]


Disclaimer/Publisher’s Note: The statements, opinions and data contained in all publications are solely those of the individual author(s) and contributor(s) and not of MDPI and/or the editor(s). MDPI and/or the editor(s) disclaim responsibility for any injury to people or property resulting from any ideas, methods, instructions or products referred to in the content. |
© 2023 by the authors. Licensee MDPI, Basel, Switzerland. This article is an open access article distributed under the terms and conditions of the Creative Commons Attribution (CC BY) license (https://creativecommons.org/licenses/by/4.0/).