Abstract
The availability of resources is vital when rapid changes and updated medical information in the provision of care are needed, such as in the fight against COVID-19, which is not a conventional disease. Continuing medical education plays an essential role in preparing for and responding to such emergencies. Workflow has improved based on the virtual meetings, online trainings, and remote detailing conducted by medical representatives in order to deliver educational content instantly through digital tools, such as salesforce automation (SFA), webinars, etc. In terms of its regulatory barriers, the pharmaceutical industry mainly targets healthcare professionals, unlike most businesses that reach end users directly. Medical representatives are equipped with an SFA to enhance customer relationship management (CRM) and closed loop marketing (CLM) capabilities in pharmaceutical companies. This study aimed to fill a gap in the literature by investigating the use of SFA in work patterns, such as health professionals’ loyalty and involvement in their medical knowledge in Turkey, and how it allows for differentiating training from marketing. This study intended to compare the data on internists and medical products gathered from a well-known pharmaceutical company’s SFA. The data covered the first three months of the year 2020, when medical representatives had a normal daily routine, and that of 2021, when Turkey experienced the most powerful surge of the COVID-19 pandemic. The analysis was based on simple correspondence analysis (SCA) and multiple correspondence analysis (MCA) for 11 variables. Monitoring product, physician’s segment, and medical representatives’ behaviors with SFA had a significant influence on the pharma-physician relationship strategy, as expected. The findings supported the view that SFA technologies can be deployed to advance the medical knowledge of physicians, in addition to managing and designing superior CRM and CLM capabilities.
1. Introduction
The pharmaceutical industry (PI) is one of the fastest-growing sectors, with worldwide sales of more than USD 1.27 trillion in 2020 [1]. “The growth is mainly due to the companies recovering from the COVID-19 impact, which had led to restrictive measures involving social distancing, remote working, and the closure of commercial activities that resulted in operational challenges. In the wake of COVID-19, digitalized technology is more important than ever in allowing firms in all sectors to improve performance through stronger competitive skills, more accurate planning and forecasting, and financial sustainability” [2]. Information technology (IT) can enhance the mobility capabilities in automatic data tracking and can maximize the value of interactions in pharmaceutical business [3].
On the other hand, the pharmaceutical industry is subject to strict surveillance and control due to its direct impact on human health. These surveillance processes may extend to price interventions and advertising regulations by public authorities. While most businesses reach the end users directly, the pharmaceutical industry mainly addresses healthcare professionals, designing various marketing strategies. Advertising, known as “product promotion” in the pharmaceutical industry, is prohibited in Turkey, as in most member countries of the Organisation for Economic Co-operation and Development (OECD), except for New Zealand and the United States. There is an obligation to refer to risky situations, such as side effects, contraindications, warnings, and taking precautions in advertisements. Some form of a self-regulation model is applied in New Zealand; until a certain period of time has passed after the drug has been put on the market, for example 2 years, it cannot be advertised directly to the consumer [4]. Physicians and/or pharmacists consider medical representatives their major source of information for new product details, key differentiators, and customized solutions for patients.
Current advances in information technology (IT) have changed medical representatives’ daily routine activities. They can provide support before and after the scheduled or unscheduled visit, offering a more personalized service to targeted physicians through follow-ups and individualized content via the SFA tool. SFAs are a set of tools providing analyzed information (visits to customers, value-based customer interactions and segmentation, promotion and training opportunities, the provision of medical literature, predictions of future sales) from gathered corporate data to manage detailing-based activities. The possibility of remote detailing with SFA tools was useful to maintain the interaction with physicians that worked in limited conditions during the COVID-19 pandemic, when it was difficult to geographically access the target groups because of the lockdowns and social distancing. Therewith, some key elements in communication techniques changed totally in order to sustain the pharmaceutical field and to counter COVID-19 side effects.
Information technology-based corporate strategies are imperative drivers for business efficiency, growth, and success [5,6], and they show an innovative instrument for CRM [7]. Earlier studies were mainly focused on prescription behaviors to obtain the desired results in the pharmaceutical sector [8,9,10], but today, firms care about the retention rate of the customers with their field force and digital channels, especially in the pharmaceutical business [11].
This study aimed to investigate how the pharmaceutical industry’s involvement using SFA tools with CRM and e-detailing modules can offer a wide detailing and continuing medical education platform for healthcare professionals during COVID-19 in Turkey. Most of the studies about COVID-19 underline the economic, demographic, and clinical dimensions of the pandemic. There is a very limited number of studies that were conducted on the extent of SFA usage, which is mainly a digital pharma marketing tool, as a continuing medical education platform before and during the COVID-19 era. We believe that we are the first to provide new evidence for empowering healthcare professionals’ education and training opportunities with SFA by comparing the customer- and product-related needs before and during COVID-19 to establish and maintain effective relationships in value-creating behaviors.
Our paper is organized as follows: The concept of sales force automation capabilities with CRM and CLM modules—their key components for the pharmaceutical industry—are presented based on an extant literature review. Next, the hypothesized relationships between physician segmentation based on product, line, region’s behaviors, promotion, and providing medical knowledge strategies of the pharmaceutical’s firm are discussed, which is followed by SCA and MCA methods. After discussing an overview of results and associated implications for theory and practice, the manuscript concludes by outlining limitations and opportunities for future research.
2. Theoretical Framework and Development of Hypotheses
While the growth in the total turnover of the Turkish Pharmaceutical Industry was 31.7% in 2019, it remained at 17.7% in 2020, and the total turnover was TRY 47.9 billion [12]. Having controlled the initial outbreak in the first half of 2020 relatively well, Turkey experienced a larger second wave in the second half of the year. Turkey’s response to the pandemic was helped by the government’s program, which ensured that patients with chronic diseases could continue to receive their drugs, allowing these patients to collect repeat prescriptions and receive three- or six-months’ supplies [13]. At this point, the field specialists were aware of the fact that the pharmaceutical market must apply innovative modes of advanced drug promotion strategies, physician’s segmentation, continuing medical education, digital marketing, and CRM activities to influence prescription behaviors.
Every physician segment and product positioning strategy is designed differently based on the interest level of physicians to promotions and packages (i.e., contents for medical knowledge). Despite the negative impacts, often discussed, that the industry may have on prescription behavior, the relationship with pharmaceutical companies, as seen in our study, helped to facilitate the sharing of experiences among researchers and to incorporate the newly gained medical knowledge into real-time physicians’ clinical decisions and patient care, facilitating professional developments. Therefore, this paper focused on empowering the field force with SFA systems and their valuable outputs for the pharmaceutical sector and the continuing medical education of physicians.
2.1. Empowering Field with Salesforce Automation
The majority of authors [14,15,16] agree that IT solutions play a key role in increasing the productivity that transforms business processes. SFA focuses on fundamental strategies, including physicians’ segmentation and targeting [17], detailing the right product, which differentiates the pharmaceutical company or its products from the other competitors. A tailored SFA system includes the name of healthcare professionals visited, the name of products promoted, the daily/weekly/monthly expense management, and other related detailing activities. These data ensure better field supervision, management, and monitoring of the whole “lines” (i.e., the entire field team of a pharmaceutical company). With this in mind, how specialized data is collected in real-time and interpreted with automated SFA systems has changed the pharma-physician relationship in pharmaceutical marketing.
Important for this study, SFA capabilities demonstrate that communication with physicians and CRM performances depend on how medical representatives select the right strategies, even in times of restriction, such as the COVID-19 pandemic. This pandemic fundamentally changed how medical representatives interact with healthcare professionals [18], and many businesses were required to quickly pivot different aspects of their strategies and processes [19,20,21] to develop stronger relationships with their internal customers and other stakeholders, specifically with members of marketing and product fulfillment [22]. Implementing effective communication and detailing strategies may only be ensured with the sincere monitoring of each and every field’s activity, which are instantly updated.
We put forth that the number of face-to-face visits to physicians decreased during the COVID-19 pandemic due to quarantine, and remote detailing was performed via the SFA tool. Personalized promotions, according to the physicians’ interests, continued during this period when physicians experienced their own treatment protocols for COVID-19. We wanted to scientifically prove this assumption. Therefore, this study hypothesized that these factors would influence the planning of the sales people’s visits, as follows:
Hypothesis 1 (H1):
Due to the effect of the COVID-19 pandemic, there is a significant difference between scheduled visits to physicians.
Hypothesis 2 (H2):
Due to the effect of the COVID-19 pandemic, there is a significant difference between unscheduled visits to physicians.
Hypothesis 3 (H3):
Due to the effect of the COVID-19 pandemic, there is a significant difference between the total visit times to physicians.
The entire data set of our study consisted of categorical variables, excluding the visit time variable, since the focus of our study was how the SFA tool monitors whether there are changes due to the effect of the COVID-19 pandemic in detailing strategies. We should clarify that these first three hypotheses aimed to build a bridge between other hypotheses to be able to show the COVID-19 effect on value-based strategies (designing valuable medical content, providing innovative information, etc.) of the pharmaceutical company with their targeted physicians.
In the next section, closed loop marketing (CLM) capabilities are discussed as a specific strategy applied to healthcare professionals and other procurement entities (pharmacy, etc.) in a highly regulated sector. Due to these restrictions, it is difficult to implement all the promotional tools, but medical representatives may use closed loop marketing (CLM) strategies that contain continuing medical education, the product and “package”, detailing, and e-detailing to convince physicians by providing them updated information about new chemical entities and competitive advantages, whereas they must respect the norms led down by the authorities.
2.2. Closed Loop Marketing (CLM) Capabilities
Even though the advertising and promotion of drugs directly to the society is prohibited in accordance with the Pharmaceutical Law in Turkey, it is not completely forbidden to inform and promote drugs to healthcare professionals [23]. Companies have adopted the following specific strategic marketing approaches: promotional and educational activities for all different sector players (e.g., opinion leaders, young physicians); management of relations between healthcare professionals and medical representatives [24]; customer acquisition and retention playing a mediating role in satisfaction, dependency, and intention to prescribe again [25]. Therefore, the company equips the salespeople with tablets with access to an SFA tool that contains promotional materials and other detailing aids. They report all feedback provided by healthcare professionals during the visit. They transform the data gathered from the field into actionable data by linking them to performance indicators and use that data in both marketing and training opportunities to make future communication tactics more targeted and efficient.
2.2.1. Continuing Medical Education
The COVID-19 outbreak with difficult conditions, including insufficient staffing, deficiency of specific treatment protocols, disapproval of new drugs, prolonged periods of hard work, and an ongoing risk of infection, was a strong challenge for healthcare professionals, who needed rapid healthcare resource availability [26] and accessibility [27]. Continuing medical education and training were necessary to prepare medical professionals for public health emergencies. Eftekhar Ardebili et al. [28] suggested in their study that physicians expressed their dissatisfaction with the ambiguity that was the inability to successfully treat patients, causing negative effects on their professional performance during the pandemic. Tanhan, Doyumğaç, and Kiymaz [29] suggested that institutions that switched to online and remote education without preparations during the COVID-19 pandemic should have provided flexibility for the students, employees, and/or instructors should have provided technical support to conduct more efficient online and remote education services.
Continuing medical education consists of various courses and academic and sectoral conferences tightly linked to core specialty knowledge and that are established for medical professionals to maintain and update competence and learn about new and developing areas of their field. Continuing medical education (CME) is one of the detailing strategies frequently used by pharmaceutical companies to maintain long-term relationships with physicians and to promote their particular molecule and thereby brand. However, the pharmaceutical industry’s involvement in continuing medical education (CME) has been discussed for many years because of its influence on physicians’ prescribing behaviors. On the other hand, this collaboration of pharmaceutical companies in continuing medical education is widely accepted by healthcare professionals due to the high cost and lack of sufficient time. Punchibandara [30] studied factors, such as regular medical representative visits, debate through research materials, and continuous medical education, that were more important than sampling.
High levels of promotion activities with effective communication skills and sufficient documentation, such as the continuing education provided by the pharmaceutical company representative and well-designed and well-reviewed scientific literature, and particular product information are connected to persuade physicians to prescribe a supported brand. These educational contents may be delivered through digital and remote learning tools as live events, virtual meetings, online programs, webcasts, videos, as well as written publications. There is a significant tendency to use online communication tools across multiple channels by pharmaceutical companies in order to affect a strong relationship with healthcare professionals and to communicate effectively with key opinion leaders (KOL). Virtual meetings were revealed as a good alternative to traditional off-line meetings for continued medical education for 66.9% in a study [31] conducted with physicians. The continued use of virtual meetings in all fields was expected by more than 80% of the participants (ibid.). Thus, in this study, we put forth that SFA, as a digital and remote detailing tool, offers an accessible means to increase the number of ways to educate internists with the rapid sharing of scientific and clinical studies, especially during the COVID-19 pandemic. The updated data and medical knowledge are quickly available in an accessible format for targeted physicians regarding their needs and interested molecules and/or products.
2.2.2. Product and “Package”
The strategy entitled “unique selling proposition” (USP) is the principal part of the closed loop marketing (CLM) strategy in the pharmaceutical industry. It essentially underlines the product differentiation, adding the factors that attract physicians, such as drug active ingredients. A well-created USP supported by a well-designed “package” (i.e., content of presentations to physicians) has a strong competitive advantage. These are the presentations created for physicians’ visits that should consist of main points for every product in order to help the physicians to remember the product with its uniqueness. The success of this product positioning content is often related to the demonstration of the drug’s unique selling proposition, including the brand name, treatment category, price, and key benefit, in a credible and competitive manner. For each new product launch and/or re-launch, pharmaceutical companies need clear and updated insights about each physician’s interests and needs. For this, medical representatives use their insight into individual physicians to select the modules (i.e., packages) that best meet their needs via an SFA system. These data, linked to a preexisting CRM system in an SFA tool to derive a more in-depth analysis, are centrally collected and analyzed by the field team.
The detailed product information and literature should be planned by the line’s regional director in the same “line” (medical representatives’ team working for the same products in a defined region) according to the detailing strategy defined for the region and the targeted health professionals because there is always a risk that even a deviation will lead to inaccurate, misleading, or unclear information. This market intelligence may then be used to personalize detailing strategies for every single customer segmentation, or it can be extended to geographical regions and/or markets.
In addition, the field team can evaluate whether there is any product information not presented to the physician, although it is in the physician’s area of interest, because SFA allows a company to keep a record of all packages presented to a physician. This can ensure that physicians are grouped according to the products they are interested in and that they are prioritized in all kinds of information on that product and/or related package. In such a CLM process with the physician, both continuity and consistency may be increased by providing summary information about previous visits and their preferences. Therefore, this study proposed the following:
Hypothesis (H4):
Product and package are significantly associated in the two selected periods before and during the COVID-19 pandemic.
2.3. Customer Relationship Management (CRM) Capabilities
The success of a company’s business in the pharmaceutical industry is fundamentally related to the long-term relationship with physicians. Customer-centric organizations often focus on creating value with the target audience through customer solution technology. The customer is not the client in the pharmaceutical sector. Therefore, physicians are a major factor in the prescription of medicine because they specify the instructions to be used by patients. Within a relational context, rules and steps for analytical processes in SFA tools refer to details and offers mentioned by medical representatives to engage in behaviors directed at analyzing physicians’ needs. With SFA, the inclusion of medical representative teams (i.e., line) in the corporate workflow of the pharmaceutical company, fast communication between the company headquarters and drug warehouses, cost management in training funding, accurate segmentation, target-oriented data analysis, and CRM planning are more effective. Salespeople need to move beyond a focus on the prescribing habits of a physician to a focus on comprehensive measurement systems that include a total evaluation of goal achievement, customer feedback, teamwork, and learning orientation [32].
McKinsey’s [33] research with pharma companies indicates that field team leaders designing a new strategy should consider paying close attention to some success factors, such as rapidly personalized content, analytic-centric engagement, innovative communication channels, and closed-loop execution. Region managers and medical representatives should integrate communication and data sources with SFA to enable line members to distinguish insights for improving decision making in real time, optimizing messages and channels and scheduling individual healthcare professionals’ interactions [34]. For instance, regional managers should be empowered with field insight metrics, such as sales data, volume uptake, targeting philosophy, and product positioning in response to gathered feedback locally. After evaluating the success rate of different detailing strategies, such as medical camp, continuing medical education across various target segments and regions, and ineffective strategies and/or campaigns, they may be replaced with new ones and redefined.
During the COVID-19 pandemic, the job duties of medical representatives were conducted from a remote location to try to stay engaged with their physicians. This new environment could provide a chance to design the customer experience entirely via digital channels. The frequency and timing of digital detailing contents need to be weighed via SFA abilities against the overcharge of physicians’ in clinics.
2.3.1. Segmentation and Targeting
The effective implementation of customer segmentation and targeting is equally important to design the detailing strategies, to identify the proper needs of the customer to help in the right investments, and to establish the corporate reputation in the minds of the customers. The need and the positioning strategy will be different for every targeted customer segment. Segmentation may also allow them to evaluate the competitors’ strengths and weaknesses, focusing on the following parameters:
- (a)
- Geographic Basis (e.g., urban, rural markets): Geographic segmentation involves selecting potential markets according to where they are located. Markets are divided into “bricks” in pharmaceutical marketing. In these markets, most pharmaceutical sales territories are built based on brick data available for that country [35]. In countries where physician-level prescription data are not available, brick data are a key measure of return on a pharmaceutical company’s investment in detailing and sales promotion. Therefore, we hypothesized the following:
Hypothesis (H5):
Line and region are significantly associated in the two selected periods before and during the COVID-19 pandemic.
- (b)
- Physician segmentation at brick level (specialists, key opinion leaders in different regions).
- (c)
- Qualification of physicians (specialist or key opinion leader) (Of note, a gamification application written by the pharmaceutical company for a product can be integrated with SFA. The segment value of the targeted and communicated physician can be determined by his/her preferences while playing this game).
- (d)
- How volunteer a physician is to try new products.
- (e)
- Type of customers (loyal, switchers, competitors loyal, specialist).
- (f)
- Physicians’ prescription habit or frequency (the industry-funded continuation of medical education is widely accepted and considered trustworthy [35].
Therefore, in light of previous literature, we also hypothesized the following:
Hypothesis (H6):
Product and segment are significantly associated in the two selected periods before and during the COVID-19 pandemic.
These capabilities enable firms to build sustainable competitive advantages, such as a long-term customer-centric relationship in the healthcare ecosystem for future forecasting. Therefore, this study proposed the following:
Hypothesis (H7):
Product, segment, region, and line are significantly associated in the two selected periods before and during the COVID-19 pandemic.
2.3.2. Effective and Electronic Detailing
The pharma industry has adopted more digital initiatives, even with regulation barriers. Electronic detailing (e-detailing) is one of the drug promotional methods introduced technologically. The purpose of developing new versions of SFA systems as “tailor made” is to offer packages and contents personalized for targeted physician segments by “lines” in the regions determined by the pharmaceutical company in order to offer a value-oriented approach to the customer.
For e-detailing, digital technologies, such as internet-based sales force automations, video conferencing, web casting, interactive voice response, static presentations with instinctive segments, and physician-driven surveys, are adopted to interact with physicians, especially during the COVID-19 pandemic. The fact that medical representatives can access the presentations managed from the headquarters of the company as if they were working in the same office and the ability to plan the visit notes according to the periodic goals make it easier for physicians to present personalized content, meeting the needs of them during the visit. These real-time and remote specificities of SFA make educational events more reasonable, accessible, and financially sustainable.
On the other hand, the importance of “connected consumer” and “omnichannel” concepts is emphasized in new generation sales practices. The technology-based intelligent multi-channel approach affects medical professionals’ relationships. Thus, it is claimed that in-store ordering and “click & collect” will be the omnichannel solutions that will be used most frequently by sales points inside and outside the pharmacy. It is possible, with SFA, to stay one step ahead of the customer at the point of sale and to offer the product he/she may need before he/she arrives. It provides the opportunity to instantly convert the correct data obtained from the field into value. Additionally, the performance monitoring of the field can be evaluated with detailed reports. The latest status of the instant targets of the field teams can be seen, and action can be taken according to their results. By collecting instant data from the field, both strengths, weaknesses, opportunities, and threats (SWOT) analysis and competitor analysis can be performed.
Hypothesis (H8):
Product and line are significantly associated in the two selected periods before and during the COVID-19 pandemic.
The COVID-19 pandemic has presented numerous obstacles for healthcare systems and healthcare professionals. Healthcare providers (HCPs) gave frontline care to patients with COVID-19 in difficult conditions, which include insufficient staffing, unknown treatment protocols, prolonged periods of hard work, wearing mandatory safety equipment, and an ongoing risk of infection. Among physicians that participated in media interviews, some of them expressed dissatisfaction with the frequent change of protocols, prevention and treatment methods, and the attendant negative effects of this on their performance. In the present study, we also measured the behaviors and attitudes of 816 physicians who were visited jointly in a wide-ranging medical field, such as internal medicine, and pre-and post-COVID-19 periods. With the help of this tool, we were able to measure not only the skill of SFA but also the attitudes and behaviors of physicians during the pandemic, when there were uncertain treatment protocols.
3. Materials and Methods
3.1. Data Collection and Sample
This study aimed to compare the data on internists and their products gathered from a well-known pharmaceutical company’s SFA system in Turkey, with the approval of the IT company that wrote this tool. The data covered the first three months (January, February, and March) of the year 2020, when medical representatives’ daily routine was normal, and that of 2021, when Turkey experienced the most powerful surge of the COVID-19 pandemic. Thus, the samples obtained are comparable to the impact of the COVID-19 pandemic. The comparative analysis was conducted using simple correspondence analysis (SCA) and multiple correspondence analysis (MCA) for 11 variables (Table 1) on a sample of 7083 visits for 2020 and 4893 visits for 2021, recorded for each visit by salespeople.

Table 1.
Variables and definitions.
The unit of the analysis was salespeople’s visits to selected physicians for e-detailing. The fundamental variables of a detailing visit to a physician were defined, including the segment, customer, unit, brick, line, region, product, package, presentation time in a scheduled visit, presentation time in an unscheduled visit, and total presentation time. Non-parametric methods were used because eight variables (segment, customer, unit, brick, line, region, product, and package) used in the analysis had categorical scales, and three continuous variables (presentation time in a scheduled visit, presentation time in an unscheduled visit, and total presentation time) were not normally distributed. Below, Table 1 represents all visit variables in detail, with the numerical data that we analyzed in our study.
Descriptive statistics and frequency distributions of the variables used in the analysis are summarized in Table 2 and Table 3 (since these are interim descriptive statistics describing the current situation, we did not include them in the results section).
Table 2.
Frequency distribution and descriptive statistics of variables.
Table 3.
Frequency distribution of package (90% of the sample was summarized).
According to the summary statistics in Table 2, on the basis of segment levels of target doctors in the first three months of 2020, it was determined that the doctors in the BD(S8), BC(S7), and CD(S12) segments were mostly contacted. In 2021, communication and CLM strategies were carried out mostly for the CD (S12), BC(S7), and BD(S8) segment groups, respectively. Compared to the previous year, an increase was observed in the frequency of the BD(S7), CD(S12), DA(S13), DC(S15), and DD(S16) segments in the first quarter of 2021.
Due to the COVID-19 pandemic, CRM and CLM strategies for physicians, which are limited and can usually be performed remotely, seemed to focus on physicians in the less-loyal segment compared to the level of relationship they established with the relevant pharmaceutical company. In a study conducted in Germany, it was reported that physicians who were “visited more than 2–3 times a day or a week” tended to write more prescriptions and more products compared to those who were visited less frequently [36]. Our findings revealed that salespeople effectively plan customer retention strategies in line with the notes on SFA during their field visits. In order to use this time limit efficiently, lines concentrate on introducing the company’s products to new physician segments.
Our findings suggest that the L4 group was the most active online basis in the first three months of 2020 and 2021. This result is consistent with the findings on the most promoted products in 2020 and 2021. We may clearly say this because most of these drugs (for example P1, P5, P6, and P15) are products presented to internal medicine specialists by the line L4. Compared to the previous year, an increase was observed in the frequency of visits of L1, L2, and L4 lines in the first three months of 2021. These results are consistent with the findings of the most promoted drugs in our study because the products promoted by lines L1 and L2 had pain killers and antipyretic and antihistaminic effects, relieving nasal itching and curing allergic rhinitis. Additionally, these clearly revealed the effect of COVID-19 on the marketing plan design of the pharmaceutical company. These products became the most asked-for drugs with the emergence of COVID-19 symptoms by internal medicine specialists. As we mentioned above, medical authorities highlighted that the pathogenesis of the virus is still not fully known. The physicians were interested in different products according to the symptoms they encountered in the COVID-19 period. Hence, the usage of an SFA system is important because the purpose of CLM is to make the data collected from the lines actionable and measurable and to incorporate the proper use of this data to tailor future marketing strategies.
There was a remarkable result regarding the active ingredients of the products under review in this study. The most promoted products in 2020 and 2021 were P5 (vitamin B1 in combination with vitamin B6 and/or vitamin B12) and P6 (vitamin B1-vitamin B6-vitamin B12-thioctic acid), respectively. The active ingredient of the prominent product P15 in 2020 was an agent that regulates digestive motility, whereas (P1), promoted in 2021, contained an agent that has anti-inflammatory, analgesic, and antipyretic effects. This is because people with COVID-19 have a wide range of symptoms, such as fever or chills, muscle or body aches, and headaches [32]. Compared to the previous year, we also observed an increase in the frequency of P1, P5, P7, P8, P9, P12, and P13 products in the first quarter of 2021. When the active ingredients of these products were examined, we affirmed that they are often used in the treatment of COVID-19 symptoms, such as curing allergic rhinitis, improving asthma symptoms, treating allergies with antihistamines, and relieving sneezing, nasal itching, discharge, and congestion. These results revealed again the effect of COVID-19 on the marketing plan and medical education content design of the pharmaceutical company.
These findings are also consistent with the results of the following study: According to a study conducted in the United States of America (USA), between 2008 and 2009 [37], it was reported that the prescription of antibiotics increased significantly with CRM and CLM activities compared to those without. In order to increase the knowledge and the access of internal medicine specialists regarding drugs used in the treatment of COVID-19 during the pandemic in Turkey, target visits and selected packages by the pharmaceutical company’s salespeople were introduced through SFA.
When the length of packages was examined, the average presentation time allocated during scheduled visits in 2020 was 58.94 min, and the standard deviation was 90.38 min, while during unscheduled visits, the average of this time dropped to 34.05 min and its standard deviation to 67.30 min. The average of the total length of time was 61.13 min, and the standard deviation was 94.47 min in 2020. However, the average of the presentation time allotted during scheduled visits in 2021 was 43.4 min, and the standard deviation was 76.25 min, while during unscheduled visits, the average of this time dropped to 30.59 min and its standard deviation to 58.45 min. The average of the total length was 46 min, and the standard deviation was 81.97 min in 2021. The figures in the table above indicate that there was a decrease in the average length of presentation time allocated for each type of visit in 2021. We can argue that the summary statistics reflect the possible impact of the COVID-19 pandemic because of lockdowns.
Table 3 shows the package group that made up 90% of the frequency distributions offered by salespeople during the physician visits. Hence, while the PC1-5 (about diabetes) presentation was delivered at a rate of 7.6% in 2020, this presentation was not made in 2021. Instead, there was an increase in the frequency of the PC2-5 (8.3%) presentation about the P5 product, with the active ingredient vitamin B1 in combination with vitamin B6 and/or vitamin B12, in 2021. This finding reveals the effect of COVID-19 on the medical education content design of the company because researchers were studying whether vitamin B can prevent or reverse a cytokine storm, one of the major complications and causes of death in COVID-19 patients [38]. It has also been suggested that vitamin B not only helps to build and maintain a healthy immune system, but it could potentially prevent or reduce COVID-19 symptoms or treat SARS-CoV-2 infection [39]. While packages about allergic rhinitis were prioritized in 2020, the frequency of presentations of packages about the efficacy of combined therapy in bronchitis (0.5%) and those about the relationship between bronchitis and asthma (0.5%) increased in 2021. These findings coincide with the findings above on the frequency of the most promoted products in the first quarter of 2021.
3.2. Methodology
3.2.1. Correspondence Analysis
Correspondence analysis (CA), a multivariate descriptive statistical method designed to explore relationships among categorical variables, provides a graphical representation of the relationships among variables on two-way or multiple contingency tables. There are two forms of correspondence analysis. The first is simple correspondence analysis, which is used to analyze contingency tables of two categorical variables, whereas the second, multiple correspondence analysis, is applied to cross-tabulation with three or more variables.
Correspondence analysis, which calculates inertia estimates of categorical variables based on the Euclidean distance and defines a loss function, minimizes loss function using weighted least squares in an attempt to maximize variable homogeneity.
3.2.2. Simple Correspondence Analysis (SCA)
Let X, with elements xij, be an two-way table of unscaled frequencies. If n is the total of frequencies in data matrix X, then the matrix of proportions is shown as . The matrix P is called the correspondence matrix. The vectors of row and column sums r and c, respectively, and diagonal matrices are Dr = diag(r) and Dc = diag(c), respectively. The correspondence analysis can be formulated as follows [40]:
The term is common to approximation whatever the correspondence matrix P. The reduced rank s approximation to P is as follows:
where are the singular values, and the vectors and vectors are the corresponding singular vectors of the matrix . The reduced rank K > 1 approximation to P-rc′ is as follows:
where are the singular values, and the vectors and vectors are the corresponding singular vectors of the matrix . Here, , , and for k = 1, 2,…, J − 1.
In correspondence analysis, the eigenvalues are often called inertias [41]. The inertia associated with the best reduced rank K < J approximation to the center matrix has inertia .
3.2.3. Multiple Correspondence Analysis (MCA)
The correspondence analysis for bivariate (two-way) crosstabs can be extended with three or more variables crosstabs. Another approach is the multi-way frequency table, known as MCA, organized as a two-way table. The MCA technique uses a distance measure instead of the orthogonalization technique used in the Principal Components Technique. MCA transfers the relationship between categories to coordinates in a multidimensional space. With this technique, the categories are scaled and the variance is maximized to calculate the associations between the variables and the proximity between individuals. Points in the same direction from the origin are highly correlated [42].
The working principle of MCA is that two or more categorical variables can be recoded in an indicator matrix as dummy variables or in a Burt matrix (B), where B = X′X, as a combination of categories by categories [43].
There are two main methods for carrying out MCA; one involves the use of an indicator matrix and the other of a Burt matrix, obtained from an initial indicator matrix [44]. A fit analysis with the help of the X matrix and a fit analysis with the help of the X′X matrix, which is called the Burt matrix, are equivalent to each other. The Burt matrix is in the form of a block-square matrix and is obtained as a two-way crosstab. The two main reasons for using the Burt matrix in the current study were that it is easy to interpret and suitable for the analysis of large data sets. In MCA, the proportions of the total inertia (squared singular values) accounted for by the inertia tend to be underestimated because the total inertia is inflated due to fitting both diagonal and off-diagonal blocks of the Burt table [45].
Burt matrices created in the study are presented in Appendix A and Appendix B.
4. Results and Discussion
In line with the purpose of the study, analyses were conducted with SPSS-26 and Statgraphics-19 package programs.
H1, H2, and H3 hypotheses were constructed to measure the effect of the COVID-19 pandemic and to determine the differences between the averages of visit times between the two selected periods. The normality test was performed before testing the relevant hypotheses. The results indicated that the data did not follow normal distribution according to the Kolmogorov-Smirnov normality result (p = 0.00). In Table 4, alternative hypotheses (H1, H2, H3) were tested with the nonparametric method, Mann–Whitney U, and the results are given.
Table 4.
Hypothesis test results.
According to the findings in Table 4, H1, H2, and H3 hypotheses were accepted at a significance level of α = 0.01. There was a difference between the average visit times of the years 2020 and 2021. In this respect, the mean ranks indicated that there was a decrease in the scheduled, unscheduled, and total length of visit time during the period in 2021 under review in this study due to the surge of the COVID-19 pandemic.
The relationship between product and package within the time period under review also needed to be explored in this study. Therefore, the H4 hypothesis that was tested by chi-square analysis, and Table 5 was created using Cross-Tabulation.
Table 5.
Product and package cross-tabulation.
According to Table 5, the H4 alternative hypothesis was accepted at a significance level of α = 0.01. In this respect, the figures confirmed a statistical correlation between product and package. As we showed above on this screen shot example about the product and related package introduced to the physician, this watching data (ex. which physician watched which package for how many seconds) are able to derive inferences on the content preferred by the healthcare professional. The results of SCA, which identify the correlation between product and segment (H6), which is another hypothesis put forth in this study, are given in Table 6.
Table 6.
Result of SCA (product and segment inertia and chi-square decomposition).
Table 7 indicates that the results of SCA on the basis of two dimensions explained 77.82% of inertia in 2020 and 80.91% of inertia in 2021. The test statistics indicated that the H6 alternative hypothesis was accepted at a significance level of α = 0.01 and confirmed a correlation between product and segment. The correspondence map generated based on these results is given in Figure 1.
Table 7.
Product and line cross-tabulation.
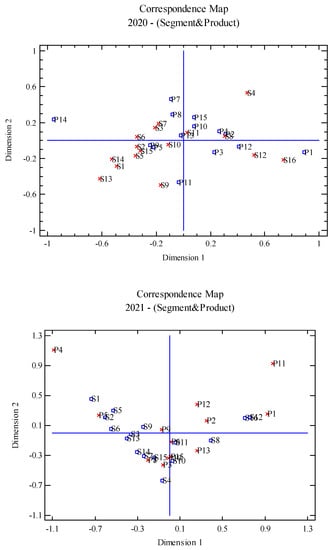
Figure 1.
Correspondence maps of segment and product for 2020–2021.
Figure 1 reveals that the decomposition of the products P11 and P4 had the most significant difference between 2020 and 2021, and S4 moved differently in 2021 compared to 2020. In addition, physicians in the S12 and S16 segments preferred the products P1, P2, P3, and P12 in 2020, whereas the physicians in the aforementioned segments preferred P11 instead of P3 in 2021. In 2020, physicians in the S1, S2, S5, and S9 segments preferred P5, whereas P5 and P4 were preferred by physicians in the S1, S2, S3, S5, and S6 segments in 2021.
When the active ingredients of these products often used in the treatment of COVID-19 are examined, it is shown that they are also used to treat symptoms such as allergic rhinitis, asthma symptoms, allergies, sneezing, and nasal itching, discharge, and congestion. These results reveal again the effect of COVID-19 on the marketing design, as mentioned earlier in the text. Considering that the S12 and S16 segments were low categories in terms of physician loyalty level, we may suggest that these well-known drugs of the company were preferred in COVID-19 treatment and provided an advantage to develop effective CRM and CLM strategies to newly targeted physicians.
Another hypothesis (H8) was constructed to investigate the relationship between product and line. Chi-square test statistics were calculated, and the hypothesis was tested. We should clarify that we tried to investigate the COVID-19 pandemic effect on relational dimension, since the variables subject to analysis were categorical. Impact analysis can be performed by adding sales data to further studies.
According to Table 7, alternative hypothesis H8 was accepted at a significance level of α = 0.01. The table shows that product and line were statistically correlated. It was reported that physicians who were “visited more than 2–3 times a day or a week” tended to write more prescriptions and content compared to those who were visited less frequently, in a study conducted in Germany [36]. According to another study conducted in the USA between 2008 and 2009, it was reported that the prescription of antibiotics with promotional activities increased significantly compared to those without [37]. In our study, we highlighted the COVID-19 effect on this routine visit process. Clinical studies and vaccination studies are still ongoing. Currently, “effective infection control intervention is the only way to prevent the spread of SARS-CoV-2. The most appropriate prophylactic regimen for patients under observation due to COVID-19 related disease is unknown. For this reason, treatment protocols should be planned by following the current guidelines” [46]. Physicians are interested in different products according to the symptoms they encounter in the COVID-19 period, regarding their own experiences. In order to suggest this scientifically, we found that the line introduces different products by planning more frequent visits, according to the frequency increase in the interest level shown by the physicians to these products.
SCA test results for H5 are shown in Table 8, and the correlation of line and region in 2020 and 2021 is illustrated in Figure 2. We should clarify that we included the first 3 months of 2020 and 2021 in our study. Because, even if we took a full year, it would not change the “significantly associated/not associated” factor that we investigated in our hypotheses. The sample that we used in our study has the ability to represent the main mass.
Table 8.
Result of SCA (line and region inertia and chi-square decomposition).
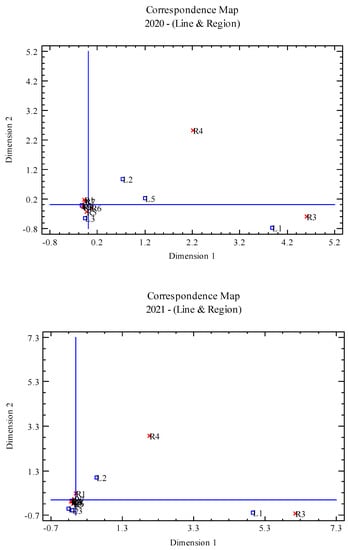
Figure 2.
Correspondence maps of line and region for 2020–2021.
According to Table 8, the alternative hypothesis H5 was accepted at a significance level of α = 0.01. There was a statistical correlation between region and line. The test results of SCA on the basis of the first two dimensions explained 92.30% of inertia in 2020 and 95.91% in 2021. The correspondence maps generated based on these results is given in Figure 2.
Figure 2 shows that there was no significant difference between the line and region relationships between 2020 and 2021 first trimester periods. While lines L2 and L5 operated in the R4 region in 2020, line L5 moved to a different region in 2021. Line L1 worked in the R3 region in both periods.
Finally, the H7 hypothesis, which aimed to investigate the relationship between four variables (product, segment, line, and region), was tested by calculating the Burt matrix, and the relevant results are given in Table 9.
Table 9.
Result of MCA (product, segment, line, and region inertia and chi-square decomposition).
Table 9 indicates the MCA results gathered using the Burt matrix based on the first two dimensions, explaining 20.03% of inertia in 2020 and 22.24% of inertia in 2021. The correspondence maps generated based on these results are given in Figure 3.
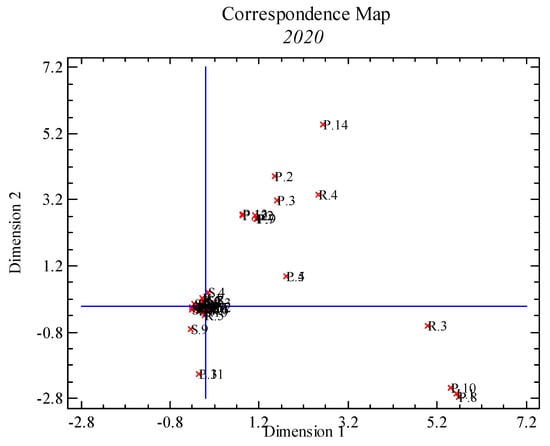
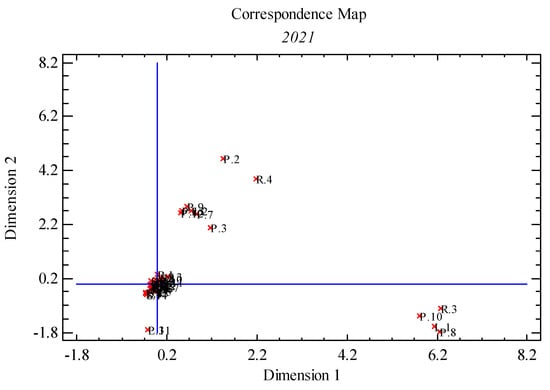
Figure 3.
Correspondence maps of product, segment, line, and region for 2020 and 2021.
According to Figure 3, there were four groups formed in both years that provided a multiple correspondence level, but we should underline that we analyzed each year in itself. We did not compare the years 2020 and 2021. We tried to evaluate whether there was an increase in frequency in the number and type of products introduced, the segment profile of the physicians, and the visit planning of the lines due to COVID-19 each year. Thus, we tested the hypotheses by performing correspondence analysis and evaluated the relationship between the product, line, and segment categorical variables. Our inferences for 2020 and 2021 are as follows:
The groups had the following variables in 2020:
Group 1: P14, P2, P3, and R4 (Southeastern Anatolia).
Group 2: P4, P5, P7, P9, P12, P13, and L2.
Group 3: R3 (Aegean), P10, P8, L1, and S9 (CA).
Group 4: P11 and L3.
The groups had the following variables in 2021:
Group 1: P2 and P4
Group 2: P3, P7, P9, P12, P13, and L2
Group 3: R3, P10, P8, and L1
Group 4: P11 and L3.
5. Conclusions
Coronavirus disease seemed to be far away and insignificant to most people and physicians around the world. This caused great anxiety and fear in society. Negative conditions and uncertainties, such as lack of information, misinformation, viruses, unrecognized treatment, and vaccines, have had consequences in a number of sectors, with direct implications for people’s daily lives. The measures taken to contain the spread of the virus since the outbreak of the pandemic in March 2020 in Turkey have had a profound impact on the pharma sector, just as on all spheres of life. A lot of people chose to stay home due to the pandemic and reduced non-urgent treatments or needs, followed by a restriction of access to public health care services and physicians, which, in turn, resulted in a regression to a level prior to 2017, with 2.2 billion boxes of products sold [12]. The imposition of pandemic restrictions and the prioritization of the COVID-19 pandemic in health care services culminated in a decrease in continuing medical education activity numbers.
In addition, most of the countries in the world prohibit prescription drug advertising and promotion directly to consumers. The regulation of pharmaceutical promotion is carried out directly by the government (including France and the United States) or through industry self-regulation (including in the United Kingdom). With the increasing competition, the pharmaceutical industry needs to evolve new detailing and education tools in order to make patients and physicians aware of new treatments. Thus, it was identified that real-time customer-centric data-based CLM strategies, such as visit types and durations, drug prescription rates, interested packages, physicians’ loyalty levels, etc., in 2020 changed in 2021 due to COVID-19. However, SFA paves the way for easily adapting the lines of the company to digital technologies in a short span of time instead of conventional methods.
For pharma, some of the changes we outlined above will remain even after the crisis has ended, once the pharma industry and its customers learn to function in a world without face-to-face detailing. In the meantime, marketers should not be afraid to experiment with multiple channels and to treat the current operating environment as a learning opportunity. Digital flips match with physicians that prefer to engage via digital channels. However, a survey conducted by McKinsey in Europe showed that the average number of in-person contact between healthcare professionals and pharma sales people was 70 percent lower in September 2020 than before the pandemic [32]. This is consistent with our H1, H2, and H3 hypotheses and our research findings. While the COVID-19 pandemic presented a big crisis to pharmaceutical companies, instant changes in SFA’s technology structures allowed them to maintain the relationship between the lines and health professionals. Thus, although COVID-19 is an uncertain disease, and treatment protocols change very rapidly with instant findings, with the digitalization provided by SFA, updated promotional and training materials and detailing strategies can be transmitted to field teams instantly from the center. This also provides the opportunity to rapidly meet the continuing medical education needs of target physicians. Moreover, our findings suggested that many companies may adopt new retargeting strategies when people are under various restrictions during, for example, the pandemic crisis. Finally, we may suggest that digital technologies support organization in the process of transforming from product-centered to value-creating business models.
6. Limitations and Future Research
In the present study, the input data only represented the selected organization. One of the primary reasons for this limitation is they ignore important data relevant to sales because of organizational confidentiality. However, the possibility of remote detailing with SFA tools was useful to maintain interactions with physicians that worked in difficult conditions during the COVID-19 pandemic, when it was difficult to geographically access the target groups because of lockdowns and social distancing. Therewith, some key elements in the detailing techniques changed totally in order to sustain the pharmaceutical field and to counter COVID-19 side effects. We believe that we are the first to provide new evidence for empowering the field force with SFA by comparing the customer- and product-related capabilities before and during the COVID-19 crisis to establish and maintain customer relationships in value-creating behaviors.
The pharmaceutical industry, one of the most growing industries in the world, accepted to comply with a digital change that required some innovative steps in established business processes and corporate culture, for example, conducting hybrid studies, targeting healthcare professionals remotely, turning collected data into actionable data to optimize sales, and adapting real-time instantly business strategies. From a managerial perspective, resources are finite, pressures to gain or maintain market share are high, and medical representatives are a key contributor to the firm. This field force plays a ubiquitous role in transferring knowledge on a particular product to healthcare professionals. The future research possibilities for medical representatives’ performances and adaptive behaviors are exciting. Tanhan and Strack [47] developed the online photovoice (OPV) method to reduce costs and time spent for online interactions where face-to-face interaction is impossible or very difficult due to a pandemic or endemic, security problems, conflicts, or natural disasters. For further studies, online photovoice may be a new research method for hospital meetings organized periodically by pharmaceutical companies in order to reach diverse healthcare providers. In addition to this, further studies may occur regarding behavioral intentions and the user acceptance level of the technology, and that is not the end-result that was sought in this research. The key question to be answered here is whether or not voluntariness and personal skills have an effect on implementation success.
Author Contributions
Study conceptualization: E.Y.A.; study investigation: E.Y.A.; formal analysis: E.Y.A. and E.C.Y.; writing—original draft preparation: E.Y.A. and E.C.Y.; writing—review and editing: E.Y.A. All authors have read and agreed to the published version of the manuscript.
Funding
This research received no external funding.
Institutional Review Board Statement
Not applicable.
Informed Consent Statement
Not applicable.
Data Availability Statement
The data presented in this study are available on request from the corresponding author. The data are not publicly available due to corporate confidentiality. The dataset of the study involves the real data of a real pharmaceutical company.
Acknowledgments
The authors are grateful to “TCM Software and Consultancy Company” for gathering data and for their support to this study in its initial phases owing to the sales force automation (SFA) tool they established. The authors would like to offer their special thanks to Abdullah Çağrı Tolga for his exchange of ideas conducted for this study.
Conflicts of Interest
The authors declare no conflict of interest.
Appendix A. 2020 Burt Matrix
| L.1 | L.2 | L.3 | L.4 | L.5 | R.1 | R.2 | R.3 | R.4 | R.5 | R.6 | R.7 | R.8 | S.1 | S.2 | S.3 | S.4 | |
| L.1 | 86 | 0 | 0 | 0 | 0 | 3 | 0 | 36 | 2 | 14 | 14 | 5 | 12 | 1 | 1 | 6 | 0 |
| L.2 | 0 | 276 | 0 | 0 | 0 | 94 | 17 | 18 | 16 | 8 | 21 | 67 | 35 | 24 | 19 | 19 | 15 |
| L.3 | 0 | 0 | 163 | 0 | 0 | 17 | 24 | 0 | 0 | 43 | 46 | 0 | 33 | 14 | 2 | 9 | 0 |
| L.4 | 0 | 0 | 0 | 6359 | 0 | 1160 | 1181 | 0 | 0 | 682 | 770 | 1156 | 1410 | 402 | 421 | 262 | 130 |
| L.5 | 0 | 0 | 0 | 0 | 199 | 9 | 51 | 23 | 10 | 14 | 48 | 26 | 18 | 4 | 15 | 18 | 2 |
| R.1 | 3 | 94 | 17 | 1160 | 9 | 1283 | 0 | 0 | 0 | 0 | 0 | 0 | 0 | 85 | 38 | 27 | 21 |
| R.2 | 0 | 17 | 24 | 1181 | 51 | 0 | 1273 | 0 | 0 | 0 | 0 | 0 | 0 | 78 | 65 | 62 | 16 |
| R.3 | 36 | 18 | 0 | 0 | 23 | 0 | 0 | 77 | 0 | 0 | 0 | 0 | 0 | 1 | 1 | 2 | 4 |
| R.4 | 2 | 16 | 0 | 0 | 10 | 0 | 0 | 0 | 28 | 0 | 0 | 0 | 0 | 0 | 7 | 4 | 0 |
| R.5 | 14 | 8 | 43 | 682 | 14 | 0 | 0 | 0 | 0 | 761 | 0 | 0 | 0 | 44 | 110 | 49 | 16 |
| R.6 | 14 | 21 | 46 | 770 | 48 | 0 | 0 | 0 | 0 | 0 | 899 | 0 | 0 | 32 | 86 | 46 | 30 |
| R.7 | 5 | 67 | 0 | 1156 | 26 | 0 | 0 | 0 | 0 | 0 | 0 | 1254 | 0 | 70 | 68 | 56 | 23 |
| R.8 | 12 | 35 | 33 | 1410 | 18 | 0 | 0 | 0 | 0 | 0 | 0 | 0 | 1508 | 135 | 83 | 68 | 37 |
| S.1 | 1 | 24 | 14 | 402 | 4 | 85 | 78 | 1 | 0 | 44 | 32 | 70 | 135 | 445 | 0 | 0 | 0 |
| S.2 | 1 | 19 | 2 | 421 | 15 | 38 | 65 | 1 | 7 | 110 | 86 | 68 | 83 | 0 | 458 | 0 | 0 |
| S.3 | 6 | 19 | 9 | 262 | 18 | 27 | 62 | 2 | 4 | 49 | 46 | 56 | 68 | 0 | 0 | 314 | 0 |
| S.4 | 0 | 15 | 0 | 130 | 2 | 21 | 16 | 4 | 0 | 16 | 30 | 23 | 37 | 0 | 0 | 0 | 147 |
| S.5 | 4 | 9 | 15 | 391 | 6 | 76 | 156 | 2 | 0 | 23 | 23 | 55 | 90 | 0 | 0 | 0 | 0 |
| S.6 | 13 | 39 | 24 | 686 | 11 | 118 | 156 | 2 | 2 | 121 | 115 | 103 | 156 | 0 | 0 | 0 | 0 |
| S.7 | 28 | 42 | 16 | 1109 | 29 | 194 | 176 | 20 | 2 | 141 | 160 | 305 | 226 | 0 | 0 | 0 | 0 |
| S.8 | 10 | 63 | 5 | 1161 | 58 | 239 | 277 | 17 | 3 | 96 | 225 | 176 | 264 | 0 | 0 | 0 | 0 |
| S.9 | 0 | 0 | 10 | 55 | 0 | 5 | 16 | 0 | 0 | 5 | 3 | 4 | 32 | 0 | 0 | 0 | 0 |
| S.10 | 2 | 3 | 9 | 154 | 4 | 53 | 37 | 2 | 1 | 5 | 11 | 15 | 48 | 0 | 0 | 0 | 0 |
| S.11 | 4 | 9 | 12 | 369 | 9 | 94 | 69 | 10 | 2 | 45 | 35 | 72 | 76 | 0 | 0 | 0 | 0 |
| S.12 | 15 | 30 | 45 | 1045 | 43 | 306 | 155 | 16 | 7 | 84 | 124 | 234 | 252 | 0 | 0 | 0 | 0 |
| S.13 | 0 | 0 | 0 | 25 | 0 | 0 | 0 | 0 | 0 | 3 | 0 | 18 | 4 | 0 | 0 | 0 | 0 |
| S.14 | 0 | 0 | 0 | 28 | 0 | 0 | 0 | 0 | 0 | 4 | 0 | 11 | 13 | 0 | 0 | 0 | 0 |
| S.15 | 0 | 1 | 0 | 36 | 0 | 10 | 0 | 0 | 0 | 6 | 0 | 11 | 10 | 0 | 0 | 0 | 0 |
| S.16 | 2 | 3 | 2 | 85 | 0 | 17 | 10 | 0 | 0 | 9 | 9 | 33 | 14 | 0 | 0 | 0 | 0 |
| P.1 | 0 | 0 | 0 | 846 | 0 | 242 | 123 | 0 | 0 | 28 | 70 | 171 | 212 | 3 | 12 | 11 | 34 |
| P.2 | 0 | 7 | 0 | 0 | 0 | 2 | 0 | 0 | 3 | 1 | 0 | 1 | 0 | 0 | 3 | 0 | 1 |
| P.3 | 0 | 17 | 0 | 0 | 0 | 3 | 4 | 2 | 4 | 0 | 0 | 0 | 4 | 0 | 4 | 0 | 0 |
| P.4 | 0 | 0 | 0 | 0 | 199 | 9 | 51 | 23 | 10 | 14 | 48 | 26 | 18 | 4 | 15 | 18 | 2 |
| P.5 | 0 | 0 | 0 | 1576 | 0 | 227 | 348 | 0 | 0 | 144 | 205 | 293 | 359 | 207 | 216 | 80 | 4 |
| P.6 | 0 | 0 | 0 | 2510 | 0 | 439 | 472 | 0 | 0 | 371 | 273 | 461 | 494 | 164 | 131 | 106 | 39 |
| P.7 | 0 | 126 | 0 | 0 | 0 | 32 | 6 | 11 | 3 | 1 | 19 | 36 | 18 | 9 | 9 | 14 | 14 |
| P.8 | 58 | 0 | 0 | 0 | 0 | 3 | 0 | 26 | 0 | 7 | 10 | 3 | 9 | 0 | 1 | 2 | 0 |
| P.9 | 0 | 51 | 0 | 0 | 0 | 21 | 2 | 5 | 2 | 1 | 1 | 14 | 5 | 6 | 0 | 3 | 0 |
| P.10 | 28 | 0 | 0 | 0 | 0 | 0 | 0 | 10 | 2 | 7 | 4 | 2 | 3 | 1 | 0 | 4 | 0 |
| P.11 | 0 | 0 | 163 | 0 | 0 | 17 | 24 | 0 | 0 | 43 | 46 | 0 | 33 | 14 | 2 | 9 | 0 |
| P.12 | 0 | 28 | 0 | 0 | 0 | 20 | 3 | 0 | 1 | 1 | 1 | 1 | 1 | 2 | 0 | 0 | 0 |
| P.13 | 0 | 46 | 0 | 0 | 0 | 16 | 2 | 0 | 2 | 4 | 0 | 15 | 7 | 7 | 3 | 2 | 0 |
| P.14 | 0 | 1 | 0 | 0 | 0 | 0 | 0 | 0 | 1 | 0 | 0 | 0 | 0 | 0 | 0 | 0 | 0 |
| P.15 | 0 | 0 | 0 | 1427 | 0 | 252 | 238 | 0 | 0 | 139 | 222 | 231 | 345 | 28 | 62 | 65 | 53 |
| S.5 | S.6 | S.7 | S.8 | S.9 | S.10 | S.11 | S.12 | S.13 | S.14 | S.15 | S.16 | P.1 | P.2 | P.3 | P.4 | |
| L.1 | 4 | 13 | 28 | 10 | 0 | 2 | 4 | 15 | 0 | 0 | 0 | 2 | 0 | 0 | 0 | 0 |
| L.2 | 9 | 39 | 42 | 63 | 0 | 3 | 9 | 30 | 0 | 0 | 1 | 3 | 0 | 7 | 17 | 0 |
| L.3 | 15 | 24 | 16 | 5 | 10 | 9 | 12 | 45 | 0 | 0 | 0 | 2 | 0 | 0 | 0 | 0 |
| L.4 | 391 | 686 | 1109 | 1161 | 55 | 154 | 369 | 1045 | 25 | 28 | 36 | 85 | 846 | 0 | 0 | 0 |
| L.5 | 6 | 11 | 29 | 58 | 0 | 4 | 9 | 43 | 0 | 0 | 0 | 0 | 0 | 0 | 0 | 199 |
| R.1 | 76 | 118 | 194 | 239 | 5 | 53 | 94 | 306 | 0 | 0 | 10 | 17 | 242 | 2 | 3 | 9 |
| R.2 | 156 | 156 | 176 | 277 | 16 | 37 | 69 | 155 | 0 | 0 | 0 | 10 | 123 | 0 | 4 | 51 |
| R.3 | 2 | 2 | 20 | 17 | 0 | 2 | 10 | 16 | 0 | 0 | 0 | 0 | 0 | 0 | 2 | 23 |
| R.4 | 0 | 2 | 2 | 3 | 0 | 1 | 2 | 7 | 0 | 0 | 0 | 0 | 0 | 3 | 4 | 10 |
| R.5 | 23 | 121 | 141 | 96 | 5 | 5 | 45 | 84 | 3 | 4 | 6 | 9 | 28 | 1 | 0 | 14 |
| R.6 | 23 | 115 | 160 | 225 | 3 | 11 | 35 | 124 | 0 | 0 | 0 | 9 | 70 | 0 | 0 | 48 |
| R.7 | 55 | 103 | 305 | 176 | 4 | 15 | 72 | 234 | 18 | 11 | 11 | 33 | 171 | 1 | 0 | 26 |
| R.8 | 90 | 156 | 226 | 264 | 32 | 48 | 76 | 252 | 4 | 13 | 10 | 14 | 212 | 0 | 4 | 18 |
| S.1 | 0 | 0 | 0 | 0 | 0 | 0 | 0 | 0 | 0 | 0 | 0 | 0 | 3 | 0 | 0 | 4 |
| S.2 | 0 | 0 | 0 | 0 | 0 | 0 | 0 | 0 | 0 | 0 | 0 | 0 | 12 | 3 | 4 | 15 |
| S.3 | 0 | 0 | 0 | 0 | 0 | 0 | 0 | 0 | 0 | 0 | 0 | 0 | 11 | 0 | 0 | 18 |
| S.4 | 0 | 0 | 0 | 0 | 0 | 0 | 0 | 0 | 0 | 0 | 0 | 0 | 34 | 1 | 0 | 2 |
| S.5 | 425 | 0 | 0 | 0 | 0 | 0 | 0 | 0 | 0 | 0 | 0 | 0 | 15 | 0 | 0 | 6 |
| S.6 | 0 | 773 | 0 | 0 | 0 | 0 | 0 | 0 | 0 | 0 | 0 | 0 | 11 | 0 | 2 | 11 |
| S.7 | 0 | 0 | 1224 | 0 | 0 | 0 | 0 | 0 | 0 | 0 | 0 | 0 | 53 | 0 | 2 | 29 |
| S.8 | 0 | 0 | 0 | 1297 | 0 | 0 | 0 | 0 | 0 | 0 | 0 | 0 | 272 | 1 | 4 | 58 |
| S.9 | 0 | 0 | 0 | 0 | 65 | 0 | 0 | 0 | 0 | 0 | 0 | 0 | 5 | 0 | 0 | 0 |
| S.10 | 0 | 0 | 0 | 0 | 0 | 172 | 0 | 0 | 0 | 0 | 0 | 0 | 13 | 0 | 0 | 4 |
| S.11 | 0 | 0 | 0 | 0 | 0 | 0 | 403 | 0 | 0 | 0 | 0 | 0 | 46 | 0 | 0 | 9 |
| S.12 | 0 | 0 | 0 | 0 | 0 | 0 | 0 | 1178 | 0 | 0 | 0 | 0 | 334 | 2 | 5 | 43 |
| S.13 | 0 | 0 | 0 | 0 | 0 | 0 | 0 | 0 | 25 | 0 | 0 | 0 | 0 | 0 | 0 | 0 |
| S.14 | 0 | 0 | 0 | 0 | 0 | 0 | 0 | 0 | 0 | 28 | 0 | 0 | 0 | 0 | 0 | 0 |
| S.15 | 0 | 0 | 0 | 0 | 0 | 0 | 0 | 0 | 0 | 0 | 37 | 0 | 2 | 0 | 0 | 0 |
| S.16 | 0 | 0 | 0 | 0 | 0 | 0 | 0 | 0 | 0 | 0 | 0 | 92 | 35 | 0 | 0 | 0 |
| P.1 | 15 | 11 | 53 | 272 | 5 | 13 | 46 | 334 | 0 | 0 | 2 | 35 | 846 | 0 | 0 | 0 |
| P.2 | 0 | 0 | 0 | 1 | 0 | 0 | 0 | 2 | 0 | 0 | 0 | 0 | 0 | 7 | 0 | 0 |
| P.3 | 0 | 2 | 2 | 4 | 0 | 0 | 0 | 5 | 0 | 0 | 0 | 0 | 0 | 0 | 17 | 0 |
| P.4 | 6 | 11 | 29 | 58 | 0 | 4 | 9 | 43 | 0 | 0 | 0 | 0 | 0 | 0 | 0 | 199 |
| P.5 | 204 | 307 | 259 | 85 | 17 | 14 | 78 | 81 | 4 | 2 | 10 | 8 | 0 | 0 | 0 | 0 |
| P.6 | 117 | 209 | 465 | 533 | 23 | 85 | 136 | 414 | 21 | 23 | 18 | 26 | 0 | 0 | 0 | 0 |
| P.7 | 7 | 19 | 16 | 28 | 0 | 0 | 4 | 6 | 0 | 0 | 0 | 0 | 0 | 0 | 0 | 0 |
| P.8 | 4 | 9 | 22 | 6 | 0 | 0 | 3 | 11 | 0 | 0 | 0 | 0 | 0 | 0 | 0 | 0 |
| P.9 | 2 | 12 | 9 | 6 | 0 | 3 | 2 | 4 | 0 | 0 | 1 | 3 | 0 | 0 | 0 | 0 |
| P.10 | 0 | 4 | 6 | 4 | 0 | 2 | 1 | 4 | 0 | 0 | 0 | 2 | 0 | 0 | 0 | 0 |
| P.11 | 15 | 24 | 16 | 5 | 10 | 9 | 12 | 45 | 0 | 0 | 0 | 2 | 0 | 0 | 0 | 0 |
| P.12 | 0 | 2 | 7 | 6 | 0 | 0 | 1 | 10 | 0 | 0 | 0 | 0 | 0 | 0 | 0 | 0 |
| P.13 | 0 | 3 | 8 | 18 | 0 | 0 | 2 | 3 | 0 | 0 | 0 | 0 | 0 | 0 | 0 | 0 |
| P.14 | 0 | 1 | 0 | 0 | 0 | 0 | 0 | 0 | 0 | 0 | 0 | 0 | 0 | 0 | 0 | 0 |
| P.15 | 55 | 159 | 332 | 271 | 10 | 42 | 109 | 216 | 0 | 3 | 6 | 16 | 0 | 0 | 0 | 0 |
| P.5 | P.6 | P.7 | P.8 | P.9 | P.10 | P.11 | P.12 | P.13 | P.14 | P.15 | |
| L.1 | 0 | 0 | 0 | 58 | 0 | 28 | 0 | 0 | 0 | 0 | 0 |
| L.2 | 0 | 0 | 126 | 0 | 51 | 0 | 0 | 28 | 46 | 1 | 0 |
| L.3 | 0 | 0 | 0 | 0 | 0 | 0 | 163 | 0 | 0 | 0 | 0 |
| L.4 | 1576 | 2510 | 0 | 0 | 0 | 0 | 0 | 0 | 0 | 0 | 1427 |
| L.5 | 0 | 0 | 0 | 0 | 0 | 0 | 0 | 0 | 0 | 0 | 0 |
| R.1 | 227 | 439 | 32 | 3 | 21 | 0 | 17 | 20 | 16 | 0 | 252 |
| R.2 | 348 | 472 | 6 | 0 | 2 | 0 | 24 | 3 | 2 | 0 | 238 |
| R.3 | 0 | 0 | 11 | 26 | 5 | 10 | 0 | 0 | 0 | 0 | 0 |
| R.4 | 0 | 0 | 3 | 0 | 2 | 2 | 0 | 1 | 2 | 1 | 0 |
| R.5 | 144 | 371 | 1 | 7 | 1 | 7 | 43 | 1 | 4 | 0 | 139 |
| R.6 | 205 | 273 | 19 | 10 | 1 | 4 | 46 | 1 | 0 | 0 | 222 |
| R.7 | 293 | 461 | 36 | 3 | 14 | 2 | 0 | 1 | 15 | 0 | 231 |
| R.8 | 359 | 494 | 18 | 9 | 5 | 3 | 33 | 1 | 7 | 0 | 345 |
| S.1 | 207 | 164 | 9 | 0 | 6 | 1 | 14 | 2 | 7 | 0 | 28 |
| S.2 | 216 | 131 | 9 | 1 | 0 | 0 | 2 | 0 | 3 | 0 | 62 |
| S.3 | 80 | 106 | 14 | 2 | 3 | 4 | 9 | 0 | 2 | 0 | 65 |
| S.4 | 4 | 39 | 14 | 0 | 0 | 0 | 0 | 0 | 0 | 0 | 53 |
| S.5 | 204 | 117 | 7 | 4 | 2 | 0 | 15 | 0 | 0 | 0 | 55 |
| S.6 | 307 | 209 | 19 | 9 | 12 | 4 | 24 | 2 | 3 | 1 | 159 |
| S.7 | 259 | 465 | 16 | 22 | 9 | 6 | 16 | 7 | 8 | 0 | 332 |
| S.8 | 85 | 533 | 28 | 6 | 6 | 4 | 5 | 6 | 18 | 0 | 271 |
| S.9 | 17 | 23 | 0 | 0 | 0 | 0 | 10 | 0 | 0 | 0 | 10 |
| S.10 | 14 | 85 | 0 | 0 | 3 | 2 | 9 | 0 | 0 | 0 | 42 |
| S.11 | 78 | 136 | 4 | 3 | 2 | 1 | 12 | 1 | 2 | 0 | 109 |
| S.12 | 81 | 414 | 6 | 11 | 4 | 4 | 45 | 10 | 3 | 0 | 216 |
| S.13 | 4 | 21 | 0 | 0 | 0 | 0 | 0 | 0 | 0 | 0 | 0 |
| S.14 | 2 | 23 | 0 | 0 | 0 | 0 | 0 | 0 | 0 | 0 | 3 |
| S.15 | 10 | 18 | 0 | 0 | 1 | 0 | 0 | 0 | 0 | 0 | 6 |
| S.16 | 8 | 26 | 0 | 0 | 3 | 2 | 2 | 0 | 0 | 0 | 16 |
| P.1 | 0 | 0 | 0 | 0 | 0 | 0 | 0 | 0 | 0 | 0 | 0 |
| P.2 | 0 | 0 | 0 | 0 | 0 | 0 | 0 | 0 | 0 | 0 | 0 |
| P.3 | 0 | 0 | 0 | 0 | 0 | 0 | 0 | 0 | 0 | 0 | 0 |
| P.4 | 0 | 0 | 0 | 0 | 0 | 0 | 0 | 0 | 0 | 0 | 0 |
| P.5 | 1576 | 0 | 0 | 0 | 0 | 0 | 0 | 0 | 0 | 0 | 0 |
| P.6 | 0 | 2510 | 0 | 0 | 0 | 0 | 0 | 0 | 0 | 0 | 0 |
| P.7 | 0 | 0 | 126 | 0 | 0 | 0 | 0 | 0 | 0 | 0 | 0 |
| P.8 | 0 | 0 | 0 | 58 | 0 | 0 | 0 | 0 | 0 | 0 | 0 |
| P.9 | 0 | 0 | 0 | 0 | 51 | 0 | 0 | 0 | 0 | 0 | 0 |
| P.10 | 0 | 0 | 0 | 0 | 0 | 28 | 0 | 0 | 0 | 0 | 0 |
| P.11 | 0 | 0 | 0 | 0 | 0 | 0 | 163 | 0 | 0 | 0 | 0 |
| P.12 | 0 | 0 | 0 | 0 | 0 | 0 | 0 | 28 | 0 | 0 | 0 |
| P.13 | 0 | 0 | 0 | 0 | 0 | 0 | 0 | 0 | 46 | 0 | 0 |
| P.14 | 0 | 0 | 0 | 0 | 0 | 0 | 0 | 0 | 0 | 1 | 0 |
| P.15 | 0 | 0 | 0 | 0 | 0 | 0 | 0 | 0 | 0 | 0 | 1427 |
Appendix B. 2021 Burt Matrix
| S.1 | S.2 | S.3 | S.4 | S.5 | S.6 | S.7 | S.8 | S.9 | S.10 | S.11 | S.12 | S.13 | S.14 | S.15 | S.16 | L.1 | |
| S.1 | 296 | 0 | 0 | 0 | 0 | 0 | 0 | 0 | 0 | 0 | 0 | 0 | 0 | 0 | 0 | 0 | 0 |
| S.2 | 0 | 272 | 0 | 0 | 0 | 0 | 0 | 0 | 0 | 0 | 0 | 0 | 0 | 0 | 0 | 0 | 2 |
| S.3 | 0 | 0 | 211 | 0 | 0 | 0 | 0 | 0 | 0 | 0 | 0 | 0 | 0 | 0 | 0 | 0 | 6 |
| S.4 | 0 | 0 | 0 | 89 | 0 | 0 | 0 | 0 | 0 | 0 | 0 | 0 | 0 | 0 | 0 | 0 | 1 |
| S.5 | 0 | 0 | 0 | 0 | 287 | 0 | 0 | 0 | 0 | 0 | 0 | 0 | 0 | 0 | 0 | 0 | 2 |
| S.6 | 0 | 0 | 0 | 0 | 0 | 486 | 0 | 0 | 0 | 0 | 0 | 0 | 0 | 0 | 0 | 0 | 11 |
| S.7 | 0 | 0 | 0 | 0 | 0 | 0 | 836 | 0 | 0 | 0 | 0 | 0 | 0 | 0 | 0 | 0 | 24 |
| S.8 | 0 | 0 | 0 | 0 | 0 | 0 | 0 | 908 | 0 | 0 | 0 | 0 | 0 | 0 | 0 | 0 | 5 |
| S.9 | 0 | 0 | 0 | 0 | 0 | 0 | 0 | 0 | 47 | 0 | 0 | 0 | 0 | 0 | 0 | 0 | 0 |
| S.10 | 0 | 0 | 0 | 0 | 0 | 0 | 0 | 0 | 0 | 114 | 0 | 0 | 0 | 0 | 0 | 0 | 2 |
| S.11 | 0 | 0 | 0 | 0 | 0 | 0 | 0 | 0 | 0 | 0 | 256 | 0 | 0 | 0 | 0 | 0 | 5 |
| S.12 | 0 | 0 | 0 | 0 | 0 | 0 | 0 | 0 | 0 | 0 | 0 | 935 | 0 | 0 | 0 | 0 | 11 |
| S.13 | 0 | 0 | 0 | 0 | 0 | 0 | 0 | 0 | 0 | 0 | 0 | 0 | 34 | 0 | 0 | 0 | 0 |
| S.14 | 0 | 0 | 0 | 0 | 0 | 0 | 0 | 0 | 0 | 0 | 0 | 0 | 0 | 20 | 0 | 0 | 0 |
| S.15 | 0 | 0 | 0 | 0 | 0 | 0 | 0 | 0 | 0 | 0 | 0 | 0 | 0 | 0 | 35 | 0 | 0 |
| S.16 | 0 | 0 | 0 | 0 | 0 | 0 | 0 | 0 | 0 | 0 | 0 | 0 | 0 | 0 | 0 | 72 | 1 |
| L.1 | 0 | 2 | 6 | 1 | 2 | 11 | 24 | 5 | 0 | 2 | 5 | 11 | 0 | 0 | 0 | 1 | 70 |
| L.2 | 15 | 10 | 23 | 10 | 8 | 43 | 39 | 72 | 4 | 10 | 16 | 37 | 0 | 0 | 2 | 4 | 0 |
| L.3 | 0 | 0 | 0 | 0 | 2 | 0 | 0 | 0 | 0 | 0 | 0 | 8 | 0 | 0 | 0 | 0 | 0 |
| L.4 | 278 | 257 | 179 | 78 | 274 | 431 | 772 | 829 | 43 | 102 | 235 | 879 | 34 | 20 | 33 | 67 | 0 |
| L.5 | 3 | 3 | 3 | 0 | 1 | 1 | 1 | 2 | 0 | 0 | 0 | 0 | 0 | 0 | 0 | 0 | 0 |
| R.1 | 49 | 31 | 24 | 17 | 50 | 77 | 154 | 210 | 2 | 38 | 62 | 238 | 0 | 0 | 4 | 17 | 5 |
| R.2 | 53 | 23 | 36 | 8 | 84 | 119 | 141 | 203 | 9 | 21 | 44 | 134 | 0 | 1 | 2 | 8 | 0 |
| R.3 | 1 | 2 | 3 | 1 | 0 | 0 | 18 | 7 | 0 | 2 | 5 | 7 | 0 | 0 | 0 | 0 | 34 |
| R.4 | 0 | 1 | 7 | 0 | 0 | 4 | 1 | 2 | 0 | 0 | 4 | 6 | 0 | 0 | 0 | 0 | 4 |
| R.5 | 21 | 58 | 22 | 7 | 33 | 53 | 85 | 64 | 5 | 5 | 19 | 60 | 6 | 5 | 7 | 3 | 6 |
| R.6 | 18 | 48 | 27 | 12 | 9 | 50 | 86 | 112 | 1 | 4 | 18 | 78 | 0 | 0 | 0 | 4 | 6 |
| R.7 | 58 | 41 | 48 | 14 | 49 | 62 | 217 | 120 | 6 | 15 | 54 | 159 | 24 | 3 | 14 | 18 | 8 |
| R.8 | 96 | 68 | 44 | 30 | 62 | 121 | 134 | 190 | 24 | 29 | 50 | 253 | 4 | 11 | 8 | 22 | 7 |
| P.1 | 2 | 8 | 7 | 6 | 21 | 11 | 34 | 247 | 5 | 11 | 43 | 415 | 0 | 0 | 2 | 32 | 0 |
| P.2 | 0 | 1 | 0 | 0 | 0 | 0 | 0 | 0 | 0 | 0 | 3 | 2 | 0 | 0 | 0 | 0 | 0 |
| P.3 | 0 | 1 | 0 | 0 | 0 | 0 | 3 | 1 | 0 | 0 | 0 | 1 | 0 | 0 | 0 | 0 | 0 |
| P.4 | 15 | 3 | 3 | 0 | 1 | 1 | 1 | 2 | 0 | 0 | 0 | 0 | 0 | 0 | 0 | 0 | 0 |
| P.5 | 148 | 134 | 66 | 11 | 148 | 216 | 201 | 77 | 16 | 12 | 53 | 54 | 11 | 5 | 7 | 5 | 0 |
| P.6 | 97 | 88 | 71 | 27 | 71 | 137 | 350 | 361 | 14 | 55 | 92 | 292 | 21 | 12 | 13 | 20 | 0 |
| P.7 | 5 | 7 | 5 | 10 | 5 | 23 | 24 | 31 | 0 | 4 | 6 | 8 | 0 | 0 | 0 | 0 | 0 |
| P.8 | 0 | 2 | 3 | 0 | 2 | 7 | 20 | 2 | 0 | 1 | 4 | 8 | 0 | 0 | 0 | 0 | 49 |
| P.9 | 6 | 0 | 9 | 0 | 3 | 13 | 5 | 16 | 4 | 6 | 0 | 9 | 0 | 0 | 2 | 4 | 0 |
| P.10 | 0 | 0 | 3 | 1 | 0 | 4 | 4 | 3 | 0 | 1 | 1 | 3 | 0 | 0 | 0 | 1 | 21 |
| P.11 | 0 | 0 | 0 | 0 | 2 | 0 | 0 | 0 | 0 | 0 | 0 | 8 | 0 | 0 | 0 | 0 | 0 |
| P.12 | 2 | 0 | 6 | 0 | 0 | 5 | 1 | 4 | 0 | 0 | 0 | 12 | 0 | 0 | 0 | 0 | 0 |
| P.13 | 2 | 1 | 3 | 0 | 0 | 2 | 6 | 20 | 0 | 0 | 7 | 5 | 0 | 0 | 0 | 0 | 0 |
| P.15 | 19 | 27 | 35 | 34 | 34 | 67 | 187 | 144 | 8 | 24 | 47 | 118 | 2 | 3 | 11 | 10 | 0 |
| L.2 | L.3 | L.4 | L.5 | R.1 | R.2 | R.3 | R.4 | R.5 | R.6 | R.7 | R.8 | P.1 | P.2 | P.3 | P.4 | P.5 | |
| S.1 | 15 | 0 | 278 | 3 | 49 | 53 | 1 | 0 | 21 | 18 | 58 | 96 | 2 | 0 | 0 | 15 | 148 |
| S.2 | 10 | 0 | 257 | 3 | 31 | 23 | 2 | 1 | 58 | 48 | 41 | 68 | 8 | 1 | 1 | 3 | 134 |
| S.3 | 23 | 0 | 179 | 3 | 24 | 36 | 3 | 7 | 22 | 27 | 48 | 44 | 7 | 0 | 0 | 3 | 66 |
| S.4 | 10 | 0 | 78 | 0 | 17 | 8 | 1 | 0 | 7 | 12 | 14 | 30 | 6 | 0 | 0 | 0 | 11 |
| S.5 | 8 | 2 | 274 | 1 | 50 | 84 | 0 | 0 | 33 | 9 | 49 | 62 | 21 | 0 | 0 | 1 | 148 |
| S.6 | 43 | 0 | 431 | 1 | 77 | 119 | 0 | 4 | 53 | 50 | 62 | 121 | 11 | 0 | 0 | 1 | 216 |
| S.7 | 39 | 0 | 772 | 1 | 154 | 141 | 18 | 1 | 85 | 86 | 217 | 134 | 34 | 0 | 3 | 1 | 201 |
| S.8 | 72 | 0 | 829 | 2 | 210 | 203 | 7 | 2 | 64 | 112 | 120 | 190 | 247 | 0 | 1 | 2 | 77 |
| S.9 | 4 | 0 | 43 | 0 | 2 | 9 | 0 | 0 | 5 | 1 | 6 | 24 | 5 | 0 | 0 | 0 | 16 |
| S.10 | 10 | 0 | 102 | 0 | 38 | 21 | 2 | 0 | 5 | 4 | 15 | 29 | 11 | 0 | 0 | 0 | 12 |
| S.11 | 16 | 0 | 235 | 0 | 62 | 44 | 5 | 4 | 19 | 18 | 54 | 50 | 43 | 3 | 0 | 0 | 53 |
| S.12 | 37 | 8 | 879 | 0 | 238 | 134 | 7 | 6 | 60 | 78 | 159 | 253 | 415 | 2 | 1 | 0 | 54 |
| S.13 | 0 | 0 | 34 | 0 | 0 | 0 | 0 | 0 | 6 | 0 | 24 | 4 | 0 | 0 | 0 | 0 | 11 |
| S.14 | 0 | 0 | 20 | 0 | 0 | 1 | 0 | 0 | 5 | 0 | 3 | 11 | 0 | 0 | 0 | 0 | 5 |
| S.15 | 2 | 0 | 33 | 0 | 4 | 2 | 0 | 0 | 7 | 0 | 14 | 8 | 2 | 0 | 0 | 0 | 7 |
| S.16 | 4 | 0 | 67 | 0 | 17 | 8 | 0 | 0 | 3 | 4 | 18 | 22 | 32 | 0 | 0 | 0 | 5 |
| L.1 | 0 | 0 | 0 | 0 | 5 | 0 | 34 | 4 | 6 | 6 | 8 | 7 | 0 | 0 | 0 | 0 | 0 |
| L.2 | 293 | 0 | 0 | 0 | 117 | 32 | 12 | 21 | 4 | 14 | 56 | 37 | 0 | 6 | 6 | 0 | 0 |
| L.3 | 0 | 10 | 0 | 0 | 0 | 0 | 0 | 0 | 0 | 8 | 0 | 2 | 0 | 0 | 0 | 0 | 0 |
| L.4 | 0 | 0 | 4511 | 0 | 851 | 843 | 0 | 0 | 440 | 439 | 838 | 1100 | 844 | 0 | 0 | 12 | 1164 |
| L.5 | 0 | 0 | 0 | 14 | 0 | 11 | 0 | 0 | 3 | 0 | 0 | 0 | 0 | 0 | 0 | 14 | 0 |
| R.1 | 117 | 0 | 851 | 0 | 973 | 0 | 0 | 0 | 0 | 0 | 0 | 0 | 237 | 1 | 0 | 1 | 205 |
| R.2 | 32 | 0 | 843 | 11 | 0 | 886 | 0 | 0 | 0 | 0 | 0 | 0 | 86 | 0 | 1 | 14 | 246 |
| R.3 | 12 | 0 | 0 | 0 | 0 | 0 | 46 | 0 | 0 | 0 | 0 | 0 | 0 | 0 | 1 | 0 | 0 |
| R.4 | 21 | 0 | 0 | 0 | 0 | 0 | 0 | 25 | 0 | 0 | 0 | 0 | 0 | 4 | 0 | 0 | 0 |
| R.5 | 4 | 0 | 440 | 3 | 0 | 0 | 0 | 0 | 453 | 0 | 0 | 0 | 31 | 0 | 1 | 3 | 104 |
| R.6 | 14 | 8 | 439 | 0 | 0 | 0 | 0 | 0 | 0 | 467 | 0 | 0 | 58 | 1 | 0 | 1 | 149 |
| R.7 | 56 | 0 | 838 | 0 | 0 | 0 | 0 | 0 | 0 | 0 | 902 | 0 | 159 | 0 | 2 | 3 | 202 |
| R.8 | 37 | 2 | 1100 | 0 | 0 | 0 | 0 | 0 | 0 | 0 | 0 | 1146 | 273 | 0 | 1 | 4 | 258 |
| P.1 | 0 | 0 | 844 | 0 | 237 | 86 | 0 | 0 | 31 | 58 | 159 | 273 | 844 | 0 | 0 | 0 | 0 |
| P.2 | 6 | 0 | 0 | 0 | 1 | 0 | 0 | 4 | 0 | 1 | 0 | 0 | 0 | 6 | 0 | 0 | 0 |
| P.3 | 6 | 0 | 0 | 0 | 0 | 1 | 1 | 0 | 1 | 0 | 2 | 1 | 0 | 0 | 6 | 0 | 0 |
| P.4 | 0 | 0 | 12 | 14 | 1 | 14 | 0 | 0 | 3 | 1 | 3 | 4 | 0 | 0 | 0 | 26 | 0 |
| P.5 | 0 | 0 | 1164 | 0 | 205 | 246 | 0 | 0 | 104 | 149 | 202 | 258 | 0 | 0 | 0 | 0 | 1164 |
| P.6 | 0 | 0 | 1721 | 0 | 288 | 322 | 0 | 0 | 255 | 149 | 340 | 367 | 0 | 0 | 0 | 0 | 0 |
| P.7 | 128 | 0 | 0 | 0 | 39 | 11 | 10 | 7 | 3 | 13 | 26 | 19 | 0 | 0 | 0 | 0 | 0 |
| P.8 | 0 | 0 | 0 | 0 | 5 | 0 | 26 | 1 | 3 | 3 | 5 | 6 | 0 | 0 | 0 | 0 | 0 |
| P.9 | 77 | 0 | 0 | 0 | 38 | 9 | 1 | 7 | 0 | 0 | 12 | 10 | 0 | 0 | 0 | 0 | 0 |
| P.10 | 0 | 0 | 0 | 0 | 0 | 0 | 8 | 3 | 3 | 3 | 3 | 1 | 0 | 0 | 0 | 0 | 0 |
| P.11 | 0 | 10 | 0 | 0 | 0 | 0 | 0 | 0 | 0 | 8 | 0 | 2 | 0 | 0 | 0 | 0 | 0 |
| P.12 | 30 | 0 | 0 | 0 | 14 | 11 | 0 | 1 | 0 | 0 | 4 | 0 | 0 | 0 | 0 | 0 | 0 |
| P.13 | 46 | 0 | 0 | 0 | 25 | 0 | 0 | 2 | 0 | 0 | 12 | 7 | 0 | 0 | 0 | 0 | 0 |
| P.15 | 0 | 0 | 770 | 0 | 120 | 186 | 0 | 0 | 50 | 82 | 134 | 198 | 0 | 0 | 0 | 0 | 0 |
| P.6 | P.7 | P.8 | P.9 | P.10 | P.11 | P.12 | P.13 | P.15 | |
| S.1 | 97 | 5 | 0 | 6 | 0 | 0 | 2 | 2 | 19 |
| S.2 | 88 | 7 | 2 | 0 | 0 | 0 | 0 | 1 | 27 |
| S.3 | 71 | 5 | 3 | 9 | 3 | 0 | 6 | 3 | 35 |
| S.4 | 27 | 10 | 0 | 0 | 1 | 0 | 0 | 0 | 34 |
| S.5 | 71 | 5 | 2 | 3 | 0 | 2 | 0 | 0 | 34 |
| S.6 | 137 | 23 | 7 | 13 | 4 | 0 | 5 | 2 | 67 |
| S.7 | 350 | 24 | 20 | 5 | 4 | 0 | 1 | 6 | 187 |
| S.8 | 361 | 31 | 2 | 16 | 3 | 0 | 4 | 20 | 144 |
| S.9 | 14 | 0 | 0 | 4 | 0 | 0 | 0 | 0 | 8 |
| S.10 | 55 | 4 | 1 | 6 | 1 | 0 | 0 | 0 | 24 |
| S.11 | 92 | 6 | 4 | 0 | 1 | 0 | 0 | 7 | 47 |
| S.12 | 292 | 8 | 8 | 9 | 3 | 8 | 12 | 5 | 118 |
| S.13 | 21 | 0 | 0 | 0 | 0 | 0 | 0 | 0 | 2 |
| S.14 | 12 | 0 | 0 | 0 | 0 | 0 | 0 | 0 | 3 |
| S.15 | 13 | 0 | 0 | 2 | 0 | 0 | 0 | 0 | 11 |
| S.16 | 20 | 0 | 0 | 4 | 1 | 0 | 0 | 0 | 10 |
| L.1 | 0 | 0 | 49 | 0 | 21 | 0 | 0 | 0 | 0 |
| L.2 | 0 | 128 | 0 | 77 | 0 | 0 | 30 | 46 | 0 |
| L.3 | 0 | 0 | 0 | 0 | 0 | 10 | 0 | 0 | 0 |
| L.4 | 1721 | 0 | 0 | 0 | 0 | 0 | 0 | 0 | 770 |
| L.5 | 0 | 0 | 0 | 0 | 0 | 0 | 0 | 0 | 0 |
| R.1 | 288 | 39 | 5 | 38 | 0 | 0 | 14 | 25 | 120 |
| R.2 | 322 | 11 | 0 | 9 | 0 | 0 | 11 | 0 | 186 |
| R.3 | 0 | 10 | 26 | 1 | 8 | 0 | 0 | 0 | 0 |
| R.4 | 0 | 7 | 1 | 7 | 3 | 0 | 1 | 2 | 0 |
| R.5 | 255 | 3 | 3 | 0 | 3 | 0 | 0 | 0 | 50 |
| R.6 | 149 | 13 | 3 | 0 | 3 | 8 | 0 | 0 | 82 |
| R.7 | 340 | 26 | 5 | 12 | 3 | 0 | 4 | 12 | 134 |
| R.8 | 367 | 19 | 6 | 10 | 1 | 2 | 0 | 7 | 198 |
| P.1 | 0 | 0 | 0 | 0 | 0 | 0 | 0 | 0 | 0 |
| P.2 | 0 | 0 | 0 | 0 | 0 | 0 | 0 | 0 | 0 |
| P.3 | 0 | 0 | 0 | 0 | 0 | 0 | 0 | 0 | 0 |
| P.4 | 0 | 0 | 0 | 0 | 0 | 0 | 0 | 0 | 0 |
| P.5 | 0 | 0 | 0 | 0 | 0 | 0 | 0 | 0 | 0 |
| P.6 | 1721 | 0 | 0 | 0 | 0 | 0 | 0 | 0 | 0 |
| P.7 | 0 | 128 | 0 | 0 | 0 | 0 | 0 | 0 | 0 |
| P.8 | 0 | 0 | 49 | 0 | 0 | 0 | 0 | 0 | 0 |
| P.9 | 0 | 0 | 0 | 77 | 0 | 0 | 0 | 0 | 0 |
| P.10 | 0 | 0 | 0 | 0 | 21 | 0 | 0 | 0 | 0 |
| P.11 | 0 | 0 | 0 | 0 | 0 | 10 | 0 | 0 | 0 |
| P.12 | 0 | 0 | 0 | 0 | 0 | 0 | 30 | 0 | 0 |
| P.13 | 0 | 0 | 0 | 0 | 0 | 0 | 0 | 46 | 0 |
| P.15 | 0 | 0 | 0 | 0 | 0 | 0 | 0 | 0 | 770 |
References
- Matej, M. Top 10 Global Pharmaceutical Companies by Revenue 2021. 2022. Available online: https://www.statista.com/statistics/407969/projected-sales-of-top-pharmaceutical-companies-worldwide/ (accessed on 9 June 2022).
- Faraj, S.; Renno, W.; Bhardwaj, A. Unto the breach: What the COVID-19 pandemic exposes about digitalization. Inf. Organ. 2021, 31, 100337. [Google Scholar] [CrossRef]
- Pothal, L.K.; Tripathy, S.; Kumar, K.; Dash, A. Study of customer relationship management in automobile industry. In Advances in Mechanical Processing and Design; Springer: Singapore, 2021; pp. 649–660. [Google Scholar]
- Wellington, A. To ban or not to ban: Direct-to-consumer advertising and human rights analysis. AMJ 2012, 3, 749–766. [Google Scholar] [CrossRef]
- Gil-Gomez, H.; Guerola-Navarro, V.; Oltra-Badenes, R.; Lozano-Quilis, J.A. Customer relationship management: Digital transformation and sustainable business model innovation. Econ. Res.-Ekon. Istraž. 2020, 33, 2733–2750. [Google Scholar] [CrossRef]
- Nawaz, R.; Bakhsh, K.; Ullah, S.; Rehman, S.; Azeem, M.; Hayat, A. Drivers of ICT adoption in small and very small businesses in technologically least developed district of Southern Punjab. Int. Trans. J. Eng. Manag. Appl. Sci. Technol. 2021, 12, 1–10. [Google Scholar]
- Mano, R. The institutionalization of ICT and civic participation: Evidence from eight European nations. Technol. Soc. 2021, 64, 101518. [Google Scholar] [CrossRef]
- Cohen, J.; Gangi, W.; Lineen, J.; Manard, A.; Hughes, E.X. Strategic Alternatives in: The Pharmaceutical Industry; Kellogg School of Management, Northwestern University: Evanston, IL, USA, 2004. [Google Scholar]
- Faisal, A.; Ahmad, M.S.; Thurasamy, R.; Ahmed, R. Doctors’ interactions with pharmaceutical sales representatives: Modelling doctors’ prescription behaviour. Community Ment. Health J. 2020, 56, 456–463. [Google Scholar] [CrossRef]
- Hailu, A.D.; Workneh, B.D.; Kahissay, M.H. Influence of pharmaceutical marketing mix strategies on physicians’ prescribing behaviors in public and private hospitals, Dessie, Ethiopia, a Mixed Study Design. BMC Public Health 2021, 21, 65. [Google Scholar] [CrossRef]
- Paguntalan, L.C. The effectiveness of promotional mix of pharmaceutical companies in the Philippines: The sales force perspective. Asian J. Res. Bus. Manag. 2020, 2, 1–10. [Google Scholar]
- Turkrating. Pharmaceutical Industry May 2021. Available online: https://turkrating.com/ilac-sektoru-mayis-2021-41375.html (accessed on 10 November 2021).
- IQVIAa. The Impact of COVID-19 on Pharmaceutical Markets. 2021. Available online: https://www.iqvia.com/-/media/iqvia/pdfs/library/publications/the-impact-of-covid-19-on-pharmaceutical-markets.pdf?_=1636552194292 (accessed on 10 November 2021).
- Nair, M.; Pradhan, R.P.; Arvin, M.B. Endogenous dynamics between R&D, ICT and economic growth: Empirical evidence from the OECD countries. Technol. Soc. 2020, 62, 101315. [Google Scholar]
- Hashem, G. Organizational enablers of business process reengineering implementation: An empirical study on the service sector. Int. J. Prod. Perform. Manag. 2020, 69, 321–343. [Google Scholar] [CrossRef]
- Baiyere, A.; Salmela, H.; Tapanainen, T. Digital transformation and the new logics of business process management. Eur. J. Inf. Syst. 2000, 29, 238–259. [Google Scholar] [CrossRef]
- Wang, H.; Schrock, W.A.; Kumar, A.; Hughes, D.E. Effectual selling in service ecosystems. J. Pers. Sell. Sales Manag. 2020, 40, 251–266. [Google Scholar] [CrossRef]
- Hartmann, N.; Lussier, B. Managing the sales force through the unexpected exogenous COVID-19 crisis. Ind. Mark. Manag. 2020, 88, 101–111. [Google Scholar] [CrossRef]
- Craven, M.; Liu, L.; Mysore, M.; Wilson, M. COVID-19: Implications for Business; McKinsey & Company: Hong Kong, China, 2020. [Google Scholar]
- Pedersen, C.L.; Ritter, T.; Di Benedetto, C.A. Managing through a crisis: Managerial implications for business-to-business firms. Ind. Mark. Manag. 2020, 88, 314. [Google Scholar] [CrossRef]
- Sharma, P.; Leung, T.Y.; Kingshott, R.P.; Davcik, N.S.; Cardinali, S. Managing uncertainty during a global pandemic: An international business perspective. J. Bus. Res. 2020, 116, 188–192. [Google Scholar] [CrossRef]
- Epler, R.T.; Leach, M.P. An examination of salesperson bricolage during a critical sales disruption: Selling during the Covid-19 pandemic. Ind. Mark. Manag. 2021, 5, 114–127. [Google Scholar] [CrossRef]
- Official Gazette. Regulation About Promotional Activities of Medicinal Products. 2015. Available online: https://www.resmigazete.gov.tr/eskiler/2015/07/20150703-2.htm (accessed on 3 October 2021).
- Barnes, B.R.; Carroll, A. A relationship marketing pilot study of British and French medium-sized medical firms. J. Med. Mark. 2000, 1, 161–175. [Google Scholar] [CrossRef]
- Sohn, Y.S.; Seung, K.Y.; Seo, S.Y.; Kim, S.E. The mediating role of commitment in healthcare B2B marketing. Serv. Ind. J. 2013, 33, 1381–1401. [Google Scholar] [CrossRef]
- Ji, Y.; Ma, Z.; Peppelenbosch, M.P.; Pan, Q. Potential association between COVID-19 mortality and health-care resource availability. Lancet Glob. Health 2020, 8, e480. [Google Scholar] [CrossRef]
- Xu, Z.; Shi, L.; Wang, Y.; Zhang, J.; Huang, L.; Zhang, C.; Liu, S.; Zhao, P.; Liu, H.; Zhu, L.; et al. Pathological findings of COVID-19 associated with acute respiratory distress syndrome. Lancet Respir. Med. 2020, 8, 420–422. [Google Scholar] [CrossRef]
- Eftekhar Ardebili, M.; Naserbakht, M.; Bernstein, C.; Alazmani-Noodeh, F.; Hakimi, H.; Ranjbar, H. Healthcare providers experience of working during the COVID-19 pandemic: A qualitative study. Am. J. Infect. Control 2021, 49, 547–554. [Google Scholar] [CrossRef]
- Doyumğaç, İ.; Tanhan, A.; Kiymaç, M. Understanding the Most Important Facilitators and Barriers for Online Education during COVID-19 through Online Photovoice Methodology. Int. J. High. Educ. 2021, 10, 166–190. [Google Scholar] [CrossRef]
- Punchibandara, M.M.T. The impact of promotional strategies of pharmaceutical companies on doctor’s recommendation of branded drugs: An empirical study on pharmaceutical industry in Sri Lanka. Kelaniya. J. Manag. 2018, 6, 55. [Google Scholar] [CrossRef]
- Onesti, C.E.; Tagliamento, M.; Curigliano, G.; Harbeck, N.; Bartsch, R.; Wildiers, H.; Tjan-Heijnen, V.; Martin, M.; Rottey, S.; Generali, D.; et al. Expected Medium- and Long-Term Impact of the COVID-19 Outbreak in Oncology. JCO Glob. Oncol. 2021, 7, 162–172. [Google Scholar] [CrossRef]
- CDC. Symptoms of COVID-19. 2021. Available online: https://www.cdc.gov/coronavirus/2019-ncov/symptoms-testing/symptoms.html (accessed on 22 September 2021).
- Mlika, A.; Mong, J.; Peters, N.; Salazar, P. Ready for Launch: Reshaping Pharma’s Strategy in the Next Normal. 2020. Available online: https://www.mckinsey.com/industries/life-sciences/our-insights/ready-for-launch-reshaping-pharmas-strategy-in-the-next-normal (accessed on 8 September 2021).
- IQVIAb. Track Sales Progress from Every Angle. 2018. Available online: https://www.iqvia.com/locations/belgium/solutions/business-intelligence-and-data-science/pharmareport (accessed on 14 August 2021).
- Makowska, M. Polish physicians’ cooperation with the pharmaceutical industry and its potential impact on public health. PLoS ONE 2017, 12, e0184862. [Google Scholar] [CrossRef]
- Lieb, K.; Scheurich, A. Contact between doctors and the pharmaceutical industry, their perceptions, and the effects on prescribing habits. PLoS ONE 2014, 9, 110130. [Google Scholar] [CrossRef]
- Joslin, J.; Wojcik, S.M.; Fisher, A.; Grant, W.D. Do free or low-cost antibiotic promotions alter prescription filling habits? Pharm. Pract. 2014, 12, 416. [Google Scholar] [CrossRef]
- Shakoor, H.; Feehan, J.; Mikkelsen, K.; Al Dhaheri, A.S.; Ali, H.I.; Platat, C.; Ismail, L.C.; Stojanovska, L.; Apostolopoulos, V. Be well: A potential role for vitamin B in COVID-19. Maturitas 2020, 144, 108–111. [Google Scholar] [CrossRef]
- Mikkelsen, K.; Apostolopoulos, V. Vitamin B.1, B2, B3, B5, and B6 and the immune system. Nutr. Immun. 2019, 115–125. [Google Scholar]
- Johnson, R.A.; Wichern, D.W. Applied Multivariate Statistical Analysis; Prentice Hall: Englewood Cliffs, NJ, USA, 1992. [Google Scholar]
- Hwang, H.; Tomiuk, M.; Takane, Y. Correspondence analysis, multiple correspondence analysis and recent developments. In The Handbook of Quantitative Methods in Psychology; Millsap, R., Maydeu-Olivares, A., Eds.; Sage Publications: New York, NY, USA, 2009. [Google Scholar]
- Dungey, M.; Tchatoka, F.D.; Yanotti, M.B. Using multiple correspondence analysis for finance: A tool for assessing financial inclusion. Int. Rev. Financ. Anal. 2018, 59, 212–222. [Google Scholar] [CrossRef]
- Pasaribu, U.S.; Lestari, K.E.; Indratno, S.W.; Garminia, H.; Sari, R.R.K.N. Some Properties of the Scaled Burt Matrix on Multiple Correspondence Analysis. J. Hum. Univ. Nat. Sci. 2021, 48, 5. [Google Scholar]
- Sergio, C.S.; Gomez, G.C. Alternative Methods to Multiple Correspondence Analysis in Reconstructing The Relevant Information in a Burt’s Table. Pesqui. Oper. 2016, 36, 23–44. [Google Scholar]
- Greenacre, M.J. Theory and Application of Correspondence Analysis; Academic Press: London, UK, 1984. [Google Scholar]
- TÜBA. COVID-19 Küresel Salgın Değerlendirme Raporu (Global Outbreak Assessment Report) Türkiye Bilimler Akademisi Yayınları, TÜBA Raporları (34). 2020. Available online: https://www.tuba.gov.tr/files/images/2020/kovidraporu/T%C3%9CBA%20Covid19%20Raporu%206.%20G%C3%BCncelleme.pdf (accessed on 21 June 2022).
- Tanhan, A.; Strack, R.W. Online photovoice to explore and advocate for Muslim biopsychosocial spiritual wellbeing and issues: Ecological systems theory and ally development. Curr. Psychol. 2020, 39, 2010–2025. [Google Scholar] [CrossRef]
Disclaimer/Publisher’s Note: The statements, opinions and data contained in all publications are solely those of the individual author(s) and contributor(s) and not of MDPI and/or the editor(s). MDPI and/or the editor(s) disclaim responsibility for any injury to people or property resulting from any ideas, methods, instructions or products referred to in the content. |
© 2023 by the authors. Licensee MDPI, Basel, Switzerland. This article is an open access article distributed under the terms and conditions of the Creative Commons Attribution (CC BY) license (https://creativecommons.org/licenses/by/4.0/).