Article

Comprehensive Laboratory Evaluation of Crack Resistance for an Asphalt Rubber Stress-Absorbing Membrane Interlayer (AR-SAMI)

1
School of Traffic & Transportation Engineering, Changsha University of Science & Technology, Changsha 410114, China
2
School of Civil Engineering, Hubei Engineering University, Xiaogan 432000, China
3
Beijing Super-Creative Technology Co., Ltd., Beijing 100094, China
4
Gezhouba Group Transportation Investment Co., Ltd., Wuhan 430030, China
*
Author to whom correspondence should be addressed.
Sustainability 2023, 15(11), 8982; https://doi.org/10.3390/su15118982
Submission received: 1 May 2023 / Revised: 23 May 2023 / Accepted: 29 May 2023 / Published: 2 June 2023
(This article belongs to the Special Issue Advances in New Green Road Materials and Applied Technologies)

Abstract

:
Reflective cracking is a common distress of semi-rigid base asphalt pavements and overlay pavement projects. An asphalt rubber stress-absorbing membrane interlayer (AR-SAMI) prepared by waste tires is an effective engineering solution for treating reflective cracking. This method can also reduce black pollution. However, there is no unified test method and index for crack resistance evaluation. In this work, AR-SAMIs with different air voids and gradations were investigated. A small beam bending test (BBT) at −10 °C and 15 °C, crack expansion SCB (CE-SCB) test, low-temperature SCB (LT-SCB) test, and Overlay Test (OT) were performed to evaluate the crack resistance of AR-SAMI comprehensively. Statistical analysis was also performed. Results showed that the crack resistance of AR-SAMI improved as the air voids decreased. The crack resistance of 10-A gradation with more fine aggregate was excellent. However, the AR-SAMI with more coarse aggregate had better crack extension resistance under the condition of pre-existing cracks. There are differences in the evaluation results of different test methods due to the various evaluation focus. The −10 °C BBT, CE-SCB, and OT were recommended to evaluate the crack resistance comprehensively. Research results can guide the evaluation method or index selection of crack resistance and the optimization of AR-SAMI mixture design under different working conditions.

1. Introduction

Reflective cracking is a common type of distress in asphalt pavement caused by existing cracks in the underlying layer [1,2]. Semi-rigid base asphalt pavements, composite road (or bridge) pavements, and pavement maintenance of overlay projects have potential risks of reflective cracking. Reflective cracking can cause fissuration, loosening, and other distress under the coupling effect of multiple factors, such as water, loading, and temperature. It can significantly reduce pavement performance and directly affect the service life of the pavement [3,4]. Therefore, how to effectively mitigate the occurrence of reflective cracking and improve the quality of pavement engineering has become one of the urgent technical problems for pavement construction and maintenance [5,6].
The commonly used techniques for treating reflective cracking include the following three types: laying geosynthetic materials, adding an unbound aggregate layer between the surface layer and the base layer, and adding a stress-absorbing membrane interlayer (SAMI) [7,8,9,10,11]. Among them, the SAMI has been widely used as an effective method to slow the expansion of reflective cracking [12,13,14]. Due to its special functional requirements, a SAMI generally uses polymer modified asphalt, crumb rubber modified asphalt (CRMA), and high-viscosity asphalt [15]. CRMA had excellent properties (including high and low temperature performance and insensitivity to temperature changes) and economic performance. More importantly, the crumb rubber prepared from waste tires has excellent environmentally friendly properties [16,17]. It meets the requirements of sustainable social development. Thus, the asphalt rubber stress-absorbing membrane interlayer (AR-SAMI) has been widely used [3].
Air void and gradation are key elements of mixture design and significantly impact the performance of CR mixture or AR-SAMI. For example, Asgharzadeh et al. [18] showed that the fatigue life could be improved by 9.4 to 18.2 times by reducing the air void from 4.0% to 2.0%. Aliha et al. [19] demonstrated that by increasing the air void from 3% to 7%, the fracture toughness of AR decreased significantly. Also, the gradation significantly affected the performance of CR mixture or AR-SAMI [20]. Meanwhile, existing research has further optimized the performance of AR-SAMI and improved its application effect. For example, the construction temperature of the crumb rubber asphalt mixture was high due to its high viscosity. Pan et al. [21] used warm mix technology to reduce the compaction temperature by 30 °C. It still had good low-temperature performance, which could be suitable for pavement cracking disposal in cold areas. Zeng et al. [12] used fibers for AR-SAMI modification, which improved its crack resistance and fatigue life on the semi-rigid base. Wang et al. [22] used amorphous poly alpha-olefin (APAO) to modify AR-SAMI. The Overlay Test (OT) results showed that the adhesion performance and crack resistance of the mixture were improved.
Unlike conventional asphalt mixtures, SAMI should have good crack resistance in addition to the traditional pavement performance requirements such as high temperature, low temperature, and water stability. Crack resistance includes the ability to resist crack formation and crack expansion [3]. Numerical simulation techniques have been used to investigate it. Among them, finite element (FE) and discrete element method (DEM) were most commonly used. For example, Thives et al. [23] used Ansys calculations to show that pavement fatigue life could be improved up to eight times using AR-SAMI compared to a regular asphalt mixture under Brazilian climatic conditions. Zeng et al. [12] used FE to verify that AR-SAMI with fibers could significantly reduce the stress concentration in cracks. Pei et al. [24] used DEM to analyze the destructive properties of asphalt pavement overlay on cement pavement, which guided the application of the paving technology under different working conditions. However, due to the complexity of the effects of cracking, it was not easy to accurately construct an analytical model that matched the actual material composition and application conditions. As a result, the numerical simulation had a significant deficiency in material selection and mixture composition optimization design. Therefore, the experimental evaluation methods still had the most direct guidance value for the mixture design of SAMI.
However, there was no unified standard for crack resistance test evaluation. Therefore, scholars have proposed a variety of test evaluation methods. For example, the small beam bending test (BBT) was utilized in China [25]. The semicircular bending (SCB) tests with pre-cut cracks have been set as the standard test by AASHTO, including the crack extension SCB (CE-SCB) test [26] and low-temperature SCB (LT-SCB) test [27]. There are also Overlay Tests (OT) in Texas [22,28] and wheel fatigue tests [29]. Depending on the generation mechanism, the causes of cracks vary significantly under different working conditions. Four major modes of asphalt pavement cracking exist, including thermal, reflection, bottom-up fatigue, and top-down [30]. Due to the different testing principles, the crack resistance performance reflected by each index varies greatly. For example, the low-temperature flexural-tensile strain in BBT is the control index of the Chinese specification, which focuses on characterizing the resistance to crack formation [31]. The SCB tests with pre-cut cracks focus on characterizing the resistance to crack expansion in the presence of cracks [9,32]. The OT test is similar to the fatigue test and characterizes the crack resistance degradation of the specimen under fixed deformation [9,33].
To sum up, existing studies have investigated the effect of AR-SAMI on traditional road performance but less on crack resistance. Meanwhile, numerical simulation techniques were generally used in existing studies to evaluate the crack resistance of SAMI. There is a lack of systematic standards for different working conditions when using test methods, as the standards are not unified across countries. Meanwhile, the existing studies generally used a single evaluation technique, which could not comprehensively characterize the comprehensive crack resistance performance of the SAMI. As a result, they could not guide the optimal design of the SAMI. Although AR-SAMI has been initially promoted in the treatment of reflective cracking, the evaluation of its comprehensive anti-cracking performance needs to be further strengthened. The evaluation method and index applicability research especially still need to be deepened.
In this work, three gradation types of AR-SAMI mixtures with two air voids (AV, 2.5% and 4.0%) were designed. The anti-cracking performances of AR-SAMI were evaluated through different temperatures (−10 °C, 15 °C) of BBT, CE-SCB test, LT-SCB test, and OT. Meanwhile, the test results were compared by statistical methods to select the appropriate comprehensive evaluation test methods and indices. This work can provide a reference for the crack resistance evaluation of similar SAMI and can guide the mixture design of AR-SAMI under different working conditions.

2. Materials and Methods

The research flowchart of this study can be depicted in Figure 1.

2.1. Crumb Rubber Modified Asphalt

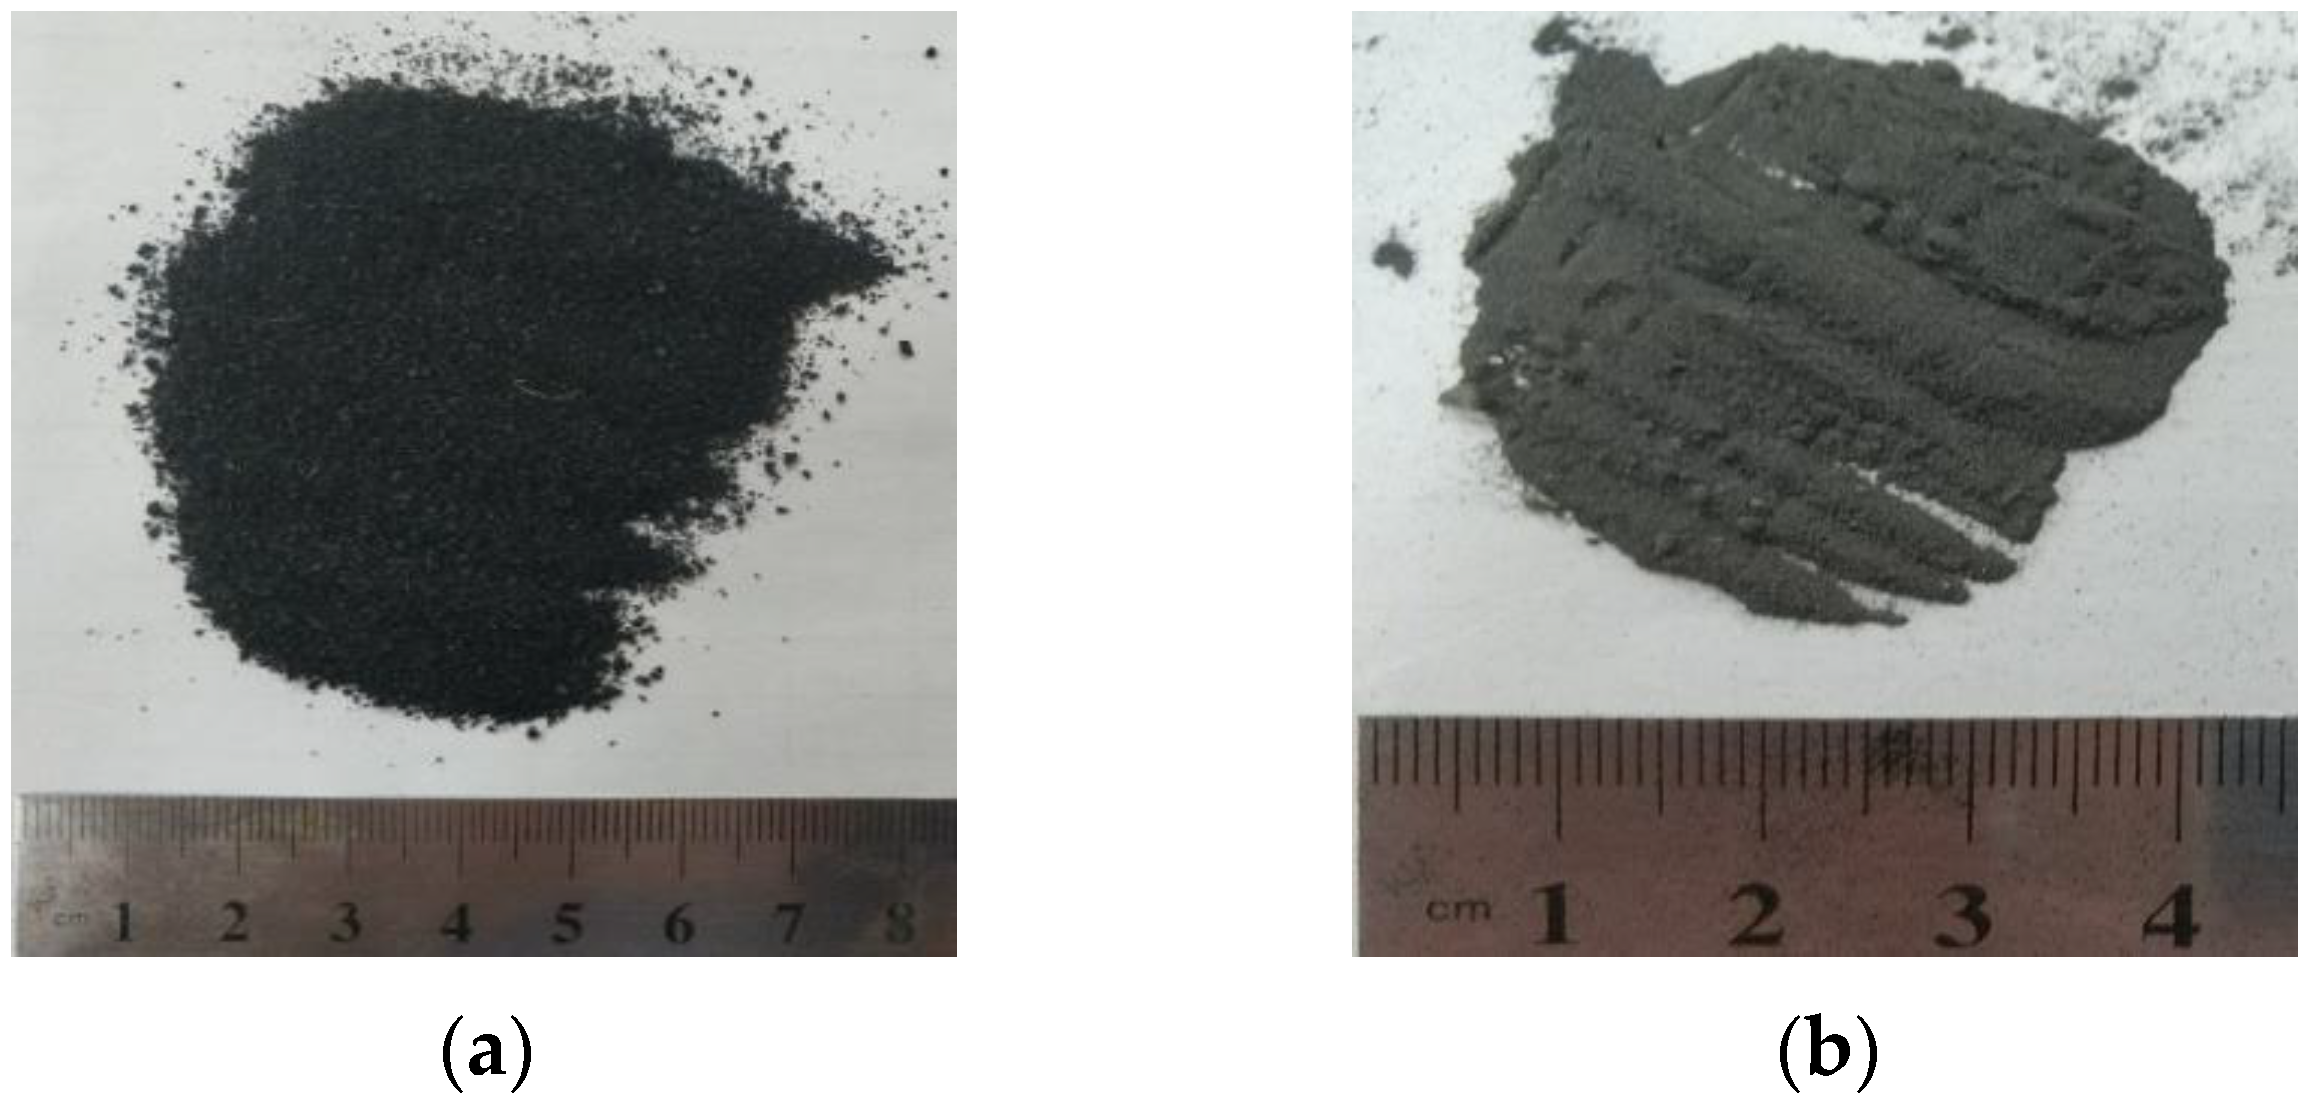
The crumb rubber modified asphalt was prepared with 70# A base asphalt, crumb rubber, and stabilizer (as shown in Figure 2). The dosage of crumb rubber was 20 wt%. The stabilizer is shown in Figure 2, produced by Guangxi Transportation Science and Technology Group Co., Ltd. (Nanning, China).
The technical indices of crumb rubber modified asphalt are shown in Table 1.

2.2. Aggregate

The limestone crushed stone was used as coarse and fine aggregate. The main technical indices of aggregate are shown in Table 2. The technical indices meet the performance requirements of highway aggregate [31].

2.3. Mixture Design

There was no national standard for the design of AR-SAMI. Considering AC-10 type was mostly used in the highway project, the AC-10 gradations in JTG F40-2004 [31], DB45/T 1098-2014 [35], and DG/TJ08-2109-2012 [36] were analyzed. Three gradations were determined based on summary results, as shown in Table 3.
Two air voids of 2.5% and 4.0% were selected. The mixture design was based on the combination of gradation and air voids. The Marshall design method was used to determine the optimal asphalt–aggregate ratio and volume parameters. The test results are shown in Table 4. Among them, voids in the mineral aggregate (VMA) and voids filled with asphalt binder (VFA) comply with the relevant requirements of JTG F40-2004 [31].

2.4. Gradation Evaluation by Bailey Method

The Bailey method was used to quantify and analyze the differences between the three gradations.
The following three indicators were used according to the theory of the Bailey method [37]: Coarse Aggregate Ratio (CA), Fine Aggregate Coarse Ratio (FAC), and Fine Aggregate Fine Ratio (FAf). The formulae for calculating each index are as follows:
C A = P D / 2 P P C S 100 P D / 2
F A C = P S C S P P C S
F A f = P T C S P S C S
where P is the passing rate of the corresponding sieve, D is Nominal Maximum Aggregate Size (NMAS), Primary Control Sieve (PCS) is 0.22 × D, the Secondary Control Sieve (SCS) is 0.22 × PCS, and the Tertiary Control Sieve (TCS) is 0.22 × SCS.

2.5. Crack Resistance Evaluation Test Methods

2.5.1. Small Beam Bending Test (BBT)

The BBTs at −10 °C and 15 °C were conducted with reference to JTG E20-2011 (T 0715-2011) [34]. The specimen size was 250 mm × 30 mm × 35 mm, and the span diameter was 200 mm. The three-point loading tests were carried out by using the universal material testing machine (Shanghai Hualong WDW-100C). The loading rate was 50 mm/min. Three parallel specimens were tested in each group. The mean and standard deviation were calculated separately.
The maximum flexural-tensile strain (Sft) and strain energy density (Dse) were calculated. The maximum flexural-tensile strain indicates the maximum strain value of the small beam specimen during the test. The strain energy density means the energy consumed by the specimen during the whole process of loading damage. Among them, the strain energy density is the strain energy per unit volume, which can be calculated by using the envelope area of the σ (stress)-ε (strain) curve during the damage process [38]. The calculation formula is as follows:
D s e = 0 ε B σ d ε
where εB is the corresponding strain to the stress peak of the specimen (mm).

2.5.2. Crack Extension Semicircular Bending (CE-SCB) Test

The CE-SCB test was performed at room temperature (25 ± 0.5 °C) using pre-cut crack semicircular specimens in accordance with AASHTO TP 124-16 [26]. The specimen dimensions are shown in Figure 3. The notches were 15 ± 1 mm deep and 2.0 ± 1.0 mm wide. Each group of tests has four parallel specimens. The mean and standard deviation were calculated separately.
The fracture energy (Gf) and the flexibility index (FI) could be calculated from the load–displacement curve (as shown in Figure 4). Gf denotes the energy required to create a unit surface area of a crack, and FI is an index intended to characterize the damage resistance of asphalt mixtures. The larger the value of the two indicates the stronger the crack resistance of asphalt mixtures under normal temperature conditions. Among them, FI takes into account the slope of the force–displacement curve m at the later stage of crack expansion (Figure 4). It could indicate the resistance to crack expansion after the formation of cracks in the mixture.

2.5.3. Low-Temperature Semicircular Bending (LT-SCB) Test

LT-SCB test used semicircular pre-cut specimens to evaluate the ability of the mixture to resist damage under low-temperature conditions referring to the AASHTO TP 105-13 test method [27]. The specimen preparation of the LT-SCB test was roughly the same as the CE-SCB test. The difference was that the thickness of the cut specimen was adjusted to 24.7 ± 2 mm. The test temperature was −10 °C. Each group of tests had four parallel specimens. The mean and standard deviation were calculated separately.
The fracture energy Gf and fracture toughness KIC (also known as mode I critical stress intensity factor) of the asphalt mixture under low-temperature conditions were calculated with reference to the specification. The higher the index value, the better the resistance of the compound to crack expansion at low temperatures.

2.5.4. Overlay Test (OT)

The OT was performed with reference to the TEX-248-F [39]. The Marshall compaction method (T 0702-2011) [34] was used to form specimens (152.4 mm × 95.3 mm) The cylindrical specimen with a 38.1 ± 0.5 mm thickness was obtained by cutting off the top and bottom parts. Then, both ends of the specimen were cut, and the specimen sample with a width of 76.2 ± 0.5 mm was obtained. The specimen-cutting process and the test procedure are shown in Figure 5.
The test temperature was 25 ± 0.5 °C. A relaxation period of at least 10 min should be maintained before the test. The test would stop when the maximum load was reduced by 93%. When loading cycles reached 1200, it would also terminate the test. The initial load and final load were recorded. Then, the load loss rate (LLR) and crack resistance index (CRI) were calculated according to the specification. There were three parallel specimens in each group. The mean and standard deviation were calculated separately.
The OT is a tensile fatigue test. LLR indicates the reduction rate of the final load compared with the initial loading. The smaller the value, the better the resistance to damage. CRI is an inherent property of the specimen, which is obtained by fitting the power equation of the curve of the load and the number of loading cycles during the loading process. The higher the value, the better the crack resistance of the mixture.

3. Results and Discussion

3.1. Small Beam Bending Test

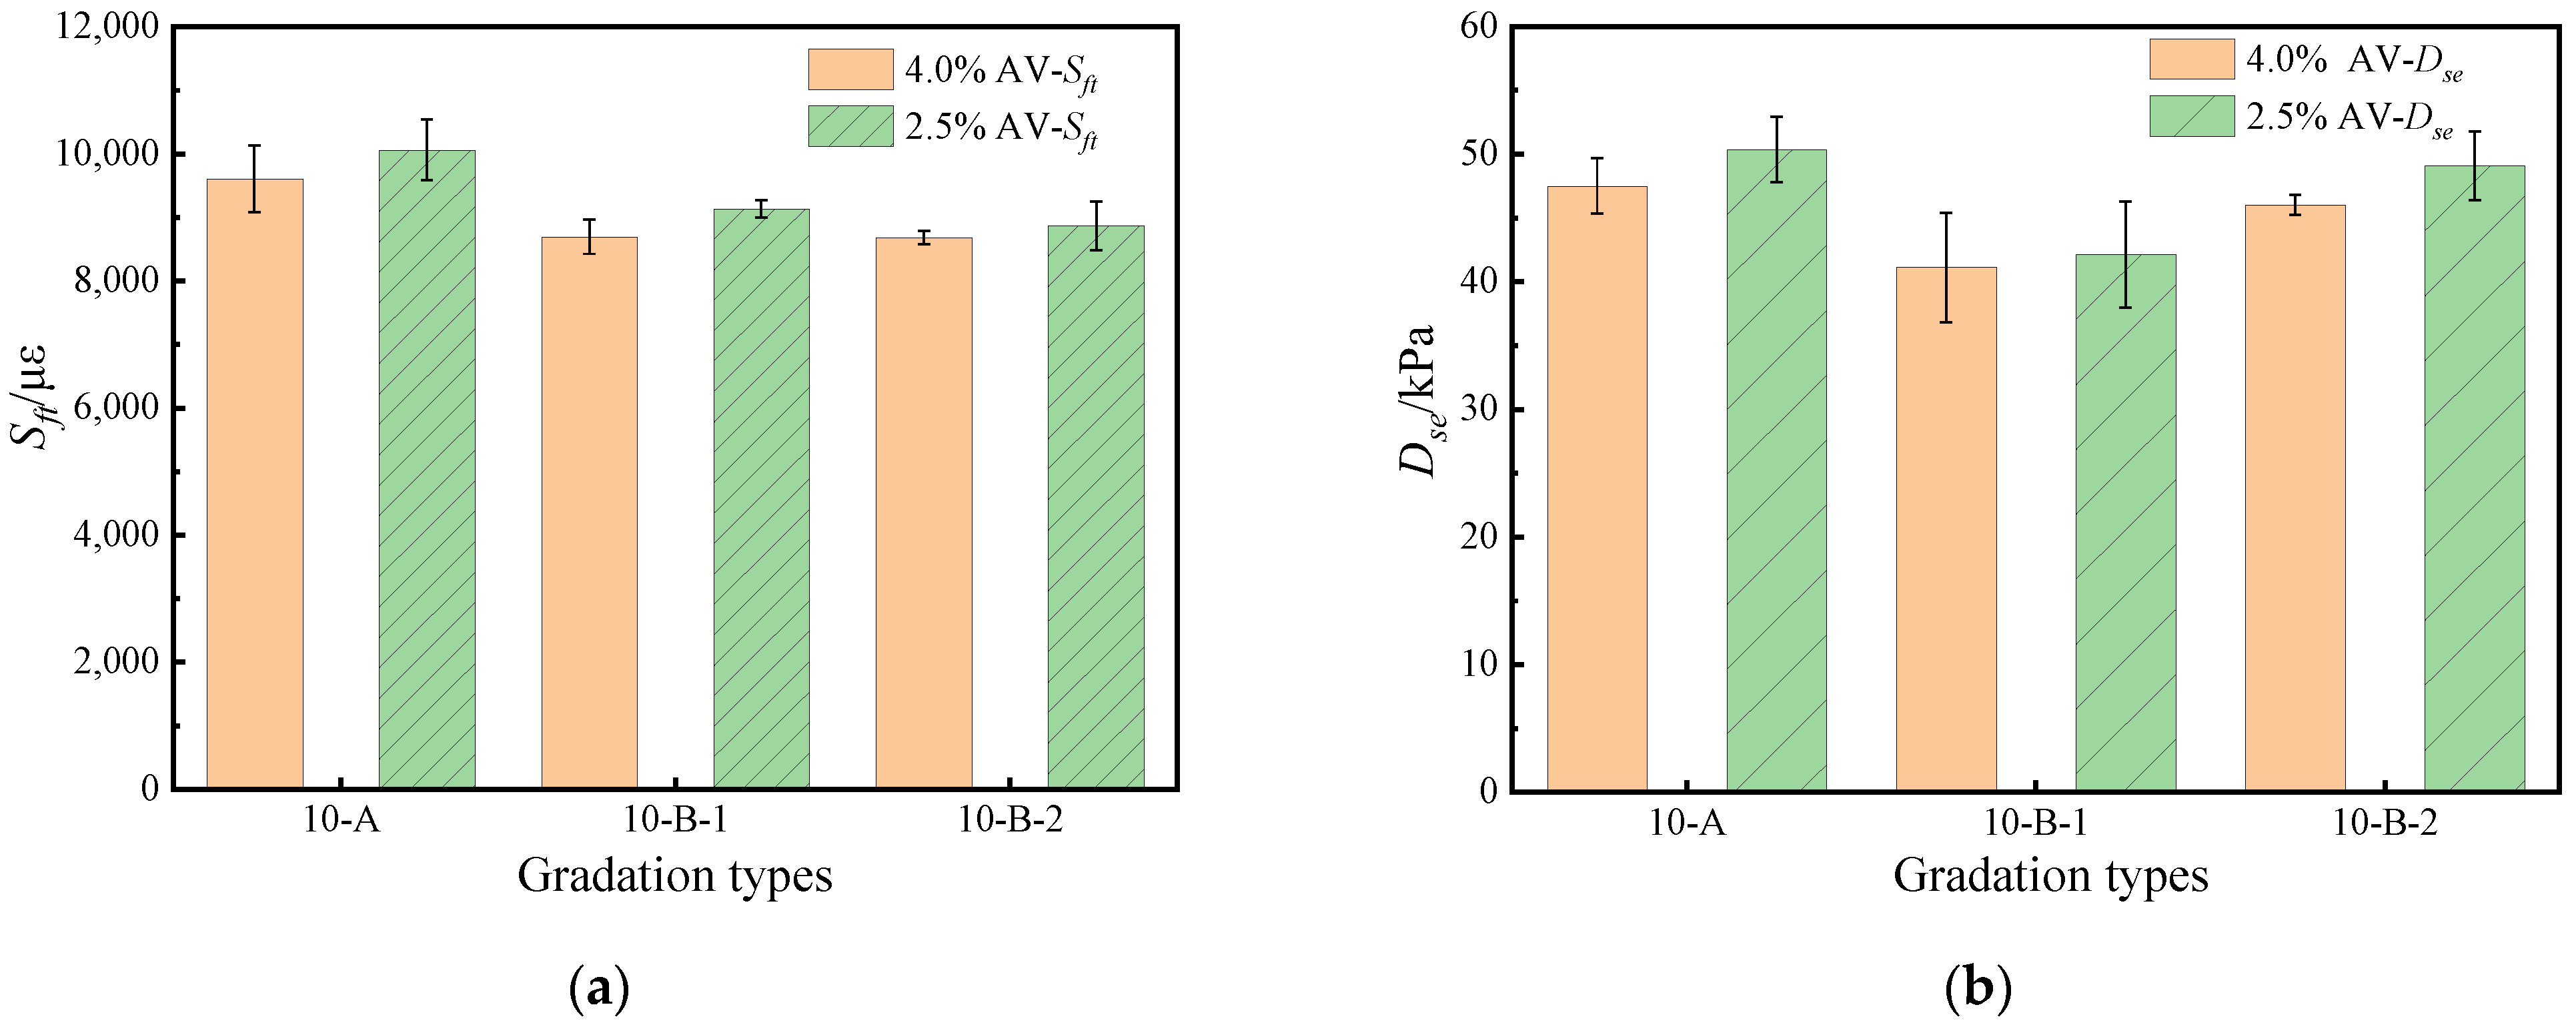
The BBTs were conducted at −10 °C and 15 °C, respectively. Test results are shown in Figure 6 and Figure 7.
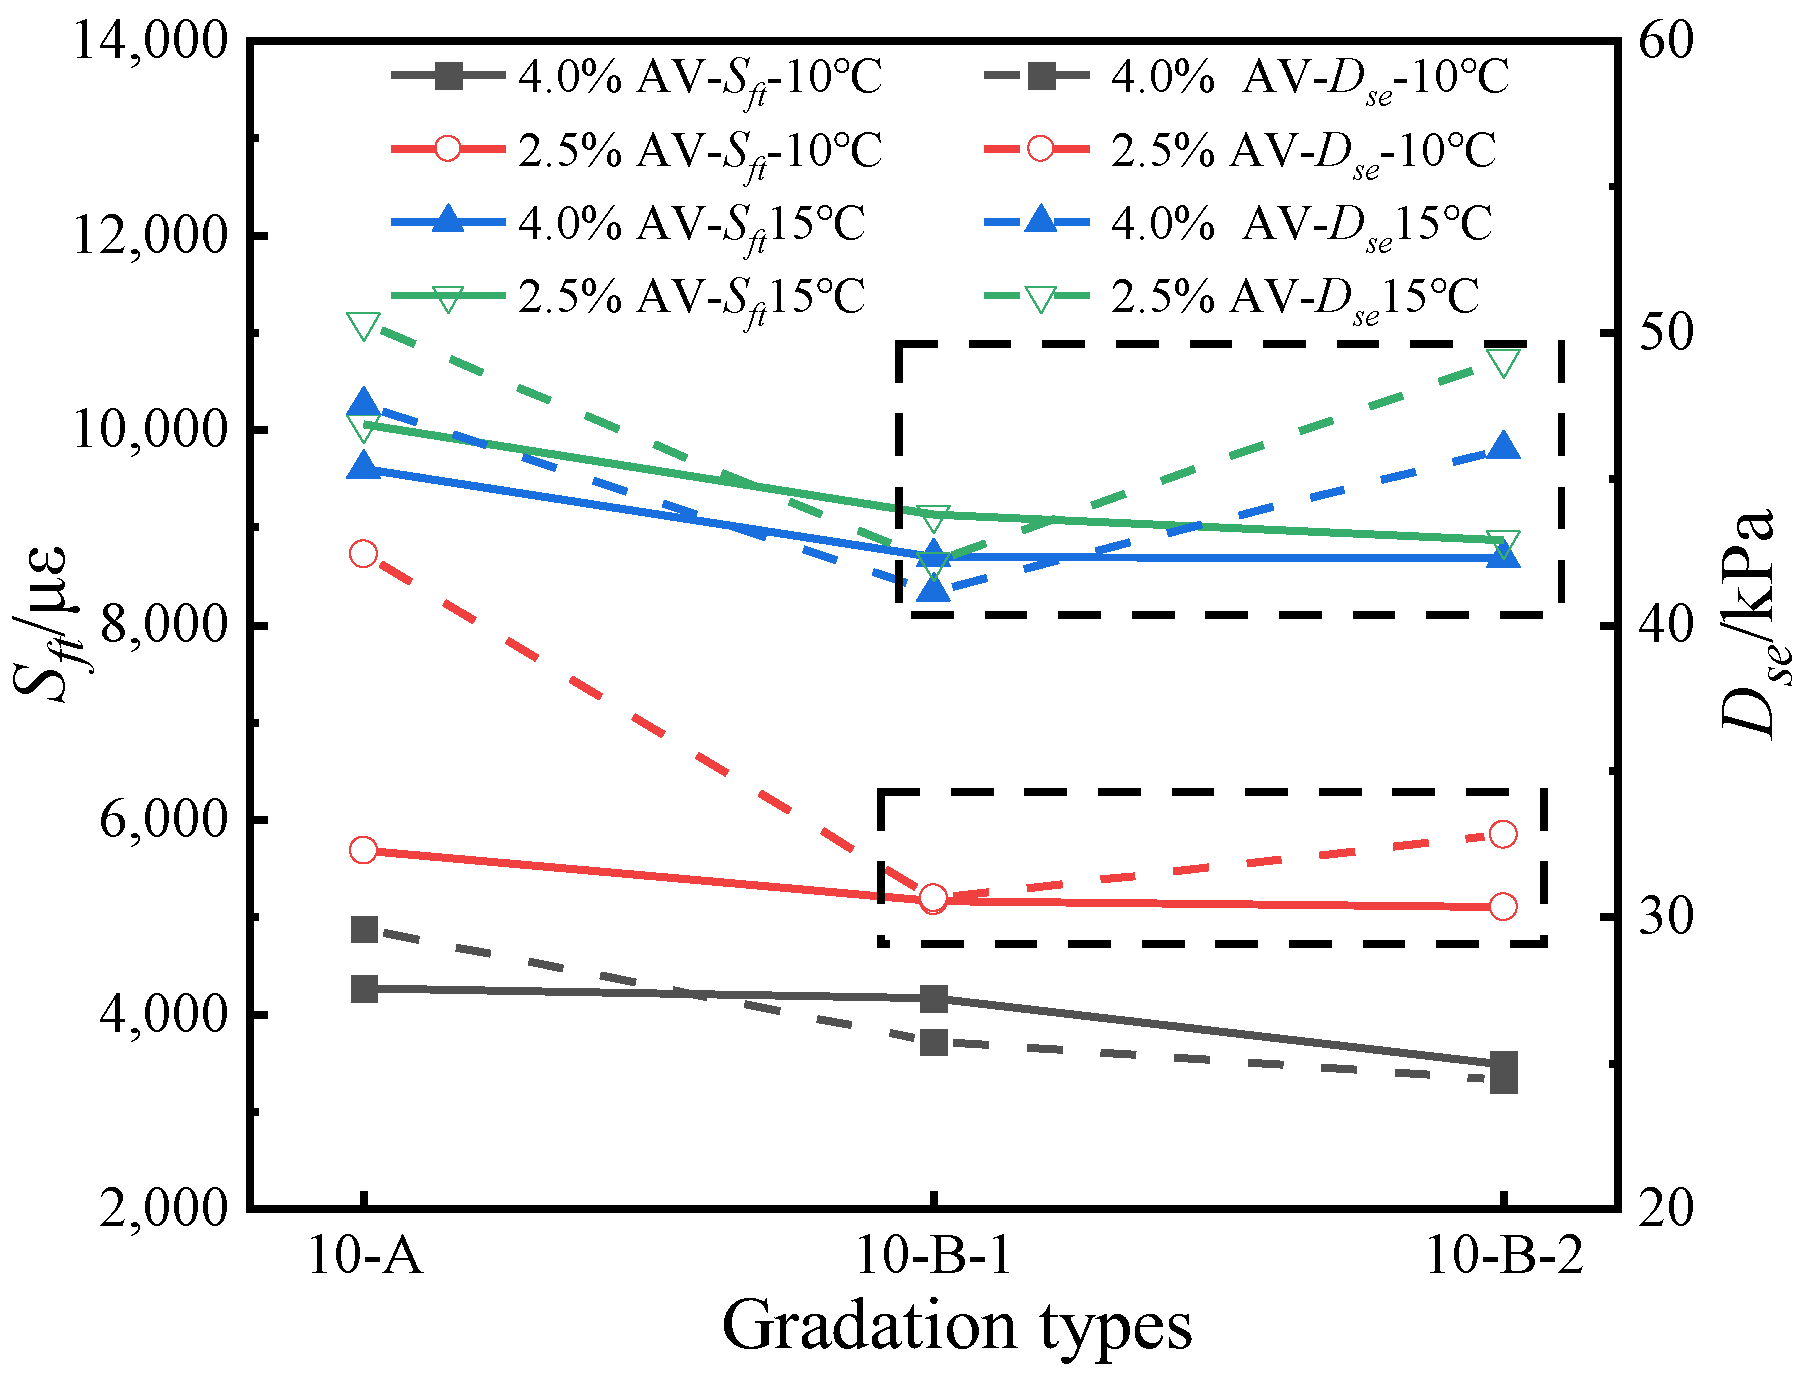
(a) There were differences in the variation patterns between Sft and Dse with air voids and gradation. Considering the different characterization meanings of the two indices, Sft and Dse, should be selected for comprehensive evaluation of the crack resistance. Although Sft and Dse at different temperatures showed the variation law of increasing with decreasing air voids, there are differences in the variation law of Sft and Dse with different gradations (Figure 8). For example, for the 10-B-1 and 10-B-2 gradations, Sft and Dse showed opposite patterns with the gradation change. According to the meaning, Sft is the maximum strain when the specimen is damaged, indicating the deformation resistance of the mixture. However, this index is a single evaluation index, which cannot comprehensively evaluate the BBT results [38]. According to the principle of Dse calculation, the calculation of this index involves the whole process from loading to damage of the mixture, which can better reflect the comprehensive influence of multiple factors [40]. It can effectively evaluate the fracture resistance of the mixture under the test temperature conditions. Therefore, Sft and Dse were recommended to evaluate the crack resistance comprehensively.
(b) As the air voids decreased, the crack resistance of the mixture improved. The improvement of crack resistance indices was more significant at −10 °C when the air voids decreased to 2.5%. It was because when air voids were reduced, the internal compaction of the mixture was closer. Contact stress between the constituent particles was enhanced, which was conducive to resistance to external loads. Meanwhile, the asphalt film thickness increased at low air voids (Table 5), which strengthened the cohesion of the particles. This improved the resistance to deformation. The improvement of each index at different temperatures by reducing air voids is shown in Figure 8. The improvement range was only 2.1~6.7% at 15 °C. In comparison, it was 19.0~46.6% at −10 °C.
(c) The crack resistance of the 10-A gradation mixture was better than that of the other two groups. As shown in Figure 6, the Sft and Dse values of the 10-A gradation mixture were higher than the other two groups at different air voids and test temperatures. According to the calculation results of the key sieve and Bailey method [37] parameters (as shown in Table 6), the 2.36 mm passing rate, 2.36–4.75 mm particle size content, and coarse aggregate ratio (CA) of 10-A gradation were significantly higher than the other two types. According to the calculation principle, the CA value indicates the proportion of 2.36–4.75 mm aggregate to 4.75–9.5 mm aggregate. Larger CA values indicate higher content of finer aggregates in the coarse aggregate. The higher fine aggregate content could effectively promote crack healing at the early loading stage. Thus, it might exhibit relatively high crack resistance performance.

3.2. Crack Extension Semicircular Bending Test

Each mixture was tested according to the CE-SCB test method mentioned above. The measured Gf and FI test results are shown in Figure 9.
(a) The variation of Gf and FI were consistent with the change of air voids and gradation (Figure 9), indicating that both indices can be used to evaluate the crack expansion resistance of AR-SAMI. According to the meaning, Gf reflects the energy required for the crack expansion of the asphalt mixture. FI is the inherent property of the mixture material and characterizes the crack expansion resistance rate. The value of |m| was small when FI was high. The slope of the force–displacement curve after the peak of the curve was flat indicates the better crack expansion resistance of AR-SAMI. In terms of the above test data, the two had good consistency.
(b) When the air voids were reduced, the crack extension resistance of AR-SAMI increased, and 10-A gradation had the maximum enhancement. With the reduction of air voids, the Gf and FI of each mixture increased, and the two indices increased by 17.8%, 11.0%, and 13.6%, and 40.0%, 4.4%, and 23.2%, respectively, indicating that reducing the air voids could enhance the crack expansion resistance of AR-SAMI. The mixture was compact due to the reduction of air voids. The decrease in inter-particle voids effectively inhibited the rapid development of cracks. It was demonstrated by the need for higher fracture energy to reach a fully extended crack. In addition, the two indices of the 10-A gradation mixture increased significantly higher than that of 10-B, indicating that the crack expansion resistance of AR-SAMI with more fine aggregate was more sensitive to the change of air voids.
(c) Among the three gradations, the crack expansion resistance of the 10-B type (including 10-B-1 and 10-B-2) mixture was significantly better than 10-A. As shown in Figure 9, the Gf and FI of 10-A were significantly lower than those of 10-B types. The indices of the 10-A at 2.5% air voids were still lower than the 10-B types with 4.0% air voids. It was because the passing rate of the 2.36 mm key sieve and CA value of 10-B types were smaller, indicating they had less fine aggregate content and coarse aggregate content of the finer aggregate. In contrast, the coarser aggregate was relatively more. In the presence of cracks, the more coarse aggregate facilitated the strain release at the cracks, which exhibited better resistance to crack expansion.

3.3. Low-Temperature Semicircular Bending Test

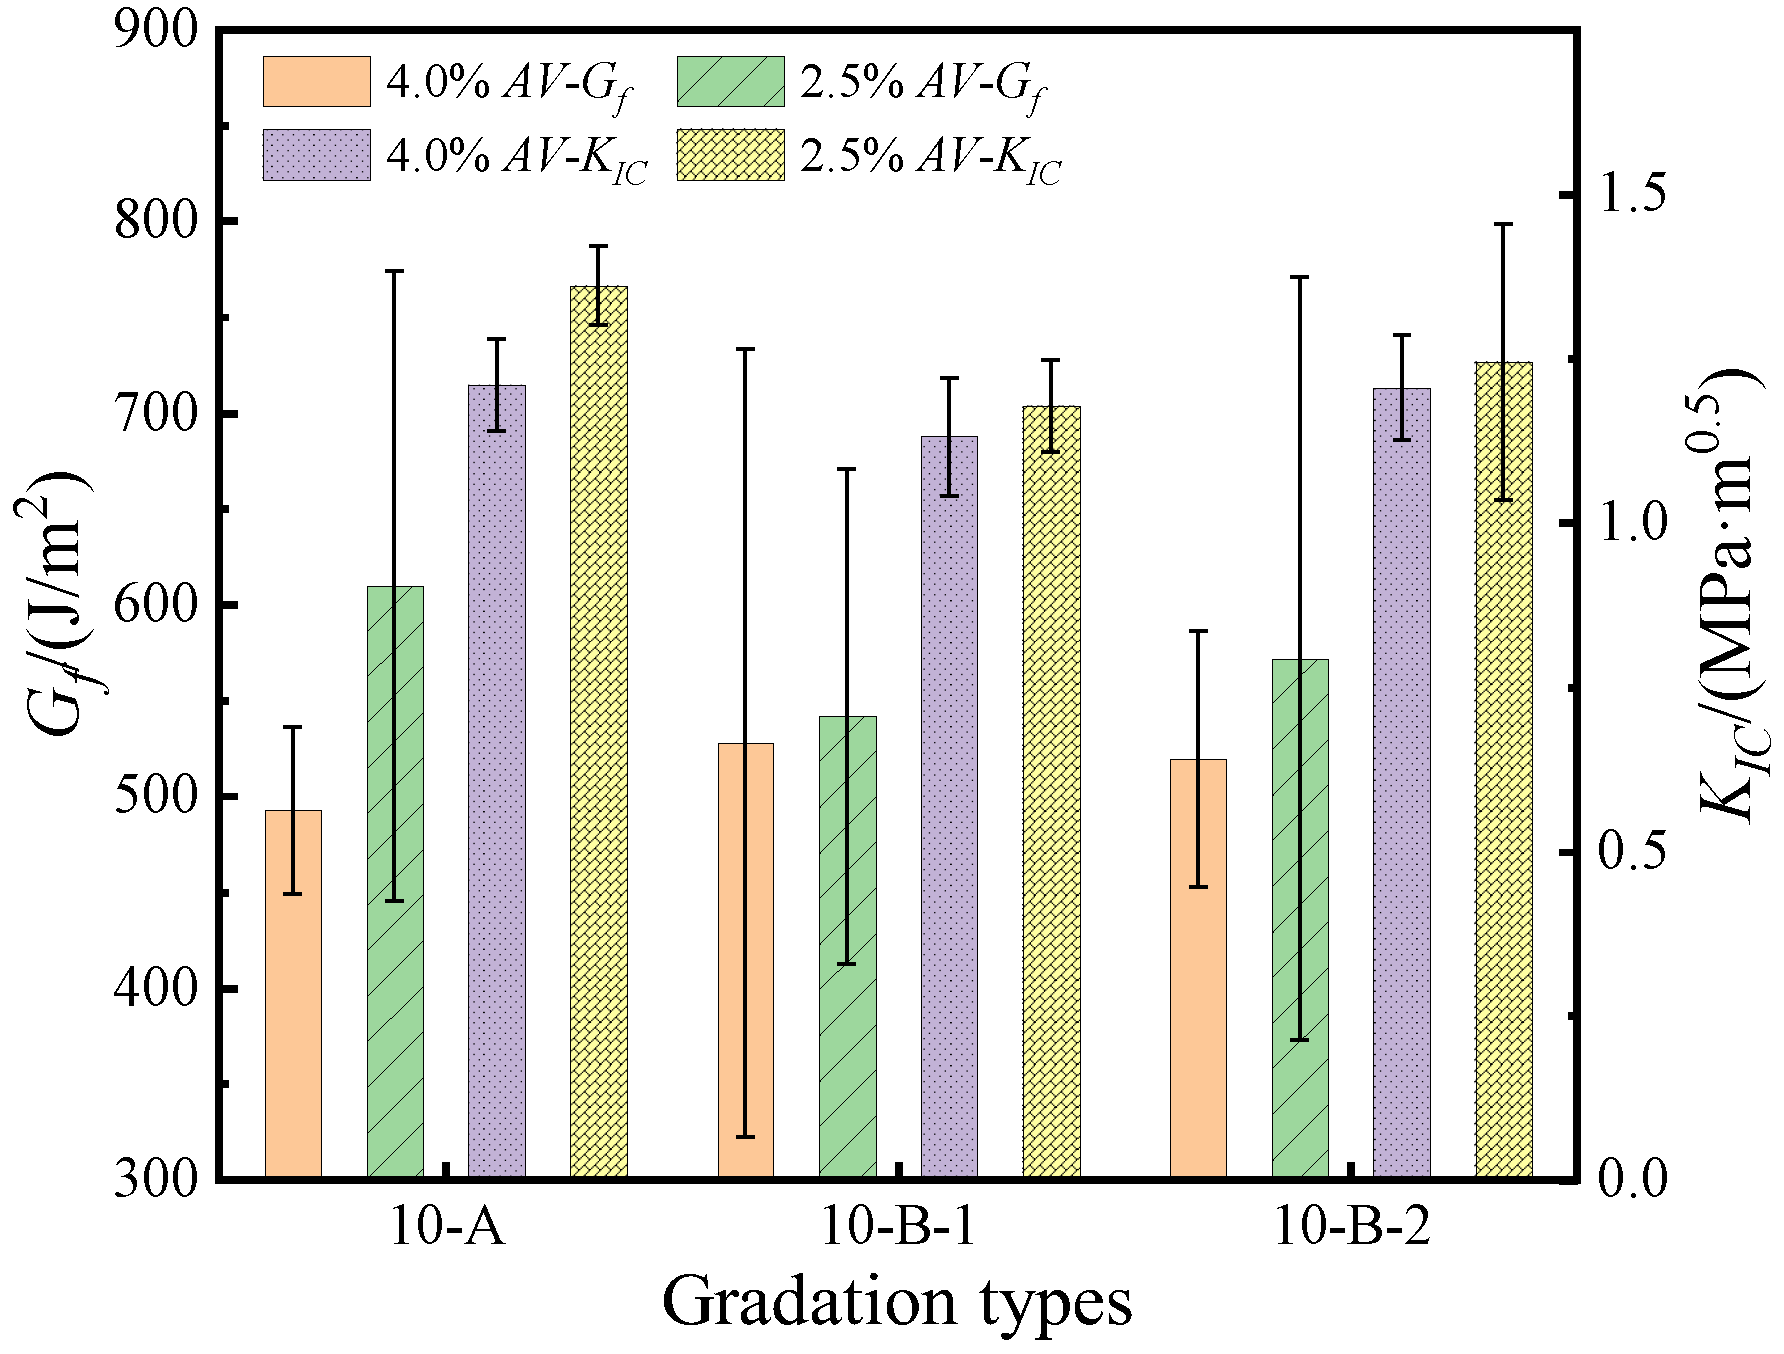
Each mixture was tested according to the LT-SCB test method mentioned above. Gf and KIC results are shown in Figure 10.
(a) The variation of Gf and KIC was consistent with the change of air voids, while there were some differences with gradations. Considering the different focus of the two indices, Gf and KIC were recommended to characterize the low-temperature crack expansion resistance of the AR-SAMI. As the air voids decreased, both indices increased. However, there was no significant correspondence with the change of gradation. For example, when the air voids were 4.0%, the Gf of the 10-A was the lowest, but its KIC was the highest. The Gf reflects the energy required to resist deformation. It takes into account the whole cracking process. In comparison, KIC demonstrates the ability to absorb energy in the fracture process. It takes into account the impact of the specimen load and size. So, there are differences between Gf and KIC.
(b) Gf and KIC increased as the air voids decreased. The 10-A gradation increased most significantly. When the design air voids were reduced from 4.0% to 2.5%, Gf and KIC of three gradations increased. There were 23.7%, 2.7%, and 10.0% and 12.5%, 4.2%, and 3.2%, respectively. It showed that the mixture compactness increased with the air voids decreased. It was beneficial to improve the crack expansion resistance of AR-SAMI. Meanwhile, for the finer gradation (10-A), reducing the air voids could enhance the low-temperature crack resistance.
(c) The coupling influence of air voids complicated the influence of gradation on LT-SCB test results. When the air voids were 4%, Gf of 10-A was the lowest, and 10-B-1 was the highest. The indices showed an opposite magnitude relationship when the air voids decreased to 2.5%. Gf of 10-A was the highest and 10-B-1 was the lowest. It showed that the coarse aggregate content was higher at larger air voids (4%), thus with higher Gf. However, the improvement of Gf was more significant with the gradation with more fine aggregate after decreasing the air voids to 2.5%. In addition, the FI varied with gradation at different air voids in the same pattern, all of which were 10-A maximum.

3.4. Overlay Test

OT test was conducted at 25 °C with 1200 loadings. Then, LLR and CRI were calculated, respectively. The test results are shown in Figure 11.
(a) The LLR and CRI showed good consistency with the change of air voids and gradation. As air voids decreased, the LLR of each specimen decreased, and the CRI increased. Among the three gradations, the index values of 10-A and 10-B-1 were the same and better than that of 10-B-2. According to the meaning, the LLR indicates the load reduction ratio at cyclic tensile with fixed displacement. The CRI indicates the decreasing rate of loading. Although the evaluation of the two indices had differences, as far as the data are concerned, both indices could show the crack resistance of the AR-SAMI under the loading process.
(b) As the air voids decreased, the LLR decreased, and the CRI increased, indicating that the fatigue cracking resistance of the AR-SAMI was enhanced. The 10-B-2 test results were the worst among three gradations at two air voids. In addition, the LLR of all specimens was larger than 93% after 1200 cycles of loading, indicating that the AR-SAMI met the test requirements of the OT.

3.5. Correlation Analysis of Evaluation Indices

Among the above crack resistance evaluation tests and indices, there were differences in the evaluation focus. The Pearson Test was conducted using statistical analysis to further investigate the correlation between the above test methods and indices. Analysis results are shown in Figure 12.
(a) Among the five test methods, there were differences in the evaluation consistency of the respective two indices for each test. Among them, there was a significant correlation between the different evaluation indices of three test methods (−10 °C BBT, CE-SCB test, and OT). A single index could be used for alternative evaluation of the crack resistance of AR-SAMI. In the remaining two test methods (15 °C BBT and the LT-SCB test), their two indices did not have a significant correlation, indicating that their two indices of test methods had large differences. There did not exist simple substitution or conversion relationships. Therefore, both indices of the above two tests should be used to evaluate AR-SAMI comprehensively.
(b) Among the five test methods, there were good correlations between the indices of some test methods, and mutual substitution could be considered in the corresponding performance evaluation. The specific analyses are as follows:
  • Evaluation of crack resistance: The two indices of the LT-SCB test were significantly correlated with the Dse of −10 °C BBT. So, the Dse of −10 °C BBT could be a substitute to evaluate the results of the LT-SCB test. However, indices of the LT-SCB test were not significantly related to the Sft of the −10 °C BBT. Considering only Sft was used in China [31], it is necessary to add Dse to evaluate crack resistance. In addition, studies have shown that asphalt mixtures are more likely to form cracks at low temperatures [33]. Therefore, instead of 15 °C BBT, −10 °C BBT results can be used to evaluate crack resistance.
  • Evaluation of crack expansion resistance: Indices of the CE-SCB test were not significantly related to other test indices. However, there was a significant correlation between the two indices of this test. Since FI considered the post-peak load characteristics, it could better reflect the resistance of crack expansion. Therefore, the FI could be used to evaluate the crack expansion resistance of AR-SAMI.
  • Evaluation of fatigue crack resistance: There was a significant correlation between the two indicators in the OT. The two OT indices were significantly correlated with the −10 °C Sft. However, considering the significant differences between the two test conditions and crack types, a more general correlation still needs further verification. Therefore, using CRI to evaluate the fatigue crack resistance performance of AR-SAMI is still recommended.
Considering the validity and comprehensiveness of the evaluation indices and the simplicity of the test methods and indices, the following test methods and indices (as shown in Table 7) are recommended for the comprehensive evaluation of the crack resistance of AR-SAMI.

3.6. Comprehensive Comparative Analysis of Crack Resistance

The recommended test methods and indices were adopted. Test results of crack resistance at different gradations and air voids were processed using the Min-Max normalization method. The normalized heat map of crack resistance is shown in Figure 13.
In summary, the crack resistance indices of the three gradations were better when the air voids were small. But, there were differences in the performance indices of different gradations. Comparing the four indices of the ARSAMI under two air voids, the indices of all gradations with 2.5% air voids were significantly higher than those of 4.0% air voids. Among all gradations, 10-A had the three highest indices (−10 °C Sft, −10 °C Dse, and CRI) at two air voids. However, the FI of 10-A was the worst. It indicates that the crack resistance of AR-SMAI varies in different evaluation focus and even existed the opposite phenomenon.
Different test methods focus differently on evaluating crack resistance. The BBT is a single damage test that focuses on evaluating the strength characteristics of the AR-SAMI. The two SCB tests focus on evaluating crack expansion resistance under pre-crack conditions. The LT-SCB test focuses on low-temperature resistance to crack expansion performance. The OT focuses on performance decay under cyclic loading. It is similar to the fatigue performance test. Therefore, the design of the AR-SAMI needs to consider the evaluation results of the crack resistance under different tests. AR-SAMI should be a comprehensive balance design. For example, the BBT of AR-SAMI should be adopted for the new pavement construction because the sublayer cracks have not been formed. Suppose the AR-SAMI is added to the existing pavement. The CE-SCB test should be considered as the cracks already exist on the existing pavement with potential problems. Considering the OT can evaluate the tensile fatigue crack resistance performance, the OT should be a priority selection if the traffic volume is high. In addition, the inconsistency of evaluation results further indicated the necessity of using different test methods to comprehensively evaluate the crack resistance performance in various aspects of performance requirements.

4. Conclusions

AR-SAMI with two air voids and three gradations was selected. The BBT at different temperatures and CE-SCB, LT-SCB, and OT tests were conducted to evaluate the crack resistance. Statistical analysis of the test indices was performed. The main findings are as follows:
  • All test methods showed that the crack resistance indices of AR-SAMI were significantly improved when the air voids were reduced from 4.0% to 2.5%. Therefore, the comprehensive crack resistance of AR-SAMI may perform better when the design air voids are decreased.
  • The gradation 10-A, which contains more fine aggregate, performed better on most crack resistance indices. However, its crack extension resistance was poor. The CE-SCB and the LT-SCB tests showed that the 10-B type (including 10-B-1 and 10-B-2) with more coarse aggregate had better crack extension resistance under pre-existing cracks.
  • There are differences in the evaluation results of different test methods and indices due to the differences in the evaluation mechanism. The test evaluation methods and corresponding indices should be selected according to the engineering characteristics of applications. The crack resistance should be designed in a targeted and comprehensive balance method. Considering the validity, comprehensiveness, and simplicity of the evaluation tests and indices, the test methods and indices in Table 7 were recommended for the comprehensive evaluation of the crack resistance of AR-SAMI.
In this work, the conclusions are based on three ten-type gradations. The type and number of test gradations are small, which has some limitations. Therefore, other mixture types and a wider range of gradations still need to be thoroughly analyzed for more universal research conclusions. In addition, the pavement performances (including high-temperature performance, low temperature performance, and water stability) and bonding properties of AR-SAMI should be combined for a comprehensive evaluation of the engineering application.

Author Contributions

Conceptualization, P.L. and Z.L.; methodology, W.P.; validation, S.T. and J.L.; formal analysis, W.P. and J.L.; investigation, J.L. and S.L.; resources, P.L. and Z.L.; data curation, W.P. and J.L.; writing—original draft preparation, S.T. and J.L.; writing—review and editing, W.P. and P.L.; supervision, P.L.; project administration, P.L.; funding acquisition, P.L. All authors have read and agreed to the published version of the manuscript.

Funding

This research was funded by the National Key Research and Development Program (China, 2021YFB2601000), Guangxi Key Research and Development Program (AB21220070, 2021AB22145), and the Postgraduate Scientific Research Innovation Project of Hunan Province (QL20220189).

Institutional Review Board Statement

Not applicable.

Informed Consent Statement

Not applicable.

Data Availability Statement

All data, models, and code generated or used during the study appear in the published article.

Conflicts of Interest

The authors declare no conflict of interest.

References

  1. Wang, X.; Zhong, Y. Reflective crack in semi-rigid base asphalt pavement under temperature-traffic coupled dynamics using XFEM. Constr. Build. Mater. 2019, 214, 280–289. [Google Scholar] [CrossRef]
  2. Oshone, M.; Dave, E.V.; Sias, J.E. Asphalt mix fracture energy based reflective cracking performance criteria for overlay mix selection and design for pavements in cold climates. Constr. Build. Mater. 2019, 211, 1025–1033. [Google Scholar] [CrossRef]
  3. Idris, I.I.; Sadek, H.; Hassan, M. State-of-the-Art Review of the Evaluation of Asphalt Mixtures’ Resistance to Reflective Cracking in Laboratory. J. Mater. Civil Eng. 2020, 32, 0312004. [Google Scholar] [CrossRef]
  4. Rith, M.; Lee, S.W. Development of cohesive-zone-based prediction model for reflective cracking in asphalt overlay. Int. J. Pavement Eng. 2022, 23, 1050–1059. [Google Scholar] [CrossRef]
  5. Shan, J.; Zhang, Y.; Wu, S.; Wu, Q.; Jiao, Y.; Du, Y. Cracking behavior of asphalt pavement with a graded gravel layer based on computational granular mechanics. Constr. Build. Mater. 2022, 345, 128199. [Google Scholar] [CrossRef]
  6. Fang, H.; Luo, H.; Zhu, H. The feasibility of continuous construction of the base and asphalt layers of asphalt pavement to solve the problem of reflective cracks. Constr. Build. Mater. 2016, 119, 80–88. [Google Scholar] [CrossRef]
  7. Shafabakhsh, G.; Ahmadi, S. Reflective cracking reduction by a comparison between modifying asphalt overlay and sand asphalt interlayer: An experimental evaluation. Int. J. Pavement Eng. 2021, 22, 192–200. [Google Scholar] [CrossRef]
  8. Baek, C. Performance Evaluation of Fiber-Reinforced, Stress Relief Asphalt Layers to Suppress Reflective Cracks. Appl. Sci. 2020, 10, 7701. [Google Scholar] [CrossRef]
  9. Haslett, K.; Dave, E.; Sias, J.; Linder, E. Statistical Analysis Framework to Evaluate Asphalt Concrete Overlay Reflective Cracking Performance. Transp. Res. Rec. J. Transp. Res. Board 2022, 2676, 132–146. [Google Scholar] [CrossRef]
  10. Habbouche, J.; Hajj, E.Y.; Morian, N.E.; Sebaaly, P.E.; Piratheepan, M. Reflective cracking relief interlayer for asphalt pavement rehabilitation: From development to demonstration. Road Mater. Pavement 2017, 18, 30–57. [Google Scholar] [CrossRef]
  11. Pasquini, E.; Pasetto, M.; Canestrari, F. Geocomposites against reflective cracking in asphalt pavements: Laboratory simulation of a field application. Road Mater. Pavement 2015, 16, 815–835. [Google Scholar] [CrossRef]
  12. Zeng, Z.; Guo, Y.; Li, P.; Shen, A.; Zhai, C. Performance research of fiber-reinforced asphalt rubber as a stress-absorbing membrane interlayer. J. Adhes. Sci. Technol. 2021, 35, 2047–2063. [Google Scholar] [CrossRef]
  13. Zhang, K.; Zhang, Z.; Luo, Y. Material Composition Design and Anticracking Performance Evaluation of Asphalt Rubber Stress-Absorbing Membrane Interlayer (AR-SAMI). Adv. Mater. Sci. Eng. 2018, 2018, 8560604. [Google Scholar] [CrossRef] [Green Version]
  14. Ogundipe, O.M.; Thom, N.H.; Collop, A.C. Evaluation of performance of stress-absorbing membrane interlayer (SAMI) using accelerated pavement testing. Int. J. Pavement Eng. 2013, 14, 569–578. [Google Scholar] [CrossRef]
  15. Karki, P.; Mraiza, Z.; Karnei, E.; Hu, S. Performance-graded asphalt binder selection catalog for asphalt overlays. Constr. Build. Mater. 2022, 319, 126012. [Google Scholar] [CrossRef]
  16. Peng, W.; Li, P.; Gong, W.; Tian, S.; Wang, Z.; Liu, S.; Liu, Z. Preparation and mechanism of rubber-plastic alloy crumb rubber modified asphalt with low viscosity and stabilized performance. Constr. Build. Mater. 2023, 388, 131687. [Google Scholar] [CrossRef]
  17. Picado-Santos, L.G.; Capitão, S.D.; Neves, J.M.C. Crumb rubber asphalt mixtures: A literature review. Constr. Build. Mater. 2020, 247, 118577. [Google Scholar] [CrossRef]
  18. Asgharzadeh, S.M.; Sadeghi, J.; Peivast, P.; Pedram, M. Fatigue properties of crumb rubber asphalt mixtures used in railways. Constr. Build. Mater. 2018, 184, 248–257. [Google Scholar] [CrossRef]
  19. Aliha, M.R.M.; Fazaeli, H.; Aghajani, S.; Moghadas Nejad, F. Effect of temperature and air void on mixed mode fracture toughness of modified asphalt mixtures. Constr. Build. Mater. 2015, 95, 545–555. [Google Scholar] [CrossRef]
  20. Zhang, Q. Effect of Grading Type on the Performance of Warm-Mix Rubber-Asphalt Mixture. IOP Conf. Ser. Earth Environ. Sci. 2020, 526, 12152. [Google Scholar] [CrossRef]
  21. Pan, R.; Li, Y. Effect of warm mix rubber modified asphalt mixture as stress absorbing layer on anti-crack performance in cold region. Constr. Build. Mater. 2020, 251, 118985. [Google Scholar] [CrossRef]
  22. Wang, S.; Yan, K.; Ge, D.; Hong, Z. Laboratory research on the performance of stress-absorption interlayer (SAI) of waste tire rubber and amorphous ploy alpha olefin modified asphalt. Constr. Build. Mater. 2019, 223, 830–840. [Google Scholar] [CrossRef]
  23. Thives, L.P.; Pais, J.C.; Pereira, P.A.A.; Minhoto, M.C.; Trichês, G. Performance of Asphalt Rubber Mixture Overlays to Mitigate Reflective Cracking. Materials 2022, 15, 2375. [Google Scholar] [CrossRef] [PubMed]
  24. Pei, Z.; Yi, J.; Mao, Q.; Feng, D.; Wang, D. DEM analysis of the evolution of reflection cracks in old cement concrete pavement with an ATB layer. Int. J. Pavement Eng. 2022, 1–10. [Google Scholar] [CrossRef]
  25. Li, C.; Zhou, H.; Wu, Z.; Wang, Z. International Conference on Transportation Engineering. In Alleviating Crack Properties of Crack Alleviating Mixture; American Society of Civil Engineers: Reston, VA, USA, 2009. [Google Scholar]
  26. AASHTO TP 124-16; American Association of State Highway and Transportation Officials Standard Method of Test for Determining the Fracture Potential of Asphalt Mixtures Using Semicircular Bend Geometry (SCB) at Intermediate Temperature. American Association of State Highway and Transportation Officials: Washington, DC, USA, 2016.
  27. AASHTO TP 105-13; American Association of State Highway and Transportation Officials Standard Method of Test for Determining the Fracture Energy of Asphalt Mixtures Using the Semicircular Bend Geometry (SCB). American Association of State Highway and Transportation Officials: Washington, DC, USA, 2019; p. 13.
  28. Germann, F.P.; Lytton, R.L. Methodology for Predicting the Reflection Cracking Life of Asphalt Concrete Overlays; Texas A&M University: College Station, TX, USA, 1979; pp. 25–45. [Google Scholar]
  29. Nam, B.H.; Golestani, B.; Noori, M.; Tatari, O.; An, J. Investigation of Reflective Cracking Mitigation Techniques; Department of Civil, Environmental, and Construction Engineering University of Central Florida: Orlando, FL, USA, 2014; pp. 1–153. [Google Scholar]
  30. Zhou, F.; Newcomb, D.; Gurganus, C.; Banihashemrad, S. Field Validation of Laboratory Tests to Assess Cracking Resistance of Asphalt Mixtures: An Experimental Design (2016); National Academy of Sciences: Washington, DC, USA, 2016. [Google Scholar]
  31. JTG F40-2004; Ministry of Communications of the People’s Republic of China Technical Specifications for Construction of Highway Asphalt Pavement. Ministry of Communications: Beijing, China, 2004.
  32. Wang, H.; Dang, Z.; Li, L.; You, Z. Analysis on fatigue crack growth laws for crumb rubber modified (CRM) asphalt mixture. Constr. Build. Mater. 2013, 47, 1342–1349. [Google Scholar] [CrossRef]
  33. Mandal, T.; Yin, H.; Ji, R. Correlating laboratory and full-scale reflective cracking tests for airfield pavements. Constr. Build. Mater. 2018, 169, 47–58. [Google Scholar] [CrossRef]
  34. JTG E20-2011; Ministry of Communications of the People’s Republic of China Standard Test Methods of Bitumen and Bituminous Mixtures for Highway Engineering. Ministry of Communications: Beijing, China, 2011.
  35. DB45/T 1098-2014; Guangxi Zhuang Autonomous Region Quality and Technical Supervision Bureau Technical Specification for Construction of Asphalt Rubber Pavement. Guangxi Zhuang Autonomous Region Quality and Technical Supervision Bureau: Nanning, China, 2014.
  36. DG/TJ08-2109-2012; Shanghai Urban-Rural Construction and Transportation Commission Technical Code for Asphalt Rubber Pavement. Shanghai Urban-Rural Construction and Transportation Commission: Shanghai, China, 2012.
  37. Swathi, M.; Andiyappan, T.; Guduru, G.; Amarnatha Reddy, M.; Kuna, K.K. Design of asphalt mixes with steel slag aggregates using the Bailey method of gradation selection. Constr. Build. Mater. 2021, 279, 122426. [Google Scholar] [CrossRef]
  38. Ge, Z.; Huang, X.; Xu, G. Evaluation of asphalt-mixture’s low-temperature anti-cracking performance by curvature strain energy method. J. Southeast Univ. Nat. Sci. Ed. 2002, 32, 653–655. [Google Scholar]
  39. Tex-248-F; Texas Department of Transportation Test Procedure for Overlay Test. Texas Department of Transportation: Austin, TX, USA, 2017; pp. 1–13.
  40. Feng, D.; Cui, S.; Yi, J.; Chen, Z.; Qin, W. Evaluation Index of Low-temperature Asphalt Mixture Performance Based on Semi-circular Bending Test. China J. Highw. Transp. 2020, 33, 50–57. [Google Scholar]
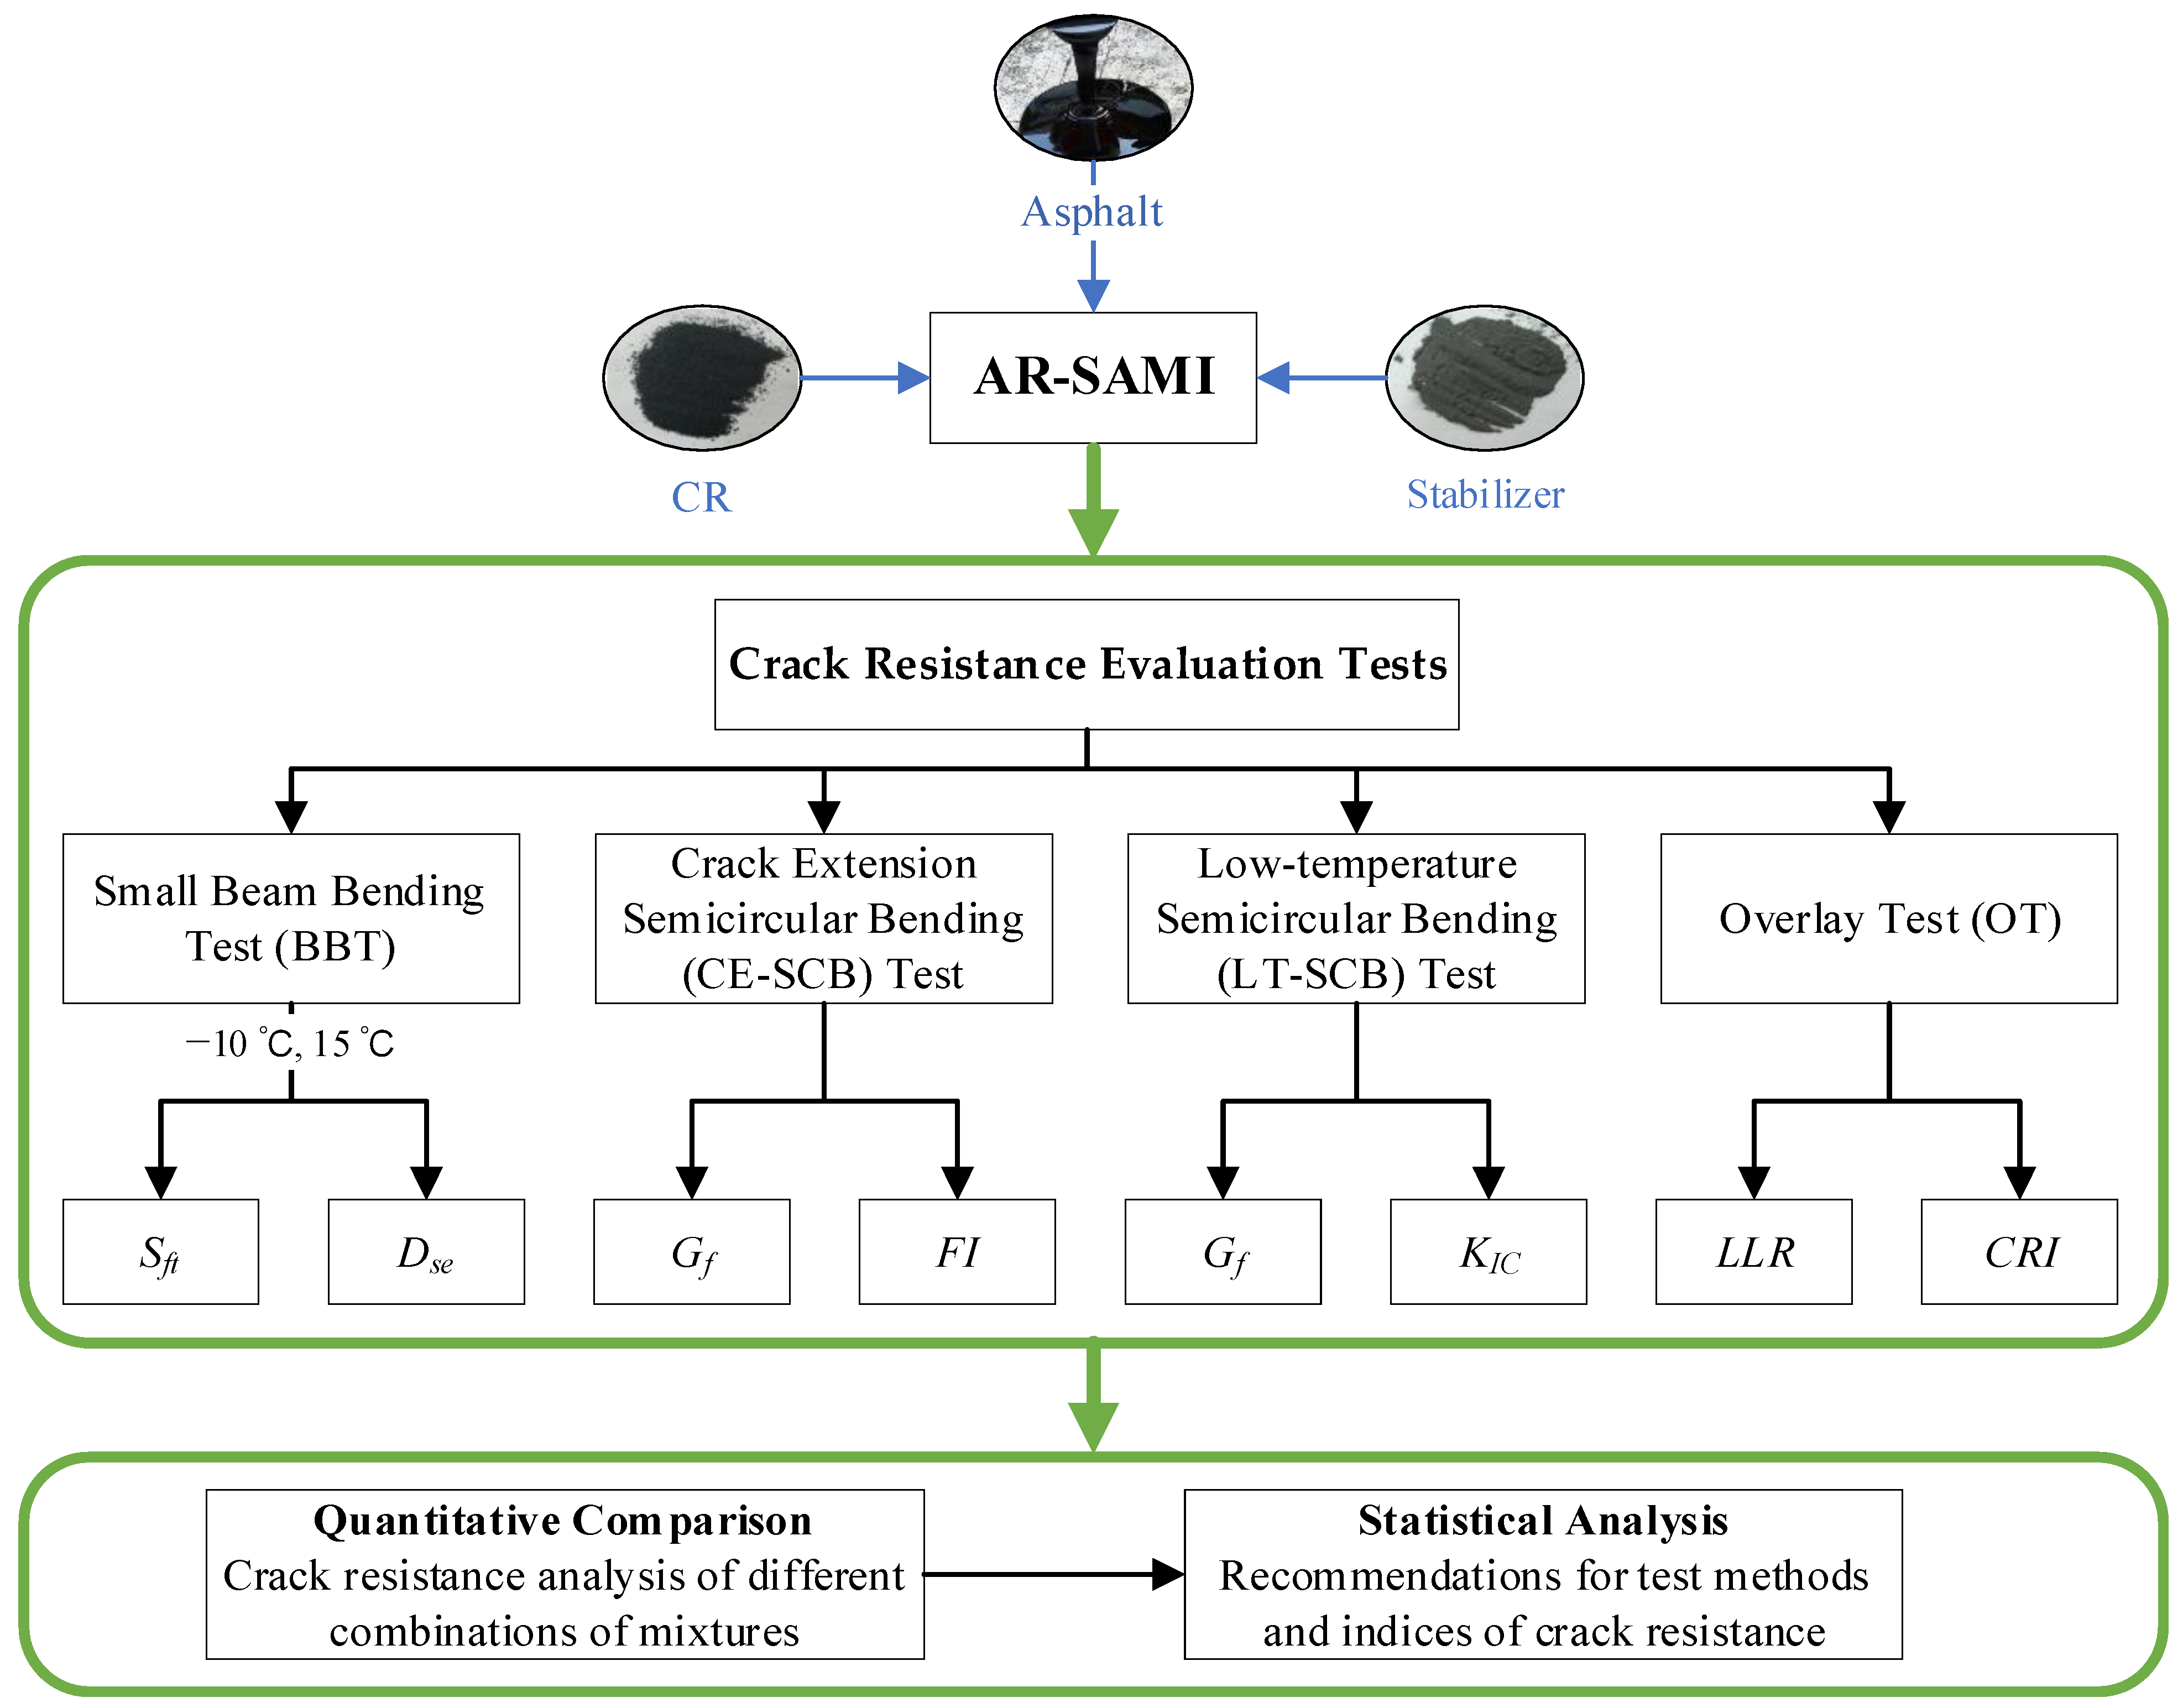
Figure 1. Research flowchart.
Sustainability 15 08982 g001
Figure 2. Crumb Rubber and stabilizer of crumb rubber modified asphalt. (a) Crumb rubber (b) Stabilizer.
Sustainability 15 08982 g002
Figure 3. Specimen preparation and specimen process of CE-SCB test. (a) Schematic diagram of specimen preparation. (b) Test loading process.
Sustainability 15 08982 g003
Figure 4. Typical force–displacement curve of the CE-SCB test [26].
Sustainability 15 08982 g004
Figure 5. Schematic diagram of OT test. (a) Schematic diagram of specimen cutting process. (b) OT test process diagram.
Sustainability 15 08982 g005
Figure 6. Small beam bending test results of AR-SAMI @ −10 °C. (a) Sft. (b) Dse.
Sustainability 15 08982 g006
Figure 7. Small beam bending test results of AR-SAMI @ 15 °C. (a) Sft. (b) Dse.
Sustainability 15 08982 g007
Figure 8. Change trend of Sft and Dse with gradation.
Sustainability 15 08982 g008
Figure 9. CE-SCB test results of AR-SAMI.
Sustainability 15 08982 g009
Figure 10. LT-SCB test results of AR-SAMI.
Sustainability 15 08982 g010
Figure 11. OT results of AR-SAMI.
Sustainability 15 08982 g011
Figure 12. Pearson correlation analysis results for each evaluation index. Note: * indicates a significant correlation between the corresponding bivariate (significance parameter p < 0.05). The degree of elliptical flattening increases with the absolute value of the correlation coefficient. Red indicates positive correlation and blue indicates negative correlation. The brighter the color, the greater the correlation.
Sustainability 15 08982 g012
Figure 13. Crack resistance normalized heat map of AR-SAMI.
Sustainability 15 08982 g013
Table 1. Technical indices of crumb rubber modified asphalt.
Technical IndicesUnitsTest ResultsTest Methods [34]
Penetration (25 °C, 5 s, 100 g)0.1 mm39.3T 0604
Ductility (5 °C, 5 cm/min)cm11.6T 0605
Softening point°C75.5T 0606
Brookfield viscosity (180 °C)Pa·s2.51T 0625
Elastic recovery rate (25 °C)%94.0T 0662
Table 2. Main technical indices of aggregate.
Aggregate TypesTechnical IndicesUnitsTest ResultsRequirements [31]Test Methods
Coarse
aggregate
Crushing value%17≤26T 0316
Apparent specific gravity9.5~13.2 mm2.705≥2.60T 0304
4.75~9.5 mm2.735
2.36~4.75 mm2.63
Bulk specific gravity9.5~13.2 mm2.676T 0304
4.75~9.5 mm2.654
2.36~4.75 mm2.611
Water absorption9.5~13.2 mm%0.41≤2.0T 0304
4.75~9.5 mm1.11
2.36~4.75 mm0.27
Flat and elongated particles content9.5~13.2 mm%13.2≤15T 0312
4.75~9.5 mm10.9≤15
2.36~4.75 mm7.5≤20
Adhesional degree with aggregate5≥4T 0616
Fine
aggregate
Apparent specific gravity2.622≥2.50T 0304
Bulk specific gravity2.620T 0304
Water absorption%0.27T 0304
Sand equivalent%69≥60T 0334
Angularity (Flow time method)s32.2≥30T 0345
Table 3. Test gradations of AR-SAMI.
Gradation TypesMass Percentage Passing the Following Square-Mesh Sieve (mm)/%
13.29.54.752.361.180.60.30.150.075
10-A10091574027191396
10-B-1100953528211713108
10-B-210098382923151186
Table 4. Mixture design results of each gradation.
Gradation TypesAir Voids/%Optimal Asphalt–Aggregate Ratio/%VMA/%VFA/%Asphalt Film Thickness/μm
10-A4.05.7515.7874.699.13
2.56.1015.1183.419.70
10-B-14.05.5715.4074.078.21
2.56.5515.9384.389.71
10-B-24.05.8916.0475.1310.46
2.56.4615.7884.1811.51
Table 5. Improvement of crack resistance by reducing air voids at different temperatures.
Gradation TypesImprovement of Sft/%Improvement of Dse/%
−10 °C15 °C−10 °C15 °C
10-A33.24.743.46.0
10-B-123.95.019.02.4
10-B-246.62.134.36.7
Table 6. Evaluation parameters for each gradation.
Gradation Parameters10-A10-B-110-B-2
Passing rate of key sieve (2.36 mm)/%402829
Key sieve aggregate content/%4.75–9.5 mm346060
2.36–4.75 mm1779
Parameters of Bailey methodCA0.400.110.15
FAc0.480.610.52
FAf0.470.590.53
Note: Referring to the calculation method of the Bailey method [37], CA is the coarse aggregate ratio; FAc is the ratio of the coarse aggregate to the fine in the fine aggregate; FAf is the ratio of the coarser aggregate to the finer aggregate in the finest aggregate.
Table 7. Recommended crack resistance evaluation tests and indices.
Recommended Test MethodsRecommended IndicesFocus on Evaluating Performance
−10 °C BBTSft, DseLow-temperature crack resistance
CE-SCBFICrack extension resistance
OTCRIFatigue crack resistance
Disclaimer/Publisher’s Note: The statements, opinions and data contained in all publications are solely those of the individual author(s) and contributor(s) and not of MDPI and/or the editor(s). MDPI and/or the editor(s) disclaim responsibility for any injury to people or property resulting from any ideas, methods, instructions or products referred to in the content.