Abstract
The drainage modulus is an important indicator in the drainage system design of farmlands. Changes in the drainage modulus determine the effectiveness of drainage projects, and thus agricultural production. Thus, in this research, the trends in the drainage modulus of the Huaibei Plain, China were examined. The drainage modulus was estimated using the average draining method at 16 meteorological stations located in different areas of the Huaibei Plain during the period of 1960–2017. The trends of the drainage modulus were investigated using the Mann–Kendall test and Sen’s slope estimator. The periodicities of the drainage modulus were investigated using wavelet analysis. The major environmental factors affecting the drainage modulus were investigated using the contribution rate method. The results showed that the mean drainage modulus (q1, q3) had increasing trends and significant 2.4-year and 2.5-year periodicities, respectively. An increase in building lots was the main factor that influenced the variability in the drainage modulus. Rapid urbanization increased the risk of agricultural waterlogging. These results provide important references for scientific planning in agriculture and farmland drainage engineering.
1. Introduction
Waterlogging is a natural disaster that affects agricultural production [1,2,3,4]. Globally, approximately 10% of the agricultural area is affected by waterlogging, resulting in an approximately 20% reduction in crop yield [1,5]. In China, the area of waterlogged arable land is 3.11 × 10⁵ km2, accounting for 25% of the total area of cultivated land [6]. Due to its wide range, severity, and great economic consequences, waterlogging has negative impacts on agricultural production and economic development [7]. In addition, due to climate change and rapid urbanization, the intensity and frequency of precipitation have increased [8] and resulted in frequent waterlogging disasters, which are serious threats to agriculture [9,10]. The control of waterlogged arable land has drawn great attention from governments, researchers, and food producers. The drainage engineering of farmland and the sponge city strategy are the main components of waterlogging control work measures [11,12]. The study of farmland drainage engineering and design parameters is crucial for controlling waterlogging in agricultural regions.
The drainage modulus, which is the runoff per unit area per unit time, is an important indicator in the drainage system design of farmlands and in drainage engineering, and it is very important for controlling waterlogged arable land [12,13]. Many researchers worldwide have performed substantive research on calculating the drainage modulus [13,14,15,16]. For example, El-Sadek, Feyen and Berlamont [14] incorporated Hooghoudt’s steady-state equation into the WAVE model to calculate drainage flux. Arnold, Williams and Maidment [15] developed the continuous-time water and sediment-routing model to calculate drainage flux. You, Wang, Tao and Liu [16] calculated the drainage coefficient based on the calculation results of the theoretical runoff using the empirical formula and the average draining method in the Wanyan River Surface Waterlogged Area (Suibin County) of the Sanjiang Plain. In China, the empirical formula, average draining method, water balance method, Nash’s instantaneous unit curve method, infiltration-runoff math-theoretical model, and hydraulic model have been used to calculate the drainage modulus [13,15,17,18]. Due to its reliable computational results and because the required data are available and reliable, the average exclusion method has been used to calculate the drainage modulus in China’s plain lake areas. The primary input data include the design rainstorm, evaporation from an evaporation pan, and land-use type areas.
The Huaibei Plain is an important grain production area in China, on which dry land crops are widely cultivated [19]. This area is located in the Huaihe River Basin, which is characterized by low-lying terrain and a diverse network of rivers. Due to climate warming and human activities, the intensity and frequency of precipitation have increased [8]. Affected by the drainage project and the water level of the river, precipitation during heavy rainfall cannot be discharged in a timely manner, resulting in serious waterlogging [20,21]. In addition, imperfect field drainage systems and inadequate management have resulted in an increase in waterlogging disasters and crop losses [22]. The drainage modulus is an important indicator in the drainage system design of farmlands and the drainage pump station, and it is very important to agricultural production in this area.
Recent research has focused on the changing trends of extreme rainfall [8], hydrological process modeling [23,24], and waterlogging control on cultivated land [19,21]. Applying the results of these studies to the practice of irrigation and drainage engineering is challenging. The drainage modulus is one of the important parameters in the design of drainage canal sections and drainage pump stations. However, less attention has been given to the changing trends of the drainage modulus. Investigating changes in the drainage modulus can help guide regional water resource management and the adjustment of cropping structures. The main purposes of this paper are to (1) explore changes in the spatial and temporal distributions of the drainage modulus and to (2) analyze the key environmental elements affecting the drainage modulus.
2. Materials and Methods
2.1. Study Area and Data
2.1.1. Study Area
The Huaibei Plain is located in northern Anhui Province, China on the southern Huang-Huai-hai Plain (114°58′–118°10′ E; 32°45′–34°35′ N) (Figure 1). The total area is approximately 3.74 × 10⁴ km2, and the area of cultivated land is 2.1 × 10⁴ km2 [21]. The Huaibei Plain is an alluvial plain that was formed by the flooding of the Yellow River and the Huaihe River. It is overlain by unconsolidated sediments of the Tertiary and Quaternary periods. The study area is characterized by a subtropical monsoon climate that is hot in the summer and cold in the winter. The mean annual temperature is 14–15 °C and is higher in the south and east than in the north and west. The mean accumulated temperatures ≥ 0 °C ranges from 5300–5600 °C, while that of temperatures ≥ 10 °C is 4800 °C. Approximately 200 to 220 days a year are free from frost. The annual total solar radiation ranges between 5200–5400 MJ/m2, while the annual sunshine hours exceed 2300 h. Annual precipitation is 850 mm, and the rainfall is unevenly distributed over time. Approximately 70% of the annual precipitation occurs from June to August [25]. The mean coefficient of variation for annual precipitation is 0.26. The difference between the maximum and the minimum annual precipitation is over 1150 mm. The mean coefficient of variation of the precipitation during the flood period from June to August is 0.39, with a maximum to minimum ratio of 5.07. Special precipitation characteristics result in frequent floods and droughts, which seriously restrict the agricultural development of the Huaibei Plain. The primary crops cultivated in this region include wheat, corn, peanuts, and sesame. These crops are capable of yielding two harvests per year or three harvests every two years.
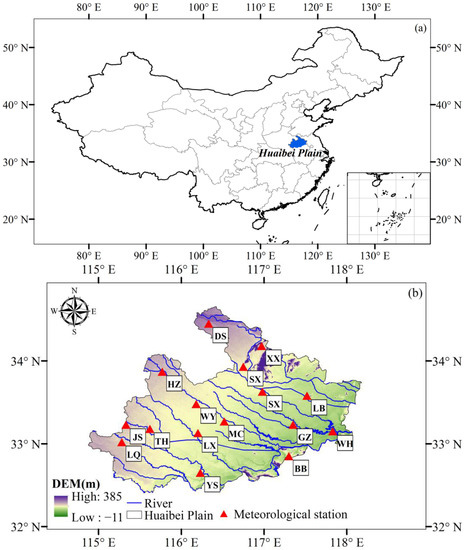
Figure 1.
Location of the Huaibei Plain (a) and its meteorological stations (b).
2.1.2. Datasets
In this paper, daily precipitation data and water surface evaporation (evaporation from an evaporation pan with a diameter of 20 cm) from 16 meteorological stations across the Huaibei Plain during the period of 1960–2017 from the China Meteorological Data Service Centre (http://data.cma.cn/) (accessed on 20 April 2022). The plausibility of the precipitation data was assessed by plotting the daily data for each station [26,27]. For missing data, the average of two adjacent stations was used for interpolation [28,29]. DEM data at a spatial resolution of 90 m × 90 m were obtained from the Resource and Environment Science and Data Centre (https://www.resdc.cn/data.aspx?DATAID=284) (accessed on 20 April 2022). Land use data were extracted from land cover/land use (LUCC) data from the National Tibetan Plateau Data Centre (http://data.tpdc.ac.cn) (accessed on 20 April 2022). The spatial resolution was 1 km × 1 km. There were seven periods of land irrigation data during 1960–2017: 1960–1969, 1970–1979, 1980–1995, 1996–2000, 2001–2005, 2006–2010, and 2010–2017.
2.2. Methods
2.2.1. Calculation of Drainage Modulus
The drainage modulus is the runoff per unit area, which is affected by the design rainstorm, paddy field area, dryland area, water area, and construction land area [13]. In this study, the drainage modulus of the Huaibei Plain was calculated using the average draining method. The equation is shown below:
where qi is the drainage modulus (mm·day−1); ti is the design drainage days; and R is the design runoff depth (mm). According to the existing drainage standards on the Huaibei Plain, a 1-day rainstorm (Rx1day) was selected for 3-day exclusion, and a 3-day rainstorm (Rx3day) was selected for 5-day exclusion to calculate the drainage modulus. Based on these, the design rainstorm and design drainage day used in the calculation of the drainage modulus are shown in Table 1.

Table 1.
The design rainstorm day and drainage days in the drainage modulus calculation.
The design runoff depth was calculated by the area-weighted average of the runoff depth in different land-use types. The equation is shown below:
where R is the design runoff depth (mm); Spf, Sdl, Swb, and Sbl are the areas of paddy fields, dry lands, water bodies, and construction lands, respectively; and Rpf, Rdl, Rwb, and Rbl are the runoff depths of the paddy fields, dry lands, water bodies, and construction lands, respectively.
2.2.2. Mann–Kendall Test
The Mann–Kendall (MK) trend test is a rank-based, non-parametric test; its superiority lies in its ability to test a linear or nonlinear trend. It has been widely applied to evaluate the significance of trends in climatic factors [26,30]. In this study, the Mann–Kendall (MK) trend test was used to analyze the evolution process and the characteristics of Rx1day, Rx3day, and qi in the study area. The equations for the MK test method are provided below:
where Xi is the value of year i; n is the length of the data; and m is the number of groups with tied ranks, each having tied ti observations. If |Z| > Z1−α/2, the null hypothesis was rejected, and the alternative hypothesis was accepted at the significance level of α; otherwise, the null hypothesis of no trend was accepted at the significance level of α. When α = 5% was set as the significance level, the corresponding value of Z1−α/2 was 1.96; when α = 1% was set as the significance level, the corresponding value of Z1−α/2 was 2.58.
2.2.3. Sen’s Slope Estimator
Sen’s slope estimator, which can be used to estimate trend magnitudes, is widely used to estimate the magnitudes of trends of climatic factors [26,31]. In this study, the magnitudes of the trends of Rx1day, Rx3day, and qi were investigated using Sen’s slope estimator.
If β > 0, the time series of Rx1day, Rx3day, qi, and other climatic factors were increasing; otherwise, the time series were decreasing.
2.2.4. Wavelet Analysis
Wavelet analysis is applicable to the analysis of Rx1day, Rx3day, and qi to detect the periodicity of a time series [30]. A discrete signal f(t) with a Morlet wavelet (ψt) in the continuous wavelet transformation is expressed by:
where Wf (a, b) is the transformation coefficient; a and b are the scale and translation parameters, respectively; t is the time scale; ψ* is the complex conjugate; and Var (a) is the wavelet variance and time scale.
2.2.5. Sensitivity Analysis
The sensitivity coefficient is a quantitative parameter that represents the influence degree of the change of drainage modulus when one or several related environmental factors are changed. It is defined as the rate of variation in qi with the environmental factors [26,32]. The equation is shown below:
where Svi is the sensitivity coefficient of vi, Δqi is the variation in qi, vi is an environmental factor, and Δvi is the variation in vi. If Svi > 0, then qi and the environmental factor increased or decreased at the same time; otherwise, they had an opposite relation. The greater |Svi| was, the higher the impact of the change in the environmental factor on qi. To evaluate the influence of an environmental factor on qi, the sensitivity coefficient was divided into four levels, as shown in Table 2.
Table 2.
Classification of the sensitivity coefficient.
2.2.6. Contribution Rate Analysis
The contribution rates of the environmental elements were calculated by multiplying the sensitivity coefficient by its relative change rate [26,33]. The equations of the contribution rate of environmental factors are as follows:
where Convi is the contribution rate of vi, RCvi is the relative change rate in vi, n is the number of years, avi is the mean value of vi, and Trendvi is the annual trend in v. If the contribution rate > 0, then the change in the factor increased qi, which meant that the factor had a positive contribution to the variation in qi. If the contribution rate < 0, then the change in the factor decreased qi, and the factor had a negative contribution.
3. Results
3.1. Temporal Variation in Annual Maximum 1-Day and 3-Day Precipitation Amounts
The change trends of Rx1day and Rx3day in the Huaibei Plain are shown in Table 3 and Figure 2. The MK test showed increasing trends in Rx1day and Rx3day, with rates of increase of 0.2 mm·10 a−1 and 0.8 mm·10 a−1, respectively. The minimum value of Rx1day was 67.11 mm, which occurred in 1994, and the maximum value was 159.44 mm, which occurred in 1972. For Rx3day, the minimum value was 92.64 mm, which occurred in 1993, and the maximum value was 227.86 mm, which occurred in 2005.
Table 3.
The results of the MK test and Sen’s slope estimator for Rx1day and Rx3day. Values exceeding 1.96 represent upward significant trends, whereas those less than −1.96 represent decreasing trends at α < 0.05.
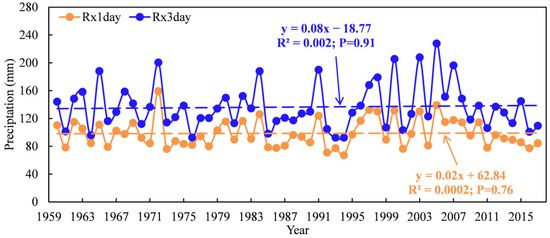
Figure 2.
Change trends of Rx1day and Rx3day during 1960–2017.
For Rx1day, 25% of the sites showed decreasing trends, and the rate of decrease ranged from 0.74 mm·10 a−1 to 4.62 mm·10 a−1. Seventy-five percent of the sites showed increasing trends, and the rate of increase ranged from 0.71 mm·10 a−1 to 3.43 mm·10 a−1. For Rx3day, 37.5% of the sites showed decreasing trends, and the rate of decrease ranged from 0.27 mm·10 a−1 to 6.50 mm·10 a−1. A total of 62.5% of the sites showed increasing trends, and the rate of increase ranged from 0.38 mm·10 a−1 to 4.65 mm·10 a−1.
Figure 3 displays the spatial distributions of the MK test results for Rx1day and Rx3day. For Rx1day, four sites exhibited decreasing trends, which were localized in the northeast and southwest parts. Twelve sites, which were spread throughout the plain, exhibited increasing trends. For Rx3day, six sites exhibited decreasing trends, which were localized in the northeast, southeast, and southwest parts. Ten sites, which were spread throughout the plain, exhibited increasing trends.
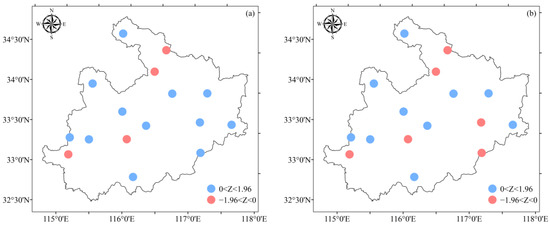
Figure 3.
Trends of Rx1day (a) and Rx3day (b) at different sites. Z > 1.96 and Z < −1.96 exceeded the 95% confidence level; −1.96 < Z < 1.96 did not exceed the 95% confidence level.
3.2. Temporal Variability of Drainage Modulus
The change trends of the drainage modulus on the Huaibei Plain are shown in Table 4 and Figure 4. Overall, the MK test showed increasing trends in q1 and q3, and the rates of increase were 0.345 mm·day−1·10 a−1 and 0.346 mm·day−1·10 a−1, respectively. The minimum value of q1 was 11.837 mm·day−1, which occurred in 1994, and the maximum value was 41.731 mm·day−1, which occurred in 1972. For q3, the minimum value was 11.837 mm·day−1, which occurred in 1994, and the maximum value was 37.843 mm·day−1, which occurred in 2005.
Table 4.
The results of the MK test and Sen’s slope estimator for q1 and q3. Values exceeding 1.96 represent upward significant trends, whereas those less than −1.96 represent decreasing trends at α < 0.05.
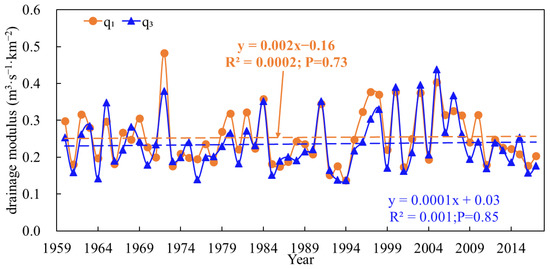
Figure 4.
Change trends of q1 and q3 during the years 1960−2017.
The trends in q1 and q3 varied among different sites with different microclimatic characteristics. Among the sites, 23.5% (q1) and 29.4% (q3) showed decreasing trends, and 76.5% (q1) and 70.6% (q3) showed increasing trends. For q1, the rate of increase ranged from −14.774 mm·day−1·10 a−1 to 10.368 mm·day−1·10 a−1. For q3, the rate of increase ranged from −12.182 mm·day−1·10 a−1 to 9.331 mm·day−1·10 a−1.
Figure 5 displays the spatial distributions of the MK test results on q1 and q3. For q1, four sites exhibited decreasing trends, which were localized in the northeast and southwest parts. Twelve sites, which were spread throughout the plain, exhibited increasing trends. For q3, five sites exhibited decreasing trends, which were localized in the northeast, southeast, and southwest parts. Eleven sites, which were spread throughout the plain, exhibited increasing trends.
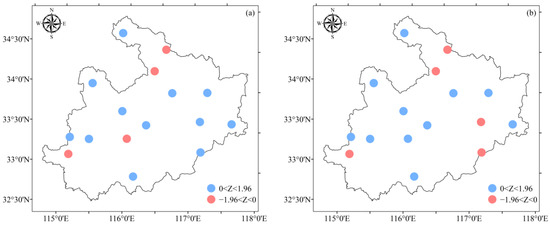
Figure 5.
Trends in the drainage modulus at different sites. (a) q1. (b) q3. Z > 1.96 and Z < −1.96 exceeded the 95% confidence level; −1.96 < Z < 1.96 did not exceed the 95% confidence level.
3.3. Periodic Variation in the Drainage Modulus
The Morlet wavelet can reveal the periodicity of the high and low indices of the drainage modulus and was used to analyze the phase change and the periodic intensity at different time scales [30,34]. The wavelet variances, wavelet coefficients, and significant time sections of the drainage modulus were obtained using a Morlet wavelet function and are shown in Figure 6 and Figure 7. The wavelet variances of the high and low indices for q1 and q3 had significant 2.4-year and 2.5-year periodicities, respectively, on the basis of a chi-square test at a confidence level of 95%. In addition, there were also main periods of 8.4 years and 12.5 years for q1 and 7.9 years, 19.7 years, and 32.5 years for q3, which did not pass the 95% confidence level.
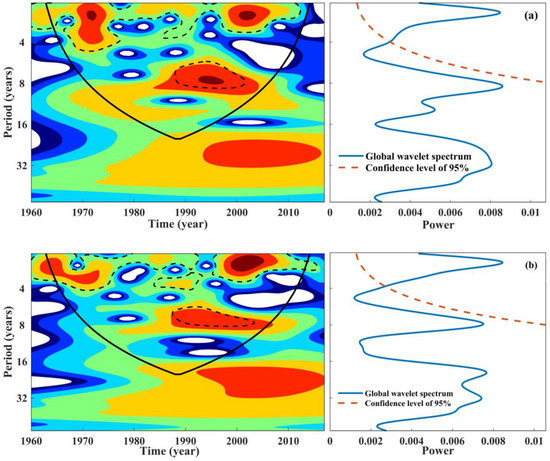
Figure 6.
Wavelet analyses of the drainage modulus during the study period. (a) q1; (b) q3. The black solid line represents the wavelet influence cone, the black contoured dashed line depicts the 5% significance level relative to the red noise, and the significance level red solid line is the red noise test with a 95% confidence level. The more the color is biased toward dark red, the higher the power and the higher the cycle intensity. Other colors indicate a lower in power and cycle intensity.
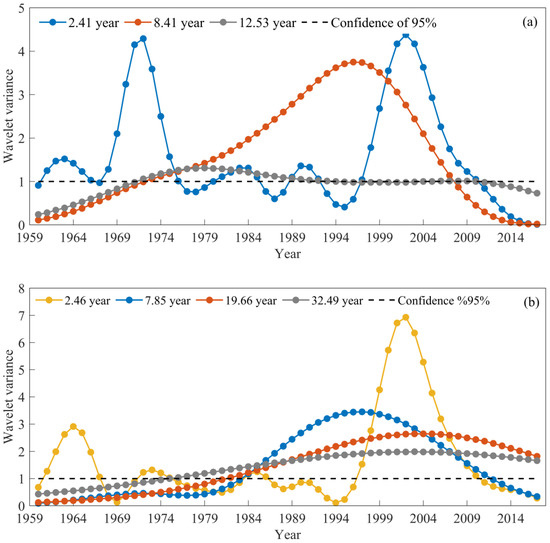
Figure 7.
Wavelet analyses of the drainage modulus during the study period. (a) q1; (b) q3.
According to the wavelet red-noise test at a confidence level of 95%, the most significant periodic fluctuation of q1 had a 2.4-year period and occurred during 1961~1975 and 1997~2010, and the most significant periodic fluctuation for q3 was a 2.5-year period and occurred during 1961~1966, 1972~1974, and 1997~2010 (Figure 7). For q1, significant periodic fluctuations of 8.4 years and 12.5 years occurred during 1973~2007 and 1972~1992, respectively. For q3, significant periodic fluctuations of 7.9 years, 19.7 years, and 32.5 years occurred during 1984~2011, 1983~2017, and 1976~2017, respectively (Figure 7).
3.4. Environmental Factors That Affect Drainage Modulus Variability
Environmental factors, such as the areas of paddy land, dryland, water bodies, building lots, and precipitation, represent important input data for calculating the drainage modulus, and changes in these elements have important impacts on the drainage modulus. To analyze the effects of environmental factors, sensitivity analysis and contribution rate analysis were performed.
The results of the sensitivity analysis showed that the average q1 and q3 over the whole plain were most sensitive to Rx1day and Rx3day, followed by Sdl, Sbl, Spf, and Swb; the sensitivity coefficients were 1.81, 0.68, 0.30, 0.01, and 0.0 for q1 and 1.71, 0.74, 0.23, 0.02, and 0.0 for q3, respectively (Table 5). These results showed that precipitation, dryland area, and building lots had important effects on the drainage modulus.
Table 5.
The sensitivity coefficients between the drainage modulus and environmental factors.
The results of the contribution rate analysis suggested that over the whole plain, increases in Rx1day, Rx3day, and Sbl positively contributed to an increase in the drainage modulus. In addition, decreases in Spf and Sdl negatively contributed to an increase in the drainage modulus. Because the total positive contribution was greater than the total negative contribution, the drainage modulus generally increased from 1960 to 2017 (Table 6). Because the absolute value of the contribution of Sbl was greater than those of other factors, Sbl was the main factor that influenced the variability in the drainage modulus. On the Huaibei Plain, there has been an increasing trend in the proportion of construction lands and a decreasing trend in that of paddy fields and dry fields, while the proportion of water bodies has remained unchanged (Figure 8). These results suggested that rapid urbanization increased the risk of agricultural waterlogging.
Table 6.
Contribution rates of environmental factors to the drainage modulus.
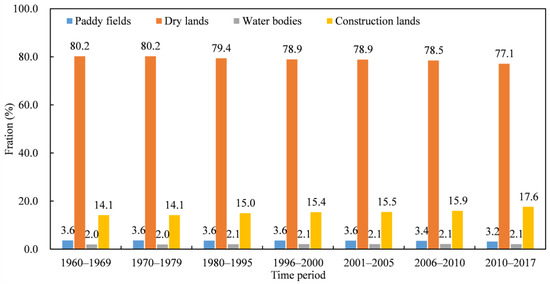
Figure 8.
The distribution of paddy fields, dry fields, water bodies, and construction lands during different time periods in the Huaibei Plain.
4. Discussion
4.1. Drainage Modulus and Farmland Water Management
The drainage modulus is an important index in the design of field drainage systems, and its value directly affects the implementation of and investment in field drainage projects [35,36]. Furthermore, changes in the drainage modulus impact the effectiveness of a drainage project and thus affect agricultural production [12]. In the study area, the drainage modulus (q1, q3) was significantly positively correlated with the agricultural disaster area (Figure 9). These results indicate that the agricultural disaster area increased with an increasing drainage modulus.
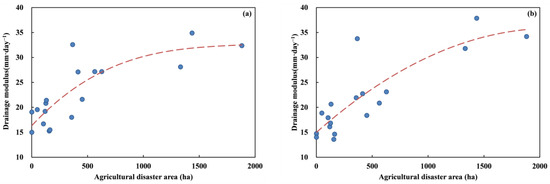
Figure 9.
Relationship between the drainage modulus and the agricultural disaster area. (a) q1. (b) q3.
The results of the study showed that the drainage modulus had an increasing trend in the whole plain. The findings indicate that waterlogging continues to pose a threat to agricultural production across the entire plain. For q1 and q3, the sites with decreasing trends were localized in the northeast, southwest, and southest. These results suggest that in these areas, the impact of waterlogging on agricultural production has decreased. The sites with increasing trends were spread throughout the plain. These results suggest that in most parts of the Huaibei Plain, agricultural production is still threatened by waterlogging, and drainage engineering of farmland is necessary for grain production in these regions.
4.2. Environmental Factors That Affect the Drainage Modulus
The drainage modulus is the runoff per unit area, which is affected by the design rainstorm, paddy field area, dryland area, water area, and construction land area [37,38]. Previous studies have shown that increasing design rainstorms, paddy field areas, dryland areas, and construction land areas positively contribute to the drainage modulus [38,39,40]. The results obtained in the present study are consistent with those of previous studies. In this study, the sensitivity coefficient between the design rainstorm; Spl, Sdl, and Sbl; and the drainage modulus was greater than zero. Luo, Wang, Luo and Zhang [13] reported that with increasing water area, the drainage modulus decreased. However, in this study, the sensitivity coefficient between the water area and the drainage modulus was zero. This may have been because there was a lower water level before precipitation began during the flood season, which led to no runoff production during the study.
The driving mechanism of the drainage modulus is complex, and the driving factors are not independent but, rather interrelated [39,41,42]. In this study, the sensitivity analysis indicated that the largest absolute value of the sensitivity coefficient was between the design rainstorm and the drainage modulus. Design rainstorms might be the most sensitive variables influencing the drainage modulus. The absolute values of the sensitivity coefficient of Sdl and the drainage modulus and of Sbl and the drainage modulus were the second and third largest variables, respectively. Sdl and Sbl might be the second and third most influential factors affecting the drainage modulus. Although the design rainstorm was the most sensitive variable influencing the drainage modulus, the contribution rate analysis suggested that the absolute value of the contribution of Sbl was greater than those of the other elements, indicating that Sbl was the main factor that induced changes in the drainage modulus. Rapid urbanization has caused large areas of natural vegetation and agricultural land to be replaced by residential buildings, roads, commercial land, and factories, which has increased the impervious area, hindered the infiltration of rainwater, reduced groundwater recharge and base flow, and increased the surface runoff and total runoff [13,43,44]. To effectively address these changes, the sponge city strategy has been proposed as an efficient engineering measure to address urban waterlogging. However, our research primarily focused on the variability of the drainage modulus due to environmental factors rather than investigating the impact of the sponge city strategy on the farmland drainage modulus.
5. Conclusions
In this study, the drainage modulus was estimated using the average draining method at 16 meteorological stations located in different areas of the Huaibei Plain. The MK method and Sen’s slope estimator were used to study the spatiotemporal distribution of the drainage modulus. In addition, a wavelet transform was applied to investigate the periodic trends in the drainage modulus, and the contribution rate method was used to identify the causes of drainage modulus changes. The following conclusions were drawn from this study.
The mean maximum 1-day and 3-day precipitation amounts had significant increasing trends. The rates of increase of Rx1day and Rx3day were 0.2 mm·10 a−1 and 0.8 mm·10 a−1, respectively. The mean drainage modulus had significant increasing trends. The rates of increase of q1 and q3 were 0.345 mm·day−1·10 a−1 and 0.346 mm·day−1·10 a−1, respectively. The significant wavelet power spectra of q1 and q3 were very similar, and the significant wavelet power spectra of q1 and q3 had significant 2.4-year and 2.5-year periodicities, respectively. The sensitivity analysis showed that the average q1 and q3 values were most sensitive to Rx1day and Rx3day, followed by areas of dryland, building lots, fields, and water bodies. However, the contribution rate analysis suggested that building lots were the main factor influencing the variability in the drainage modulus. Rapid urbanization increased the risk of agricultural waterlogging.
Author Contributions
Writing—original draft, Y.T.; writing—review and editing H.W.; writing—review and editing Y.W. All authors have read and agreed to the published version of the manuscript.
Funding
This study was supported by the National Natural Science Foundation of China (52009118), the project of the State Key Laboratory of Cryospheric Science (SKLCS-ZZ-2023, SKLCS-OP-2021-11), and the Postgraduate Research and Practice Innovation Program of Jiangsu Province (SJCX22_1762).
Institutional Review Board Statement
Not applicable.
Informed Consent Statement
Not applicable.
Data Availability Statement
Not applicable.
Acknowledgments
The authors would like to thank the editors and the anonymous reviewers for their crucial comments, which improved the quality of this paper.
Conflicts of Interest
The authors declare that they have no known competing financial interest or personal relationship that could have appeared to influence the work reported in this paper.
References
- Kaur, G.; Vikal, Y.; Kaur, L.; Kalia, A.; Mittal, A.; Kaur, D.; Yadav, I. Elucidating the morpho-physiological adaptations and molecular responses under long-term waterlogging stress in maize through gene expression analysis. Plant Sci. 2021, 304, 110823. [Google Scholar] [CrossRef]
- Liu, C.; Li, K.; Zhang, J.; Guga, S.; Wang, R.; Liu, X.; Tong, Z. Dynamic risk assessment of waterlogging disaster to spring peanut (Arachis hypogaea L.) in Henan Province, China. Agric. Water Manag. 2023, 277, 108094. [Google Scholar] [CrossRef]
- Liu, K.; Harrison, M.; Yan, H.; Meinke, H.; Wang, B.; Peng, B.; Guan, K.; Jägermeyr, J.; Wang, E.; Zhang, F.; et al. Silver lining to a climate crisis in multiple prospects for alleviating crop waterlogging under future climates. Nat. Commun. 2023, 14, 765. [Google Scholar] [CrossRef] [PubMed]
- Yan, H.; Harrison, M.; Liu, K.; Wang, B.; Feng, P.; Fahad, S.; Meinke, H.; Yang, R.; Archontoulis, S.; Huber, I.; et al. Crop traits enabling yield gains under more frequent extreme climatic events. Sci. Total Environ. 2021, 808, 152170. [Google Scholar] [CrossRef] [PubMed]
- Setter, T.L.; Waters, I. Review of prospects for germplasm improvement for waterlogging tolerance in wheat, barley and oats. Plant Soil 2003, 253, 1–34. [Google Scholar] [CrossRef]
- Feng, G. Irrigation and Drainage in China; China WaterPower Press: Beijing, China, 2005. [Google Scholar]
- Wang, S.; Xu, D.; Chen, H.; Han, S.; Jiao, P. Review on research of farmland drainage technology. J. Drain. Irrig. Mach. Eng. 2014, 32, 7. [Google Scholar]
- Jin, H.; Chen, X.; Zhong, R.; Duan, K. Frequency analysis of extreme precipitation in different regions of the Huaihe River Basin. Int. J. Climatol. 2021, 42, 3517–3536. [Google Scholar] [CrossRef]
- Wu, H.; Wang, X.; Xu, M.; Zhang, J. The Effect of Water Deficit and Waterlogging on the Yield Components of Cotton. Crop. Sci. 2018, 58, 1751–1761. [Google Scholar] [CrossRef]
- Singh, A. Soil salinization and waterlogging: A threat to environment and agricultural sustainability. Ecol. Indic. 2015, 57, 128–130. [Google Scholar] [CrossRef]
- Jin, M.; Lancia, M.; Tian, Y.; Viaroli, S.; Andrews, C.; Liu, J.; Zheng, C. Hydrogeological Criteria to Improve the Sponge City Strategy of China. Front. Environ. Sci. 2021, 9, 700463. [Google Scholar] [CrossRef]
- Luo, W.; Wang, X.; Luo, Q. Comparison of methods for calculating farmland drainage modulus. Trans. Chin. Soc. Agric. Eng. 2013, 29, 7. [Google Scholar]
- Luo, W.; Wang, X.; Luo, Q.; Zhang, X. Effects of underlying surface changes on drainage modulus in Four-lake Watershed. Adv. Water Sci. 2014, 25, 7. [Google Scholar] [CrossRef]
- El-Sadek, A.; Feyen, J.; Berlamont, J. Comparison of Models for Computing Drainage Discharge. Irrig. Drain. Eng. 2001, 127, 363–369. [Google Scholar] [CrossRef]
- Arnold, J.; Williams, J.; Maidment, D. A Continuous Time Water and Sediment Routing Model for Large Basins. J. Hydraul. Eng. -Asce 1995, 121, 171–183. [Google Scholar] [CrossRef]
- You, L.; Wang, S.; Tao, Y.; Liu, Y. Appropriate Method to Estimate Farmland Drainage Coefficient in the Wanyan River Surface Waterlogged Area in Suibin County of the Sanjiang Plain, China. Appl. Sci. 2023, 13, 2769. [Google Scholar] [CrossRef]
- Chen, X.; Guo, L.; Guan, G.; Zhang, Y.; Jia, B. Research and Improvement of the Theoretical Model of Drainage Modulus in the Plain Mixed Area. China Rural. Water Hydropower 2018, 12, 8–12. [Google Scholar]
- Ding, J.Y. A measure of watershed nonlinearity: Interpreting a variable instantaneous unit hydrograph model on two vastly different sized watersheds. Hydrol. Earth Syst. Sci. 2011, 15, 405–423. [Google Scholar] [CrossRef]
- Tao, Y.; Wang, S.; Xu, D.; Yuan, H.; Chen, H. Field and numerical experiment of an improved subsurface drainage system in Huaibei plain. Agric. Water Manag. 2017, 194, 24–32. [Google Scholar] [CrossRef]
- Gou, Q.; Zhu, Y.; Horton, R.; Lü, H.; Wang, Z.; Su, J.; Cui, C.; Zhang, H.; Wang, X.; Zheng, J.; et al. Effect of climate change on the contribution of groundwater to the root zone of winter wheat in the Huaibei Plain of China. Agric. Water Manag. 2020, 240, 106292. [Google Scholar] [CrossRef]
- Yuan, X.; Zhang, X.-C.; Wang, X.-G.; Zhang, Y. Flood disaster monitoring based on Sentinel-1 data: A case study of Sihu Basin and Huaibei Plain, China. Water Sci. Eng. 2021, 14, 87–96. [Google Scholar] [CrossRef]
- Wang, Y. Controling of Waterlogging in Huaihe River Basin; Science Press: Beijing, China, 2015. [Google Scholar]
- Cheng, X.; Zhao, J.; Zhang, H.; Wang, K.; Xu, M. Numerical Simulation of Land Surface Hydrological Process Over Huaihe River Basin. Procedia Eng. 2016, 154, 1064–1070. [Google Scholar] [CrossRef]
- Ju, Q.; Hu, Y.; Liu, Q.; Liu, Y.; Hu, T. Key hydrological process of a multiple aquifer flow system in the mining area of Huaibei plain, Eastern China. Appl. Geochem. 2022, 140, 105270. [Google Scholar] [CrossRef]
- Li, D.; Qi, H.; Ma, X. The Climate Index and Assessment about Drought and Flood in Maize’s Key Growth Stage in Huaibei Plain in Anhui Province. Chin. Agric. Sci. Bull. 2013, 29, 9. [Google Scholar]
- Wu, H.; Wang, X.; Wang, Y.; Xu, Y.; Han, X. Temporal variations in reference evapotranspiration in Hubei Province, China, from 1960 to 2014. Theor. Appl. Climatol. 2018, 135, 433–448. [Google Scholar] [CrossRef]
- Kousari, M.R.; Asadi Zarch, M.A.; Ahani, H.; Hakimelahi, H. A survey of temporal and spatial reference crop evapotranspiration trends in Iran from 1960 to 2005. Clim. Chang. 2013, 120, 277–298. [Google Scholar] [CrossRef]
- Wang, Y.; Peng, Z.; Wu, H.; Wang, P. Spatiotemporal Variability in Precipitation Extremes in the Jianghuai Region of China and the Analysis of Its Circulation Features. Sustainability 2022, 14, 6680. [Google Scholar] [CrossRef]
- Li, X.; Wang, X.; Babovic, V. Analysis of variability and trends of precipitation extremes in Singapore during 1980–2013. Int. J. Climatol. 2018, 38, 125–141. [Google Scholar] [CrossRef]
- Xu, M.; Kang, S.; Wu, H.; Yuan, X. Detection of spatio-temporal variability of air temperature and precipitation based on long-term meteorological station observations over Tianshan Mountains, Central Asia. Atmos. Res. 2018, 203, 141–163. [Google Scholar] [CrossRef]
- Liu, T.; Li, L.; Lai, J.; Liu, C.; Zhuang, W. Reference evapotranspiration change and its sensitivity to climate variables in southwest China. Theor. Appl. Climatol. 2015, 125, 499–508. [Google Scholar] [CrossRef]
- Li, C.; Wu, P.T.; Li, X.L.; Zhou, T.W.; Sun, S.K.; Wang, Y.B.; Luan, X.B.; Yu, X. Spatial and temporal evolution of climatic factors and its impacts on potential evapotranspiration in Loess Plateau of Northern Shaanxi, China. Sci. Total Environ. 2017, 589, 165–172. [Google Scholar] [CrossRef]
- Yin, Y.; Wu, S.; Chen, G.; Dai, E. Attribution analyses of potential evapotranspiration changes in China since the 1960s. Theor. Appl. Climatol. 2010, 101, 19–28. [Google Scholar] [CrossRef]
- Ling, H.; Xu, H.; Fu, J. High- and low-flow variations in annual runoff and their response to climate change in the headstreams of the Tarim River, Xinjiang, China. Hydrol. Process. 2013, 27, 975–988. [Google Scholar] [CrossRef]
- Li, N.; Wang, X.; Luo, Q.; Wang, S.; Ke, Z. Using SWAT and CLUE-S Models to Evaluate the Effect of Land Use on Drainage Modules. J. Irrig. Drain. 2019, 38, 8. [Google Scholar] [CrossRef]
- Xiao, J.; Luo, Q.; Wang, X.; Luo, W.; Zhang, C. Impact of urbanization on drainage modulus in tidal river networks. Trans. Chin. Soc. Agric. Eng. Ransactions CSAE 2014, 30, 9. [Google Scholar] [CrossRef]
- Zhao, J.; Zhang, J.; Hu, Y.; Li, Y.; Tang, P.; Gusarov, A.V.; Yu, Y. Effects of land uses and rainfall regimes on surface runoff and sediment yield in a nested watershed of the Loess Plateau, China. J. Hydrol. Reg. Stud. 2022, 44, 101277. [Google Scholar] [CrossRef]
- Mfwango, L.H.; Kisiki, C.P.; Ayenew, T.; Mahoo, H.F. The impact of land use/cover change on surface runoff at Kibungo sub-catchment of Upper Ruvu catchment in Tanzania. Environ. Chall. 2022, 7, 100466. [Google Scholar] [CrossRef]
- Ma, K.; Huang, X.; Liang, C.; Zhao, H.; Zhou, X.; Wei, X. Effect of land use/cover changes on runoff in the Min River watershed. River Res. Appl. 2020, 36, 749–759. [Google Scholar] [CrossRef]
- Wang, H.; Stephenson, S.R. Quantifying the impacts of climate change and land use/cover change on runoff in the lower Connecticut River Basin. Hydrol. Process. 2018, 32, 1301–1312. [Google Scholar] [CrossRef]
- He, X.; Liang, J.; Zeng, G.; Yuan, Y.; Li, X. The Effects of Interaction between Climate Change and Land-Use/Cover Change on Biodiversity-Related Ecosystem Services. Glob. Chall. 2019, 3, 1800095. [Google Scholar] [CrossRef]
- Wang, F.; Duan, K.; Fu, S.; Gou, F.; Liang, W.; Yan, J.; Zhang, W. Partitioning climate and human contributions to changes in mean annual streamflow based on the Budyko complementary relationship in the Loess Plateau, China. Sci. Total Environ. 2019, 665, 579–590. [Google Scholar] [CrossRef]
- Ramezani, M.R.; Helfer, F.; Yu, B. Individual and combined impacts of urbanization and climate change on catchment runoff in Southeast Queensland, Australia. Sci. Total Environ. 2023, 861, 160528. [Google Scholar] [CrossRef] [PubMed]
- Huq, E.; Abdul-Aziz, O.I. Climate and land cover change impacts on stormwater runoff in large-scale coastal-urban environments. Sci. Total Environ. 2021, 778, 146017. [Google Scholar] [CrossRef] [PubMed]


Disclaimer/Publisher’s Note: The statements, opinions and data contained in all publications are solely those of the individual author(s) and contributor(s) and not of MDPI and/or the editor(s). MDPI and/or the editor(s) disclaim responsibility for any injury to people or property resulting from any ideas, methods, instructions or products referred to in the content. |
© 2023 by the authors. Licensee MDPI, Basel, Switzerland. This article is an open access article distributed under the terms and conditions of the Creative Commons Attribution (CC BY) license (https://creativecommons.org/licenses/by/4.0/).