1. Introduction
In general, it is true that management, especially the management of human resources in connection with high-quality motivation, is key to the success of business entities. Emphasis must be placed on the proper motivation of workers because each worker affects productivity and market position with their share. The correct management of the given area stimulates and motivates the employee to higher performance, which ensures a better result for the business entity, its sustainability, and the satisfaction of the employees around it. It is true that the sustainable development goals serve as a measure of progress in sustainability, focusing on five main areas: people, planet, prosperity, partnerships, and peace. In the context of the topic, people play an important role because their actions are decisive not only in personal, but also in working life. They are irreplaceable. It is quite difficult to properly understand how to motivate workers, because each job requires a different approach, and each worker is different and unique, thus considering a different element as a personal stimulus that drives them “forwards”. Behind the right motivation are several tools that need to be aligned to achieve the right effect. It is not only monetary incentives that give the employee the strength and will to work at the workplace and fulfil the tasks and goals entrusted to them. A manager, as a person who is characterised by high-quality skills in their field and a positive personality and communication skills, must understand the given facts to become a natural authority for each employee and, at the same time, a motivator for the continuous improvement of the performance of each subordinate worker. Motivation is considered one of the most important prerequisites for the success and efficiency of the resulting performance of business entities. Therefore, the important task of every manager is to constantly create new and individual incentives so that workers are always motivated.
In addition to the already mentioned fact that each employee is motivated by something different, motivational processes must correspond to the fact that the perspective of employee motivation is not only the company’s internal environment. The motivation of employees is also influenced by the external environment, i.e., the macroenvironment. If the motivational system in the company is guided in the wrong direction, it can lead to low performance, low productivity, high turnover, employee dissatisfaction, and failure to meet the company’s set goals. With an emphasis on the importance of this determinant of competitiveness, the aim of the contribution is to reveal important aspects of the motivational policies of selected manufacturing companies operating in Slovakia. In the paper, we work with four hypotheses, within which we examine the dependence between the selected variables and employee satisfaction with the incentive policy. The variables that we examine in connection with satisfaction are sufficient financial compensation and the employee’s job position. Furthermore, we examine whether there is a statistically significant dependence between the variables gender and sufficient financial compensation and, on the other hand, the dependence between the variables employee motivation and feedback from the superior. Theoretical–empirical scientific methods were used in the processing of the research subject. In addition to explanatory methods, there are also interpretive methods. In the first step, we worked with theoretical methods, especially when conceiving knowledge from literary sources. Subsequently, we used empirical scientific methods that work with concrete and precise data. According to the obtained results, we outlined recommendations for improving the motivational policy in favour of increasing the level of motivation. The first part of the paper is focused on a review of the literature and findings from the research of authors who have addressed this issue. In the literature search, we focus on the emergence and development of motivation. We introduce the founders and important personalities of work motivation and bring the issue of employee motivation closer to light in contemporary foreign and Slovak literature. In the next section, we carry out a questionnaire survey, evaluate the answers, and establish hypotheses. Individual dependencies between categorical characters are determined using the chi-square test of independence. The last section presents proposals for improving motivational policies in selected manufacturing enterprises that result from the findings of the research.
Review of the Literature
The word motivation comes from the Latin word movere, which literally means to move something. Thus, motive generally means something that sets things in motion [
1]. The meaning of motivation is the unforced creation of a positive attitude towards something, often towards some performance or type of behaviour. Motivation usually refers to some process and its result, as well as the fact that something concrete happens or exists [
2]. Understanding the issue of motivation is necessary when creating opportunities to act on the structure of motives. Knowing this structure is the basis for understanding the sources of motivation and the facts that influence whether a person asks for or refuses something, why some people desire something more, and why some areas arouse more interest in some than in others [
3]. The authors in [
4] characterised the very concept of motivation as a set of factors, representing the internal driving forces of a person’s activity, which guide their behaviour and experience. Motivation forms a dynamic side, tries to also continue the psychological side, integrates into a single whole, and represents the driving force of a person towards their set goal. Thus, motivation includes effort, persistence, and goals [
5]. The authors in [
6] stated that it is an internal state of a person that is driven by desires, wishes, and ideas, which causes a certain behaviour or activity in that person. Motivation is future-oriented and includes individual effort, persistence, and dedication [
7]. Maslow’s hierarchy of needs model is a common mainstream model in the human resource management literature and is related to employee motivation and their needs [
8]. Maslow discovered that human needs are arranged in a hierarchy. This means that discovering one need usually entails satisfying another, previous level. Thus, no need can be treated as isolated or discrete; each shift between levels of needs is related to the state of satisfaction or dissatisfaction with the previous level of needs. The authors in [
9] also identified the principle of Maslow’s pyramid of needs, confirming that human needs are not satisfied at the same time, but proceed at individual levels.
The authors in [
10] defined motivation as an impulse to behaviour that aims to achieve a certain goal. If employees are well motivated, they have clearly defined goals and take steps to help them achieve these goals. Such people can motivate themselves. The authors in [
11] looked for the relationship between managers and employees when defining motivation. Employee motivation, they claimed, is a systematic process in which the managers constantly stimulate the intrinsic motivation of their subordinates by identifying and implementing approaches, tools, and measures that help workers satisfy their needs and goals. The authors in [
12] added that this is the main factor that connects the company’s goals and strategies. In order to know what works for employees, it is necessary to try several motivational strategies and implement the one that works successfully for them and changes their behaviour in the workplace. Effective motivation will lead to higher work productivity and improved work quality within departments and society [
13]. This definition was supplemented by the authors in [
14], who stated that employees do not need much to be motivated and satisfied. However, the company must strive to keep employees constantly motivated, which it achieves through regular performance monitoring and evaluation. In [
15], the authors stated that the motivation of employees represents a kind of willingness on their part to perform the agreed work, realise the strategic goals of the company, and achieve the required performance. According to [
16], it is important in management to recognise the point at which no one can motivate people, but it is possible to influence what these people are motivated to do. The authors in [
17] proved in their study that the motivation and satisfaction of employees change with increasing age. In this way, managers are constantly developing measures that contribute to better performance at the workplace, better working relationships with colleagues, higher productivity, and greater creativity. This idea was also supported by the authors in [
18] who argued that it is crucial to understand age-related changes in work motivation. According to them, the stereotyped beliefs of older employees reduce their motivation, productivity, and abilities. In [
19], the authors found that the level of work motivation is high among employees who have a university degree, hold higher positions at work, and are given more challenging tasks. The level of motivation decreases with less educated employees. The authors in [
20] reported significant differences between women’s and men’s motivation in the workplace, comparing workers with the same educational attainment, age, and family background. From the conclusion of their study, men are more driven by factors such as wealth and wellbeing, while women look for more flexible work and adapt to family. Work motivation represents the employee’s willingness to make efforts to achieve the company’s goals, while this action is conditioned by the ability to satisfy one’s own individual needs [
21]. A study by the authors in [
22] pointed to the fact that the awarding of rewards to employees represents a very significant factor through which it is possible to motivate employees to higher performance and, at the same time, comply with the rules. The authors in [
23] agreed with this opinion, stating that remuneration has a significant and positive impact on employee performance. This statement was also confirmed by the research of [
24], where the authors concluded that an employee’s remuneration shows a positive correlation with their performance. Several authors identified with the opinion that the more motivated employees are, the more they will demonstrate their motivation and perform better [
25,
26]. Failure and a decline in work performance occur when employees do not feel engaged and committed to their work [
27,
28]. The authors in [
29] carried out research in which they dealt with the role of employees in the company, as well as their internal and external motivation. The result of their study was the finding that intrinsic motivation and extrinsic motivation are the main motivators for employees. For the purposes of motivation, it is possible to use various tools used in the field of human resources [
30]. A wide range of tools can be used to motivate employees. Taylor defined money as the most important factor motivating employees to achieve higher productivity in industry [
31]. This form of remuneration results in employee satisfaction and directly affects their performance. Salary is a valuable tool that plays an important role in improving employee performance, as well as company productivity [
32]. Studies by several authors [
33,
34,
35,
36] have shown that salary, promotion, bonuses, and other types of rewards are used by most businesses to improve employee performance. Praise, setting realistic and achievable goals, appropriate definition of workload, employee engagement, adequate empowerment, responsibility, feedback, work equipment, expression of positive personality traits of the superior, appropriate leadership style, correctness on the part of senior employees and the company, and provision of relevant information can be considered for a complex of other motivational elements [
37,
38,
39,
40,
41]. The task of corporate management is to define motivational factors that serve to effectively manage and lead employees.
In Slovakia, several authors are devoted to motivation; they define motivation as an intrapsychic process, explaining the reasons for human behaviour in a subjectively evaluated situation [
42,
43]. The authors in [
44] proved that, as long as we have sufficient and good motivation, it is a suitable prerequisite for the implementation of our decisions, and it is possible to develop them in the same way that we can awaken the energy in ourselves to take challenging steps. To persevere on this sometimes difficult path to the goal, a person must learn to work with themself, and to be able to encourage, praise, or otherwise appreciate themself. The authors in [
45] claimed that motivation explains all the mechanisms and procedures that explain employee behaviour. It is, therefore, an internal system of forces and personality–physiological tensions that lead an individual to specific behaviours. Under the term “motivation”, we can simply imagine those force processes inside the organism that cause a person to act and in which direction they act [
45,
46]. In this context, it is necessary to consider the fact that every employee is different, has different needs, and is motivated by something different [
47].
Various studies have been a stimulating source for gaining an overview of how motivational factors affect employees in the conditions of the Slovak Republic. As already mentioned, the authors in [
42] assumed in their research that the motivation of employees of different genders, ages, and job positions will differ. The assumptions were confirmed by the results achieved in the research, which showed significant differences between the individual employment categories of managers, blue-collar workers, and white-collar workers. Considering the results, managers are advised to focus on motivating employees as parts and not as a whole due to differences in the needs of employees in terms of gender, age, and especially job position. In another study [
42], the authors addressed the issue of the influence of the average annual salary and household debt on the most important motivational factors of employees. On the basis of the findings, the authors could conclude that macroeconomic indicators influence the importance of motivational factors in Slovakia. Six motivational factors (communication at the workplace, responsibilities, and type of work, working hours, working environment, superior attitude, and psychological burden) significantly influence the average annual salary. The results of the research also showed that seven motivational factors (atmosphere at the workplace, a good team, communication at the workplace, working hours, the working environment, a superior approach, and psychological burden) strongly depend on the macroeconomic indicator of household indebtedness. Therefore, when creating incentive programs, business managers in Slovakia should consider not only the effects of the company’s microenvironment on motivation but also the effects of the macroenvironment and, thus, macroeconomic changes in the state. The manager’s task is to maintain a balance between the influence of the external environment on employee motivation and internal actions.
There is a whole spectrum of definitions of motivation. Other words may be used or expressed differently. However, what they have in common is the content. They are also united by the claim that it is a psychological process that affects feelings and directs a person’s behaviour on the way to a set goal. Thus, the opinions of the authors complement each other and form a complex whole. It follows from the literature that each worker is motivated by something different; it is an individual matter. A successful manager must know the needs of their employees to motivate them effectively. Only subsequently will effective motivation be reflected in achieving good work results [
48,
49,
50].
2. Materials and Methods
We use theoretical and empirical scientific methods when processing the investigated issue. In the first step, we work with theoretical methods, especially when processing theoretical foundations, such as analysis, synthesis, induction, and deduction. Subsequently, we use empirical scientific methods that work with concrete and precise data. In addition to explanatory methods, we use interpretive methods. The scientific methods we use are the study of professional monographic texts, followed by the method of compilation and interpretation of the obtained facts, supplemented by personal opinions. In order to fulfil the set goals, we use the quantitative research method of data collection using a questionnaire survey, and then establish hypotheses and determine the dependence of characters using the chi-square test of independence in the IMB SPSS Statistics 25 programme. We also use the qualitative research method of data collection through an unstructured questionnaire focused on employees’ opinions regarding motivation.
From the point of view of the formulated hypotheses, the chi-square test method is relevant for their verification, through which we can determine whether there is or is not a statistically significant dependence between the investigated variables. If it is proven that this dependence exists between the investigated variables, we can subsequently determine the strength of the contingency coefficient. Cramer’s V coefficient is used to determine the strength of the contingency coefficient, which is used to identify the strength of this coefficient. The intervals on the basis of which we define the strength of the contingency coefficient are given directly in the definitions of Cramer’s V. We use chi-square in cases where the condition is met that 100% of all frequencies must have a value greater than 5, and none can be 0. If this condition is not met, we proceed to use the Fisher exact test. This test is used precisely in cases where the conditions of the chi-square test are not met.
In order to verify the established hypotheses, we apply mathematical statistics using the IBM SPSS Statistics programme according to the methods below.
Pearson’s chi-square test is used in the cross-tabulation analysis. Through this test, we determine whether there is a dependency among the selected categorical variables. The formula for the chi-square test is as follows:
where
χ2 is the chi-square test,
c is the number of columns,
Oi is the observed number in each cell, and
Ei is the expected number, defined as follows:
where
n is the total number from all cells, and
pi is the theoretical expected probability in each cell.
Cramer’s V is a contingency coefficient, on the basis of which we can measure the strength of dependence between two categorical variables. If we want to find out if two categorical variables are dependent, we must first perform a test of independence, the chi-square (χ²) test.
The statistical significance of the determined contingency coefficient then depends on the p-value. The p-value represents the significance test designation. In the chi-square test, we also work with the α indicator, which represents the level of significance. It is true that, if the p-value is close to 0, it means that there is a relationship between the investigated variables. As for the test result, we interpret it as follows:
- -
If the test result ranges from 0 to 0.3, there is a weak dependence between the studied variables;
- -
If the test result ranges from 0.3 to 0.8, there is a moderately strong dependence between the variables;
- -
If the test result ranges from 0.8 to 1, there is a strong dependence between the variables.
If p ≤ α, then we reject the null hypothesis because a lower p-value indicates a less acceptable null hypothesis.
The formula for calculating Cramer’s V is as follows:
where
ϕc is Cramer’s V (phi),
χ2 is the chi-square test,
N is the size of the tested sample, and
k is the smallest frequency of each categorical variable
The
Fisher exact test is used in cases where the condition that 100% of all counts must be greater than 5 and none can be 0 is not met. In this case, the Fisher exact test also enters the measurement, which calculates
p-values by finding the probabilities of all possible combinations in the contingency table that have the same marginal sums or that are equal to or more extreme than the observed ones [
50]. If the Fisher exact test is used, it is recommended to interpret the strength of dependence through the result of the contingency coefficient phi instead of Cramer’s V coefficient.
Fisher’s exact test is calculated according to the following relationship:
where
p is the
p-value,
a,
b,
c, and
d are values from the contingency tables, and
n is the total number.
In our case, the Fisher exact test is used for Hypothesis 1.
Following the compilation of the questionnaire, we conducted piloting, which is represented by preliminary research. Its significance consisted of determining the questionnaire’s shortcomings and whether the questionnaire’s questions were correctly formulated and understandable to the respondents. Preliminary research was conducted on a sample of 76 respondents, whom we randomly approached. After conducting preliminary research, we were able to start editing the questionnaire according to the comments of the respondents. After considering the comments of the pilot participants, in addition to the dichotomous questions and the Likert scale, we also added additional open questions to obtain more detailed answers from the respondents to understand the aspects in which they see certain shortcomings in motivation, which they could specify more precisely. As part of the research, we established several hypotheses, for which we first determined the null hypotheses individually and then proceeded to test them. We verified the hypotheses within the Slovak Republic, and the respondents were employees who shared their views and opinions on aspects of motivational policy. The creation of hypotheses resulted from the composition of the theoretical basis of the research and was based on the previous knowledge of the authors who dealt with the issue in question. According to the established hypotheses, testing followed. The research hypotheses were as follows:
Hypothesis 1. Sufficient financial remuneration and satisfaction with the incentive policy on the part of employees are dependent.
Hypothesis 1-0. Sufficient financial compensation and satisfaction with the incentive policy on the part of employees are independent.
Hypothesis 2. The employee’s job position and satisfaction with the incentive policy are dependent.
Hypothesis 2-0. The employee’s job position and satisfaction with the incentive policy are independent.
Hypothesis 3. Gender and sufficient financial remuneration in employment are dependent.
Hypothesis 3-0. Gender and sufficient financial compensation at work are independent.
Hypothesis 4. Employee motivation and supervisor feedback are dependent.
Hypothesis 4-0. Employee motivation and supervisor feedback are independent.
3. Results
We carried out the research in the environment of the Slovak Republic, while our research focused on employees’ opinions on motivation at work. We carried out the research in the form of a non-standardised questionnaire that was sent to employees.
We determined the motivation of employees in the Slovak Republic in the environment of manufacturing enterprises using an anonymous questionnaire. The questionnaire was distributed electronically on the basis of a random selection of companies. We approached personnel managers with the questionnaire, who distributed the questionnaires to their employees. The questionnaire was divided into two parts. The first part related to sociodemographic aspects such as gender, age, and the job position of the employee. The next part of the questionnaire was aimed at finding out the employees’ opinions on their satisfaction with the incentive policy and whether they are sufficiently financially rewarded. We also examined the employees’ opinions on whether feedback from their supervisor is important to them. We determined satisfaction with the incentive policy using a Likert scale ranging from 1 to 5, where 1 is very satisfied and 5 is completely dissatisfied. Employees expressed their opinion on whether they are sufficiently financially valued through the options “yes” and “no”. Employees expressed their opinion regarding the importance of feedback through the options “yes” and “no”.
According to the most recent published data, the number of employees in the Slovak Republic was 2,615,900 in the third quarter of 2022. When calculating the minimum research sample, we based our calculations on this figure. According to the mentioned mathematical relationship, which we present below, we calculated the size of the statistical sample of respondents. The given formula includes four variables: sample size, Z-value from statistical tables, proportion of sign for unknown values, and margin of error. We determined the minimum sample size using the following relationship for calculating the minimum research sample [
51]:
where
Z is the
Z-value from statistical tables,
p is the share of the character,
c is the permissible range of errors, and
n is the sample size.
We set the confidence level at 95%, which corresponds to a
Z-value of 1.96. We set the character share for unknown values to 0.5. We allowed a deviation of 5%. We determined the result as follows:
According to the result we obtained by substituting the values into the formula, the relevant statistical sample size was 384 respondents. We sent the questionnaire electronically to 3250 respondents on the territory of the Slovak Republic, and the number of completed questionnaires that we received was 836. The return rate of questionnaires was 25.72%. After checking the relevance of the questionnaires, we concluded that exactly 800 questionnaires were suitable for the needs of our research, since some answers were missing in the other questionnaires. Since we exceeded the minimum number of relevant answers from the point of view of calculating the minimum sample, we evaluated the given research sample as fulfilled.
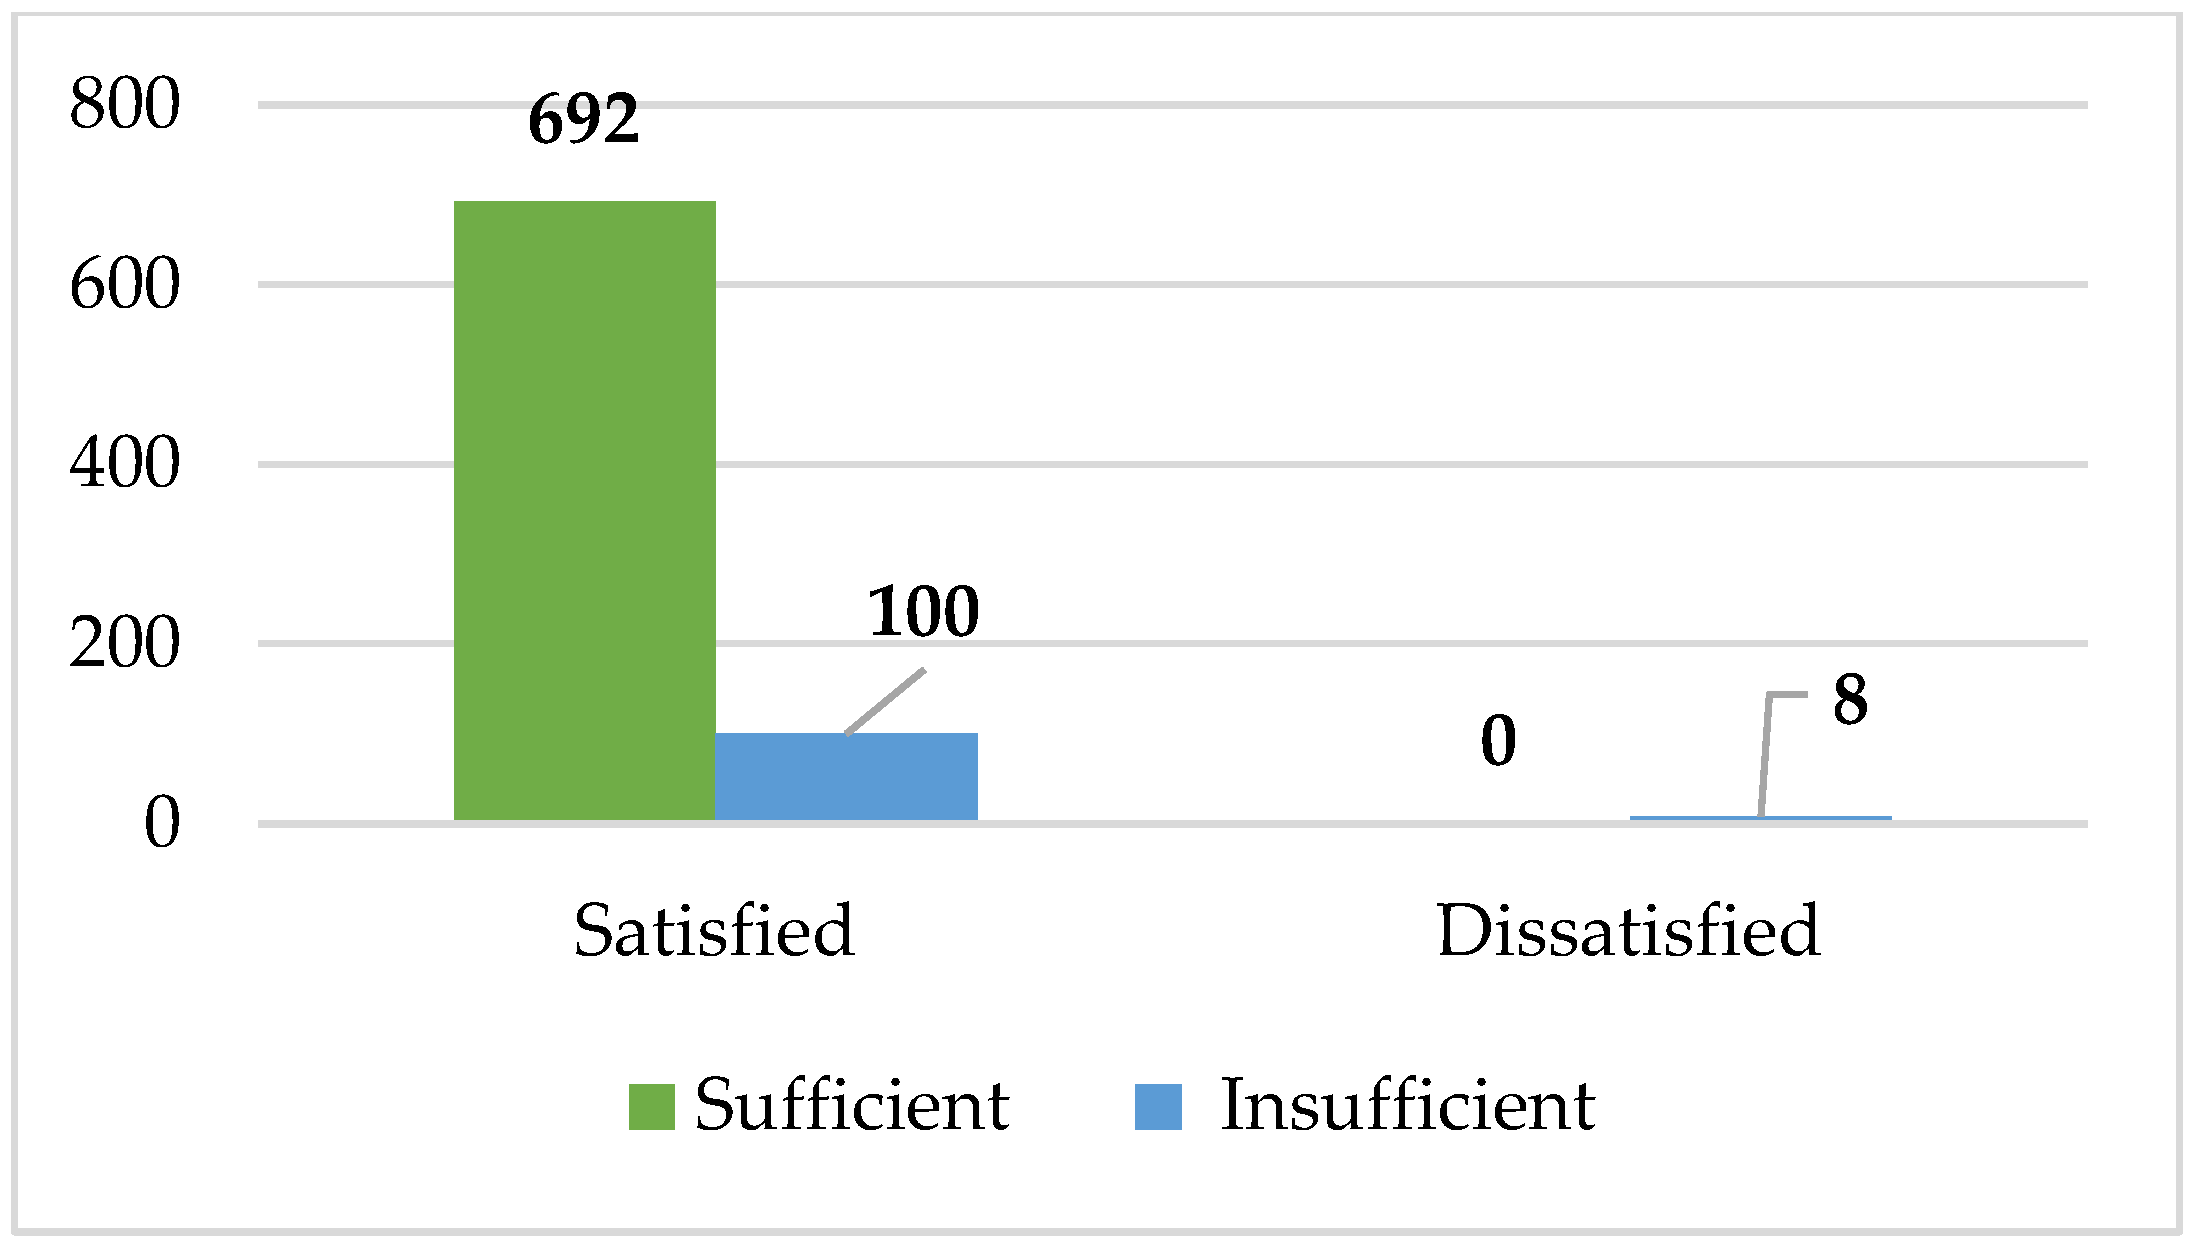
Test No. 1: The first possible dependency that we tested is the relationship between sufficient financial compensation and satisfaction with the company’s incentive policy on the part of employees. Hypothesis 1 entered the first round of testing together with its null hypothesis.
We evaluated this hypothesis by means of the chi-square test at the determined level of significance α = 5%, or α = 0.05. To verify Hypothesis 1, we first created a contingency table (
Table 1) that displays two variables—sufficient financial evaluation and satisfaction with the incentive policy. The chi-square test was performed under the condition that 100% of the theoretical frequencies must have a value greater than 5, and that the values cannot be zero.
The graphic display of the results of the contingency table is shown in
Figure 1.
We created a 2 × 2 contingency table, and this test can be used if, with the range of the sample set being n > 20, all theoretical frequencies are Eij ≥ 5.
Table 1 shows that the second condition is not met. For this reason, we must include the Fisher exact test in the testing and follow it when interpreting the results. This test is used in cases where the condition that 100% of all counts must be greater than 5 and none can be 0 is not met. In this case, the Fisher exact test also enters the measurement, which calculates
p-values by finding the probabilities of all possible combinations in the contingency table that have the same marginal sums or are equal to or are more extreme than the observed ones [
50]. In
Table 2, we present the result of the chi-square test, including the Fisher exact test.
According to the test in
Table 2, we see that the
p-value of the chi-square test is 0.016, and the
p-value of the Fisher exact test is 0.017. The results show that the
p-value is less than α = 0.05; thus, there is a statistical dependence between these investigated variables. We evaluated the strength of the contingency coefficient in
Table 3.
The strength of the contingency coefficient phi represents a value of 0.135 and, thus, indicates a weak dependence between the investigated variables, which is statistically significant. As a result, we can state that there is a weak dependence between sufficient financial remuneration and satisfaction with the incentive policy on the part of employees, while this dependence is statistically significant.
Test No. 2: As part of the second test, we test the dependence between the job position in which the employees work and their satisfaction with the implemented incentive policy in the company in which they work. We verify the existence of dependence between the signs using the chi-square test of independence at the set significance level α = 0.05. We test Hypothesis 2 and its corresponding null hypothesis.
Table 4 shows a contingency table of the detected frequencies from the respondents’ answers.
In
Figure 2, we show a graphical representation of the responses from the respondents regarding their satisfaction with the incentive policy by job position.
Subsequently, we proceed to test the hypothesis through the chi-square test, the result of which is shown in
Table 5.
The chi-square test can be performed under the condition that 100% of the theoretical frequencies must have a value greater than 5, and that none of the values can be 0. This condition was met, as evidenced by the data below the table. The p-value of the test is less than the established level of significance; thus, we reject the null hypothesis and proceed to determine the strength of the contingency coefficient.
Cramer V represents the contingency coefficient. According to
Table 6, the Cramer V value is 0.249. The contingency coefficient’s statistical significance, i.e., the
p-value, is 0.003; hence, this coefficient is statistically significant. According to the Cramer V value, we can interpret the strength of the dependence between the investigated variables. According to the detected value of 0.249, we can conclude that there is a weak dependence between the investigated variables because the value is in the interval (0–0.3). We can conclude that we reject the null hypothesis and accept alternative Hypothesis 2.
Test No. 3: In the third test, we deal with the question of whether there is a dependency between gender and sufficient financial remuneration in employment. This test includes Hypothesis 3, as well as its null hypothesis.
The first step in testing is to build a contingency
Table 7 of the investigated variables.
The results of the observed frequencies of the investigated variables are shown in
Figure 3.
Subsequently, we move on to testing the hypothesis through the chi-square test. The result is shown in
Table 8.
According to the
p-value of the test, which is 0.000 and, thus, lower than the established level of significance (
α = 0.05), we reject the null hypothesis H3-0 and accept the alternative Hypothesis 3, as we found a statistically significant relationship between gender and sufficient financial remuneration addiction. This ultimately means that the financial evaluation of an employee depends on their gender. On this basis, we proceed to determine the strength of the contingency coefficient, which is listed in
Table 9.
Both the phi coefficient and Cramer’s V show a value of 0.540 within the strength of the contingency coefficient, which we place in the second interval of the strength of dependence (0.3–0.8). If the test result is within this interval, there is a moderately strong dependence between the investigated variables, which is statistically significant. As a result, we can conclude that we accept the alternative hypothesis and reject the null hypothesis.
Test No. 4: In this test, we determine whether motivation from the superior and feedback from the superior are interdependent. In this test, we test the Hypothesis 4 and its null hypothesis.
The first step for the verification of this hypothesis is the compilation of a contingency table with the detected frequencies of responses from the respondents, which we present in
Table 10. We verify the hypothesis at the established level of significance (
α = 0.05).
Figure 4 graphically shows the frequencies of the investigated transformations from contingency
Table 10.
Subsequently, we proceed to test the hypothesis through the chi-square test, the results of which are contained in
Table 11.
As the
p-value of the test, according to
Table 12, is less than the significance level (
α = 0.05), we reject the null hypothesis and accept the alternative Hypothesis 4, in which we assumed that there is a dependence between employee motivation and feedback from the superior. On this basis, we proceed to determine the strength of the contingency coefficient in
Table 12.
The phi and Cramer coefficient values indicate a moderately strong relationship between superior motivation and how frequently employees receive feedback. According to the resulting value of the strength of the contingency coefficient, which in both cases shows the number 0.624, we can classify the detected dependence in the second interval of the strength of dependence 0.3–0.8, which indicates that there is a moderately strong dependence between the investigated variables. From the point of view of these results, we reject the null hypothesis and accept the alternative Hypothesis 4, as we found a moderately strong dependence between the examined variables, which is statistically significant.
Research Conclusions
On the basis of the research results, we summarise our findings as follows:
There is a statistically significant relationship between sufficient financial remuneration and satisfaction with the motivational policy on the part of employees, which, according to the result of 0.135, belongs to the interval of weak dependence. This means that there is a weak dependence between the investigated variables.
There is a statistically significant dependence between the employee’s job position and satisfaction with the incentive policy, which, according to the result of 0.249, belongs to the interval of weak dependence. This means that there is also a weak dependence between these investigated variables.
There is a statistically significant dependence between the variables gender and simple financial evaluation at work, which, according to the result of 0.540, belongs to the medium dependence interval. This means that there is a moderately strong dependence between the investigated variables.
There is a statistically significant dependence between the employee’s motivation and the feedback from the party, which, according to the result of 0.624, belongs to the medium dependence interval. This means that even in this case, there is a strong dependence between the investigated variables.
4. Discussion
When studying the issue of motivation and the factors that increase it, it is possible to come across stimulating research by various authors. Each study deals with the relationship of motivation to selected determinants, and their results are very interesting. The authors in [
52] investigated a very specific relationship. They argued that many studies have explained both employee motivation and engagement, but very few studies have explained the relationship between employee engagement and motivation using self-determination theory perspectives. The aim of the research was to explain motivation from the perspective of self-determination theory by linking it with employee engagement. They conducted their research on a sample of 69 employees and evaluated this sample as relevant for drawing conclusions. The results of this research using partial least squares showed that the influence of self-determination theory on employee engagement is very high. A different relationship was investigated by [
53], where the research goal was to assess the impact of financial and nonfinancial rewards on employee motivation together with the mediating effect of employee engagement on the relationship between financial and nonfinancial rewards and employee motivation. A total of 235 employees were involved in their research. This study discovered a significant and positive effect of nonmonetary compensation on employee motivation in direct relationship outcomes; the current study discovered a positive but insignificant effect of monetary compensation on motivation in direct relationships. This study also found significant results regarding the effect of financial and nonfinancial rewards on employee engagement. In addition, the current study found significant positive mediating results of employee commitment between financial rewards and nonfinancial rewards, which proved to be a good mediator. Referring to the theory of social determination, research by the authors in [
54] examined the impact of leader prosocial motivation on employee creativity by examining the mediating role of employee perspective taking and the moderating role of leadership performance. A total of 262 employees participated in this research. Their results revealed that leader prosocial motivation is positively related to employee perspective taking, and employee perspective taking may mediate the correlation of leader prosocial motivation with employee creativity. Meanwhile, leader performance may moderate the correlation of leader prosocial motivation with employee perspective taking. The authors of [
55] developed a study that aimed to understand the relationship among psychological empowerment, intrinsic work motivation, and employee creativity. This research was carried out with the participation of 420 respondents. The results of the study showed that psychological empowerment has a significant relationship with employees’ intrinsic work motivation and creativity and inner work. Motivation has a positive effect on employee creativity; at the same time, intrinsic work motivation plays a mediating role in the relationship between psychological empowerment and employee creativity. For the assessment of determinants increasing the level of employee motivation, remuneration is key. The impact of compensation structure on employee satisfaction using employee motivation as a mediator was investigated by the authors [
56] on a sample of 100 employees addressed by the questionnaire. The findings show that the remuneration system has a positive effect on employee satisfaction by partially mediating motivation. At the same time, this study creates awareness of the intent to rethink a robust compensation strategy to increase employee morale, engagement, and reduce turnover. The results of the research in [
57], which focused on the identification of applied tools of nonfinancial motivation and motivation of SME employees in terms of work effort and productivity, were the opposite. The research sample consisted of 223 respondents. The results of the research showed that nonfinancial motivational tools were requested by SME employees with a higher intensity than in the previous year; however, company management was not aware of this fact. Their results indicate that, if small and medium-sized enterprises were to realise the importance of nonfinancial motivational factors and provide them to their employees, employees would appreciate a greater diversity of forms of remuneration, which would have a positive impact on their productivity and, thus, the overall performance of a particular enterprise. The issue of the influence of the average annual salary and household debt on the most important motivational factors of employees was addressed by authors in [
45]. On the basis of the findings, the authors could conclude that macroeconomic indicators influence the importance of motivational factors in Slovakia. Six motivational factors (communication at the workplace, responsibilities and type of work, working hours, working environment, superior attitude, and psychological burden) significantly influenced the average annual salary. The results of the research also showed that seven motivational factors (atmosphere at the workplace, a good team, communication at the workplace, working hours, the working environment, a superior approach, and psychological burden) strongly depend on the macroeconomic indicator of household indebtedness. Therefore, when creating incentive programs, business managers in Slovakia should consider not only the effects of the microenvironment of the company on motivation but also the effects of the macroenvironment and, thus, macroeconomic changes in the state. The manager’s task is to maintain a balance between the influence of the external environment on employee motivation and internal actions. The study by the authors in [
58], which was carried out on a sample of 152 respondents, drew on social learning theory and a motivational perspective to examine how leader humility can promote other-oriented employee motivation and uncover an other-serving motivational mechanism through which leader humility can influence different types of employee voice behaviour. The results revealed that leader humility is positively related to employee prosocial motivation and organisational interest motivation. At the same time, the authors argued that it is noteworthy that a leader’s humility, which is characterised by emphasising the value and strength of others, is more likely to trigger employees’ prosocial motivation and, thus, influence their behaviour. The manager–employee relationship was the common denominator in the previously described study and this one. However, the purpose of this research was to examine the relationship among managers’ credibility, strategic alignment, and motivation. The role of strategic alignment as a mediator between manager credibility and motivation was also investigated. A positive relationship was found among all variables. Three variables (manager credibility, strategic alignment, and motivation) were found to be significantly positively correlated. Manager credibility affects motivation and strategic alignment. Managerial credibility and strategic alignment were found to have a statistically significant effect on employee motivation. According to the authors in [
59], employee satisfaction also affects motivation. The results showed that, although satisfaction with the leader dimension reached the highest average, employees felt indifferent, and the motivational factor that had the greatest impact on civil servants was related to the motivation for success and power. In relation to motivational factors, employees feel indifferent to motivation for performance, success, and commitment; moreover, factors in relation to the organisation do not affect work motivation. The stated results can be supplemented with knowledge from the study by the authors in [
60], who similarly focused on the investigation of employees’ attitudes towards the ability of their leaders and managers to apply appropriate motivators in the work process. Their study demonstrated the existence of a significant ability of leaders and managers to motivate employees by applying material, nonmonetary, and work-related motivators. In order to assess motivation, it is very important to take into account, in addition to the factors mentioned above, the assessment of employee performance, which, as the authors of [
61] pointed out, is key to creating a motivation system because the skills, knowledge, and performance of employees affect the financial and economic performance of the entire company. The aim of their research was to study the specifics and analyse the existing methods of evaluating the performance of employees as a basis for motivation in crisis conditions. It was found that the level of efficiency and the criteria for its evaluation are set for each employee. It was proven that the evaluation of the employee’s performance is documented, and a decision is made on the choice of an appropriate system of motivational factors and incentives.
Abstracting from quantifiable factors, attention can also be focused on qualitative factors when investigating motivation. These include organisational behaviour and morals. This issue was addressed in their work by authors in [
62], whose study focused on investigating the relationship among organisational silence, intention to quit, and organisational loneliness. The theoretical and practical results of the study showed that taking measures to increase the morale and motivation of employees in organisations will increase their work performance. From a broader point of view, the authors in [
63] focused on identifying motivational factors. The results of their study showed that job security is the most important motivational factor, followed by salary and promotion, while taking responsibility is the least motivating factor. The male group of participants chose salary, while the female group chose job security. Normal employees chose good relations with co-workers, while managers chose job security as the highest motivating factor. This analysis concluded that there was no significant correlation among most of the categories examined, indicating that there was no consensus among the categories of studies regarding the ranking of motivational factors. There is a whole spectrum of areas that can be explored in the context of motivation. However, it should be kept in mind, as the authors highlighted in [
64], that the dexterity of a leader is acquired together with professional experience. This is the basis for the introduction of new technologies. As the authors mentioned in [
65], however, the changes caused by the introduction of modern technologies and the increasing complexity of products and production directly affect industrial enterprises and workers. Critics of the Industry 4.0 paradigm emphasised its orientation towards new technologies and digitisation in a technocratic manner. Therefore, the new paradigm Industry 5.0 appeared very soon and automatically started a discussion about the role and reasons for applying the new paradigm.
We were interested in factor related to the financial evaluation of employees, their job position, and the financial evaluation of gender. We examined all the mentioned aspects from the perspective of employees working in Slovakia in order to reveal the regularities among the selected elements of the motivational policy. The presented research focused on the detection of interdependencies in the field of motivation among employees working in the Slovak Republic. The research was carried out using the questionnaire method and was intended for employees of selected production companies and their opinions in the field of motivation policy. In the research, we focused on discovering the regularities between motivation and selected aspects of the motivational policy. We established four hypotheses, which we subsequently tested. We drew some important conclusions from the test results.
4.1. Results of Testing the First Hypothesis
As part of the first round of testing, we investigated whether there is a relationship between sufficient financial compensation and satisfaction with the motivational policy on the part of employees. We hypothesised that there would be a dependency between the two variables under study. We tested our hypothesis using the chi-square test method. Since we found out from the contingency tables that the conditions for evaluating this assumption through the chi-square test were not met, the authoritative test in this case was the Fisher exact test. According to the results of the
p-value of this test (0.017), we concluded that there is a dependency between the investigated variables. In order to determine the strength of dependence, we proceeded to determine the strength of the contingency coefficient on the basis of the phi coefficient. Its value was 0.135, which indicated a weak dependence between sufficient financial compensation and satisfaction with the incentive policy on the part of employees, although this dependence was statistically significant. Thus, our finding builds on the work of the authors in [
53,
57]. At the same time, it reflects the research results of the authors in [
56], who confirmed the impact of remuneration on employee satisfaction, which affects their motivation.
4.2. Results of Testing the Second Hypothesis
In the second test, we investigated whether there is a relationship between the employee’s job position and their satisfaction with the incentive policy in the company where they work. Using the chi-square test, we determined whether the investigated variables are interdependent. We divided the job positions of the respondents into six key work areas. After determining the frequencies, we proceeded to test. The result of the chi-square test showed a
p-value of 0.016, indicating a statistically significant relationship between the investigated variables. We determined the strength of the contingency coefficient using Cramer’s V association measure. The strength of the contingency coefficient proved to be 0.249, which means that there was a weak dependence between the employee’s job position and their satisfaction with the incentive policy in the company, which was statistically significant. In this case, the research in [
57] confirmed the interdependence of the nonfinancial aspect of motivation. Thus, from the point of view of the first and second hypotheses, we continued the research in [
59], where the authors dealt with aspects of employee satisfaction in relation to motivation.
4.3. Results of Testing the Third Hypothesis
In the case of the third test, we examined the dependence between gender and a sufficient financial evaluation of the employee. We determined with the chi-square test whether there was a dependency between the studied variables. The
p-value of the test came out to be 0.000, indicating a statistically significant relationship between the studied variables. The strength of the detected dependence was determined by the result of Cramer’s V association measure. Its value was 0.540, which we interpreted as a moderately strong dependence that was statistically significant between the variables gender and sufficient financial evaluation. This result is consistent with the result of the investigation in [
46].
4.4. Results of Testing the Fourth Hypothesis
The fourth test was aimed at finding out whether there is a relationship between employee motivation and feedback from a superior. The test was conducted using the chi-square method. The
p-value of the test was 0.000, indicating a statistically significant relationship between these variables. For the purposes of interpreting the strength of this dependence, we again used Cramer’s V association measure. Its result represented a value of 0.624, denoting a moderately strong dependence. In this case, the assumption was also confirmed that there was a moderately strong, statistically significant relationship between the variable’s employee motivation and feedback from superiors. The aspect of the importance of the leader, i.e., the superior in relation to the employee, was also investigated by the authors in [
58], who found that the superior’s approach to the employee triggers employee motivation. The legality of the relationship between employees and superiors was also investigated by the authors in [
60].
On the basis of the results of our research, we can propose some recommendations aimed at manufacturing companies operating in the Slovak Republic. As we revealed the dependence between sufficient financial remuneration for the employee and their satisfaction with the motivational policy, we recommend that companies place emphasis on building an employee motivational policy. It is also necessary to deal with the question of whether the employee is sufficiently valued financially in the given workplace and whether it is possible to expect an increase in their performance through motivation at the current salary. If the biggest problem with their motivation is the financial evaluation, it is necessary to consider its increase in order to achieve effective motivation. Our next recommendation is to carefully create a motivational programme designed for a specific workplace because we found a dependent relationship between these variables. We also revealed that there is a dependency between gender and a sufficient evaluation of the employee. In this case, it is necessary to reassess the financial evaluation of the employee from the point of view of gender and consider whether this financial evaluation is sufficient to motivate the employee to achieve higher performance. Our next finding is directed at the relationship between the superior and the employee. In this relationship, we also found a dependency between employee motivation and the feedback the employee receives from their superior. This means that, if an employee receives feedback from their superior, it also provides an incentive to improve the employee’s performance. In matters of motivation and revealing weak points, companies can use questionnaires aimed at their employees. On the basis of the results of the questionnaires, managers should make changes to the motivation policy in order to achieve the highest level of employee motivation at their workplaces.
We consider the results of our research to be beneficial for the area of employee motivation in manufacturing companies operating in the Slovak Republic. In our opinion, the research reflects the current situation in terms of the basic elements that employees of manufacturing companies consider important in their own motivation. The obtained results can serve as a basis for other researchers who deal with the issue of motivation. Considering the similar business environment in at least the V4 countries, the results of our survey can also be used as a starting point for investigating the subject area under the conditions of another country.


