Article

Assessment of New Bio-Cement Method for Sand Foundation Reinforcement

1
Institute of Port, Coastal, and Offshore Engineering, Ocean College, Zhejiang University, Zhoushan 316021, China
2
Institute of Geotechnical Engineering, College of Civil Engineering and Architecture, Zhejiang University, Hangzhou 310058, China
*
Author to whom correspondence should be addressed.
Sustainability 2023, 15(12), 9432; https://doi.org/10.3390/su15129432
Submission received: 14 April 2023 / Revised: 6 June 2023 / Accepted: 7 June 2023 / Published: 12 June 2023

Abstract

:
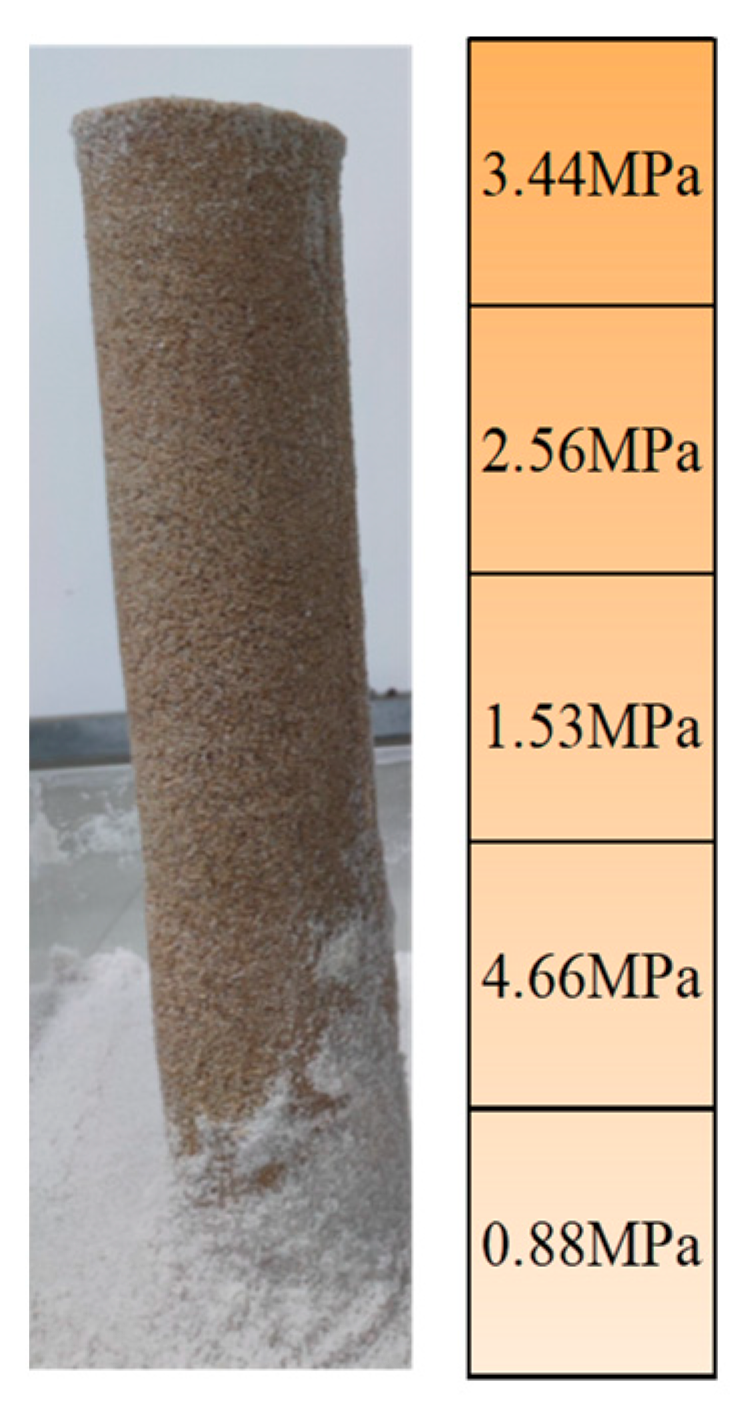
Microbially induced carbonate precipitation (MICP) is a new method used in recent years to improve the soil. However, this method still faces challenges related to low grouting reinforcement strength and efficiency. In this study, both the bio-cement infiltration method and bio-cement mixed method for sand foundation were proposed, and physical model tests were conducted to investigate the mechanical properties of sand treated with the bio-cement method. The results showed that the bio-cement maximized the utilization rate of bacterial liquid and reduced the waste caused by the loss of bacteria compared with traditional methods. Both the size of the reinforced area and bearing capacity of the sand reinforced by bio-cement infiltration method were controlled by the volume ratio of the bio-cement, calcareous sand powder, and the inflow rate. The maximum bearing capacity was 125 N when using a mixture of bio-cement and calcareous sand powder with a ratio of 400/80, with an inflow rate of 20 mL/min. The UCS of the sand reinforced by the bio-cement mixed method gradually decreased from 3.44 MPa to 0.88 MPa with depth, but increased with increasing CaCO3 content. The CaCO3 crystals were primarily concentrated at the contact point between the particles, and the formed crystals were mainly polyhedral. Reduction in the CaCO3 content mainly occurred in the central deep part of the reinforcement area. The result provides an experimental basis for the use of bio-cement in the reinforcement of sand soil foundations.

1. Introduction

Sand ground is widely distributed in various regions of China, including the northwest desert region, Yangtze River delta, Pearl River Delta, and coasts of the South China Sea. Sand has several characteristics such as being loose, compressible, and uneven [1]. Thus, sand foundations are vulnerable to long-term damage caused by waves, storm surges, or earthquakes, posing a significant threat to the safety of people and property [2,3] (Figure 1). For instance, the 2010 Haiti earthquake caused catastrophic ground damage to a seaport that was artificially filled with sand [4]. It is crucial to strengthen sand foundations to ensure the safety of engineering projects. Several conventional consolidation measures, such as densification, gravel drains, grouting, and deep mixing, have been found to be less feasible due to their high cost, environmental pollution, and low effectiveness [5,6]. Environmentally friendly soil improvement techniques have been extensively researched in recent years, such as geopolymers and microbially induced calcium carbonate precipitation [7,8,9,10].
The microbial-induced carbonate precipitation (MICP) is an environmentally sustainable technology that utilizes biological metabolic processes to improve soil properties [11,12,13]. MICP utilizes urea hydrolysis bacteria to produce ammonia and carbonate ions. The carbonate ions combine with calcium ions to induce calcite precipitation [14]. The main reaction process of the MICP method is represented by Equations (1) and (2).
CO NH 2 2 + 2 H 2 O u r e a s e   2 NH 4 + + CO 3 2
Ca 2 + + CO 3 2 CaCO 3 s
Recently, the application of MICP to sand soil has been studied extensively through the unit test, model test, and field test [6,15,16]. Whiffin [17] proposed the application of MICP to sand consolidation, which proved successful in enhancing the strength of loose sand. Montoya et al. [18] found that the use of MICP reduced the susceptibility of loose sand to liquefaction under seismic loads. Cheng et al. [19] proposed that MICP-treated ground exhibited higher liquefaction resistance and effectively reduced settlement compared to the pile retaining wall treatment method. Gomez et al. [20] found that MICP grouting significantly improved the strength of sand soil, with the maximum shear wave velocity reaching 960 m/s and the maximum penetration resistance exceeding 6 MPa. Zamani et al. [21] studied the undrained cyclic response of silty sands treated by MICP and found that MICP improved the liquefaction resistance of silty sands with 0–35% fines content.
The traditional MICP grouting methods exhibit low efficiency, and achieving a higher strength curing effect typically requires multiple grouting, making the process cumbersome [22,23]. Researchers have addressed this issue by optimizing grouting materials and methods, such as injecting a small amount of calcium chloride solution as a bacterial fixative solution [24,25], carrying out single-phase grouting by adjusting temperature or pH [26,27], optimizing crystallization sites by adjusting saturation [28], and adding fibers [29]. Additionally, Wu and Chu [30] used a urease-active bio-cement prepared by mixing and stirring with urea-like bacteria and cementation solution to solidify soils and found that the method effectively improved the curing efficiency and cementation strength. To reduce the application cost of bio-cementation, Gowthaman et al. [31] used low-quality chemicals and effectively reinforced the site slope.
Previous studies have primarily focused on enhancing soil reinforcement through the optimization of grouting materials and methods. However, there is a dearth of research comparing various methods, such as the infiltration method and bio-cement mixed method. This study aims to assess the effectiveness and reinforcement mechanisms of the bio-cement infiltration method and bio-cement mixed method on sand foundations, as well as investigate the factors influencing their reinforcement effects. The structure of this study is as follows. First, the properties of sand, preparation of bio-cement solution, and experimental design are described. Then, methods to determine the unconfined compressive strength and CaCO3 content are described. Finally, the remaining cementation solution, compression strength, spatial distribution, and crystalline morphology of CaCO3 content in the reinforcement area are analyzed. This study is expected to effectively enhance the strength and efficiency of bio-cement reinforced sand, thereby offering valuable insights for the application of this technology in foundation reinforcement.

2. Materials and Methods

2.1. Sandy Soil and Bio-Cement Composition

2.1.1. Sandy Soil

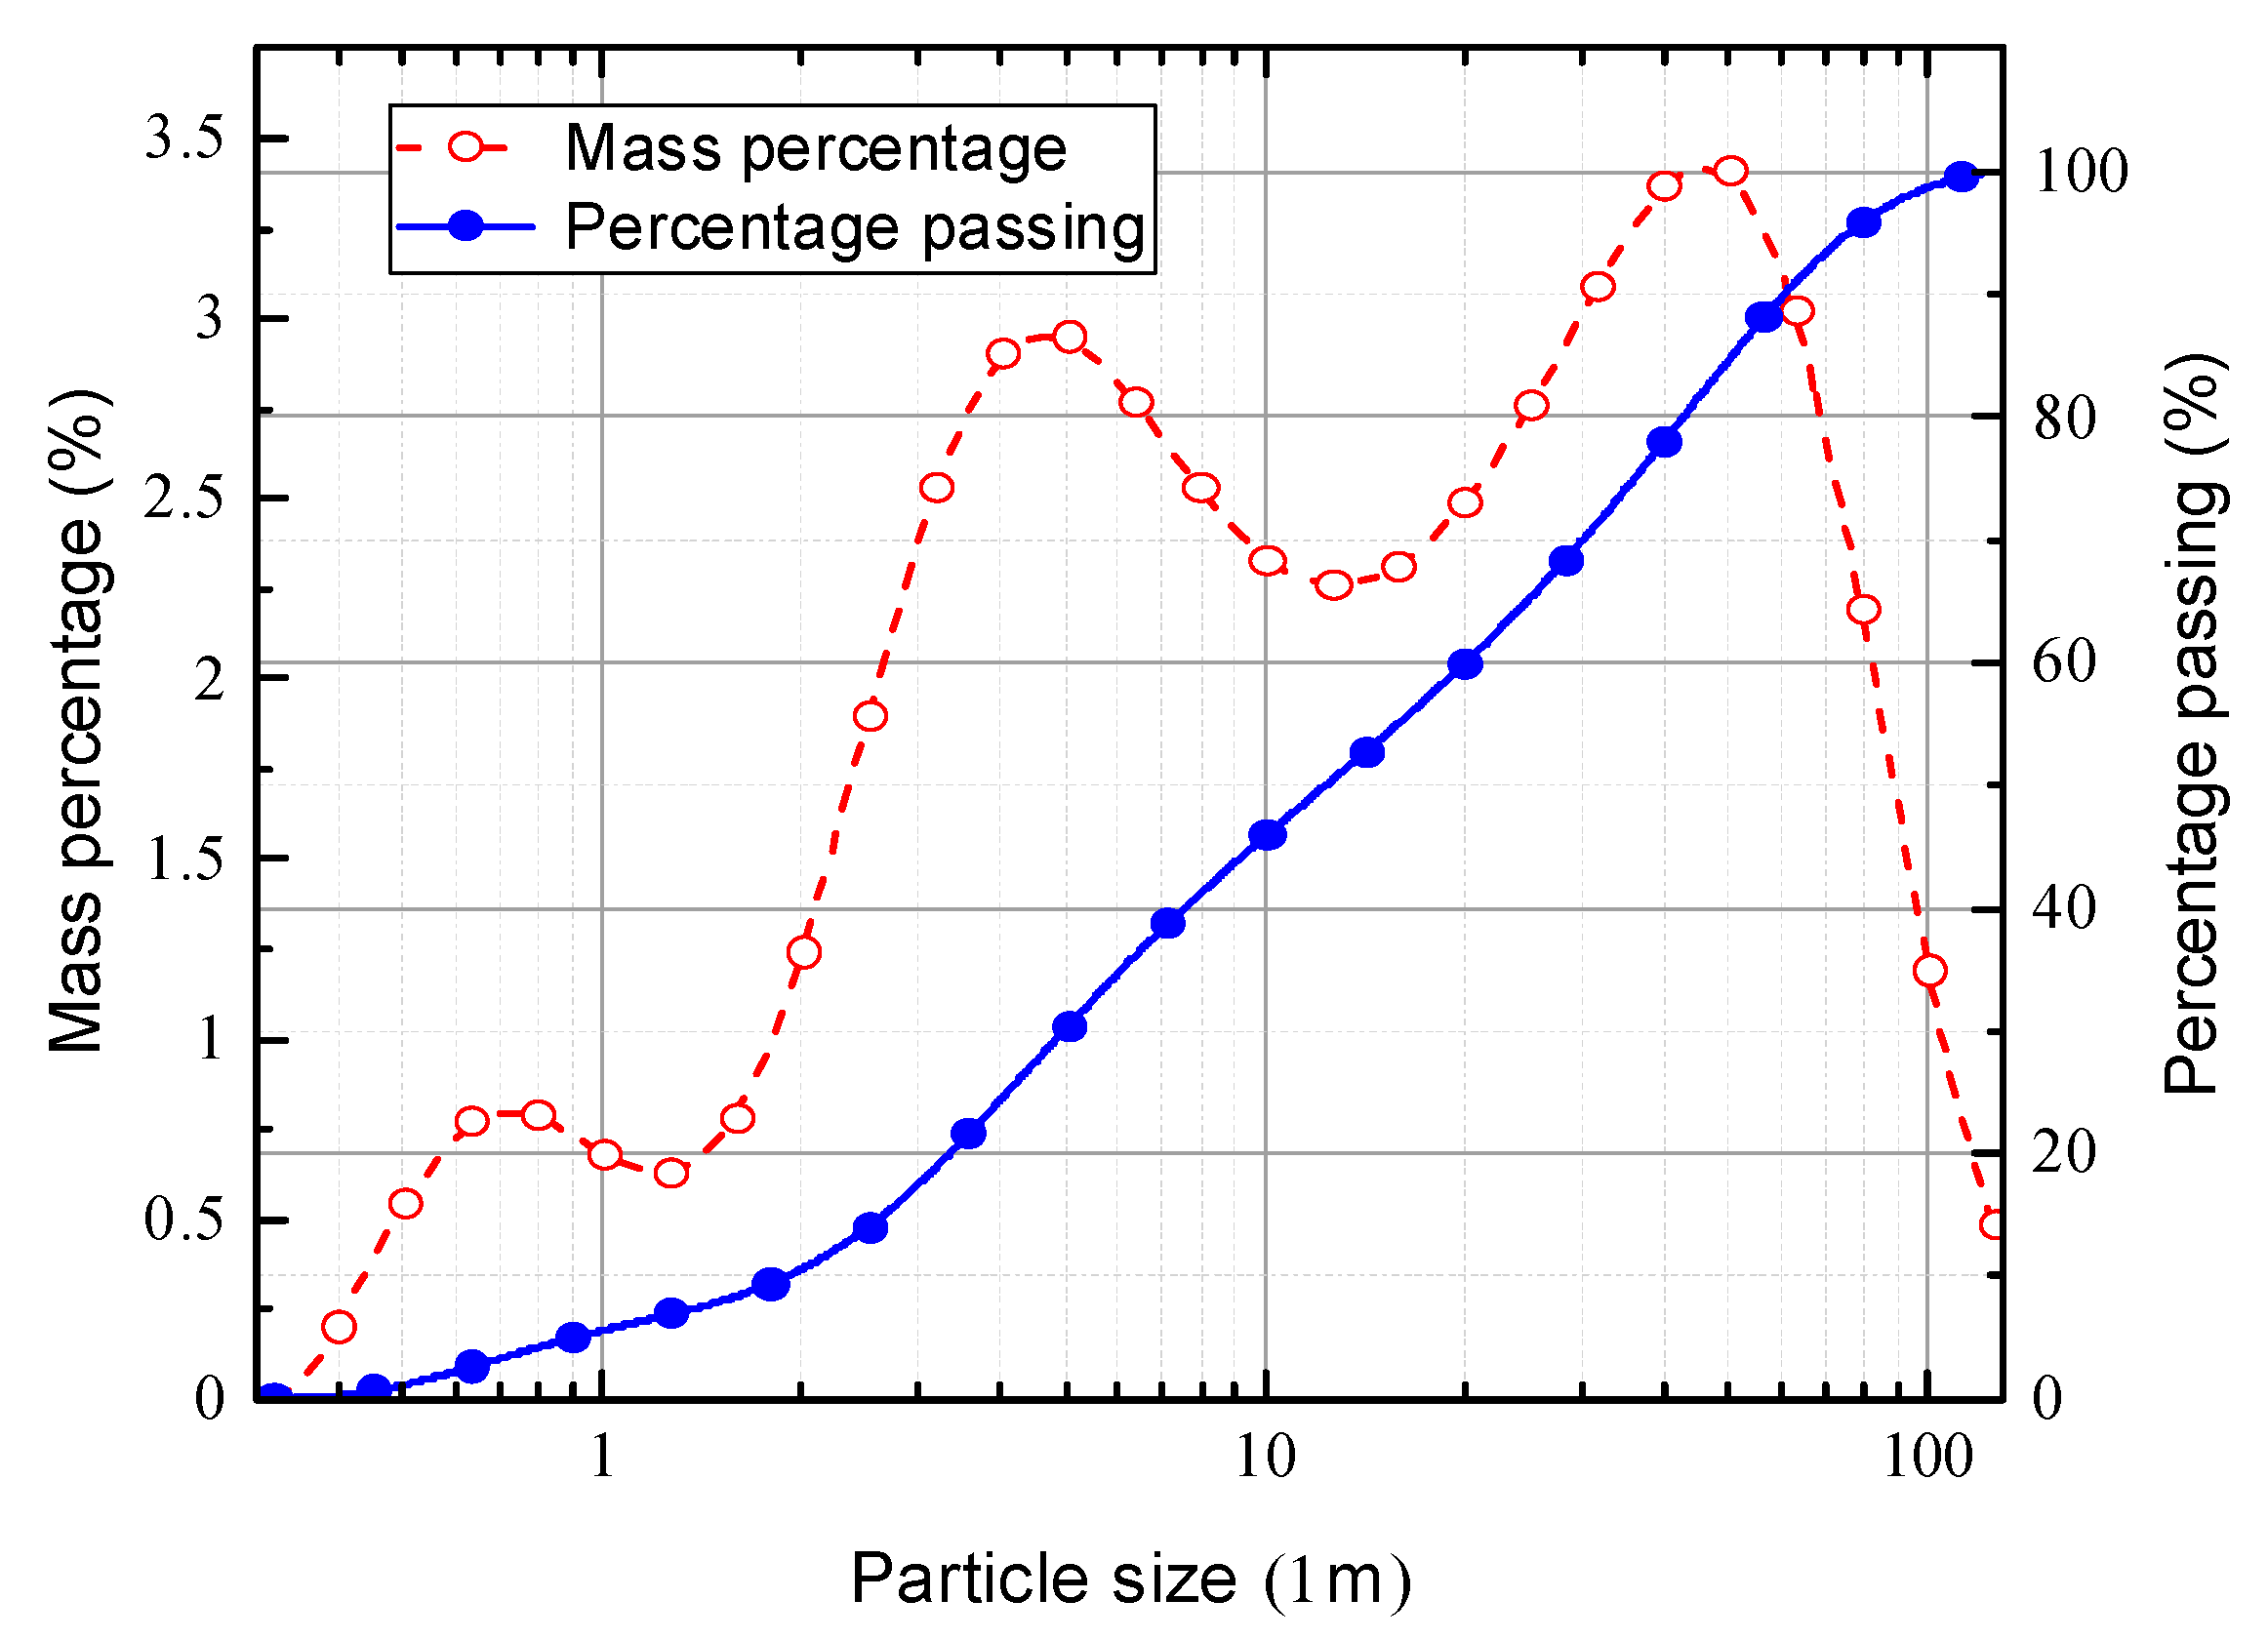
The sand utilized ias this study was calcareous sand, Fujian standard sand, and high purity quartz sand (Figure 2). The calcareous sand was obtained from islands located in the South China Sea and classified based on the unified soil classification system (USCS). The calcareous sand powder used in this study was obtained by grinding calcareous sand and passing it through a sieve with a pore size of 0.1 mm. The particle size distribution curve of the calcareous sand powder was measured with the laser particle size analyzer (Mastersize 2000) and is shown in Figure 3. The Fujian standard sand, with a particle size of 0.5–1 mm, was used as the soil material in the reinforcement area. The high purity quartz sand, with particle sizes of 0.5–1 mm and 2–4 mm, was utilized as the soil material in the non-reinforced area.

2.1.2. Bio-Cement Composition

The urease bacterium used was a species of Bacillus pasteuri found in soil and was purchased from the U.S. Culture Collection under ATCC11859. The culture medium used for growing the bacteria contained yeast extract (20 g/L), (NH4)2SO4 (10 g/L), Tris Buffer (15.75 g/L), and agar (20 g/L), which was used when preparing the solid medium. The pH of the solution was adjusted to 9.0 using NaOH. A total of 12 L bacterial solution was co-cultured with an OD600 of 0.9–1.2 and urease activity of 3.3–4.9 mM urea/min.
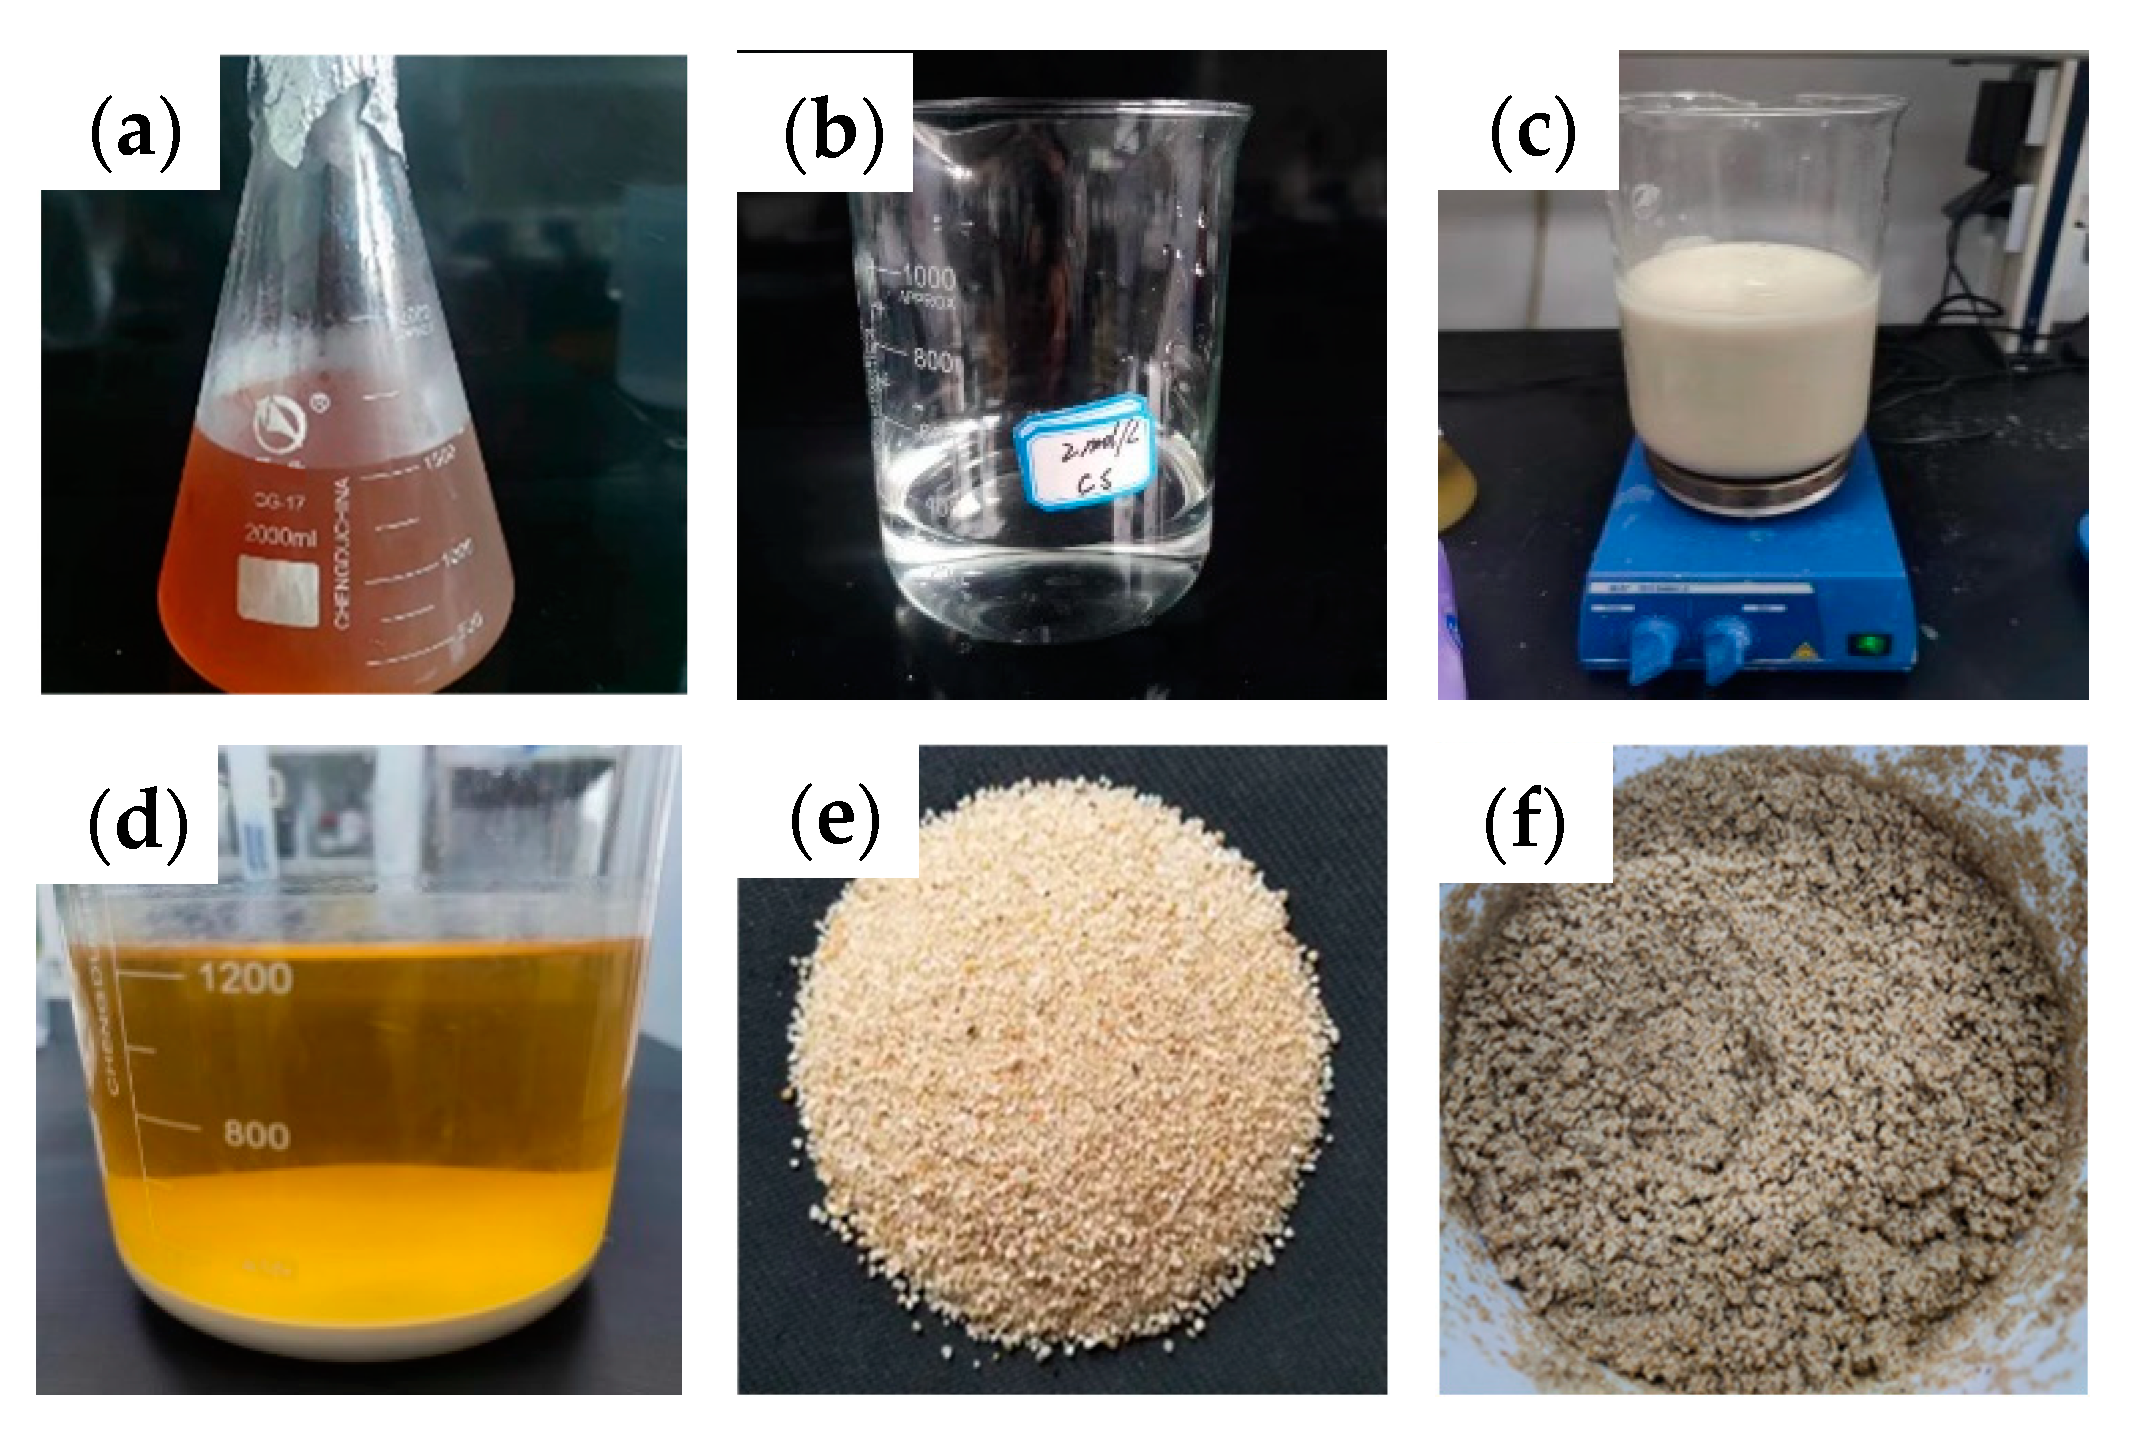
The bio-cement was prepared using the cultured bacterial solution and a mixed solution of urea and calcium chloride (CS) with a concentration of 2 mol/L. The preparation method involved placing the raw materials in a beaker in the appropriate proportions and stirring them with a mixer at a speed of 400 r/min for 12 h until the CS fully reacted in the beaker to form an active bio-cement suspension. After settling in the refrigerator at 4 °C for 6 h, the supernatant was poured off, and the remaining solid sediment in the beaker was collected as bio-cement (Figure 4).

2.2. Model Test Device and Test Procedure

2.2.1. Model Test Device

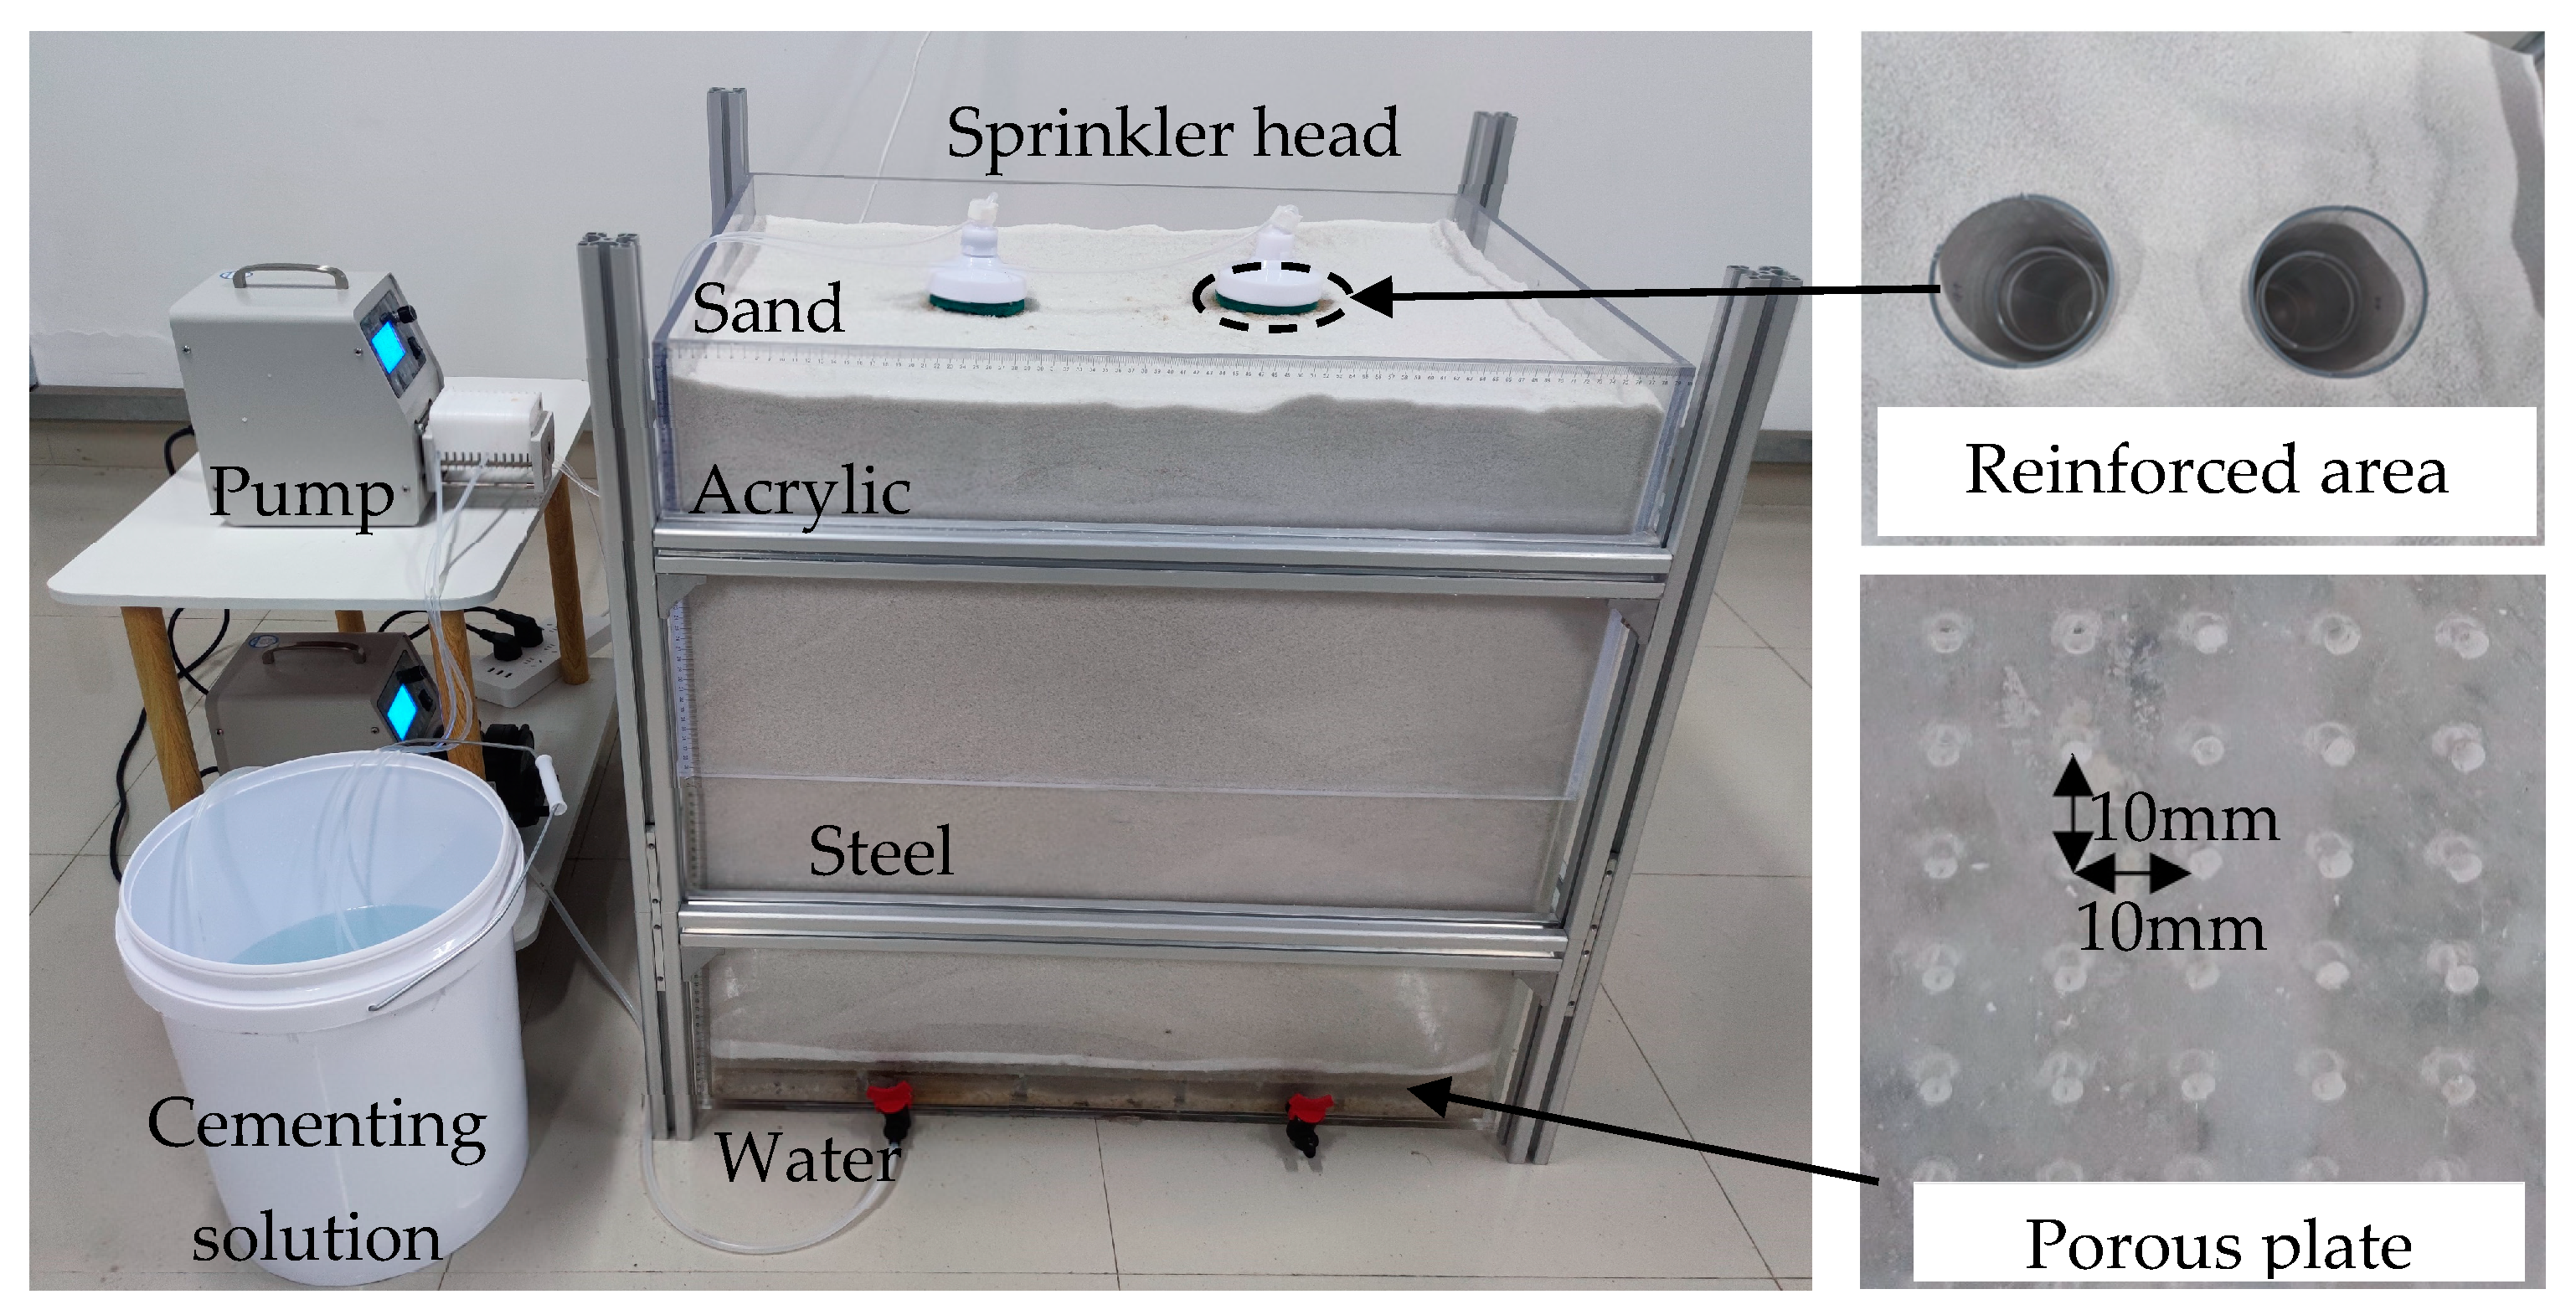
The model tank used was a cube-shaped container with a length of 800 mm, a width of 600 mm, and a height of 800 mm (Figure 5). To enhance the flow of the solution from the bottom of the tank, a porous, permeable plate was placed horizontally in the model tank, 100 mm above the base. Both Fujian standard sand and high purity quartz sand were used to emphasize the testing effect. The high purity quartz sand, with a thickness of 200 mm, was laid at the bottom of the model tank as the lower soil of the reinforcement area. Two round tube molds, with an inner diameter of 100 mm and a height of 500 mm, were placed vertically on the surface of the sand. The round tube mold and the model tank were then filled with high purity quartz sand until the upper edge of the round tube mold. The prepared bio-cement and 7500 g Fujian standard sand were mixed and poured into the mold to ensure the soil in the same seepage environment. A layer of geotextile was placed in the middle of the top to allow for even and free permeation of CS under gravity.

2.2.2. Test Procedure

Both the bio-cement infiltration method and bio-cement mixed method were used to reinforce the sand soil foundation. The reinforced area model used for the bio-cement infiltration method had a diameter of 60 mm and a height of 300 mm, and for the bio-cement mixed method had a diameter of 100 mm and a height of 500 mm.
Test procedures for the bio-cement infiltration method were as follow. First, the Fujian standard sand was poured into the model until it reached a height of 300 mm. Then, three ring knives with a diameter of 60 mm were placed equidistant from the surface of the sand soil, serving as the inflow area for the bio-cement grouting. The bio-cement was then poured into the ring knife and allowed to freely permeate into the sand soil. Afterward, the cementing solution, with a concentration of 1 mol/L, was evenly infiltrated from the surface of the sand soil by spraying using a peristaltic pump. The outflow liquid was collected for circulating grouting. The grouting duration lasted for 3 days. After completing the grouting process, the surrounding sand soil was removed. Two volume ratios of bio-cement and calcareous sand powder and two types of inflow rate were analyzed to obtain the strength improvement in the sand soil (Table 1). The CaCO3 content of the reinforced area was measured at various depths to analyze the diffusion mechanism and reinforcement effect of the bio-cement in the sand soil.
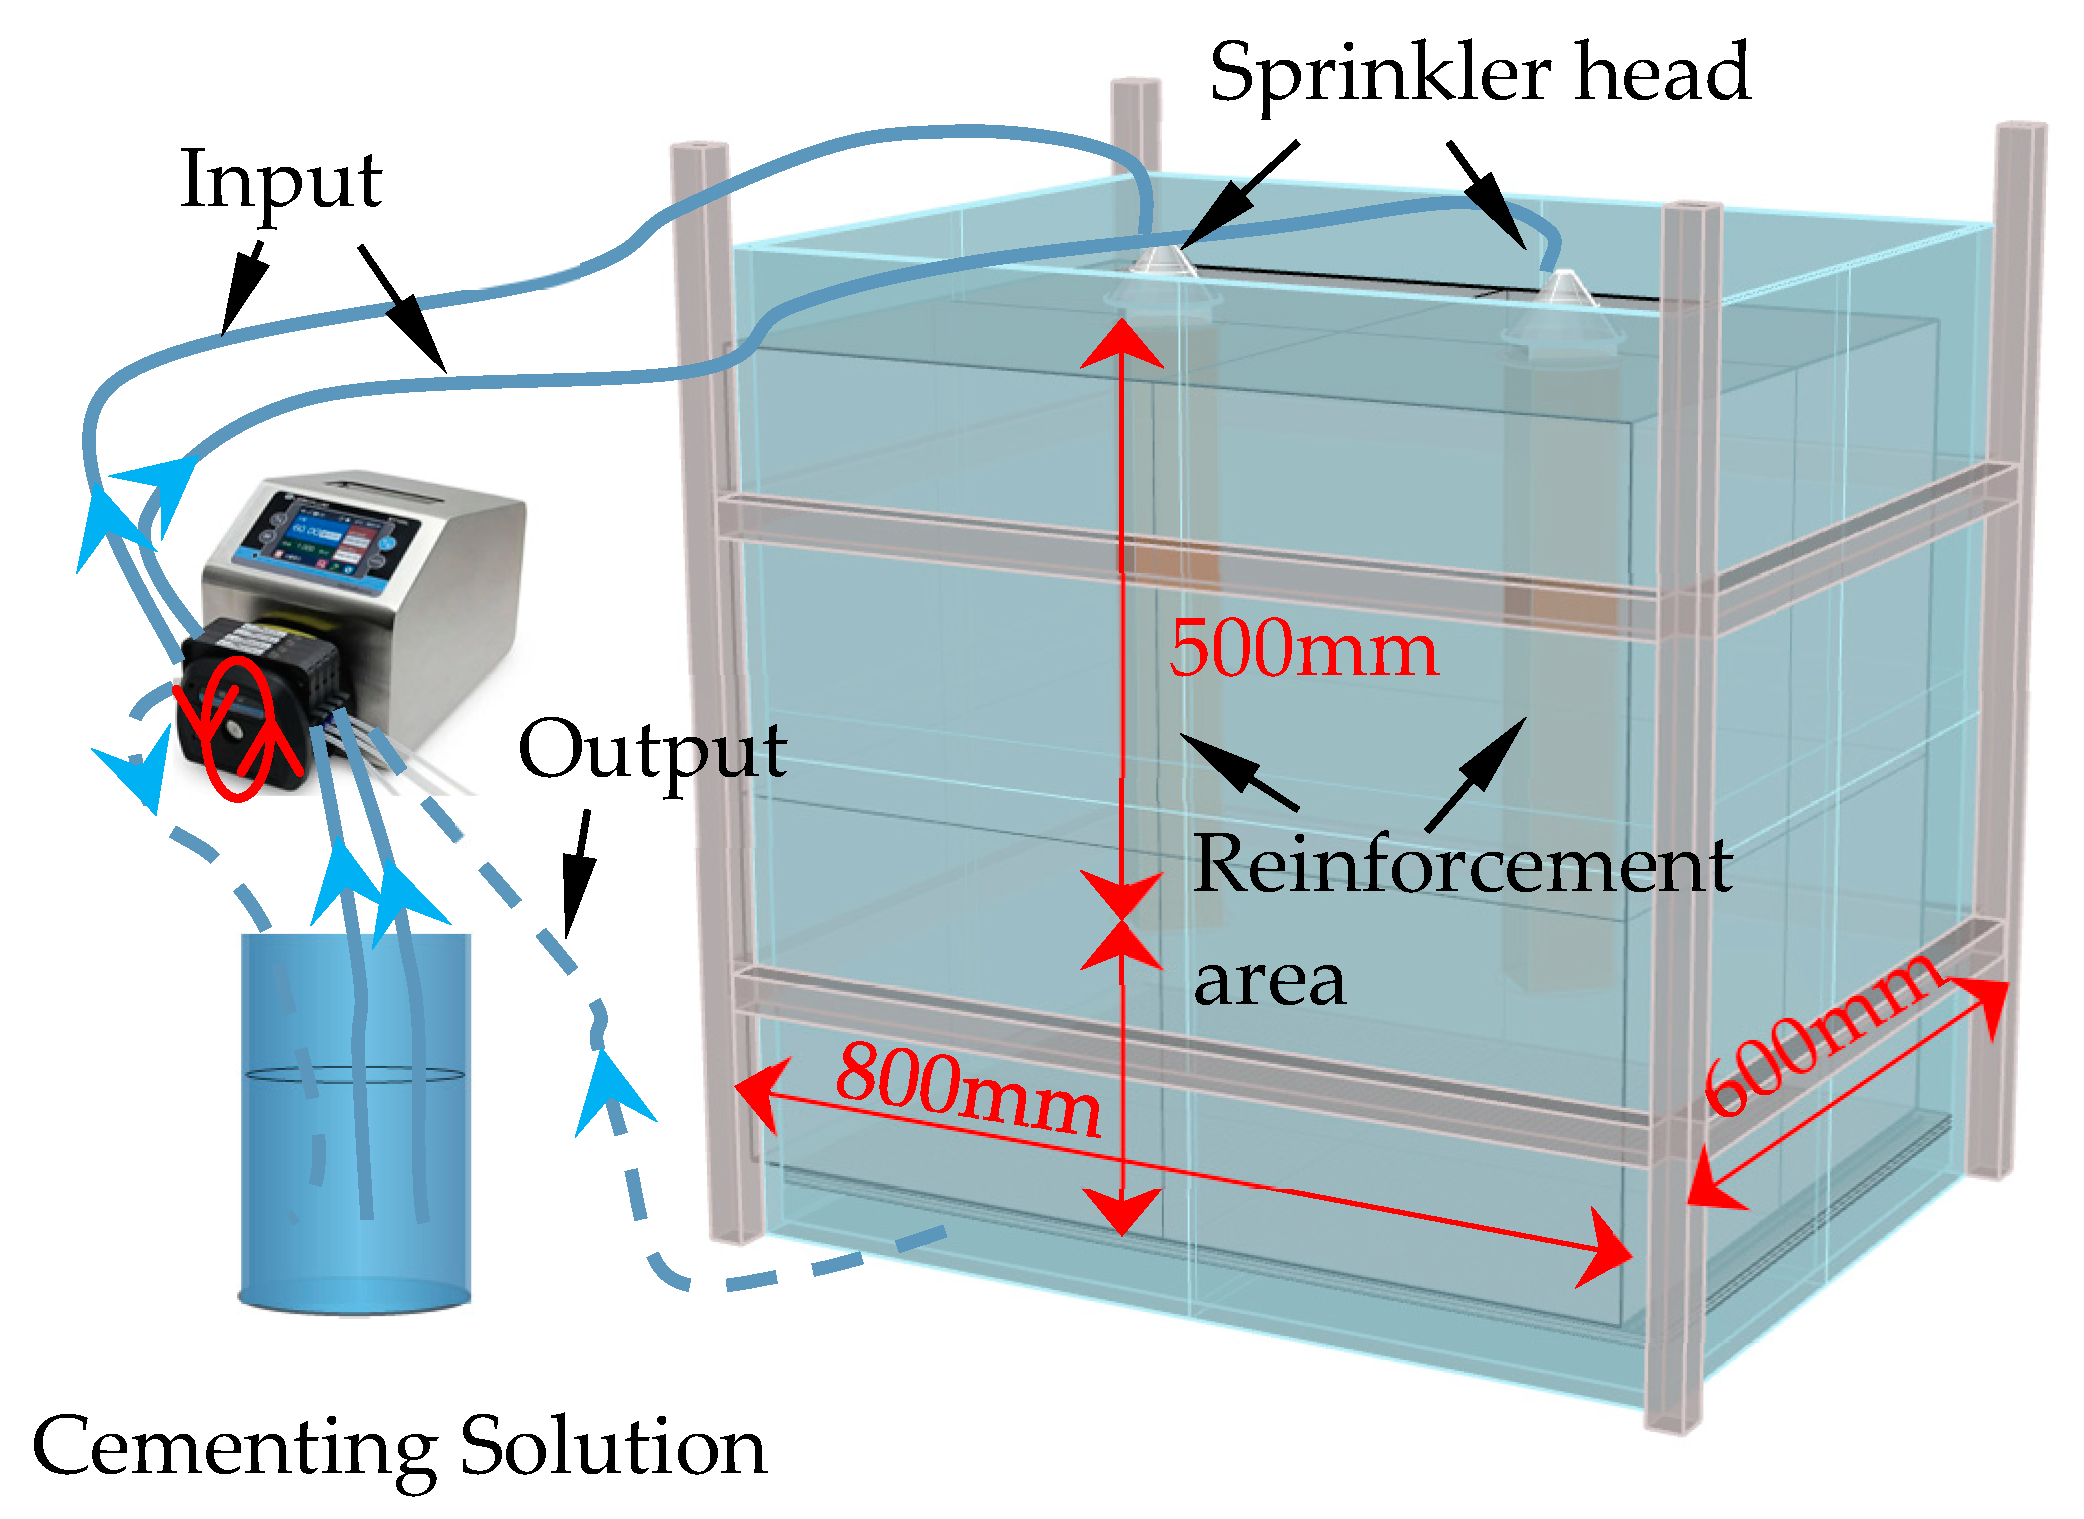
The test procedures for the bio-cement mixed method are shown in Figure 6. First, Fujian standard sand was mixed with 6 L of bacterial solution and 1.5 L of CS. The mixture was poured into the model until it reached a height of 500 mm. The CS with a concentration of 0.6 mol/L was then pumped to the top reinforcement area at a speed of 15 mL/min. The peristaltic pump had a nozzle size of 100 mm. To ensure adequate reaction of the solution, the waste water was collected and circulated using a peristaltic pump. The total grouting duration for the test was 5 days. EDTA titration was used to measure the concentration of the remaining calcium ions in the cementing fluid every 24 h to determine the consumption of calcium ions in the cementing fluid. After completion of grouting, the model sample was left for one day to discharge the CS in the sand soil. The reinforcement area was then removed from the model tank and dried in an oven at a temperature of 105 °C for 24 h. The detailed test parameters are presented in Table 2.

2.3. Unconfined Compressive Strength and CaCO3 Content Determination

The unconfined compressive strength (UCS) is a significant parameter for evaluating treatment effectiveness. The micro-penetration instrument (HCQ-2000N, Hebi Tianmuyang Biotechnology Co., Ltd, Hebi, China) was utilized to measure the UCS of the reinforcement area. The test was conducted by cutting a cubic sample with a diameter of 20 mm, and the loading rate was set at 1 mm/min.
To analyze the spatial distribution of CaCO3 crystals in the reinforcement area, the CaCO3 content was measured every 0.1 m in the vertical direction using the neutralization titration method, as described by Wu et al. [26] The sample was first dried and weighed, followed by soaking in diluted HCl (1 mol/L). After thorough stirring, the sample was cleaned, dried, and weighed again, and the CaCO3 content of the samples was then calculated. The weight loss caused by acid digestion represented the weight of the precipitated CaCO3.

2.4. Scanning Electron Microscopy Test

Scanning electron microscopy (SEM) analysis was carried out using a Sigma 500 scanning electron microscope to analyze the microstructure of CaCO3 crystals and their interaction with the sand soil particles [32,33]. Prior to the SEM analysis, the crust layer was subjected to a drying process at 105 °C for 12 h to ensure that the sand soil was completely dried. The crust layer was then crushed and coated with a conductive metal to prevent electron scattering. It has been reported by Zhang et al. [34] that the mechanical properties of soil do not significantly change below 400 °C; thus, the 105 °C drying method employed in this study did not affect the compositional, structural, and physicochemical properties of the sand soil.

3. Results and Discussion

3.1. Sand Foundation Reinforced by the Bio-Cement Infiltration Method

3.1.1. Reinforced Area and Bearing Capacity

After grouting, CaCO3 crystals were clearly found on the surface of the sand soil in the reinforced areas. The residual concentration of the calcium ions in the cementing fluid was measured at 0.08 mol/L, with a high utilization rate of 92%, indicating near-complete reaction. The reinforced areas were obtained by removing the surrounding loose sand soil (Figure 7). The sand soil, reinforced under varying grouting conditions, maintained an upright position in the model tank, indicating a strengthening effect by the bio-cement. The reinforced areas in all three conditions had a height of 300 mm, with average diameters of 70 mm, 90 mm, and 110 mm, respectively. This further indicated that the penetration range of the bio-cement into solidified sand was mainly affected by the injection velocity of the cementing solution.
The bearing capacity of sample 3 was approximately 125 N, which was significantly higher than that of samples 1 and 2. Samples 1 and 2 collapsed even under slight disturbance, indicating that the bearing capacity of the samples was mainly influenced by the amount of bio-cement used. All three samples exhibited a strength pattern of being strong at the top and weak at the bottom. Additionally, the upper portion of each sample exhibited overall density, while the bottom portion experienced considerable sand spalling after cavity formation.
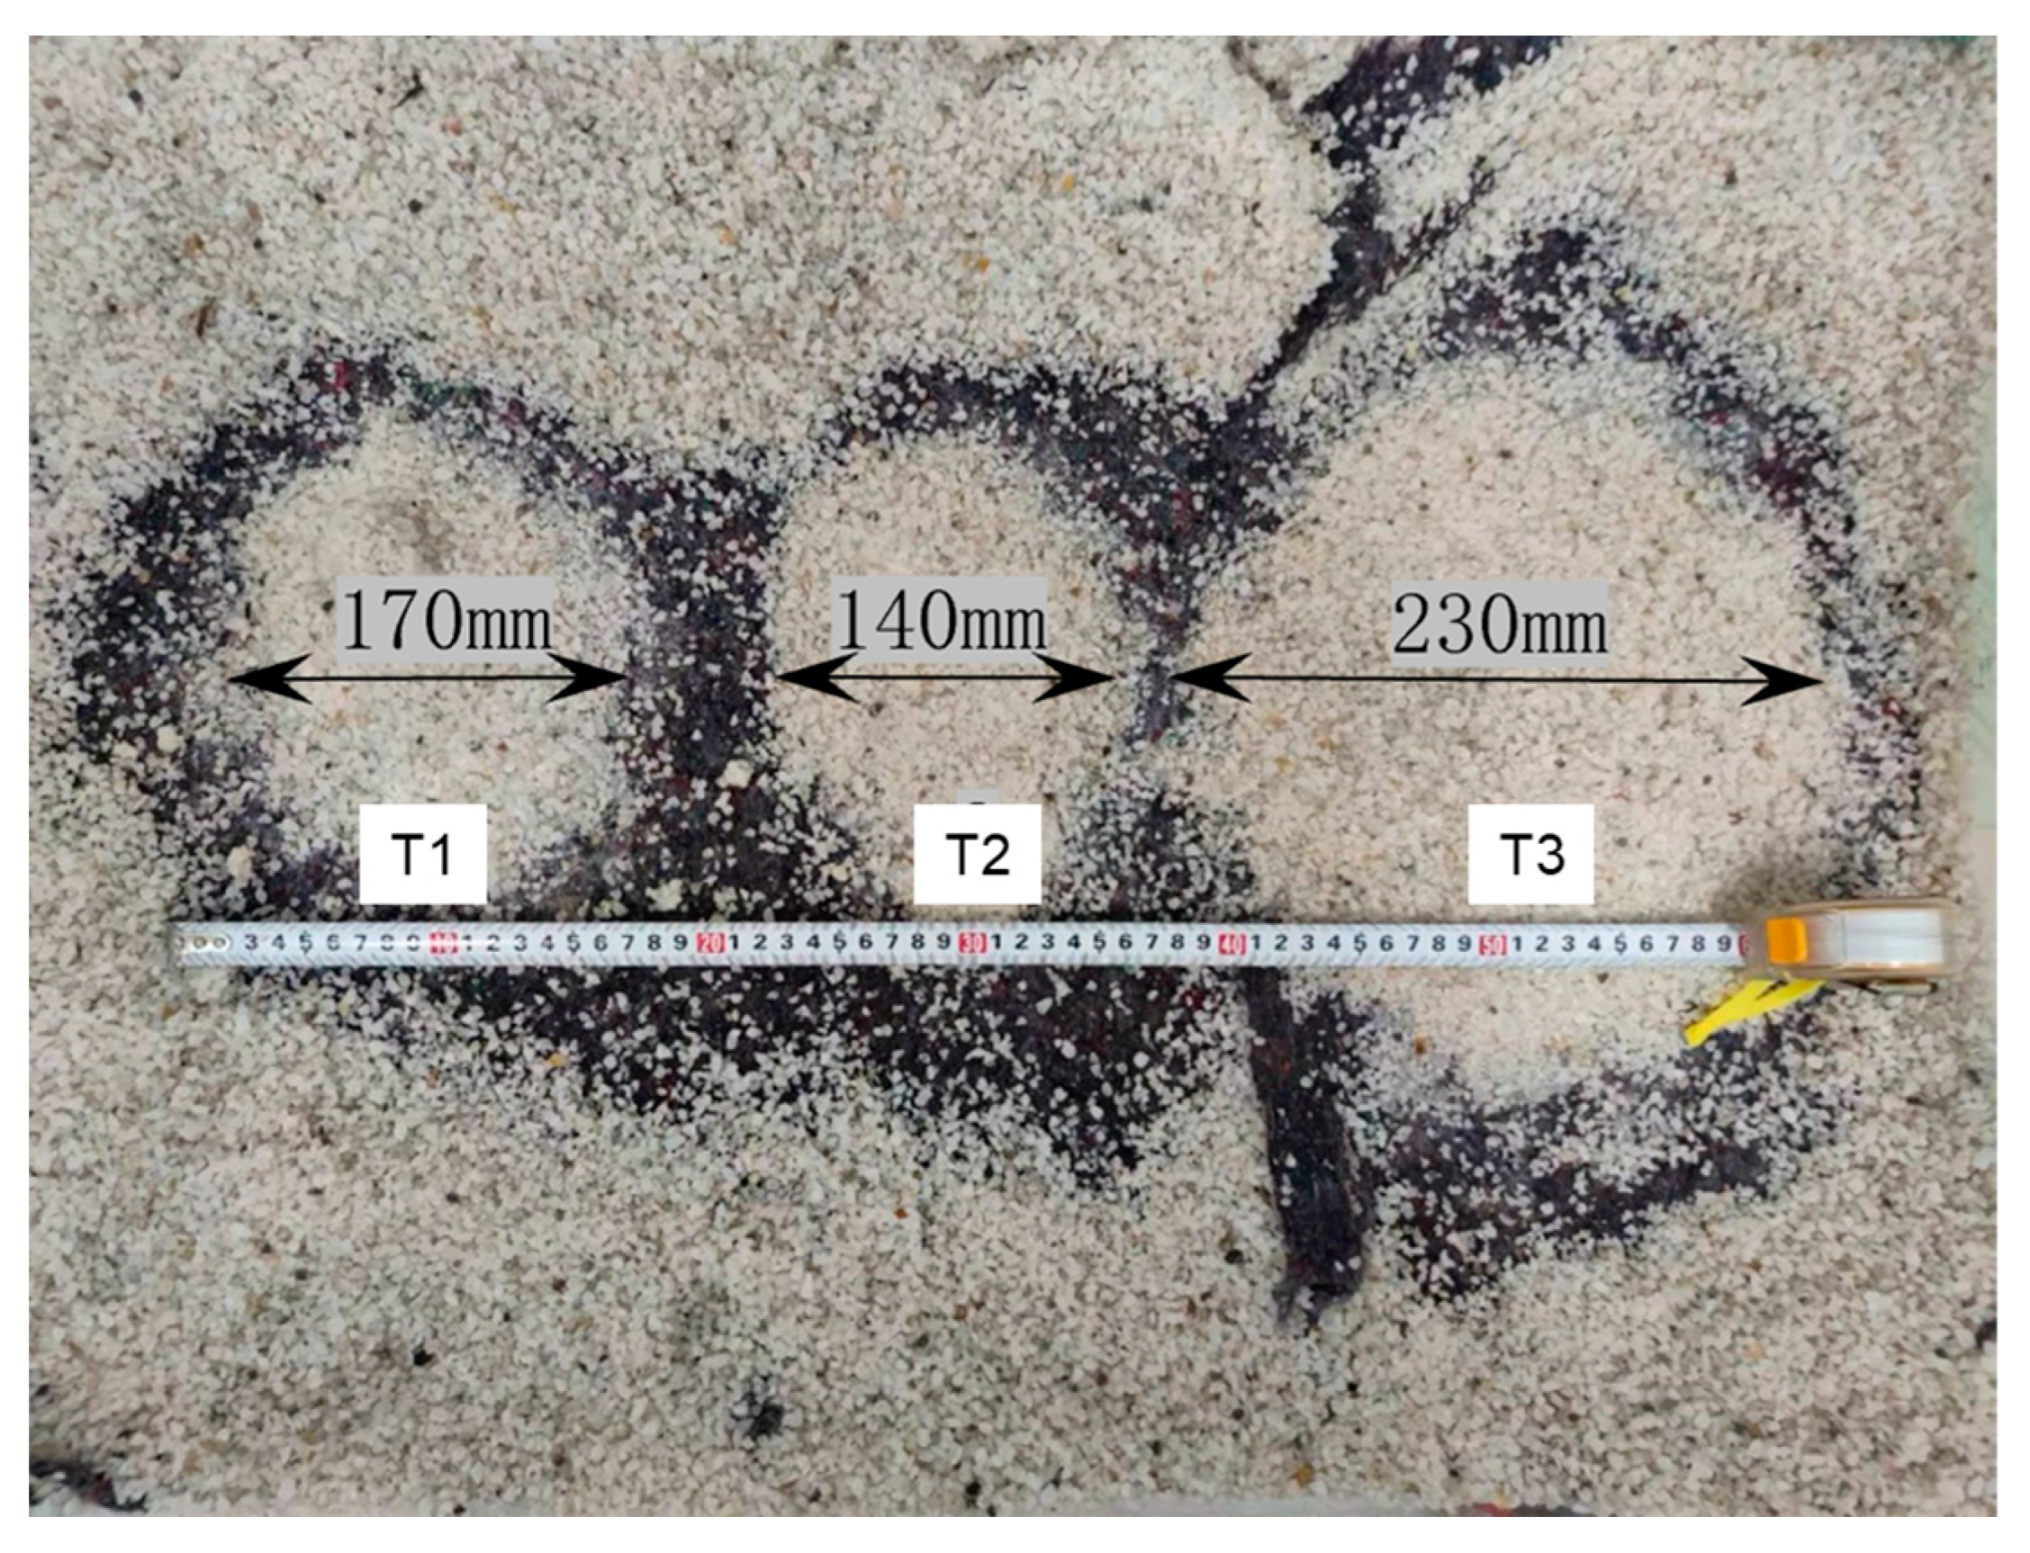
A significant expanse of consolidated sand accumulation area, containing a substantial quantity of CaCO3 deposits, was discovered at the bottom of each sample (Figure 8). The diameters of the accumulation areas, measuring 170 mm, 140 mm, and 230 mm, respectively, were significantly larger than the diameter of the top areas. This result indicated that the depth of penetration of the bio-cement was greater than the height of the model.

3.1.2. Spatial Distribution of CaCO3

The distribution of CaCO3 content in each sample along the depth direction is listed in Table 3. With the exception of the bottom accumulation area, the CaCO3 content of the samples exhibited little variation overall. Sample 1 displayed high CaCO3 content in the middle and lower values at the top and bottom areas. Conversely, the CaCO3 content of samples 2 and 3 gradually decreased along the depth direction. The reason was that the high inflow rate of the cementing solution in sample 1 led to the downward movement of the bio-cement under the action of the cementing solution. The deposition of the excess bio-cement in sample 3 at the bottom of the model tank led to a lack of CaCO3 distribution in the reinforced area.

3.2. Sand Foundation Reinforced by the Bio-Cement Mixed Method

3.2.1. Remaining CS Concentration

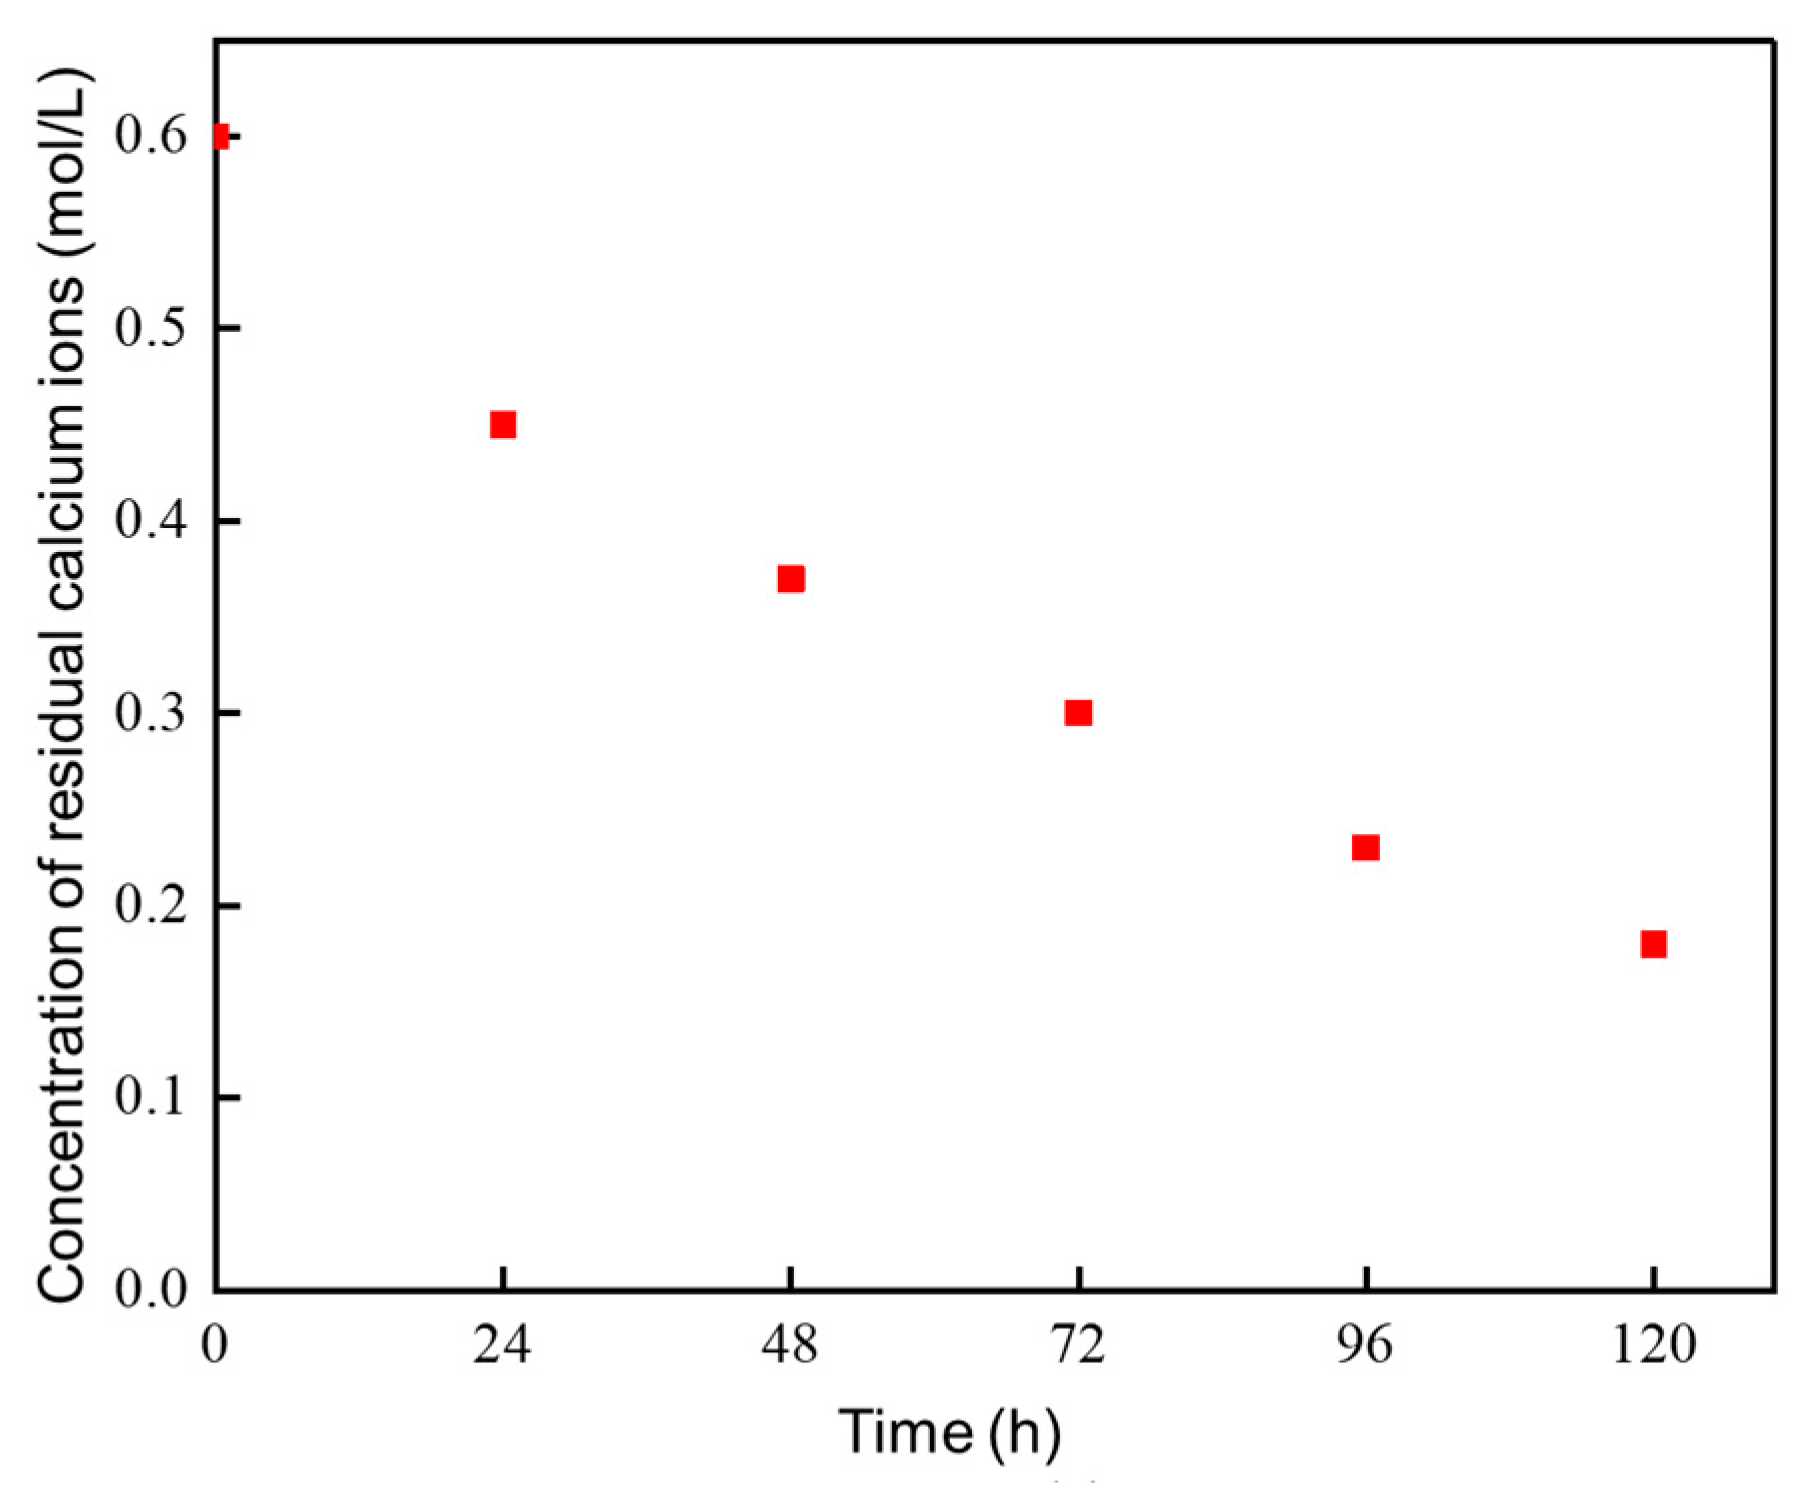
Figure 9 shows the concentration of the residual CS during the grouting process. The reaction continued 120 h after grouting, indicating that the bio-cement remained active during the test. Compared with the traditional bacterial fluid grouting method, bio-cement maximized the utilization rate of bacteria and reduced the waste caused by the loss of bacterial fluid.
At the end of the grouting, the concentration of the residual CS was approximately 30% of the initial concentration, indicating a conversion rate of approximately 70%. During the initial stage of the test, the consumption rate of CS was the fastest, but gradually slowed as the test progressed. It was observed that the bio-cement did not completely participate in the reaction within the first 3 days, which was likely due to the limited diffusion range of CS. The number of bio-cement participating in the reaction increased with the increasing diffusion range of CS. Furthermore, the introduction of additional bio-cement helped to compensate for any loss of bio-cement activity. These findings further support the notion that bio-cements remain active in sand for extended periods, even if they do not immediately participate in the reaction.

3.2.2. UCS of the Reinforced Area

Figure 10 illustrates the UCS of the reinforced area. Upon removing the loose sand, the surface of the reinforced area appeared flat, suggesting that the bio-cement did not diffuse into the surrounding sand soil. The UCS of the reinforced area exhibited a decreasing trend with increasing depth, which corresponded to the distribution of the CaCO3 content with depth. This trend could be attributed to the seepage field and bio-cement activity.
The relationship between UCS and CaCO3 content is depicted in Figure 11. The UCS demonstrated a substantial increase with increasing CaCO3 content. Furthermore, even a small amount of CaCO3 led to a high contribution to the strength, indicating that the majority of the CaCO3 crystals generated by this method played a cementation role. These results are consistent with previous studies on quartz sand treated with MICP [35]. The CaCO3 content obtained in this study was higher than that obtained by Cheng et al. [36,37,38] based on sand soil with a different saturation. Moreover, under the condition of the same CaCO3 content, the UCS of this study was also larger than the findings obtained by Cheng et al. [36,37,38]. Compared with t hebio-cement infiltration method, the bio-cement mixing method has a better reinforcement effect, but its process is more complicated. Therefore, in practical applications, the selection between the two methods can be based on the specific requirements for ground permeability and reinforcement strength. Additionally, the results of the UCS tests demonstrate promising prospects for the proposed soil reinforcement method. However, certain challenges must be addressed before its implementation in engineering, including the release of ammonium ions. Some researchers have made advancements in this area through denitrification or struvite, but additional research is still required [39,40].

3.2.3. Spatial Distribution of CaCO3

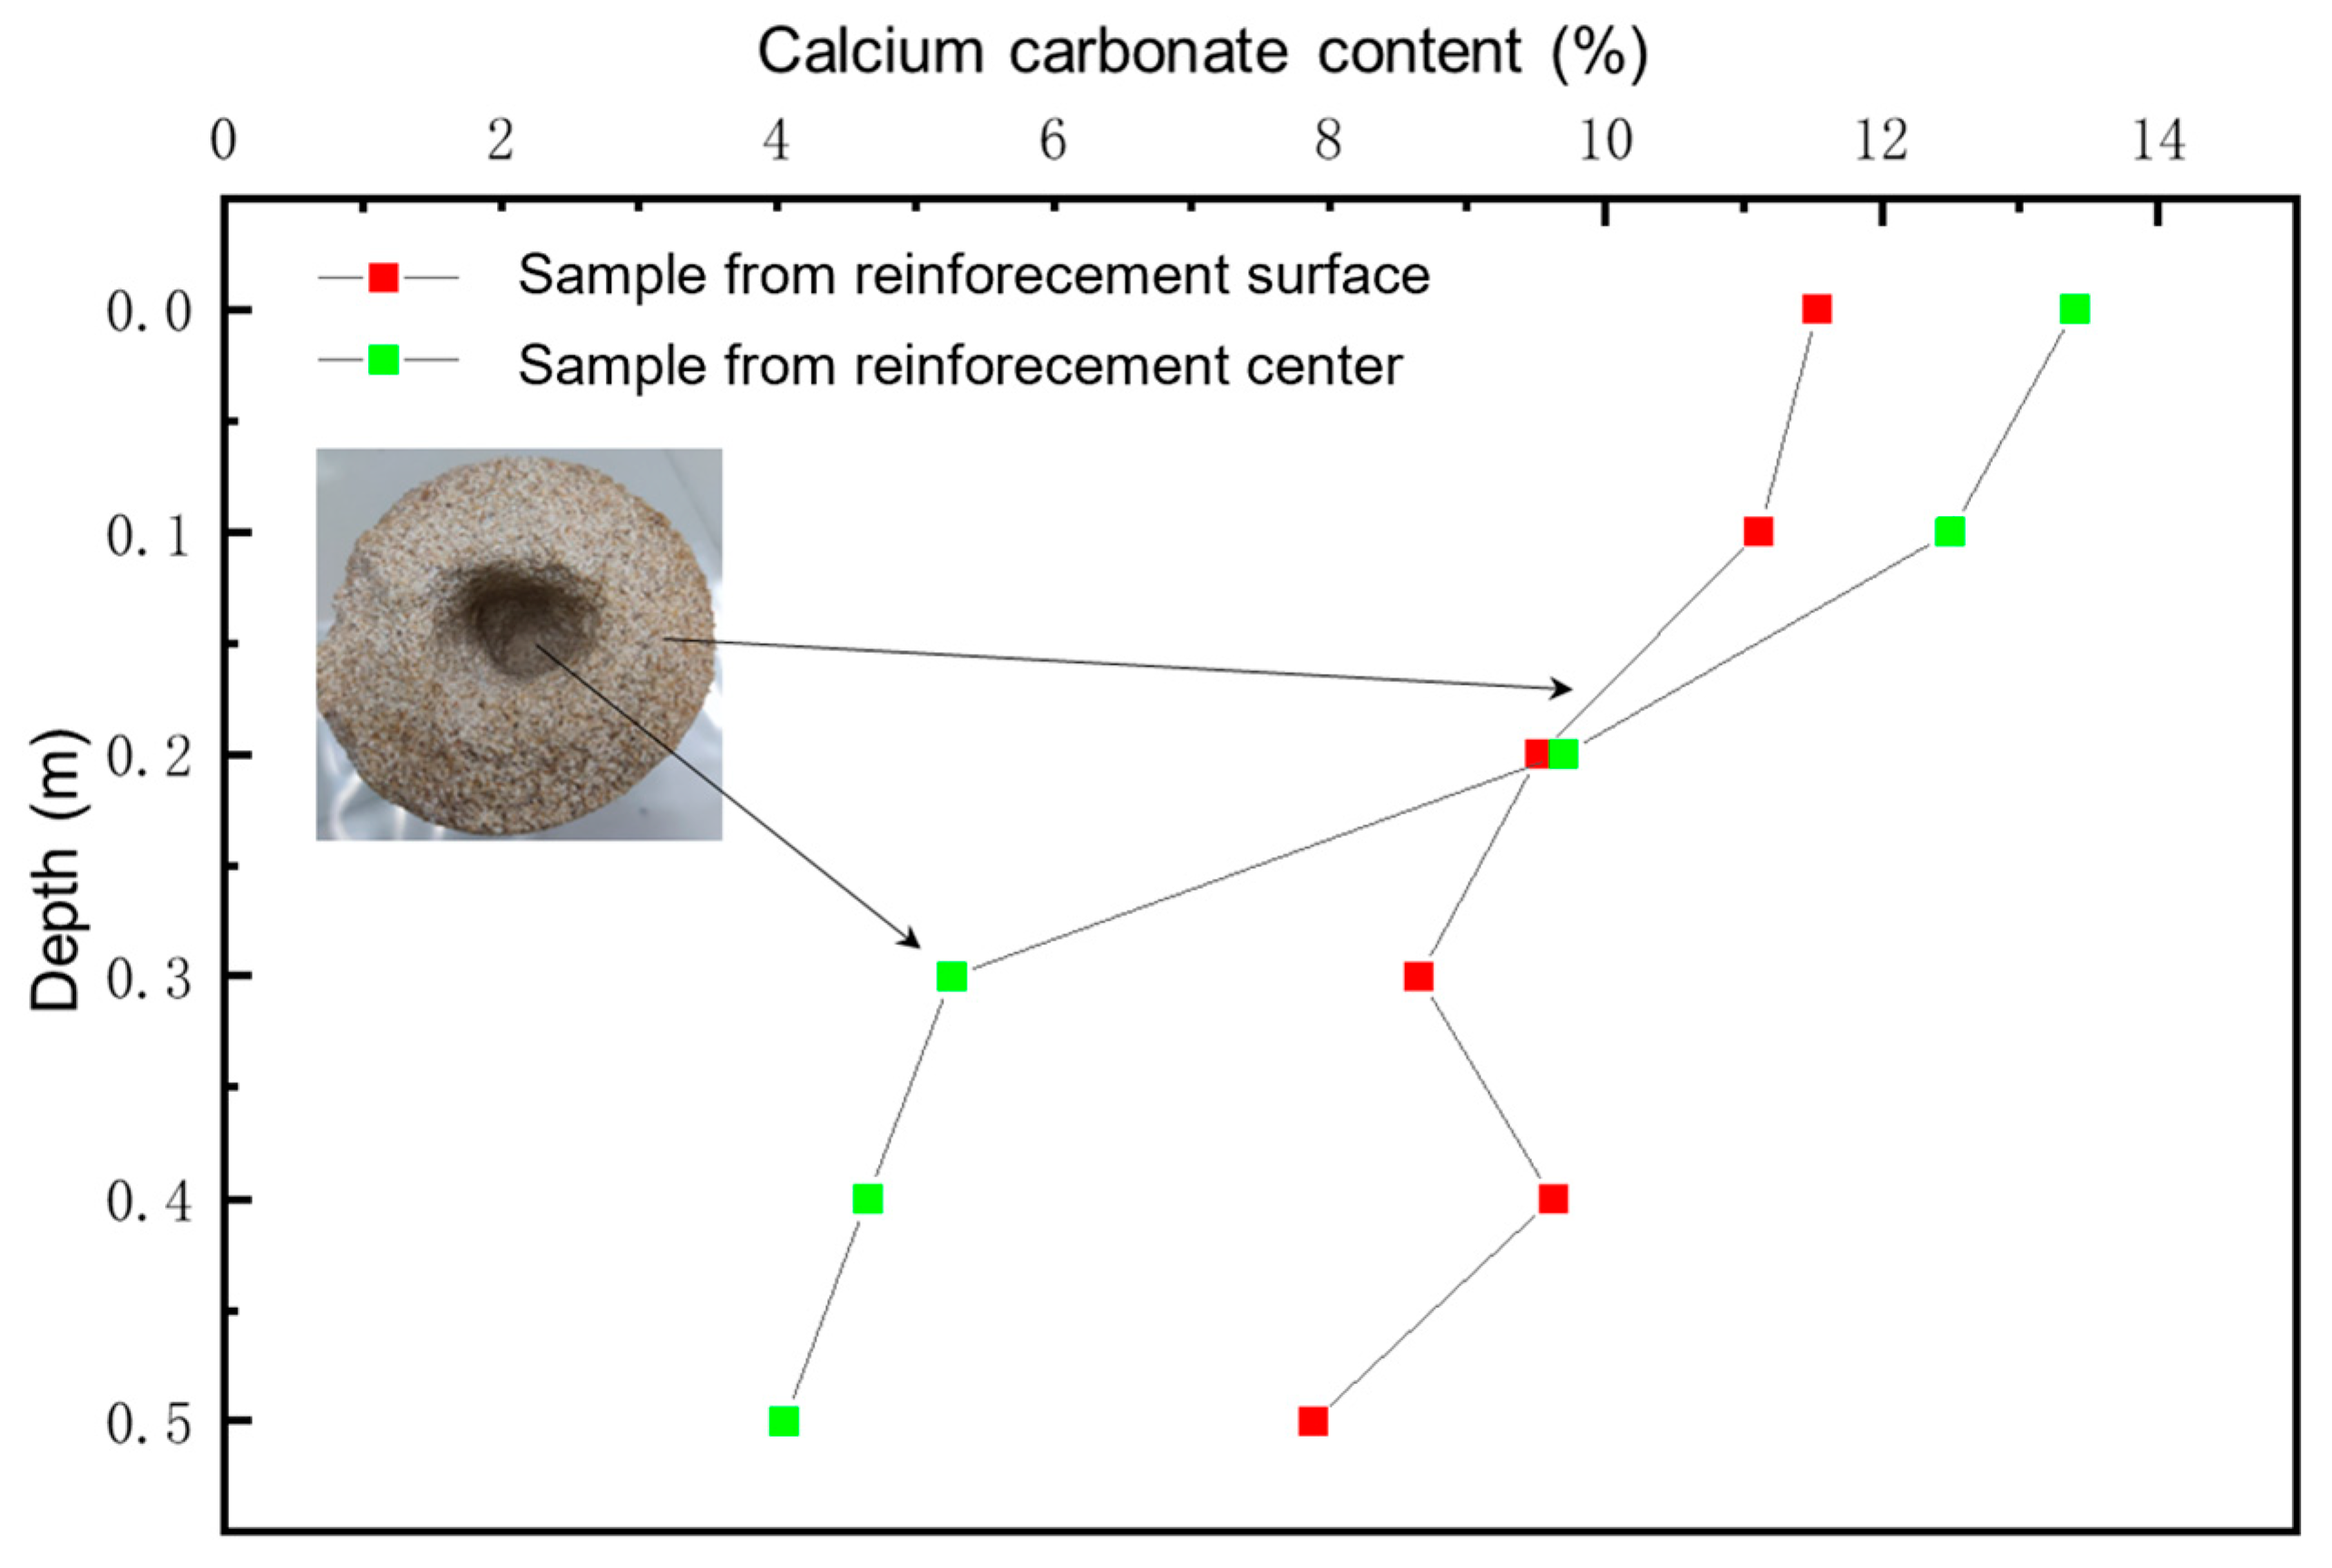
The CaCO3 content at the center and surface of the reinforcement area is shown in Figure 12. The CaCO3 content decreased gradually along the depth. Specifically, the CaCO3 content at the bottom surface of the reinforcement area was approximately 68% of that at the top surface, while the CaCO3 content at the bottom center of the reinforcement area was only about 30% of that at the top center. Prior to the injection of CS, the CaCO3 content of the sand soil was 4%. Upon grouting, the CaCO3 content generated at the bottom surface accounted for approximately 51% of that generated at the top surface, while the CaCO3 content generated at the bottom center accounted for only 0.6% of that generated at the top center. These findings indicate that there was a negligible amount of CaCO3 crystal generated at the deep center of the reinforcement area.
The reduction of CaCO3 content exhibited significant variation along the depth of the reinforcement area. Specifically, in the upper part of the reinforcement area within a depth range of approximately 0.1 m, the CaCO3 content only reduced by 12%. However, in the depth range of 0.1 m to 0.3 m, the CaCO3 content at the surface and center of the reinforcement area reduced by 67% and 77%, respectively. In the depth range of 0.3 m to 0.5 m, the CaCO3 content at the outer surface and center of the reinforcement area reduced by 21% and 11%, respectively. These findings suggest that the reduction in CaCO3 content primarily occurred in the deep central part of the reinforcement area.
The distribution of CaCO3 in the reinforcement area was primarily influenced by the seepage characteristics of the sand and the activity of the bio-cement. During the test, the bio-cement and sand soil were mixed and compacted before being poured into the mold, resulting in a lower permeability of the sand in the reinforced area compared to the surrounding area. Consequently, CS preferentially flowed to the high-permeability area around the reinforced region. The bio-cement in the upper part reacted and decreased the concentration of CS flowing downward, leading to the lower CaCO3 content in the lower part of the reinforced area than that in the upper part. Additionally, CS was directly captured by the bio-cement on the outer surface of the reinforcement area during the seepage process. Therefore, the CaCO3 content of the outer surface of the reinforcement area was higher than that of the center at a deeper depth.

3.2.4. Microscopic Cementation Mechanism

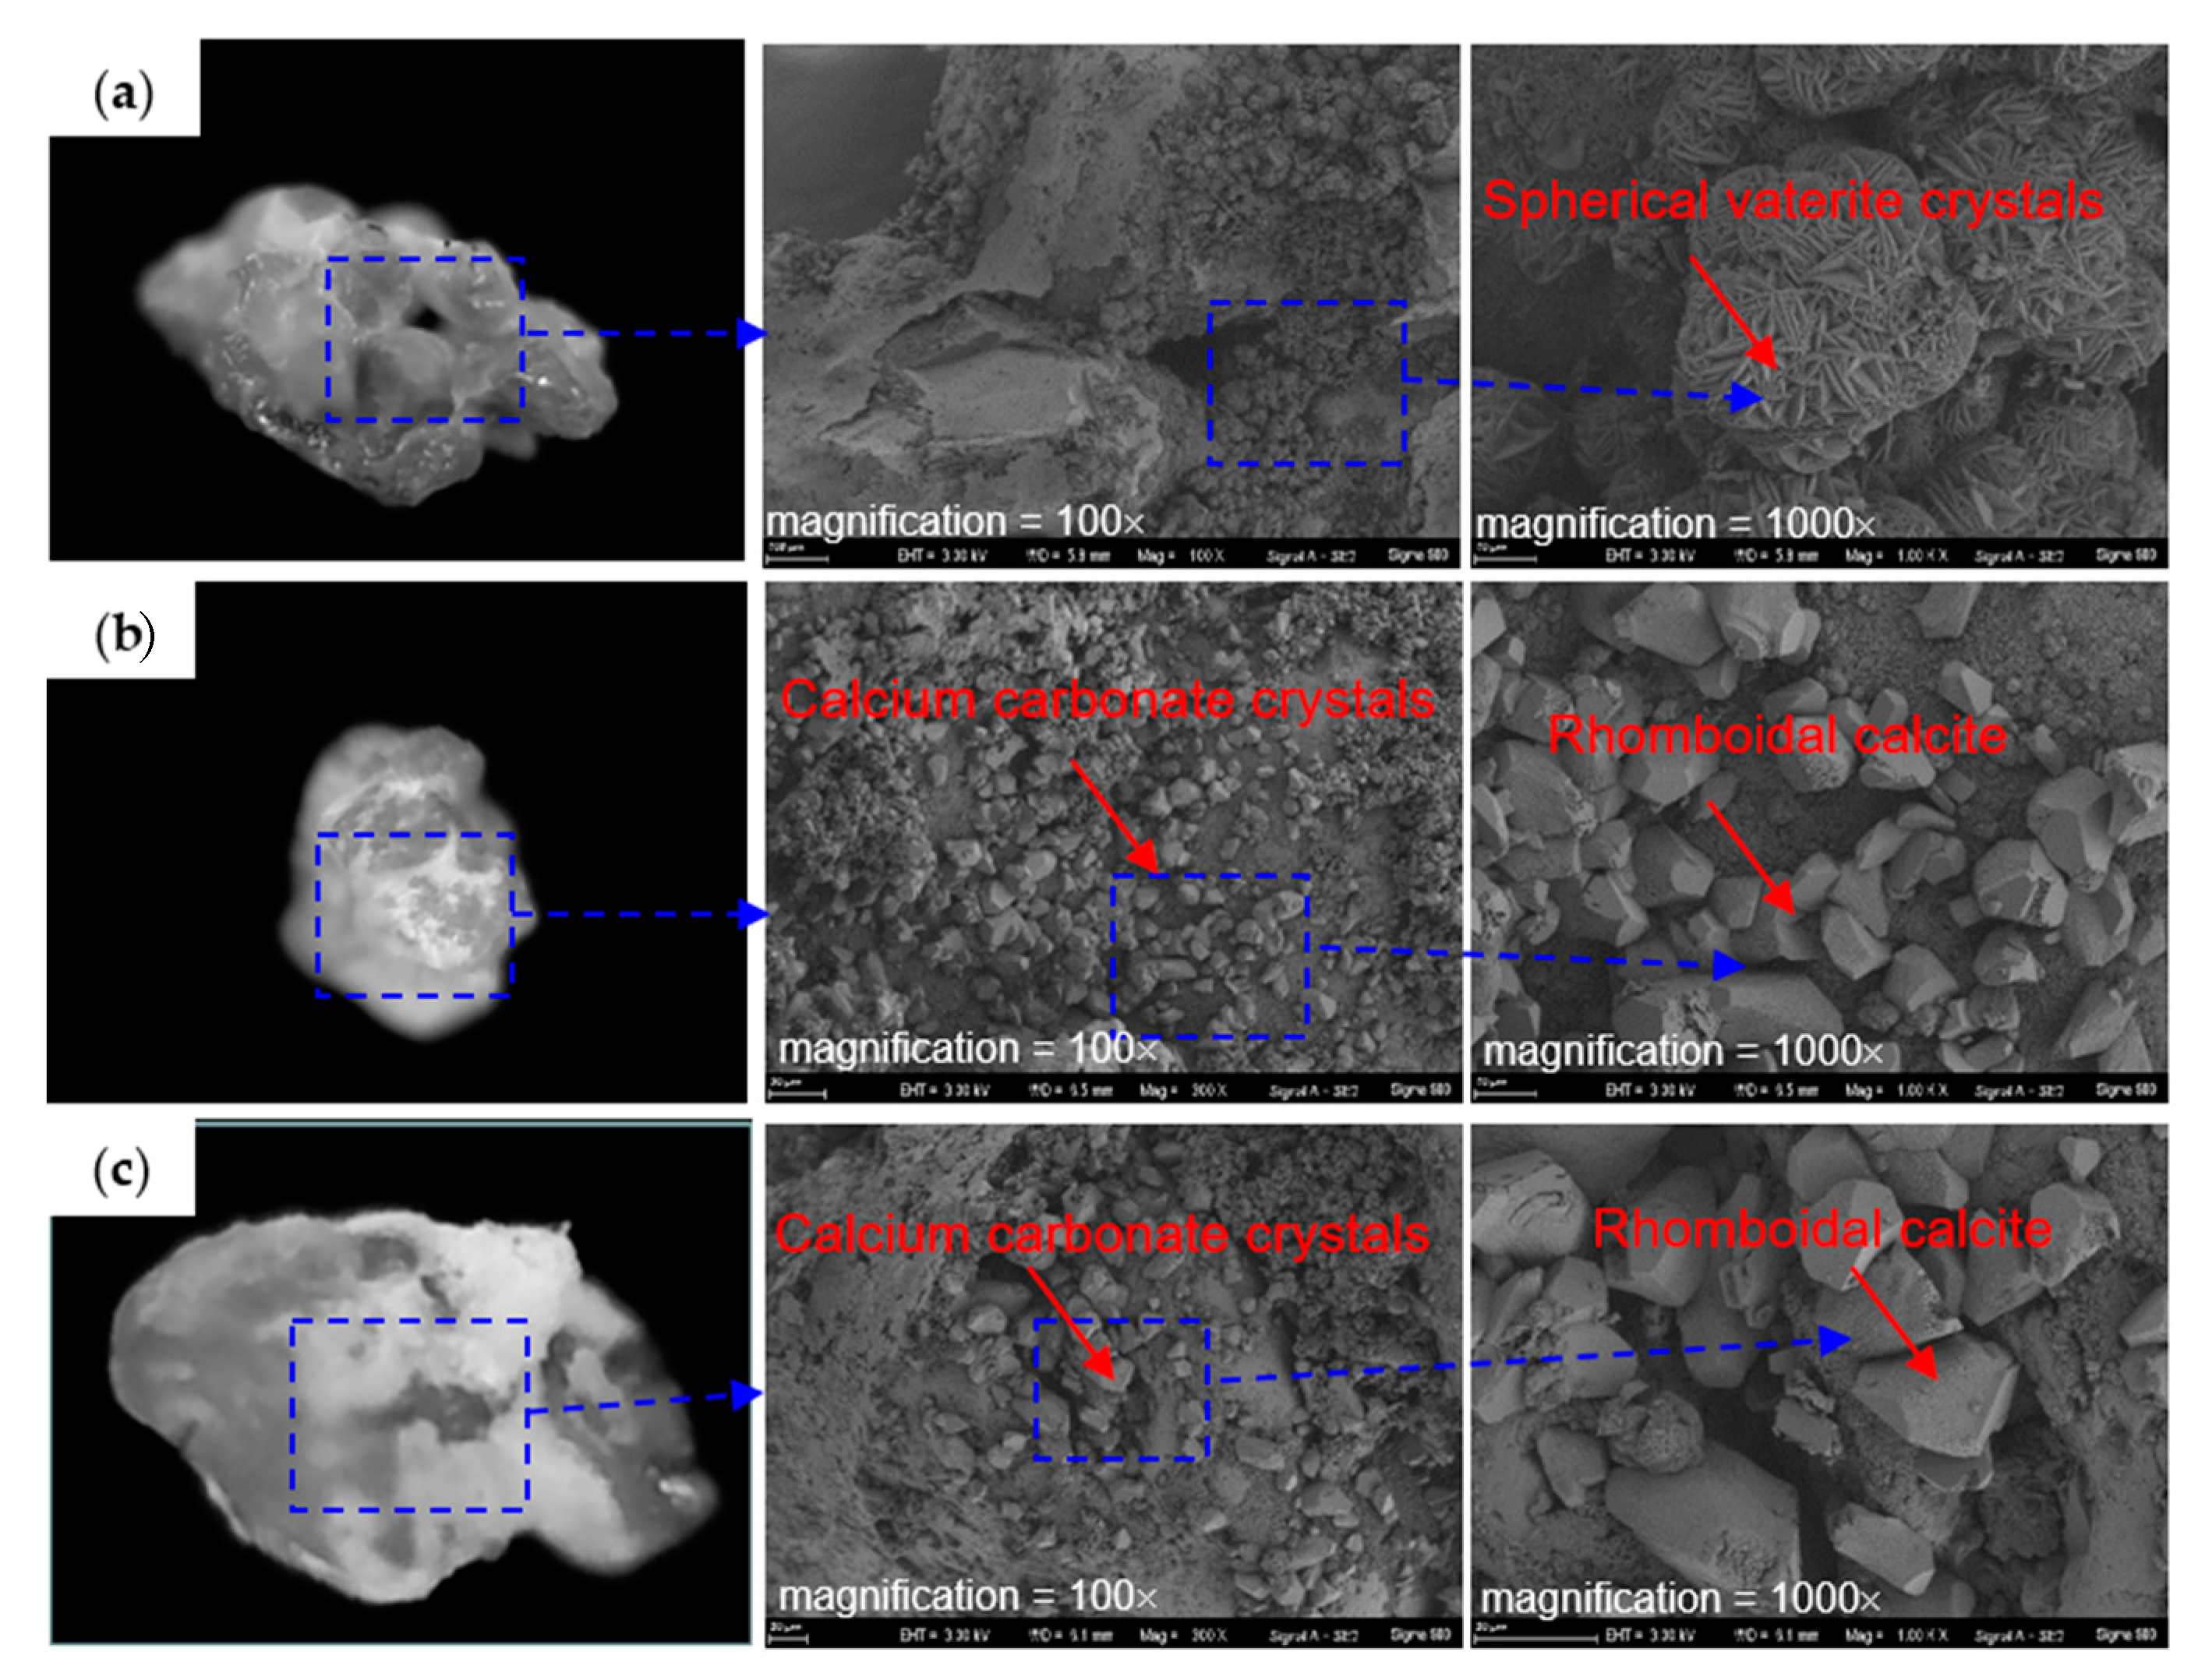
The SEM images of deposition of CaCO3 crystals on the particles and the microstructure of the crystals are shown in Figure 13. The bright area in the cemented particle diagram represented CaCO3 crystals, while the dark area represented the sand surface. The deposition of CaCO3 crystals occurred mainly at the contact points of particles and grew outward from the contact point of particles. Relatively fewer CaCO3 crystals were deposited on the surface of particles due to the preferential flow of CS into the pore throats under the influence of capillary action. This provided a favorable liquid environment and sufficient solute supply for the reaction, leading to the accumulation of CaCO3 crystals at the pore throats. The CaCO3 crystals formed in porous media was divided into two types depending on their location: cementing crystals and filling crystals. Cementing crystals bound sand particles together, effectively improving the strength of the granular porous media materials. Filling crystals, however, primarily served to fill pores, making a smaller contribution to the strength of the granular porous media materials. Therefore, it is desirable to generate more cementing crystals and reduce the formation of filling crystals during the reinforcement process.
The crystals produced through bio-cement treatment consisted mainly of spherical vaterite crystals and rhomboidal calcite (Figure 13). The spherical vaterite crystals were mainly observed in the upper part of the reinforcement area. The rhomboidal calcite with size of about 5–20 μm was mainly observed in the middle and lower parts of the reinforcement area. Previous research results showed that the morphology of crystals is influenced by the concentration of cement liquid [41]. In this study, the concentration of CS was highest in the upper part and decreased with increasing depth. Moreover, there were more spherical crystals at the contact points between particles, as the supply of CS was greater at these points compared to other locations.

4. Conclusions

In this study, the bio-cement infiltration method and bio-cement mixed method for enhancing the strength of sand soil foundations was investigated through model tests. The unconfined compressive strength (UCS), distribution of CaCO3 content, and microstructural characteristics of the cemented particles were analyzed. Furthermore, the reinforcement mechanism of the sand foundation during the reinforcement process was also examined. The main conclusions are as follow:
(1)
The utilization rate of bacterial liquid was maximized, and waste caused by bacteria loss was reduced by the bio-cement, as compared to traditional methods. The bio-cement exhibited long-lasting urease activity of about 5 days and negligible diffusion into the surrounding sand soil.
(2)
The sand soil reinforced by the bio-cement infiltration method formed a vertically reinforced area, but the bearing capacity of the reinforced area was small. Both the size of the reinforced area and bearing capacity were controlled by the volume ratio of the bio-cement and calcareous sand powder and the inflow rate.
(3)
The UCS of the reinforced area formed by the bio-cement mixed method decreased gradually from 3.44 MPa to 0.88 MPa with depth due to a decrease in the supply of CS from the top to the bottom. Furthermore, the UCS increased with increasing CaCO3 content, indicating that most of the formed CaCO3 crystals had cementation effects.
(4)
The CaCO3 crystals were primarily concentrated at the contact points between particles, with most of the crystals appearing as polyhedral shapes. The CaCO3 content decreased with depth, particularly in the central deep part of the reinforcement area.
Although this paper has made some achievements in using bio-cement to strengthen the sand foundation, the actual foundation environment is more complex. In practical engineering, soil typically consists of particles of varying sizes. Consequently, future studies should account for a broader range of realistic working conditions.

Author Contributions

Methodology, D.S.; software, Z.S.; investigation, R.Z.; data curation, R.Z.; writing—original draft, J.S.; writing—review & editing, C.W.; visualization, Z.S. All authors have read and agreed to the published version of the manuscript.

Funding

This research was funded by the National Natural Science Foundation of China (No. 42177141).

Institutional Review Board Statement

Not applicable.

Informed Consent Statement

Not applicable.

Data Availability Statement

Not applicable.

Conflicts of Interest

The authors declare no conflict of interest.

References

  1. Wang, X.; Zhu, C.Q.; Wang, X.Z.; Qin, Y. Study of Dilatancy Behaviors of Calcareous Soils in a Triaxial Test. Mar. Georesources Geotechnol. 2019, 37, 1057–1070. [Google Scholar] [CrossRef]
  2. Vahdani, S.; Pyke, R.; Siriprusanen, U. Liquefaction of Calcareous Sands and Lateral Spreading Experienced in Guam as a Result of the 1993 Guam Earthquake (Technical Report); NCEE: Washington, DC, USA, 1994. [Google Scholar]
  3. LaVielle, T.H. Liquefaction Susceptibility of Uncemented Calcareous Sands from Puerto Rico by Cyclic Triaxial Testing; Virginia Polytechnic Institute and State University: Blacksburg, VA, USA, 2008. [Google Scholar]
  4. Li, Z.Q.; Ma, X.D.; Kong, X.Z.; Saar, M.O.; Vogler, D. Permeability evolution during pressure-controlled shear slip in saw-cut and natural granite fractures. Rock Mech. Bull. 2023, 2, 100027. [Google Scholar] [CrossRef]
  5. Ronalds, B.; Cole, G. Development of Piled Foundation Bias Factors in the Arabian Gulf; CSIRO: Hobart, Australia, 2005; pp. 1–10. [Google Scholar]
  6. Montoya, B.M.; DeJong, J.T. Stress-strain behavior of sands cemented by microbially induced calcite precipitation. J. Geotech. Geoenviron. Eng. 2015, 141, 04015019. [Google Scholar] [CrossRef]
  7. Su, Y.H.; Luo, B.; Luo, Z.D.; Xu, F.; Huang, H.; Long, Z.W.; Shen, C.P. Mechanical characteristics and solidification mechanism of slag/fly ash-based geopolymer and cement solidified organic clay: A comparative study. J. Build. Eng. 2023, 71, 106459. [Google Scholar] [CrossRef]
  8. Wang, H.Y.; Sharma, M.M. Uniquely determine fracture dimension and formation permeability from diagnostic fracture injection test. Rock Mech. Bull. 2023, 2, 100050. [Google Scholar] [CrossRef]
  9. Soyson, A.; Wiboonluk, P.; Suched, L. Efficiency of microbially-induced calcite precipitation in natural clays for ground improvement. Constr. Build. Mater. 2021, 282, 122722. [Google Scholar]
  10. Sun, X.H.; Miao, L.C.; Wang, H.X.; Yin, W.H.; Wu, L.Y. Mineralization crust field experiment for desert sand solidification based on enzymatic calcification. J. Environ. Manag. 2021, 287, 112315. [Google Scholar] [CrossRef]
  11. Wu, C.G.; Zhang, J.; Zhou, M.L.; Wang, L. Resistance factors for design of slopes in a homogenous soil layer. Rock Mech. Bull. 2023, 2, 100022. [Google Scholar] [CrossRef]
  12. Kou, H.L.; Liu, J.H.; Zhang, P.; Wu, C.Z.; Ni, P.P.; Wang, D. Ecofriendly improvement of coastal calcareous sandy slope using recycled shredded coconut coir (RSC) and bio-cement. Acta Geotech. 2022, 17, 5375–5389. [Google Scholar] [CrossRef]
  13. Hu, X.; Chen, M.; Hu, B.; Du, G.Z.; Li, K.H. Experimental Study on the Mechanical Behavior of Sandy Soil Reinforced by Disposable Face Mask Chips under Different Stress Paths. Sustainability 2023, 15, 4059. [Google Scholar] [CrossRef]
  14. DeJong, J.T.; Fritzges, M.B.; Nüsslein, K. Microbially induced cementation to control sand response to undrained shear. J. Geotech. Geoenviron. Eng. 2006, 132, 1381–1392. [Google Scholar] [CrossRef]
  15. Jiang, N.J.; Soga, K. The applicability of microbially induced calcite precipitation (MICP) for internal erosion control in gravel–sand mixtures. Géotechnique 2017, 67, 42–55. [Google Scholar] [CrossRef] [Green Version]
  16. Wu, C.Z.; Song, Z.C.; Jang, B.A.; Song, H.G.; Ni, P.P. Strength improvement of rock fractures and aggregates cemented with bio-slurry. Mater. Lett. 2021, 305, 130866. [Google Scholar] [CrossRef]
  17. Whiffin, V.S. Microbial CaCO3 Precipitation for the Production of Biocement; Murdoch University: Perth, Australia, 2004. [Google Scholar]
  18. Montoya, B.M.; Dejong, J.T.; Boulanger, R.W. Dynamic response of liquefiable sand improved by microbial-induced calcite precipitation. Geotechnique 2013, 63, 302–312. [Google Scholar] [CrossRef]
  19. Cheng, X.H.; Ma, Q.; Yang, Z.; Zhang, Z.; Li, M. Dynamic response of liquefiable sand foundation improved by bio-grouting. Chin. J. Geotech. Eng. 2013, 35, 1486–1495. [Google Scholar]
  20. Gomez, M.G.; Anderson, C.M.; Graddy, C.M.R.; DeJong, J.T.; Nelson, D.C.; Ginn, T.R. Large-scale comparison of bioaugmentation and biostimulation approaches for biocementation of sands. J. Geotech. Geoenviron. Eng. 2017, 143, 04016124. [Google Scholar] [CrossRef]
  21. Zamani, A.; Montoya, B.M. Undrained cyclic response of silty sands improved by microbial induced calcium carbonate precipitation. Soil Dyn. Earthq. Eng. 2019, 120, 436–448. [Google Scholar] [CrossRef]
  22. Yin, J.; Wu, J.X.; Zhang, K.; Shahin, M.A.; Cheng, L. Comparison between MICP-Based Bio-Cementation Versus Traditional Portland Cementation for Oil-Contaminated Soil Stabilisation. Sustainability 2022, 15, 434. [Google Scholar] [CrossRef]
  23. Lee, C.; Lee, H.; Kim, O.B. Biocement fabrication and design application for a sustainable urban area. Sustainability 2018, 10, 4079. [Google Scholar] [CrossRef]
  24. Whiffin, V.S.; Van Paassen, L.A.; Harkes, M.P. Microbial carbonate precipitation as a soil improvement technique. Geomicrobiol. J. 2007, 24, 417–423. [Google Scholar] [CrossRef]
  25. Cheng, L.; Cord-Ruwisch, R. In situ soil cementation with ureolytic bacteria by surface percolation. Ecol. Eng. 2012, 42, 64–72. [Google Scholar] [CrossRef] [Green Version]
  26. Wu, C.Z.; Chu, J.; Cheng, L.; Wu, S.F. Biogrouting of aggregates using premixed injection method with or without pH adjustment. J. Mater. Civ. Eng. 2019, 31, 06019008. [Google Scholar] [CrossRef]
  27. Xiao, Y.; Wang, Y.; Wang, S.; Evans, T.M.; Stuedlein, A.W.; Chu, J.; Zhao, C.; Wu, H.R.; Liu, H.L. Homogeneity and mechanical behaviors of sands improved by a temperature-controlled one-phase MICP method. Acta Geotech. 2021, 16, 1417–1427. [Google Scholar] [CrossRef]
  28. Cheng, L.; Kobayashi, T.; Shahin, M.A. Microbially induced calcite precipitation for production of “bio-bricks” treated at partial saturation condition. Constr. Build. Mater. 2020, 231, 117095. [Google Scholar] [CrossRef]
  29. Lv, C.; Zhu, C.; Tang, C.S.; Cheng, Q.; Yin, L.Y.; Shi, B. Effect of fiber reinforcement on the mechanical behavior of bio-cemented sand. Geosynth. Int. 2021, 28, 195–205. [Google Scholar] [CrossRef]
  30. Wu, C.Z.; Chu, J. Biogrouting method for stronger bond strength for aggregates. J. Geotech. Geoenviron. Eng. 2020, 146, 06020021. [Google Scholar] [CrossRef]
  31. Gowthaman, S.; Koizumi, H.; Nakashima, K.; Kawasaki, S. Field experimentation of bio-cementation using low-cost cementation media for preservation of slope surface. Case Stud. Constr. Mater. 2023, 18, e02086. [Google Scholar] [CrossRef]
  32. Xu, L.; Xu, R.; Shashank, B.S.; Chen, X.H.; Yu, J.L.; Wu, C.Z. An improved quantification method for characterisation of clay microstructure using SEM. Environ. Geotech. 2022, 40, 1–20. [Google Scholar] [CrossRef]
  33. Shen, D.Y.; Liu, Z.Y.; Song, Z.C.; Wu, C.Z. Reinforcement Mechanism and Erosion Resistance of Loess Slope Using Enzyme Induced Calcite Precipitation Technique. Sustainability 2023, 15, 1044. [Google Scholar] [CrossRef]
  34. Zhang, F.Y.; Kong, R.; Peng, J.B. Effects of heating on compositional, structural, and physicochemical properties of loess under laboratory conditions. Appl. Clay Sci. 2018, 152, 259–266. [Google Scholar] [CrossRef]
  35. Qabany, A.A.; Soga, K.; Santamarina, C. Factors affecting efficiency of microbially induced calcite precipitation. J. Geotech. Geoenviron. Eng. 2012, 138, 992–1001. [Google Scholar] [CrossRef]
  36. Cheng, L.; Cord-Ruwisch, R.; Shahin, M.A. Cementation of sand soil by microbially induced calcite precipitation at various degrees of saturation. Can. Geotech. J. 2013, 50, 81–90. [Google Scholar] [CrossRef] [Green Version]
  37. Gowthaman, S.; Mitsuyama, S.; Nakashima, K.; Komatsu, M.; Kawasaki, S. Biogeotechnical approach for slope soil stabilization using locally isolated bacteria and inexpensive low-grade chemicals: A feasibility study on Hokkaido expressway soil, Japan. Soils Found. 2019, 59, 484–499. [Google Scholar] [CrossRef]
  38. Danjo, T.; Kawasaki, S. Microbially Induced Sand Cementation Method Using Pararhodobacter sp. Strain SO1, Inspired by Beachrock Formation Mechanism. Mater. Trans. 2016, 57, 428–437. [Google Scholar] [CrossRef] [Green Version]
  39. Paassen, L.A.V.; Daza, C.M.; Staal, M.; Sorokin, D.Y.; Zon, W.V.D.; Loosdrecht, M.C.M.V. Potential soil reinforcement by biological denitrification. Ecol. Eng. 2010, 36, 168–175. [Google Scholar] [CrossRef]
  40. Yu, X.; Qian, C.; Jiang, J. Desert sand cemented by bio-magnesium ammonium phosphate cement and its microscopic properties. Constr. Build. Mater. 2019, 200, 116–123. [Google Scholar] [CrossRef]
  41. Somani, R.S.; Patel, K.S.; Mehta, A.R.; Jasra, R.V. Examination of the polymorphs and particle size of calcium carbonate precipitated using still effluent (ie, CaCl2 + NaCl solution) of soda ash manufacturing process. Ind. Eng. Chem. Res. 2006, 45, 5223–5230. [Google Scholar] [CrossRef]
Figure 1. Insufficient bearing capacity due to particle breakage.
Sustainability 15 09432 g001
Figure 2. Photos of sand: (a) Calcareous sand; (b) Fujian standard sand; (c) High purity quartz sand.
Sustainability 15 09432 g002
Figure 3. Grading curve of calcareous sand powder.
Sustainability 15 09432 g003
Figure 4. Preparation process of bio-cement composition: (a) bacterial solution; (b) solution of urea and calcium chloride (CS); (c) mix and stir the bacterial solution and CS; (d) active bio-cement suspension; (e) sand; (f) mixture of bio-cement and sand.
Sustainability 15 09432 g004
Figure 5. Photo of the model tank.
Sustainability 15 09432 g005
Figure 6. Microbial grouting process.
Sustainability 15 09432 g006
Figure 7. Sand soil reinforced by the bio-cement infiltration method.
Sustainability 15 09432 g007
Figure 8. Accumulation at the bottom of the reinforced areas.
Sustainability 15 09432 g008
Figure 9. Residual CS during the grouting process.
Sustainability 15 09432 g009
Figure 10. Average UCS along depth.
Sustainability 15 09432 g010
Figure 11. Relationship between the UCS and CaCO3 content.
Sustainability 15 09432 g011
Figure 12. Distribution of CaCO3 content along reinforced depth.
Sustainability 15 09432 g012
Figure 13. SEM images of cemented particles at different position: (a) the upper part, (b) the middle part, and (c) the lower part.
Sustainability 15 09432 g013
Table 1. Test parameters of the bio-cement infiltration method.
Sample No.Volume Ratio of
Bio-Cement/Calcareous Sand Powder
CS Concentration (mol/L)Inflow Rate (mL/min)
T1200/40140
T2200/4020
T3400/8020
Table 2. Test parameters of the bio-cement mixed method.
ParameterValue
Reinforcement area, d × h (mm)100 × 500
Sand size (mm)0.5–1
Bacteria solution volume (L)12
CS concentration (mol/L)0.6
Cement solution volume (L)40
Duration of injection (d)5
Injection rate (mL/min)15
Table 3. Distribution of CaCO3 content along the reinforced depth.
Depth (cm)CaCO3 Content (%)
123
08.312.810.8
109.810.58.6
208.39.67.4
3021.120.222.6
Disclaimer/Publisher’s Note: The statements, opinions and data contained in all publications are solely those of the individual author(s) and contributor(s) and not of MDPI and/or the editor(s). MDPI and/or the editor(s) disclaim responsibility for any injury to people or property resulting from any ideas, methods, instructions or products referred to in the content.