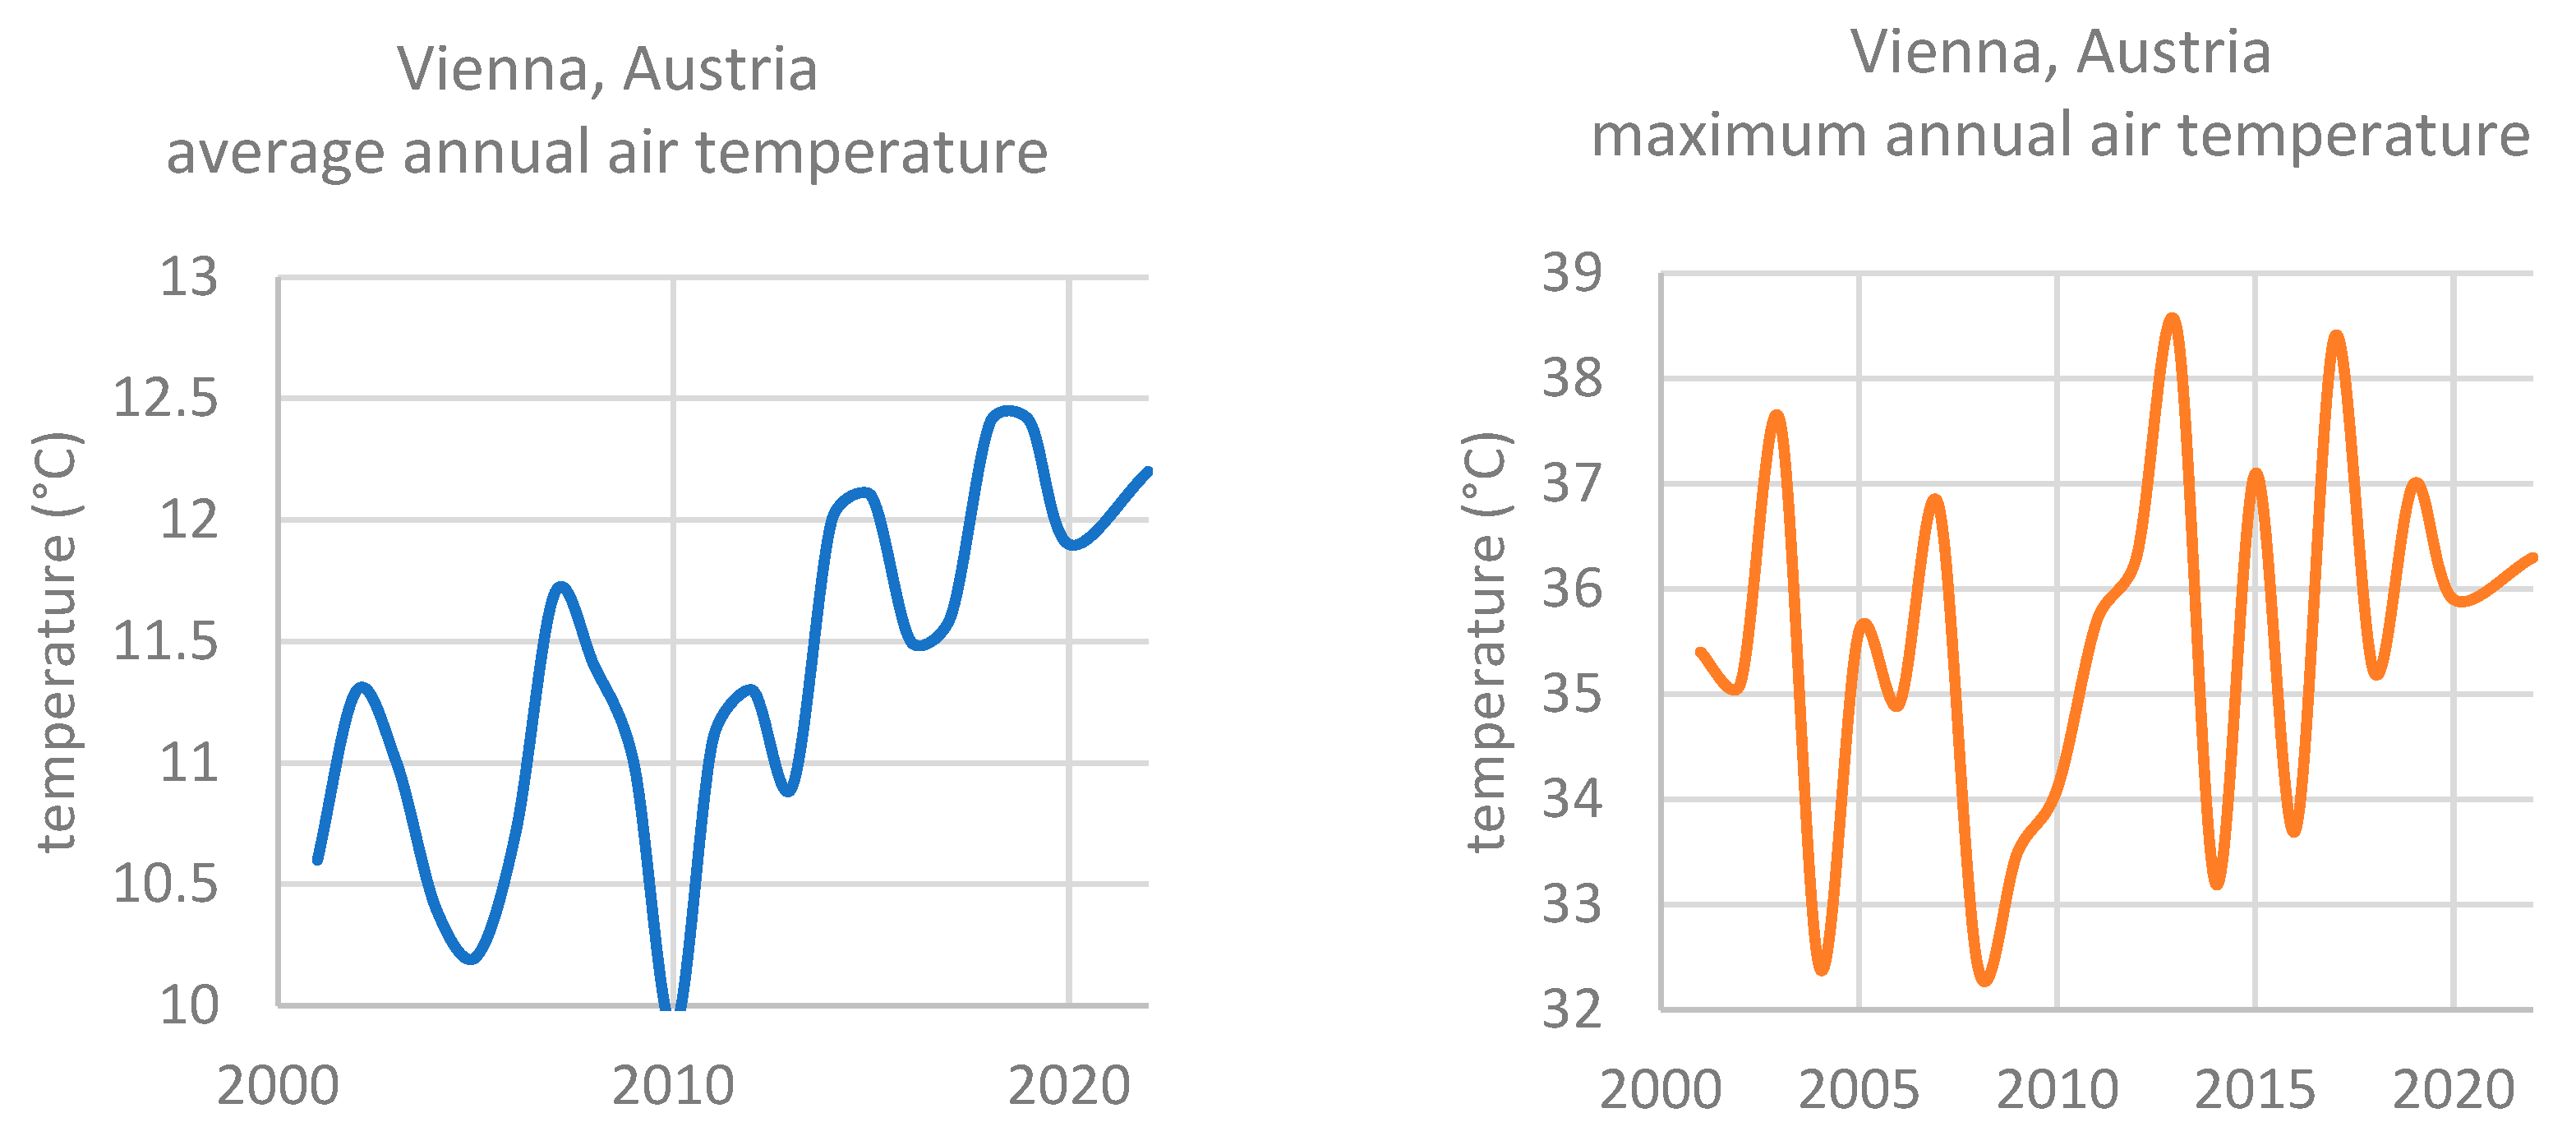
Figure 1.
Vienna, Austria: average annual air temperature (left); maximum air temperature (right).
Figure 1.
Vienna, Austria: average annual air temperature (left); maximum air temperature (right).
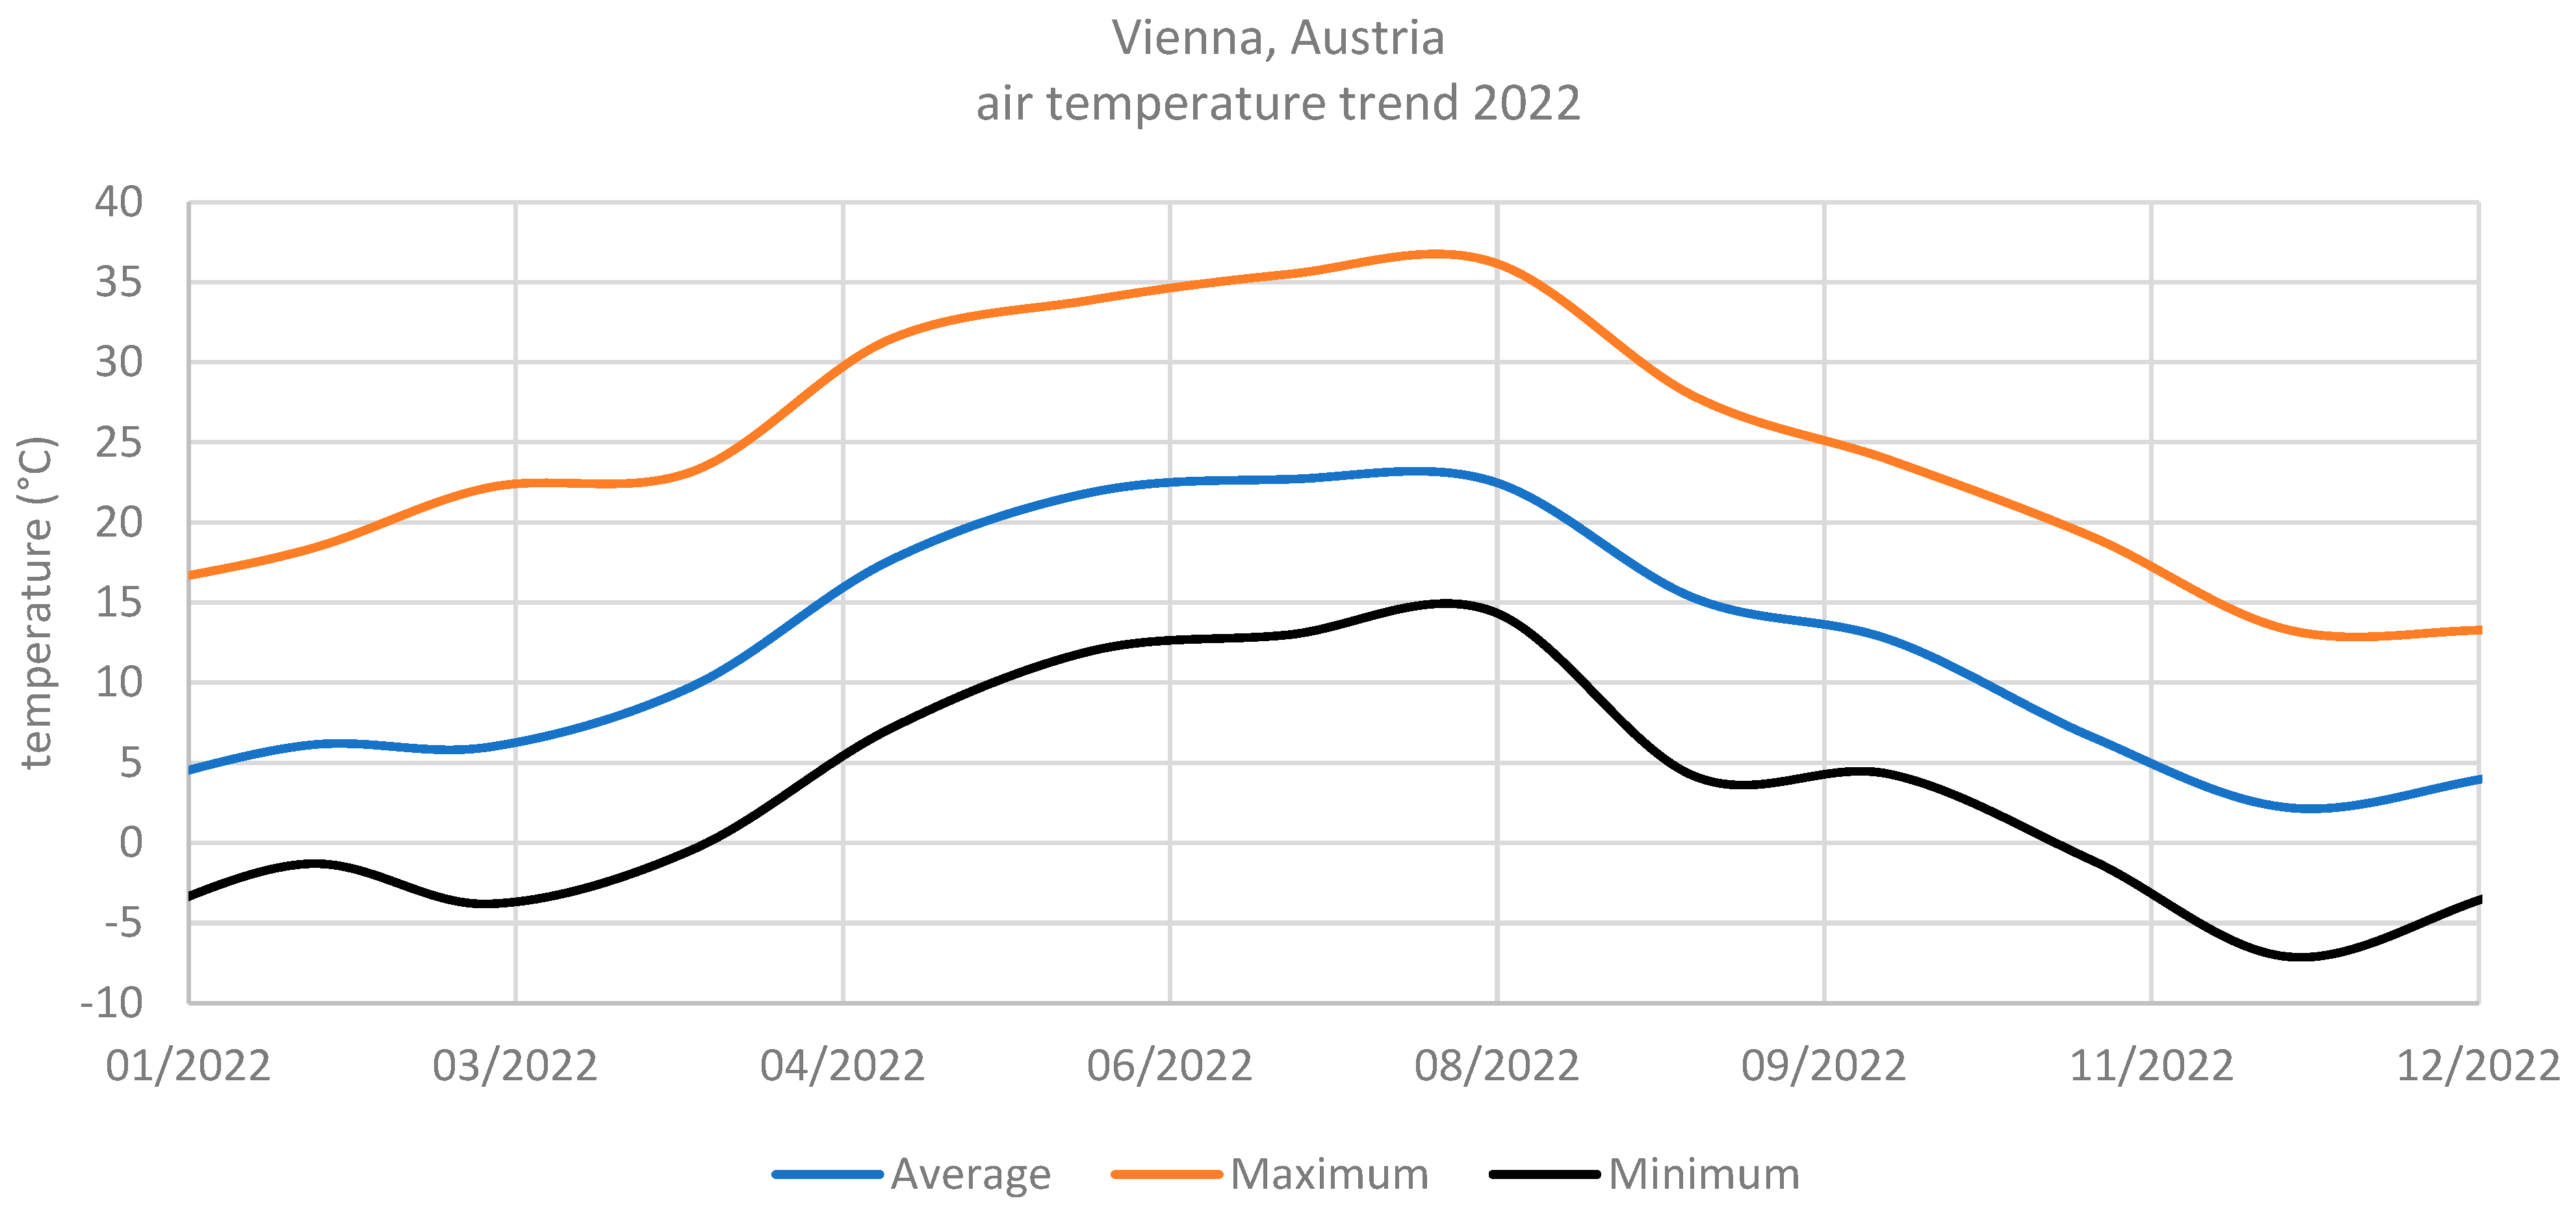
Figure 2.
Air temperature trend in 2022, Vienna, Austria.
Figure 2.
Air temperature trend in 2022, Vienna, Austria.
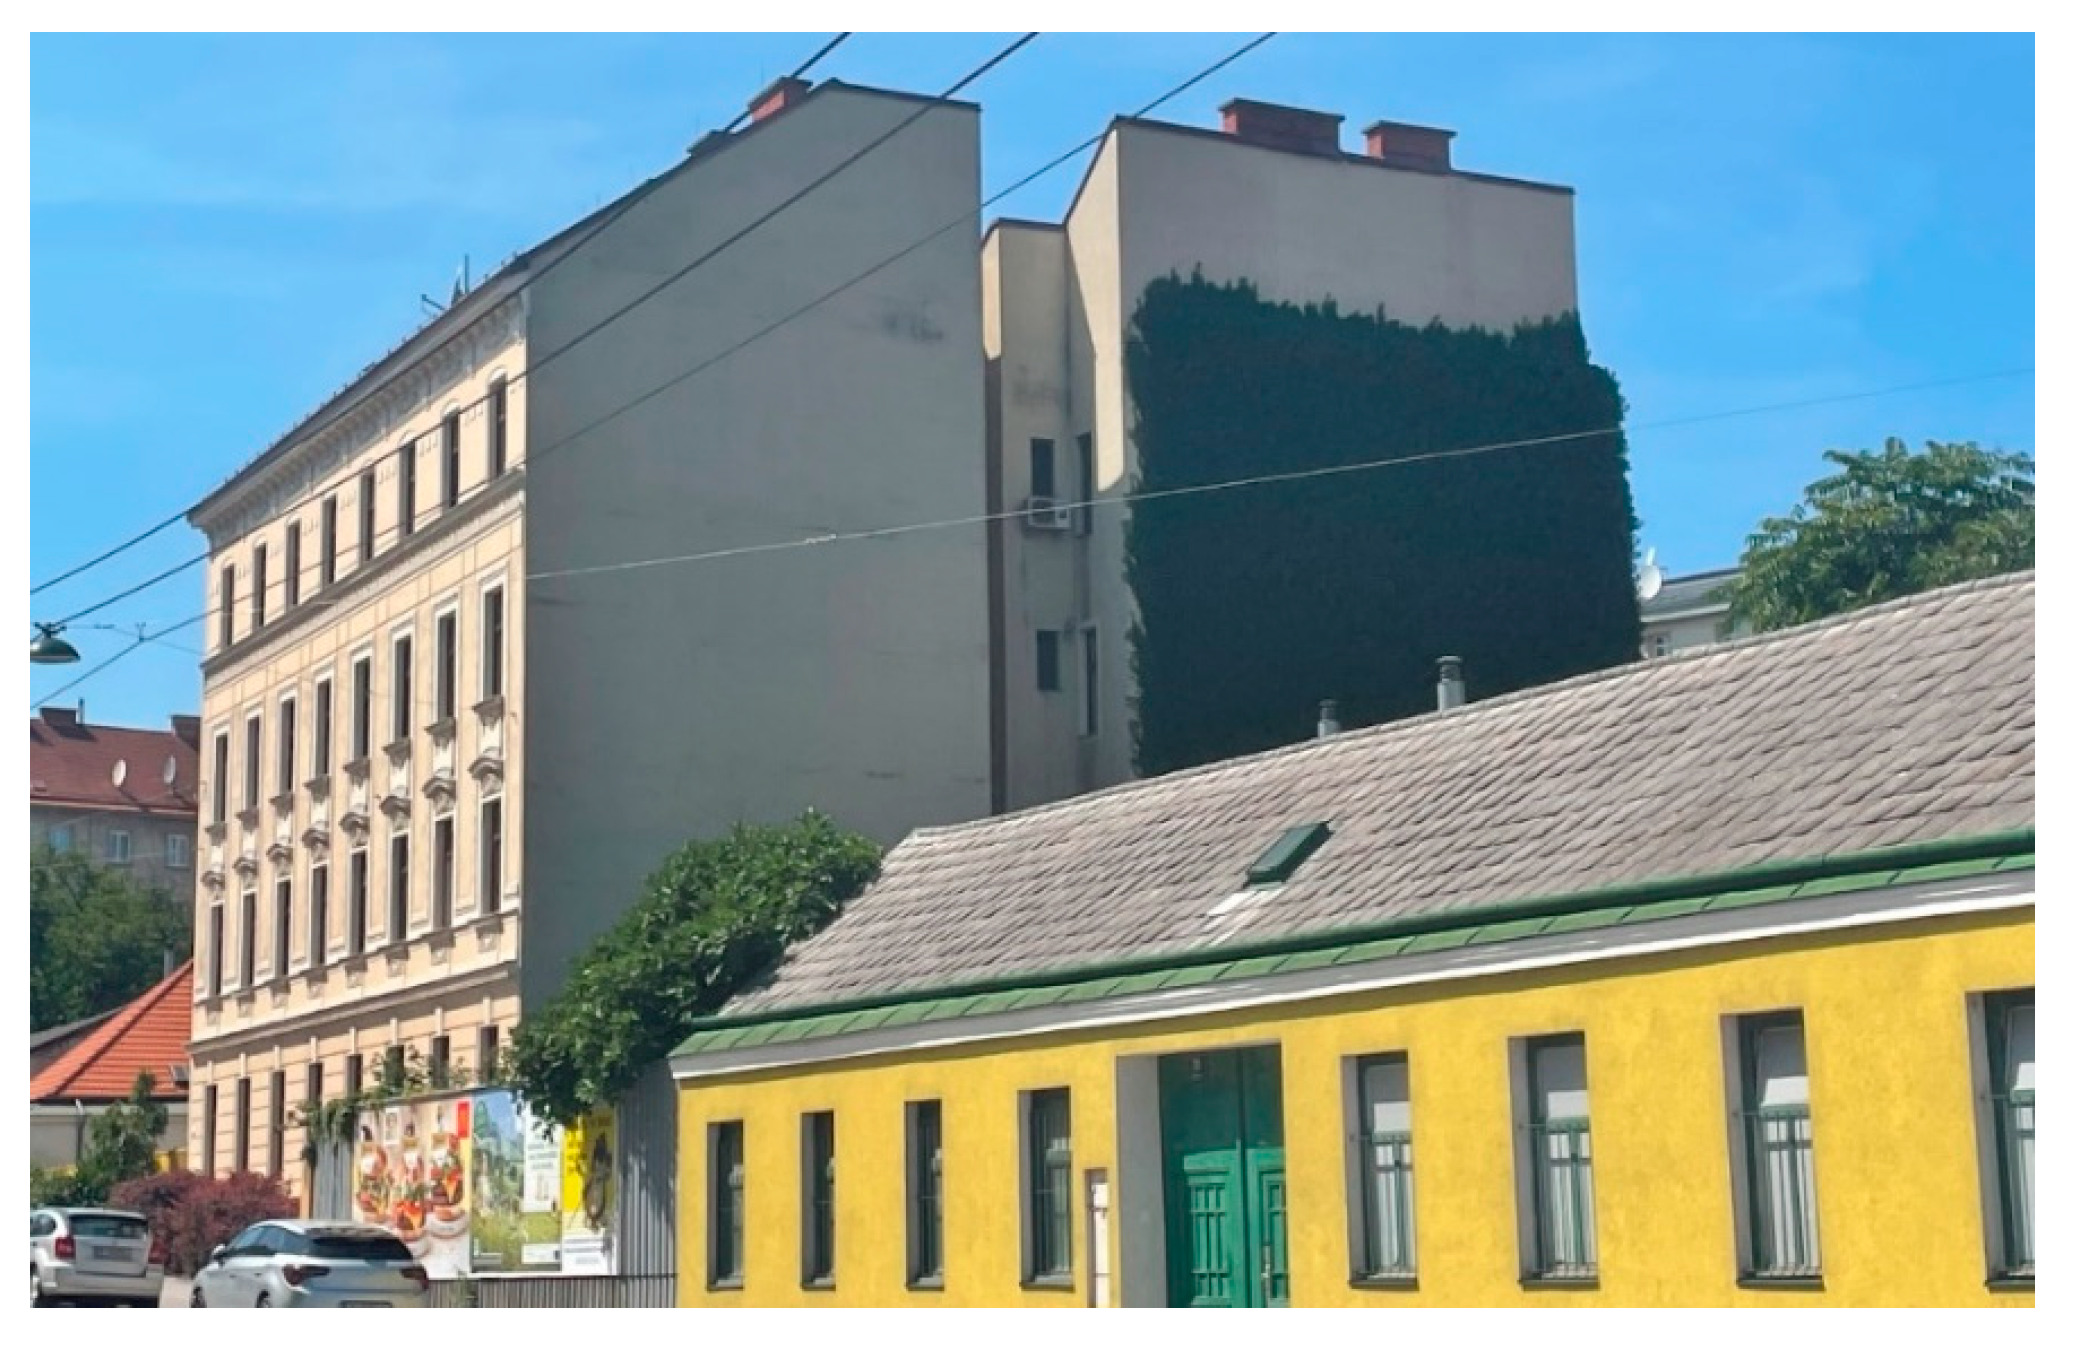
Figure 3.
Side view: location, Kopalgasse 7, 1110 Vienna.
Figure 3.
Side view: location, Kopalgasse 7, 1110 Vienna.
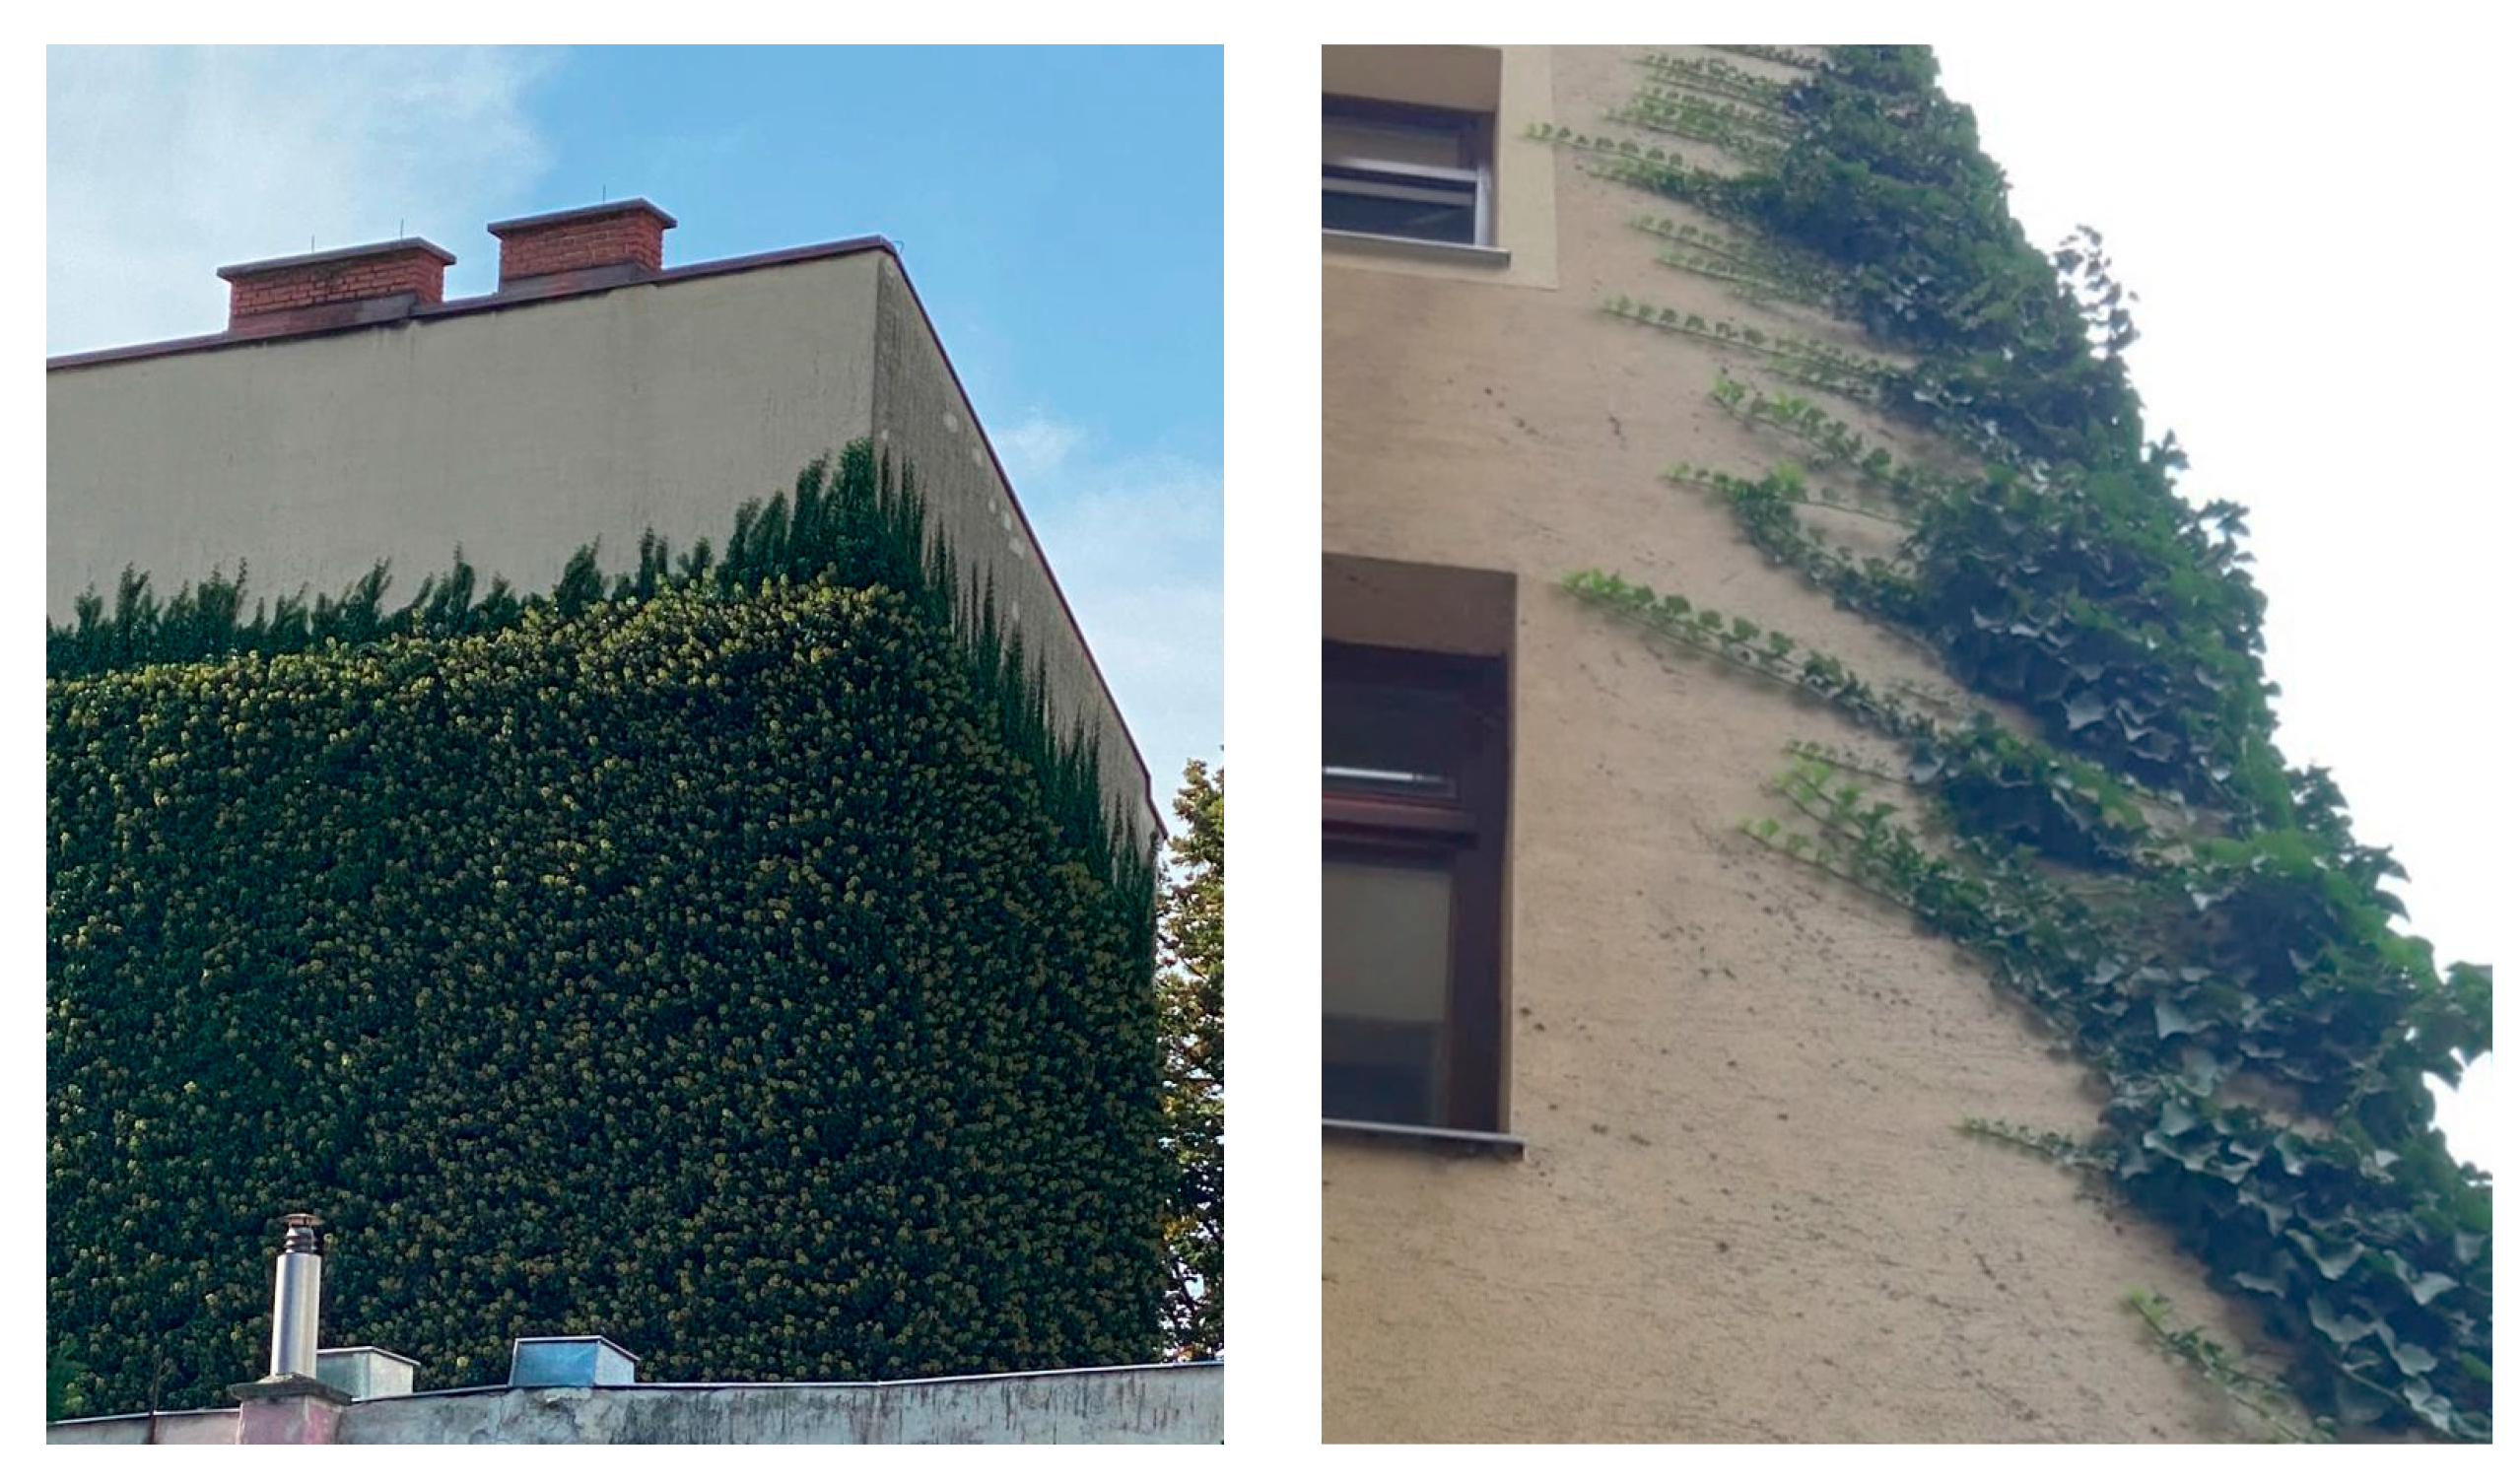
Figure 4.
Detail: Kopalgasse, growth towards the roof (June 2022) (left) and growth around the corners (August 2022) (right).
Figure 4.
Detail: Kopalgasse, growth towards the roof (June 2022) (left) and growth around the corners (August 2022) (right).
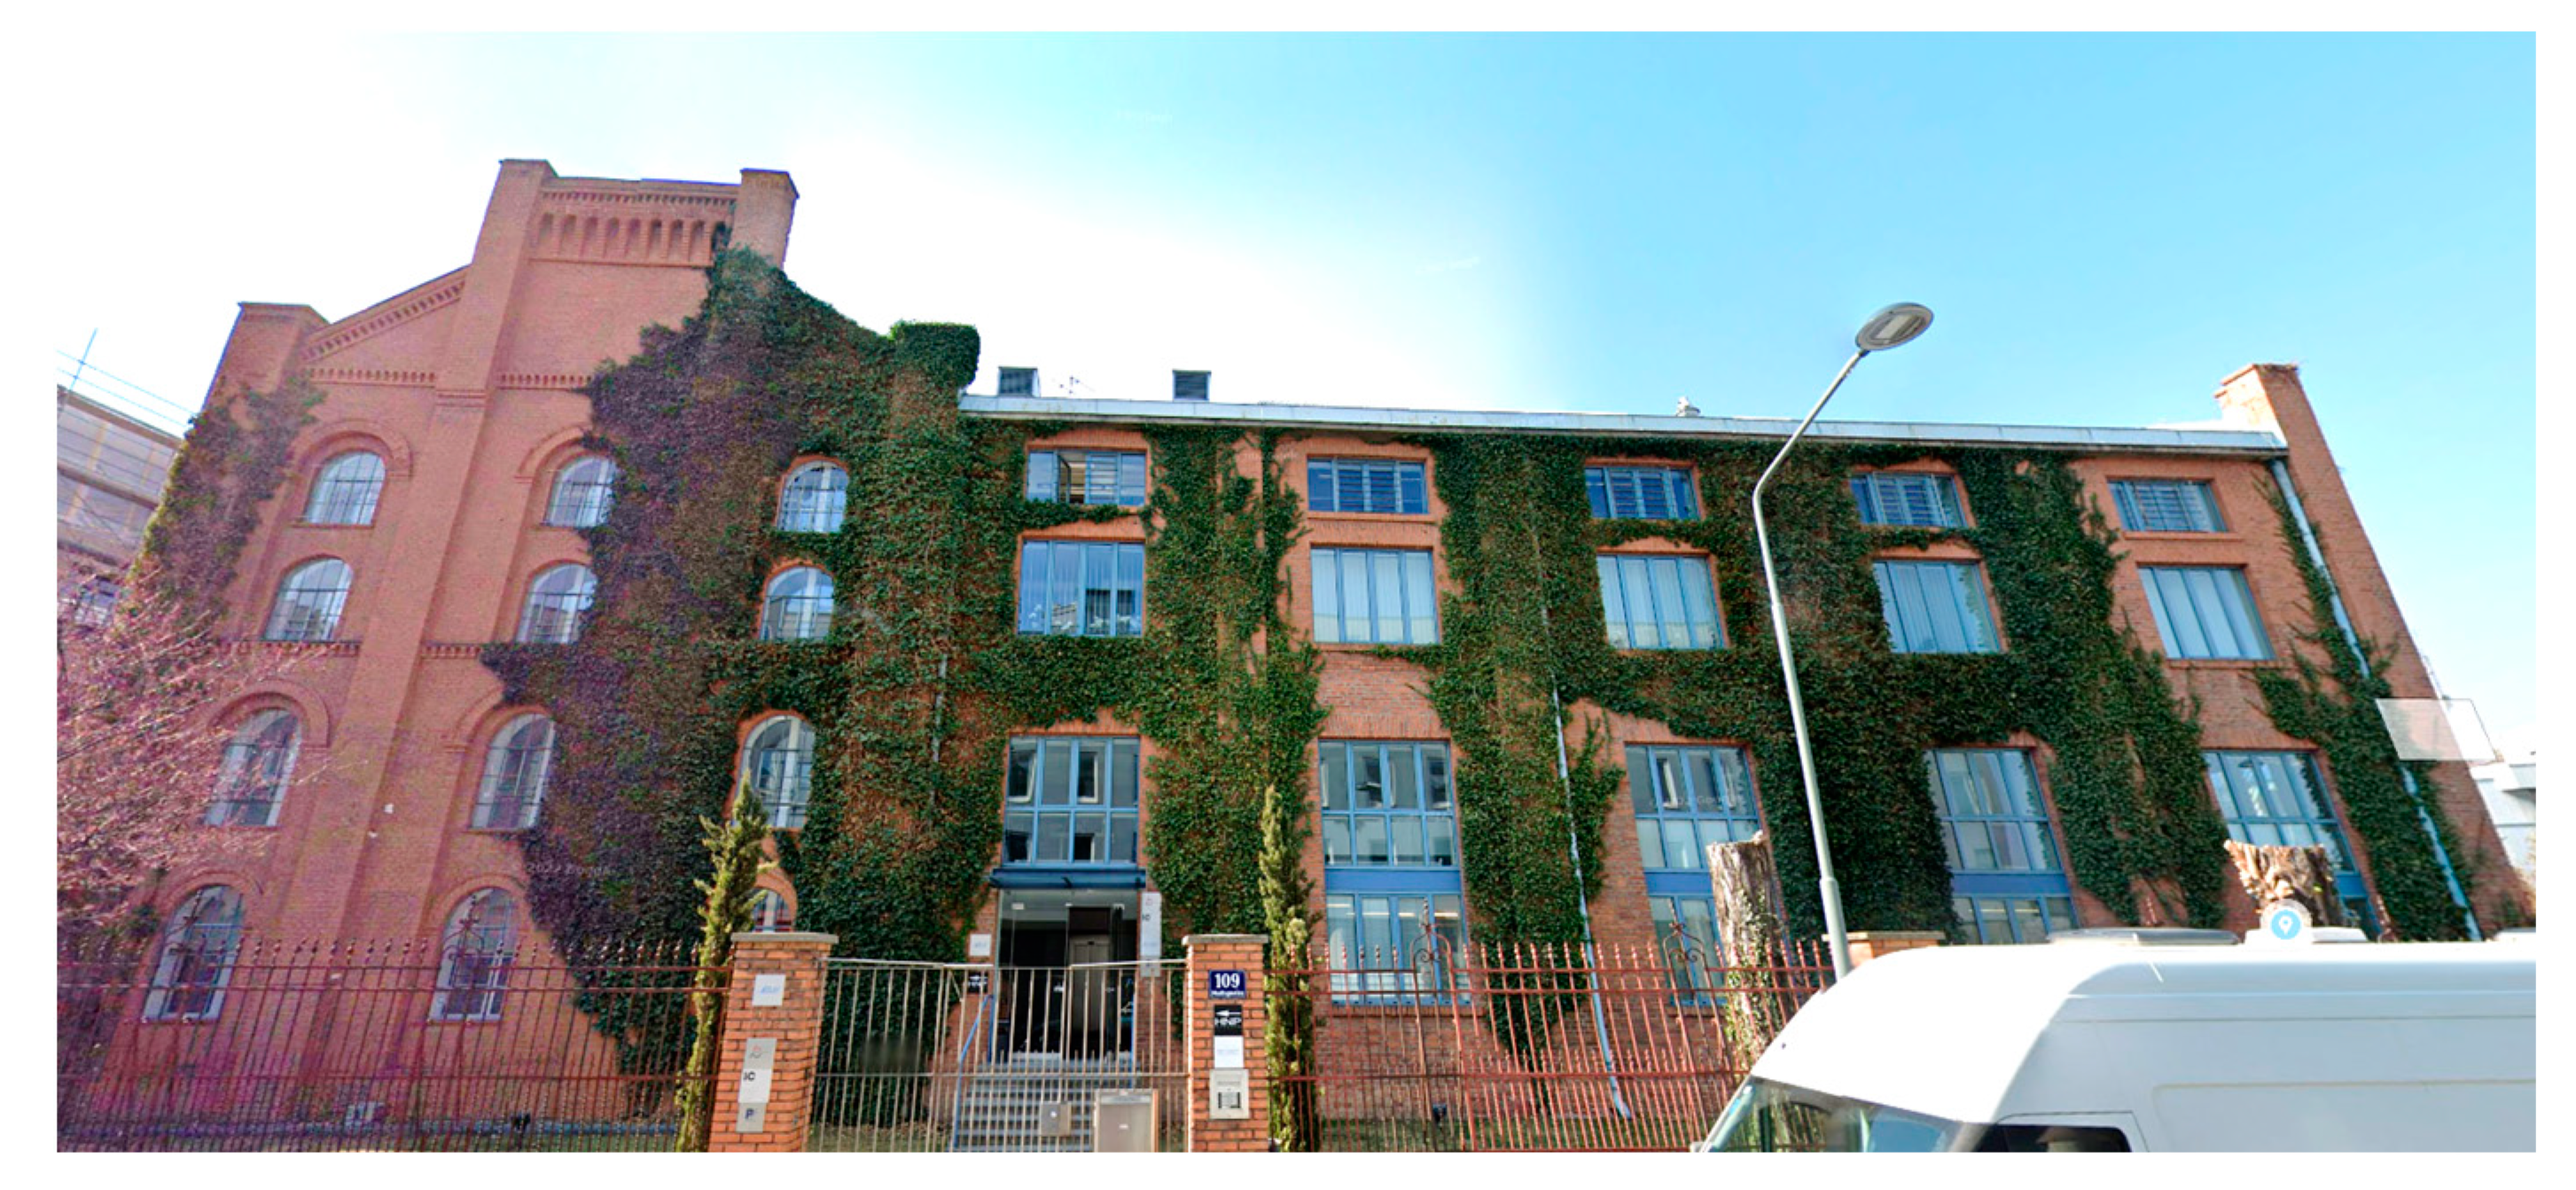
Figure 5.
Front view: location, Muthgasse 109, 1190 Vienna (May 2022).
Figure 5.
Front view: location, Muthgasse 109, 1190 Vienna (May 2022).
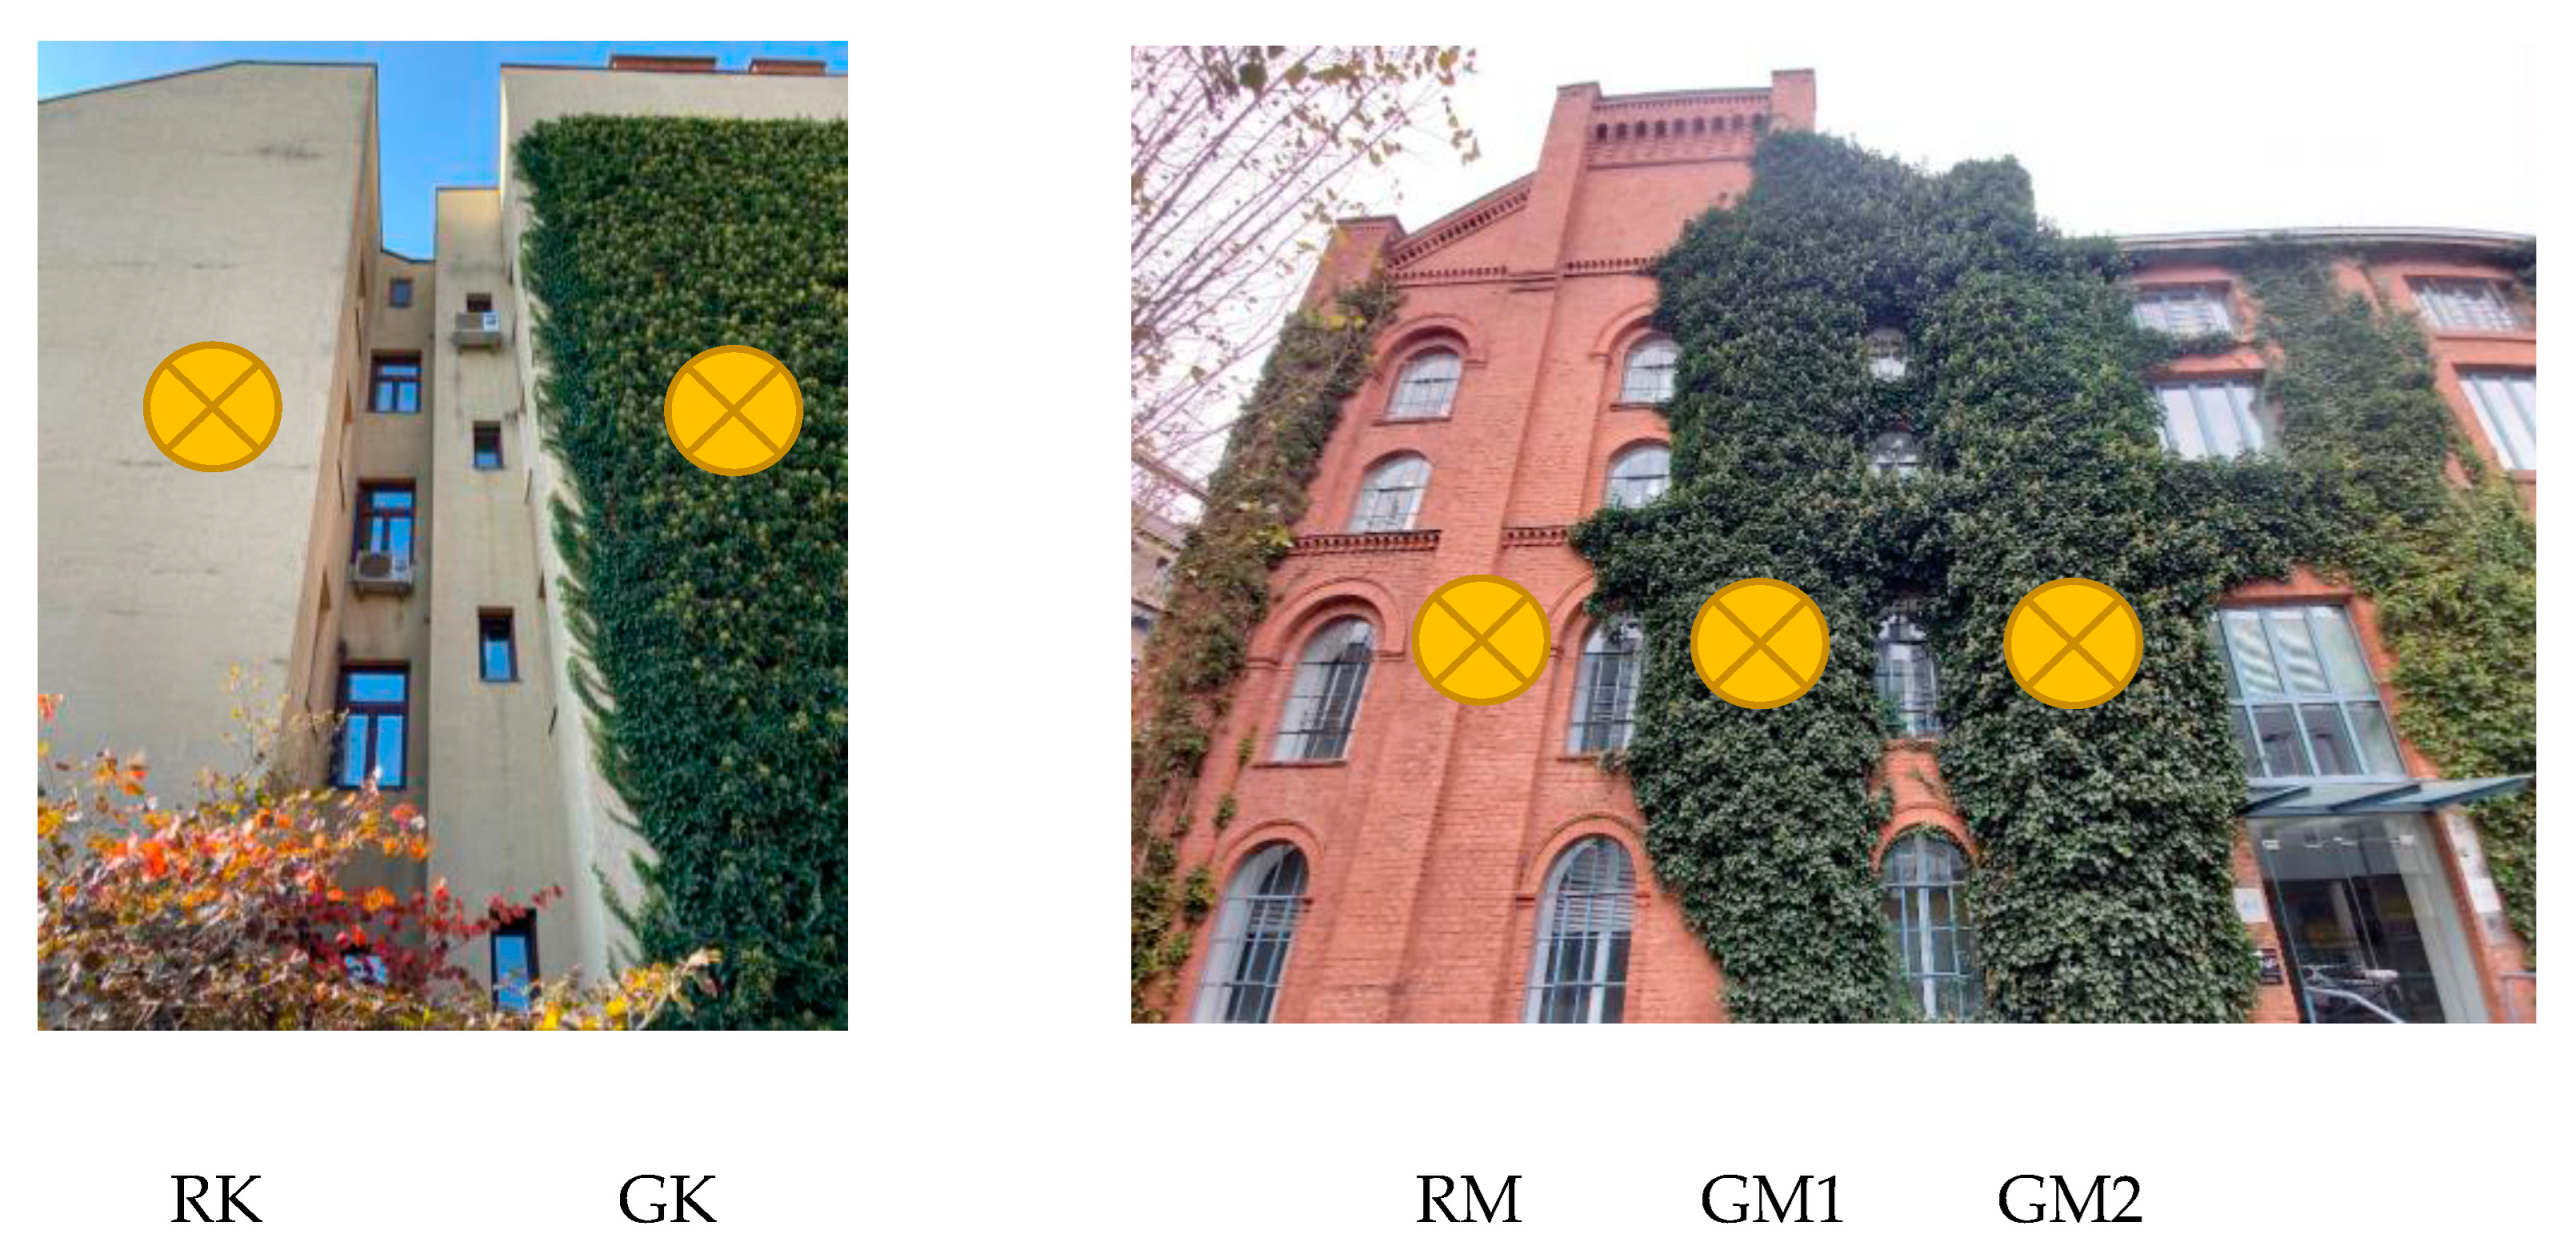
Figure 6.
Sensor positions on the investigated buildings.
Figure 6.
Sensor positions on the investigated buildings.
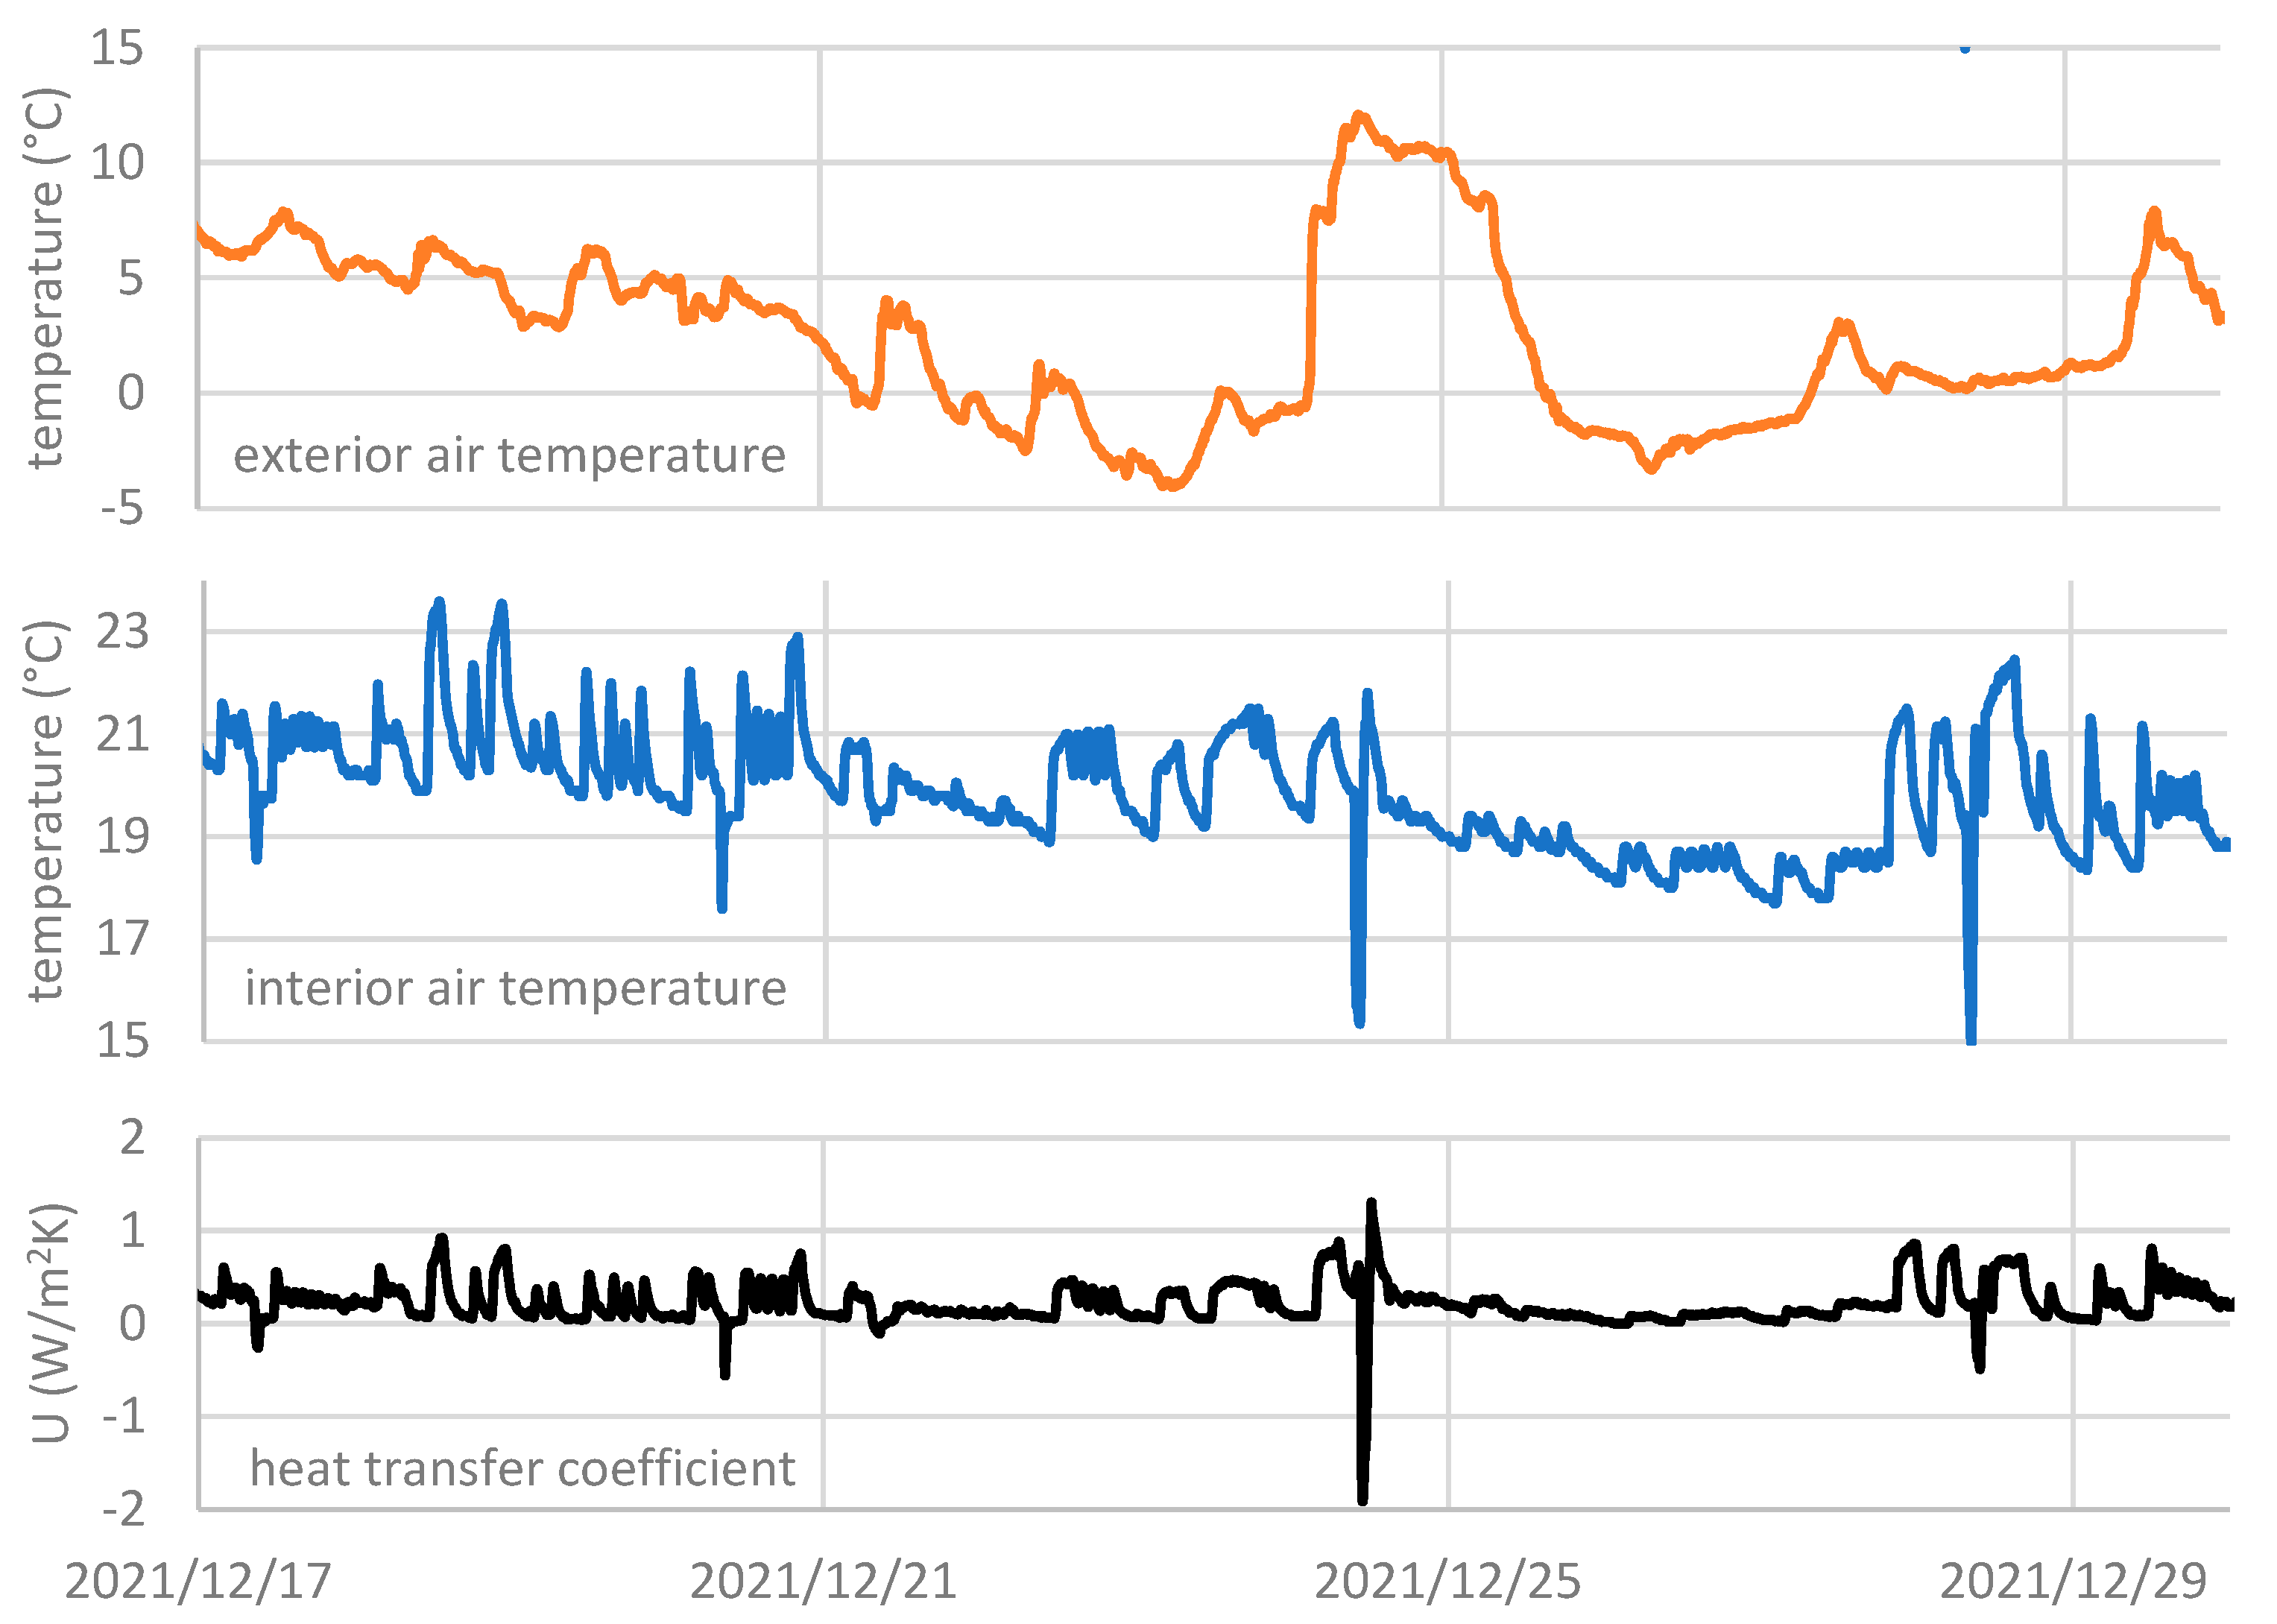
Figure 7.
Exemplary comparison of the measured heat transfer coefficient and exterior resp. interior air temperatures at Kopalgasse.
Figure 7.
Exemplary comparison of the measured heat transfer coefficient and exterior resp. interior air temperatures at Kopalgasse.
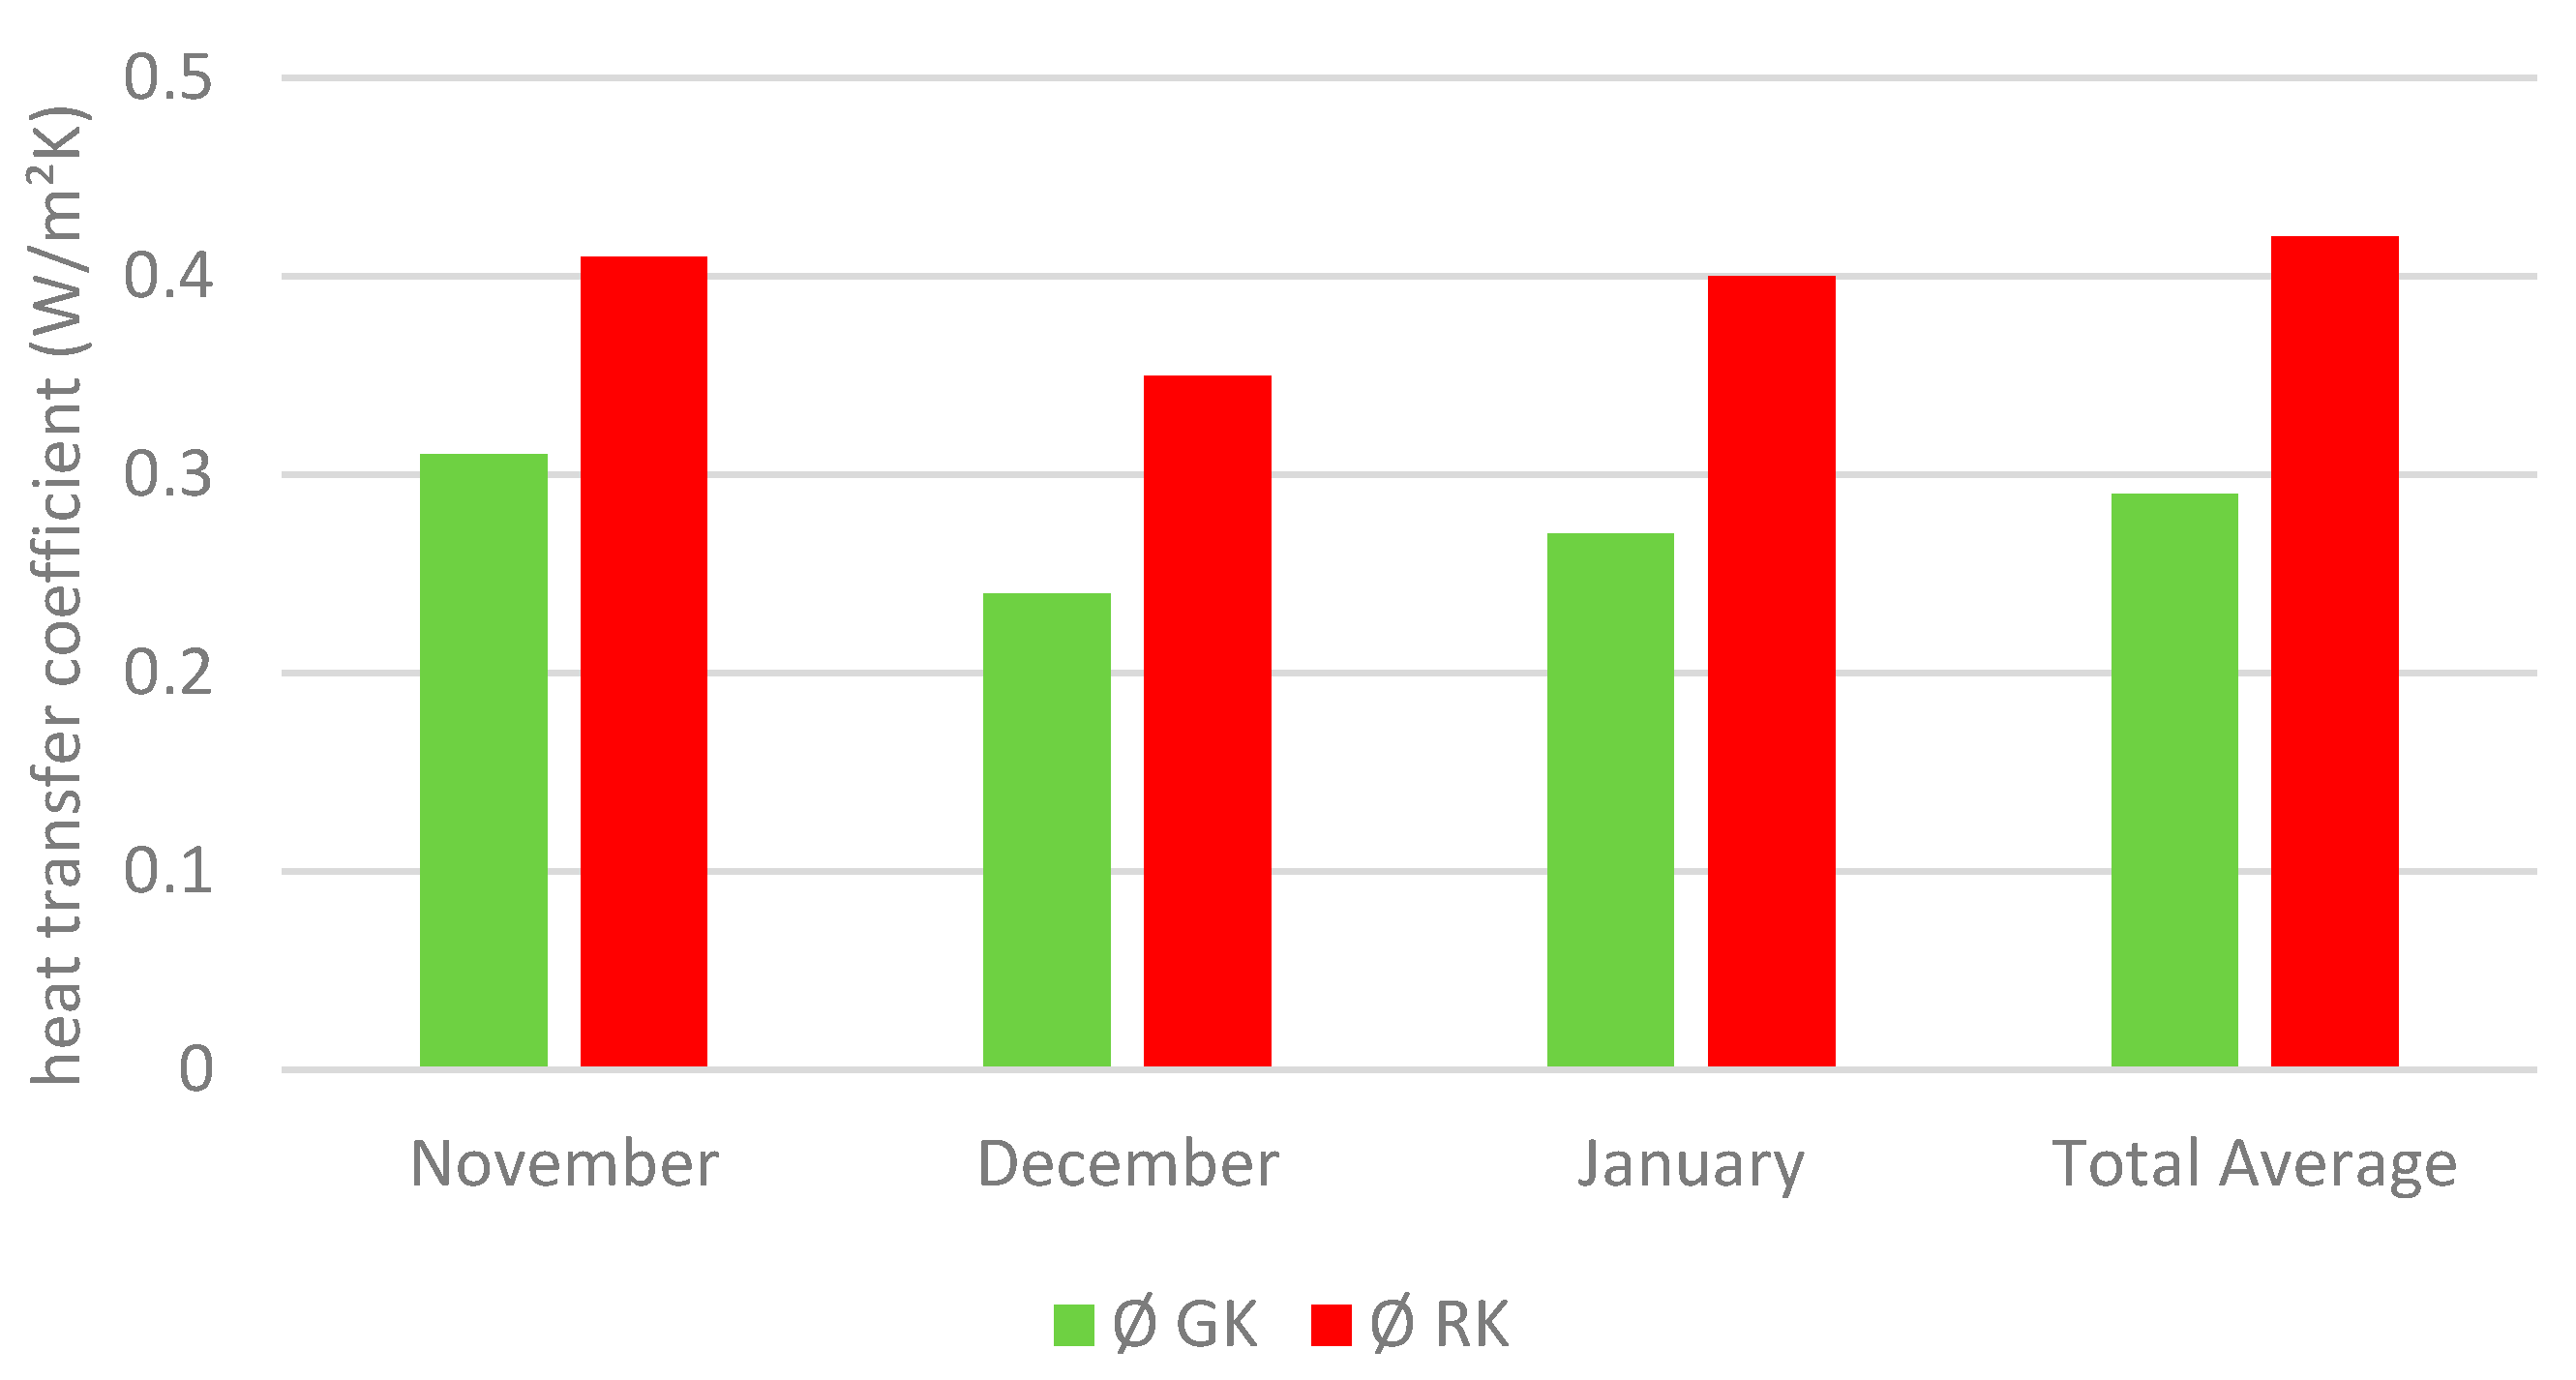
Figure 8.
Heat transfer coefficient, Kopalgasse, comparison of average values during winter.
Figure 8.
Heat transfer coefficient, Kopalgasse, comparison of average values during winter.
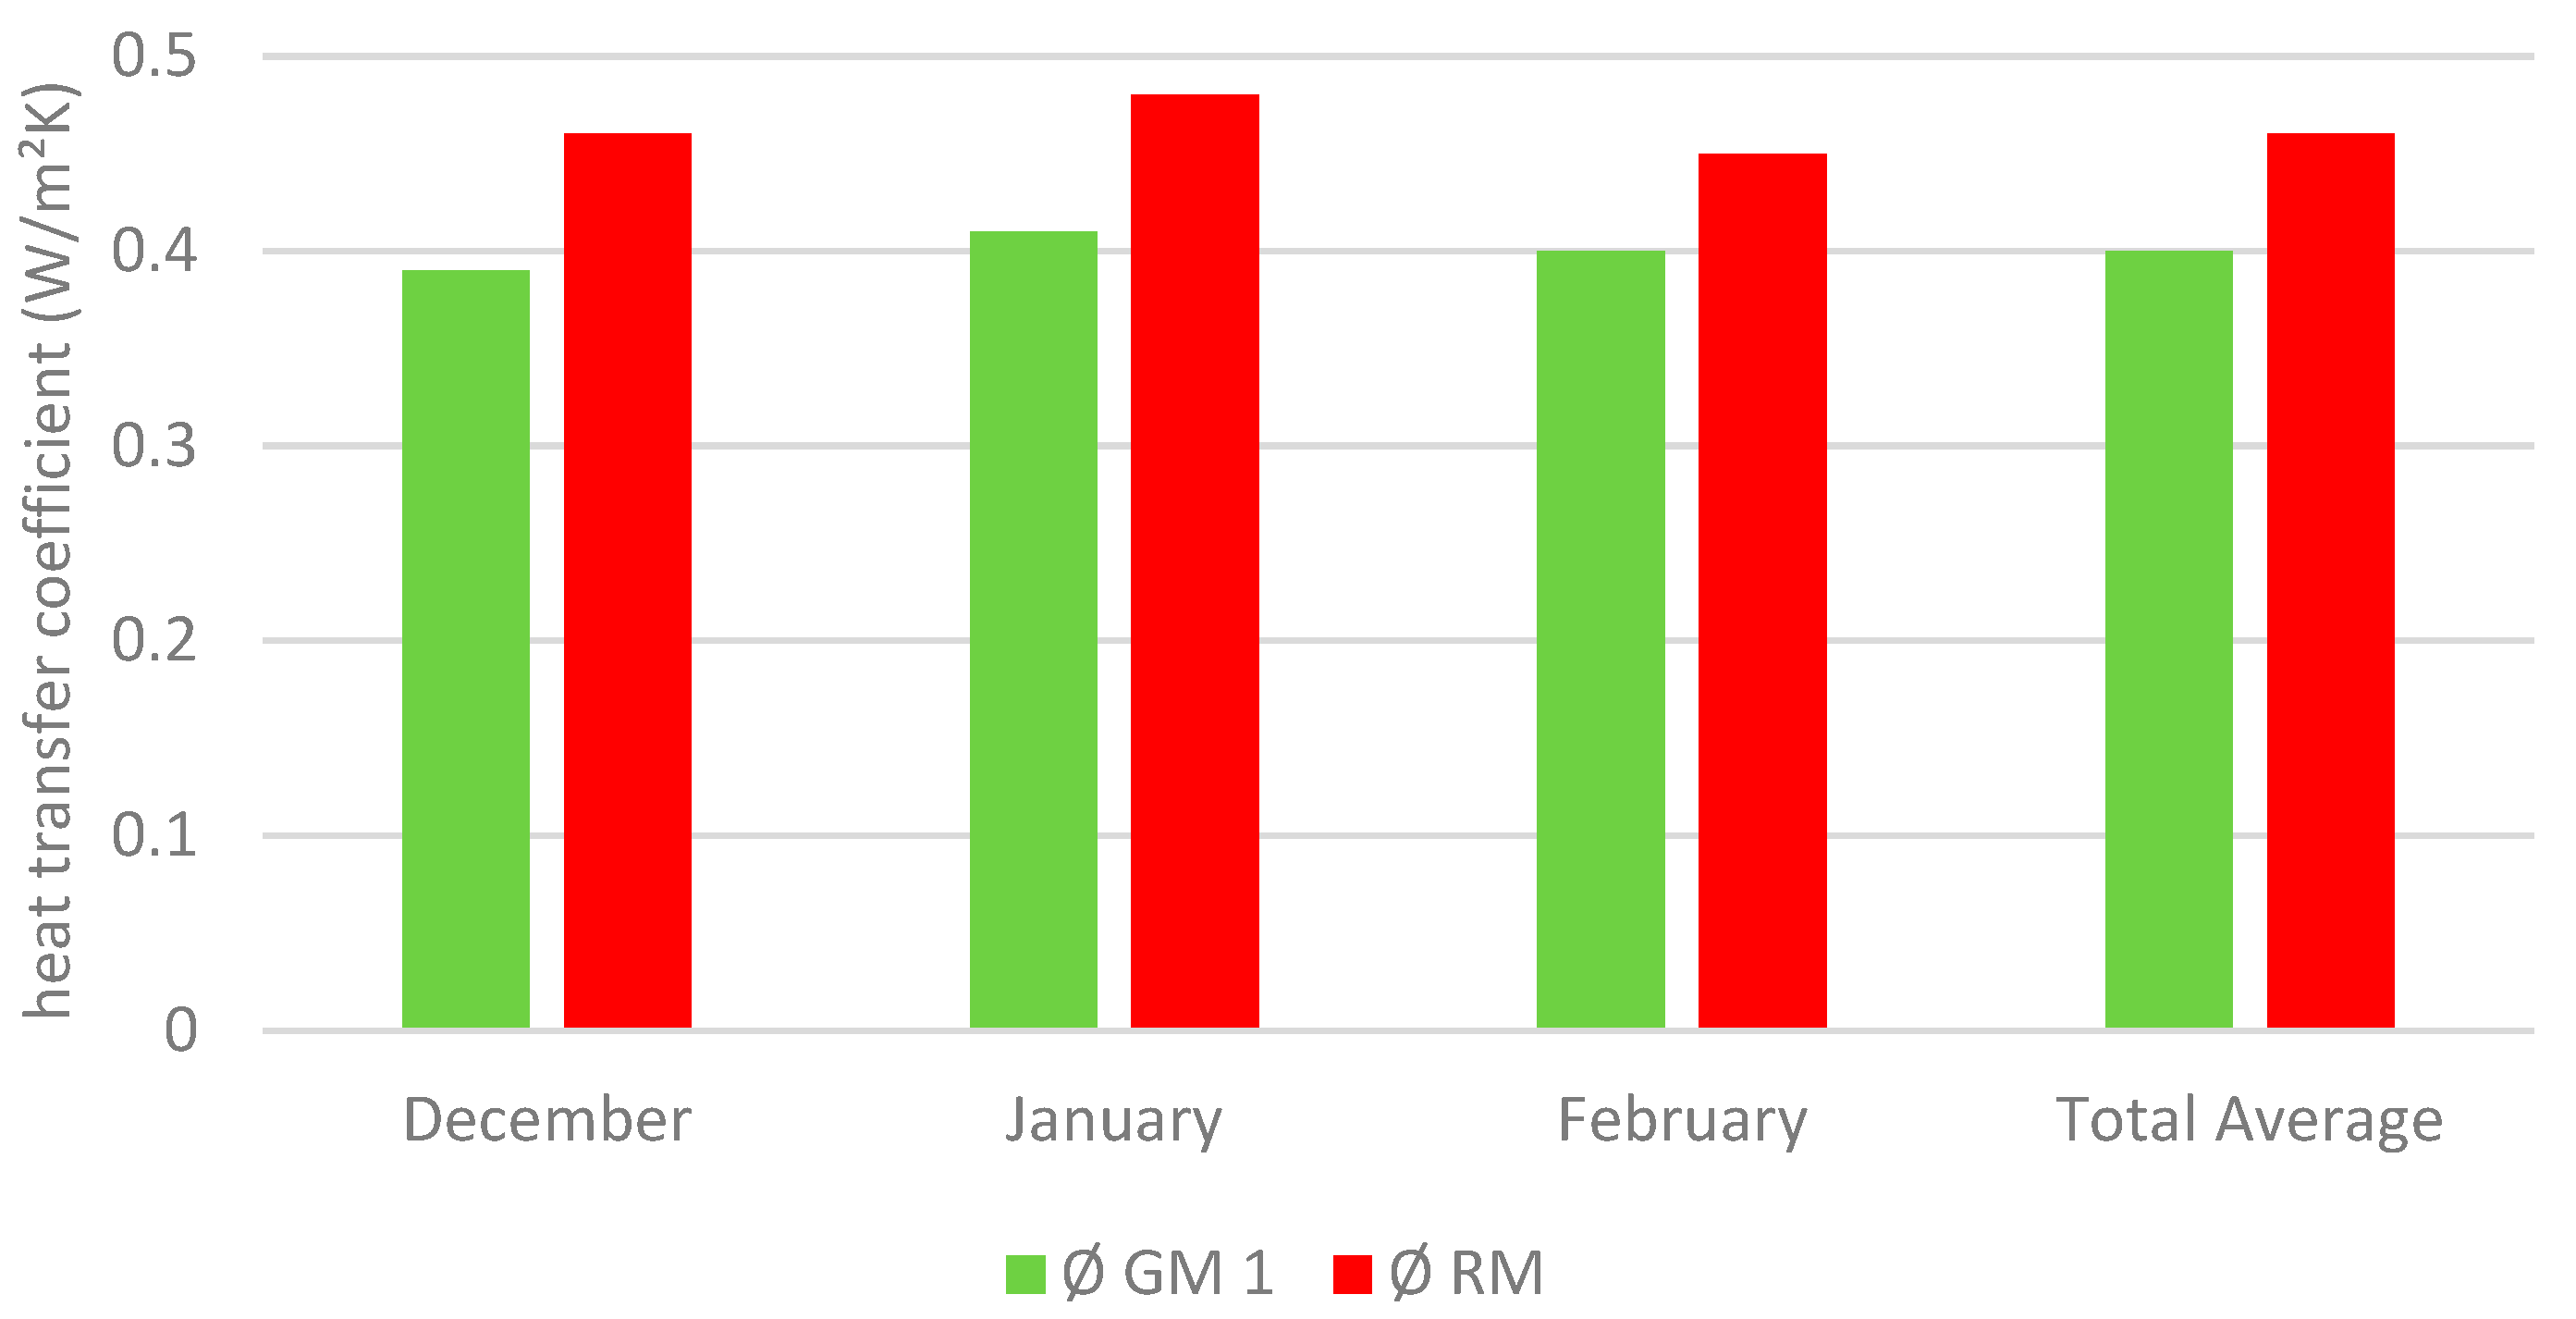
Figure 9.
Heat transfer coefficient, Muthgasse, comparison of average values during winter.
Figure 9.
Heat transfer coefficient, Muthgasse, comparison of average values during winter.
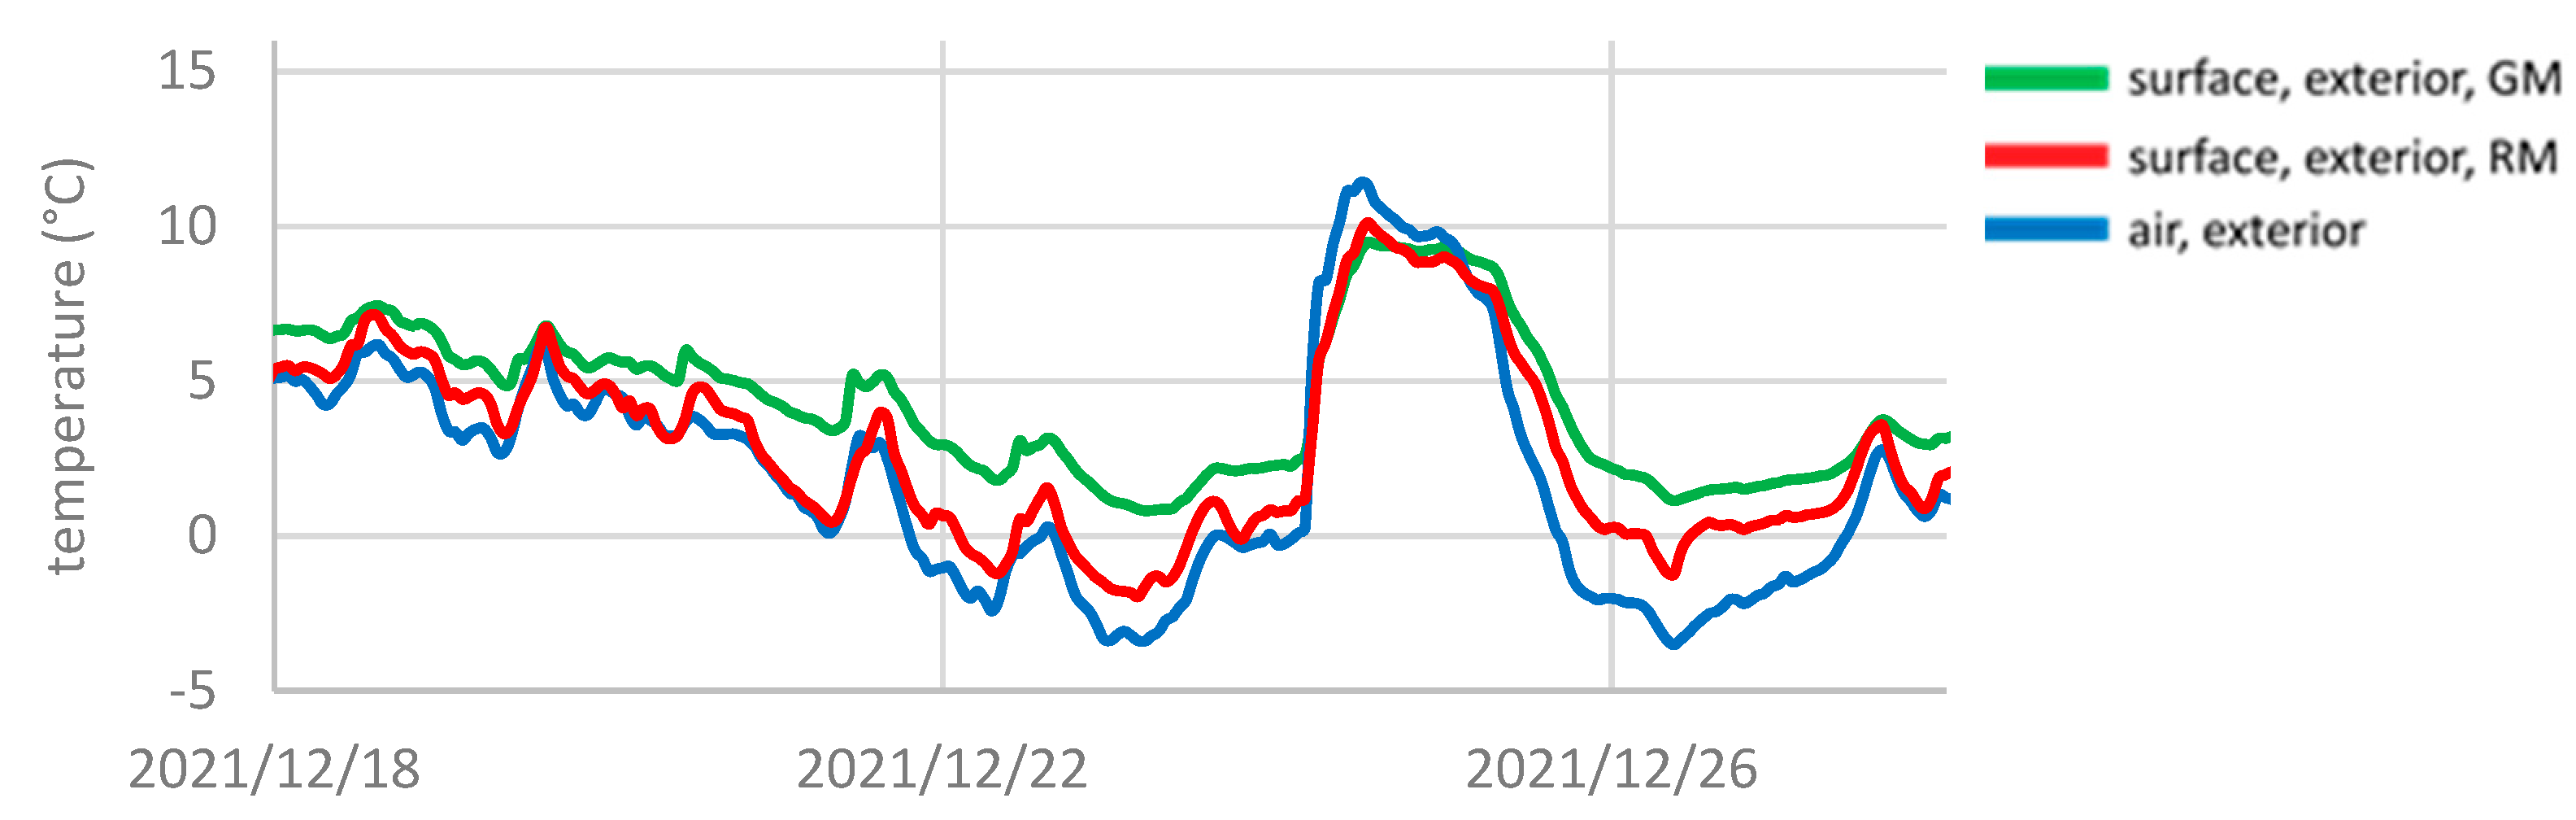
Figure 10.
Surface temperature, exterior, Kopalgasse, course during winter days.
Figure 10.
Surface temperature, exterior, Kopalgasse, course during winter days.
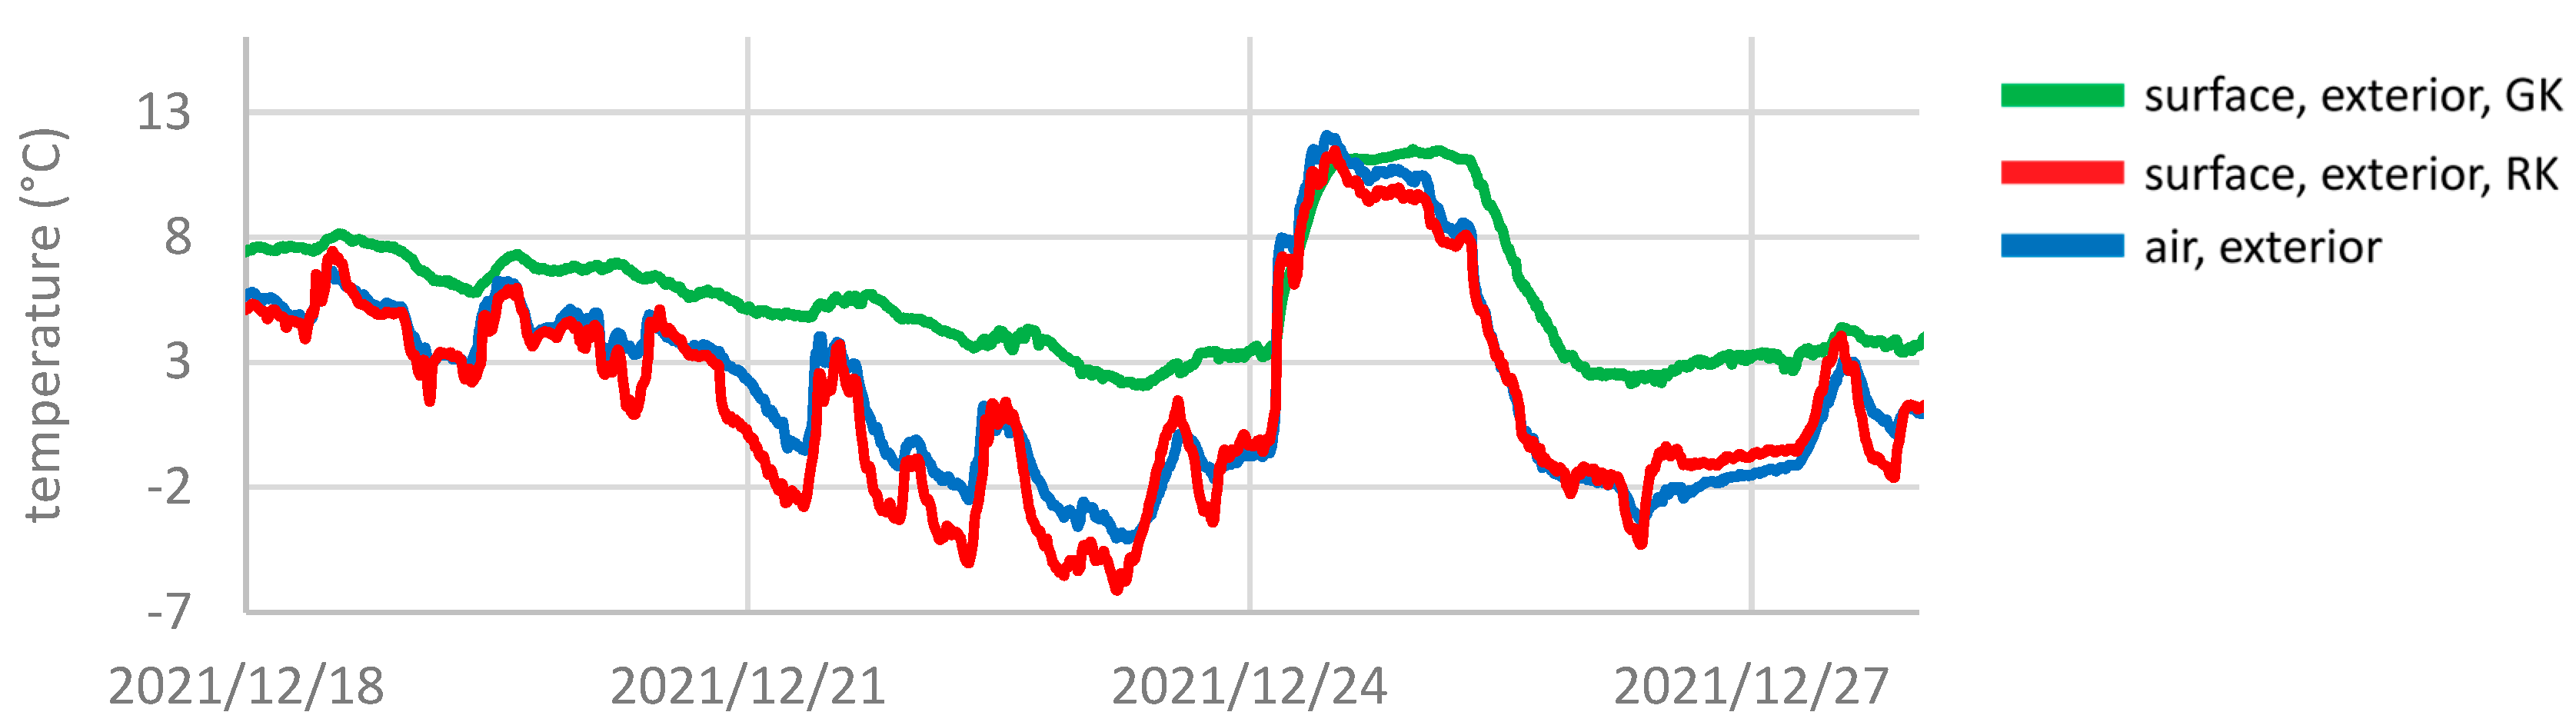
Figure 11.
Surface temperature, exterior, Muthgasse, course during winter days.
Figure 11.
Surface temperature, exterior, Muthgasse, course during winter days.
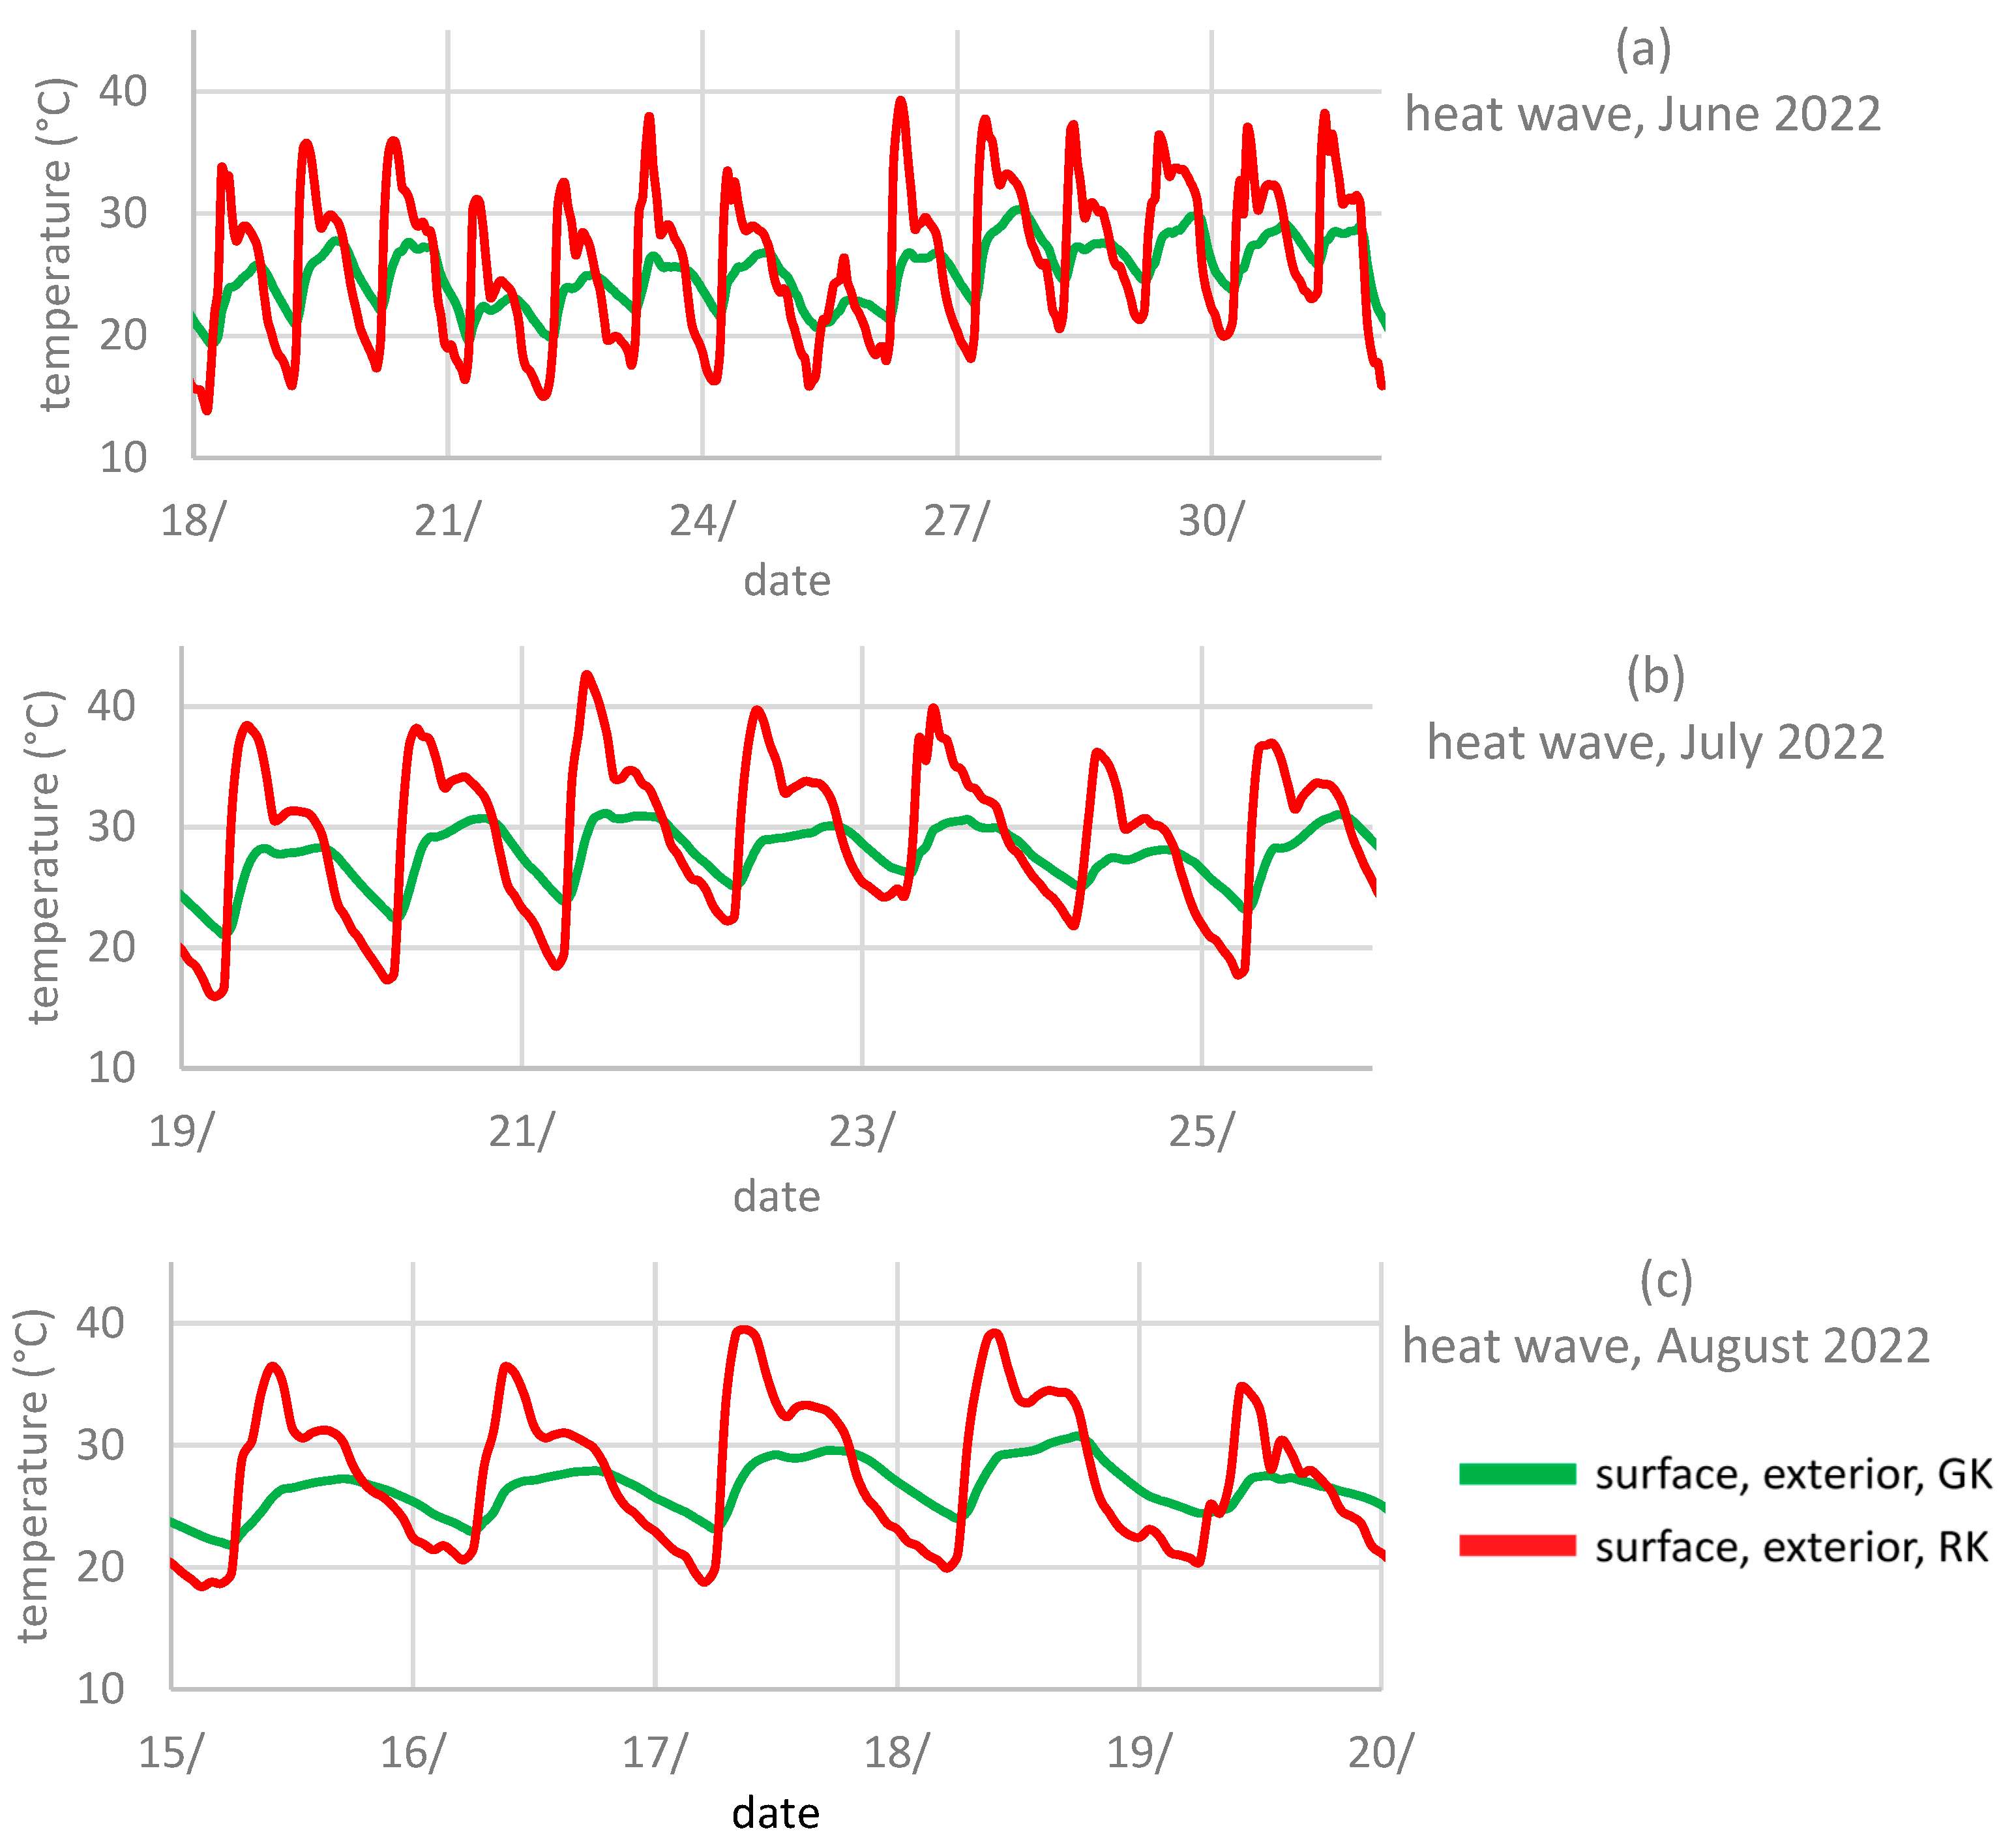
Figure 12.
Surface temperature, exterior, Kopalgasse: course during heat waves, (a) June, (b) July, and (c) August.
Figure 12.
Surface temperature, exterior, Kopalgasse: course during heat waves, (a) June, (b) July, and (c) August.
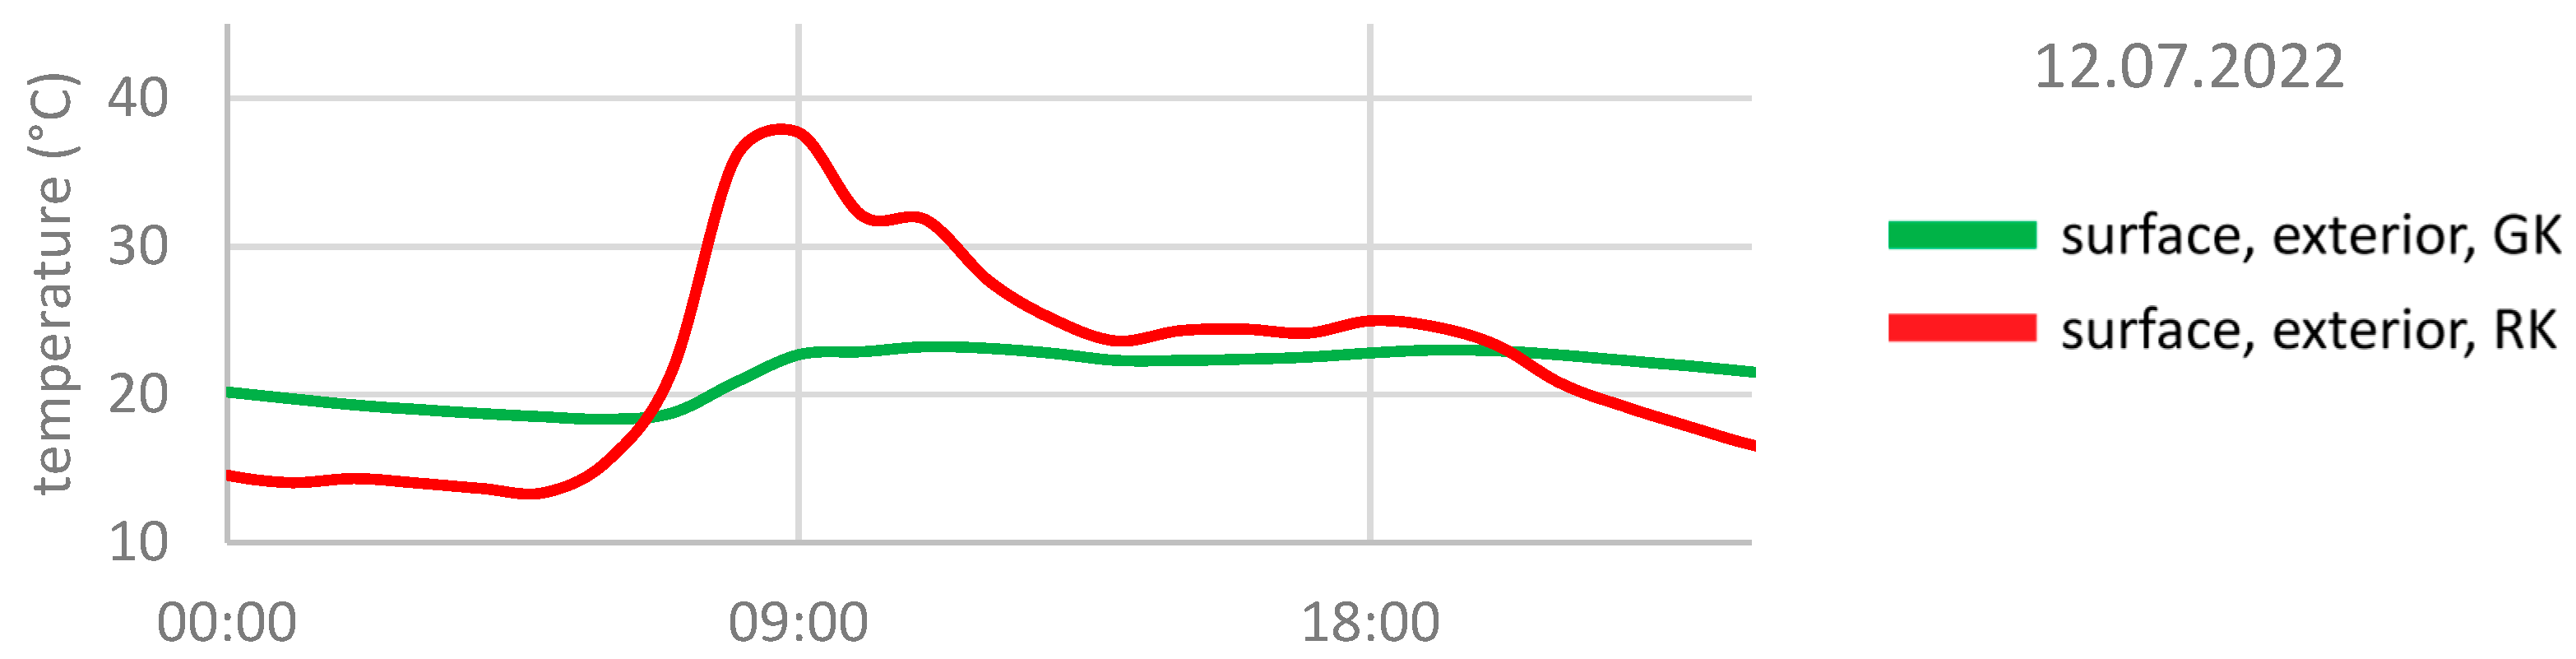
Figure 13.
Surface temperature exterior, Kopalgasse, course on 21 July 2022.
Figure 13.
Surface temperature exterior, Kopalgasse, course on 21 July 2022.
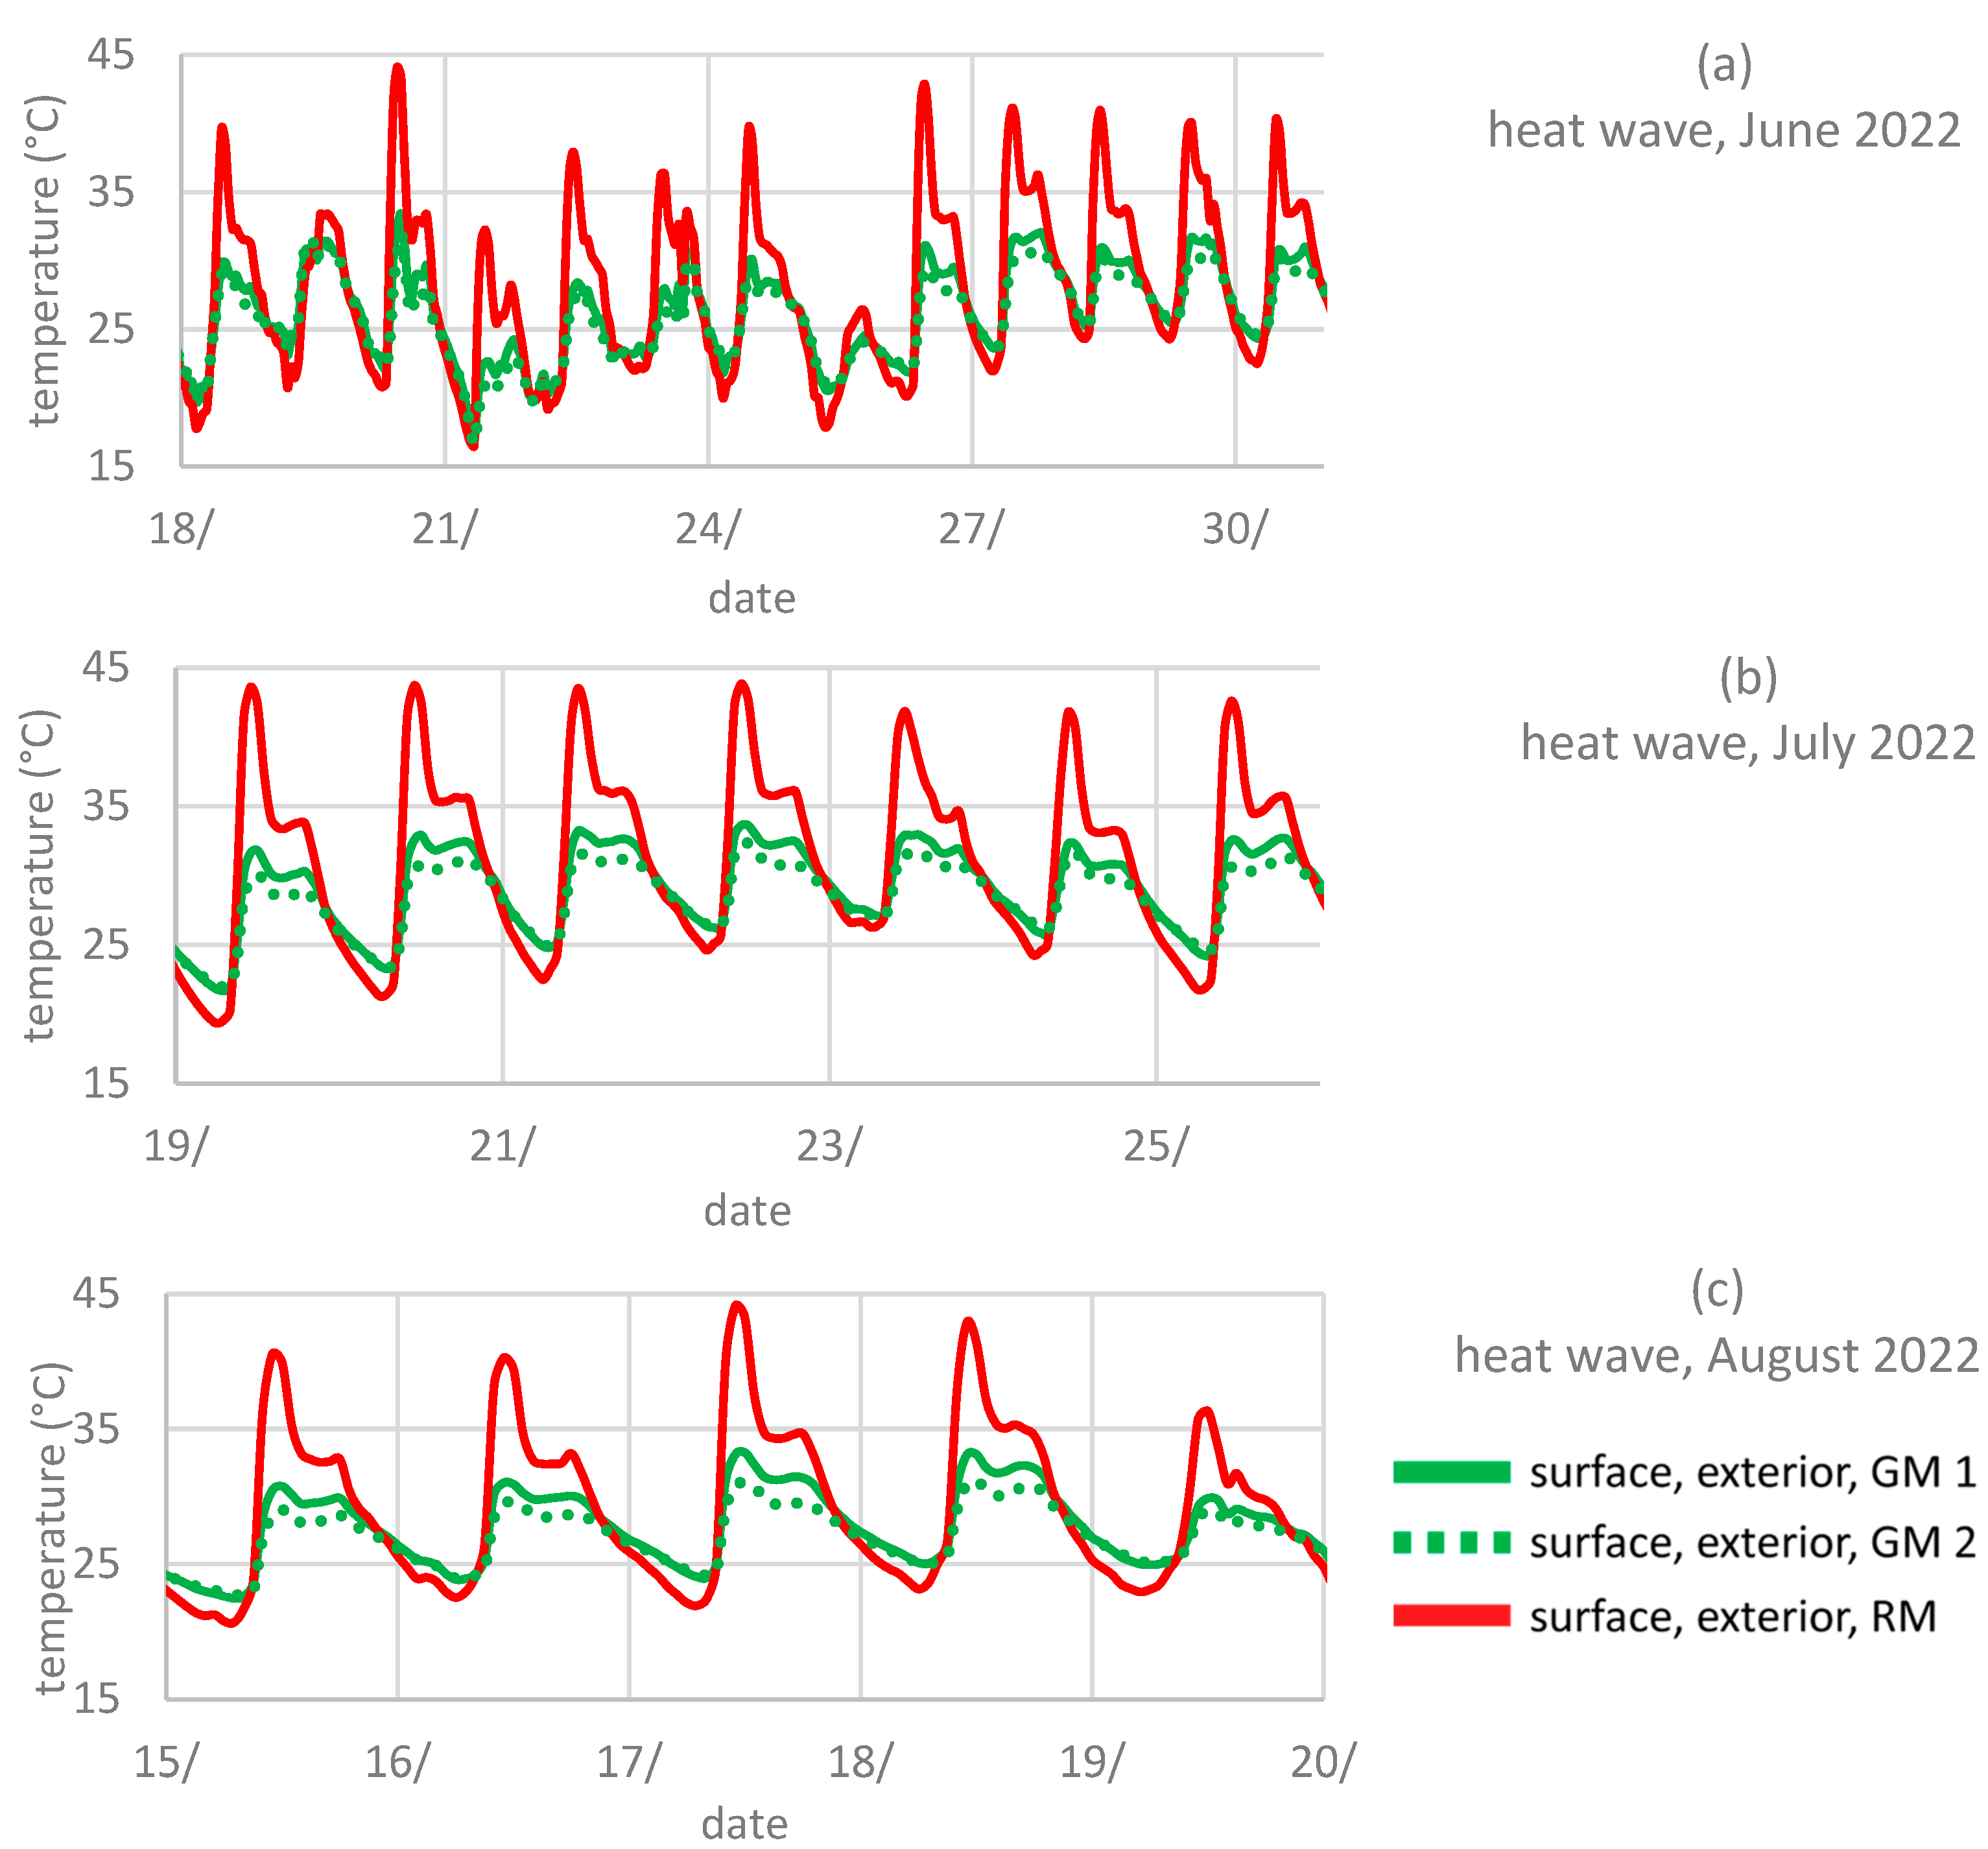
Figure 14.
(a–c) Surface temperature, exterior, Muthgasse: course during heat waves, (a) June, (b) July, and (c) August.
Figure 14.
(a–c) Surface temperature, exterior, Muthgasse: course during heat waves, (a) June, (b) July, and (c) August.
Table 1.
Measured values and corresponding sensors in use.
Table 1.
Measured values and corresponding sensors in use.
| Parameter | Unit | Equipment | Accuracy |
|---|
| Heat flow | q | (W/m²) | Phymeas® (Cottbus, Germany), Heat flow measuring plate | ±5% |
| Surface temperature, interior | Tsi | (°C) | RS PRO (Frankfurt am Main, Germany) PT1000 temperature probe | CLASS 5 |
| Surface temperature, exterior | Tse |
| Air temperature, interior | Ti | TandD (Matsumoto, Japan), RTR 507B | ±0.3 °C |
| Air temperature, exterior | Te |
Table 2.
Heat transfer coefficient, Kopalgasse, average during winter, filtered data.
Table 2.
Heat transfer coefficient, Kopalgasse, average during winter, filtered data.
| | Filtered Data |
|---|
| Ø U (W/m2K) |
|---|
| GK | RK | Reduction in W/m2K | Reduction in % |
|---|
| November | 0.31 ± 0.18 | 0.41 ± 0.12 | 0.10 | 26 |
| December | 0.24 ± 0.22 | 0.35 ± 0.08 | 0.11 | 32 |
| January | 0.27 ± 0.18 | 0.40 ± 0.13 | 0.13 | 32 |
| Total Average | 0.27 ± 0.03 | 0.39 ± 0.03 | 0.11 ± 0.01 | 30 ± 3 |
Table 3.
Heat transfer coefficient, Muthgasse, average during winter, filtered data.
Table 3.
Heat transfer coefficient, Muthgasse, average during winter, filtered data.
| | Filtered Data |
|---|
| | Ø U (W/m2K) |
|---|
| | GM1 | RM | Reduction in W/m2K | Reduction in % |
|---|
| December | 0.39 ± 0.15 | 0.46 ± 0.18 | 0.07 | 15 |
| January | 0.41 ± 0.11 | 0.48 ± 0.12 | 0.07 | 15 |
| February | 0.40 ± 0.07 | 0.45 ± 0.08 | 0.05 | 11 |
Total
Average | 0.40 ± 0.01 | 0.46 ± 0.01 | 0.06 ± 0.01 | 14 ± 2 |
Table 4.
Heat transfer coefficient, Muthgasse, average during winter, filtered data.
Table 4.
Heat transfer coefficient, Muthgasse, average during winter, filtered data.
| | Filtered Data |
|---|
| | Temperature Difference and Heat Flux Density |
|---|
| | Ø Tsi − Tse (°C) | Ø Ti − Te (°C) | Ø Heat Flux Density (W/m2) |
|---|
| | Green | Reference | Green | Reference | Green | Reference |
|---|
| December | 16.4 ± 0.9 | 18.1 ± 1.3 | 21.0 ± 1.6 | 20.9 ± 1.6 | 6.7 ± 0.6 | 7.9 ± 0.5 |
| January | 16.3 ± 0.8 | 18.0 ± 1.3 | 20.5 ± 1.5 | 20.4 ± 1.5 | 6.8 ± 0.9 | 8.2 ± 1.0 |
| February | 20.1 ± 4.3 | 21.0 ± 3.3 | 20.6 ± 2.6 | 20.7 ± 2.6 | 8.2 ± 1.1 | 9.3 ± 1.2 |
| Total Average | 17.6 ± 2.2 | 19.0 ± 1.7 | 20.7 ± 0.3 | 20.7 ± 0.3 | 7.2 ± 0.8 | 8.5 ± 0.7 |
Table 5.
Surface temperature, exterior, Kopalgasse, average values of the winter months, unfiltered data.
Table 5.
Surface temperature, exterior, Kopalgasse, average values of the winter months, unfiltered data.
| | Unfiltered Data |
|---|
| | Surface Temperature, Exterior (°C) |
|---|
| | GK | RK | GK | RK | Difference in °C | Difference in % |
|---|
| | Min. | Max. | Min. | Max. | Average | Average | | |
|---|
| November | 4.7 | 12.6 | −2.4 | 14.2 | 7.7 ± 2.1 | 4.2 ± 3.2 | 3.5 | 45 |
| December | 2.1 | 14.3 | −6.1 | 15.2 | 6.7 ± 2.6 | 3.5 ± 3.9 | 3.2 | 48 |
| January | 1.2 | 14.3 | −6.3 | 15.8 | 6.2 ± 2.9 | 3.7 ± 3.9 | 2.5 | 40 |
| Average | 2.7 ± 1.8 | 13.7 ± 1.0 | −4.9 ± 2.2 | 15.1 ± 0.8 | 6.9 ± 0.8 | 3.8 ± 0.4 | 3.1 ± 0.5 | 44 ± 4 |
Table 6.
Surface temperature, exterior, Muthgasse, average values of the winter months, unfiltered data.
Table 6.
Surface temperature, exterior, Muthgasse, average values of the winter months, unfiltered data.
| | Unfiltered Data |
|---|
| | Surface Temperature, Exterior (°C) |
|---|
| | GM1 | RM | GM1 | RM | | |
|---|
| | Min. | Max. | Min. | Max. | Average | Average | Difference in °C | Difference in % |
|---|
| December | 0.8 | 12.2 | −2.0 | 11.2 | 5.0 ± 2.9 | 3.9 ± 3.6 | 1.1 | 21 |
| January | −0.3 | 13.4 | −3.6 | 13.3 | 5.4 ± 2.9 | 4.2 ± 3.3 | 1.2 | 22 |
| February | 4.2 | 14.9 | 0.9 | 14.9 | 8.6 ± 2.3 | 7.3 ± 2.8 | 1.3 | 15 |
| Average | 1.6 ± 2.3 | 13.5 ± 1.4 | −1.6 ± 2.3 | 13.1 ± 1.9 | 6.3 ± 2.0 | 5.1 ± 1.9 | 1.2 ± 0.1 | 19 ± 4 |
Table 7.
Surface temperature exterior, Kopalgasse, average values of the summer months, unfiltered data.
Table 7.
Surface temperature exterior, Kopalgasse, average values of the summer months, unfiltered data.
| | Unfiltered Data |
|---|
| | Surface Temperature, Exterior (°C) |
|---|
| | GK | RK | GK | RK | Difference |
|---|
| | Min. | Max. | Min. | Max. | Average | Average | Max. |
|---|
| June | 18.3 | 30.4 | 15.8 | 40.6 | 24.2 ± 2.3 | 26.2 ± 5.3 | 2.0 ± 4.8 | 16.7 |
| July | 18.0 | 31.2 | 15.8 | 43.9 | 25.1 ± 2.8 | 26.5 ± 5.9 | 1.4 ± 4.9 | 17.3 |
| August | 19.5 | 31.3 | 17.1 | 41.1 | 24.7 ± 2.3 | 25.7 ± 5.2 | 1.0 ± 4.2 | 13.3 |
| Total Average | 18.6 ± 0.6 | 31.0 ± 0.4 | 16.2 ± 0.6 | 41.9 ± 1.5 | 24.7 ± 0.4 | 26.1 ± 0.3 | 1.5 ± 0.4 | 15.8 ± 1.8 |
Table 8.
Surface temperature exterior, Kopalgasse, average values of the summer months, filtered data.
Table 8.
Surface temperature exterior, Kopalgasse, average values of the summer months, filtered data.
| | Filtered Data |
|---|
| | Surface Temperature, Exterior (°C) |
|---|
| | GK | RK | GK | RK | Difference |
|---|
| Heat Wave | Min. | Max. | Min. | Max. | Average | Average | Max. |
|---|
| June | 19.5 | 30.4 | 16.0 | 39.8 | 25.5 ± 2.3 | 26.9 ± 5.6 | 1.4 ± 4.7 | 14.8 |
| July | 21.2 | 31.2 | 17.3 | 43.2 | 27.5 ± 2.3 | 28.8 ± 6.2 | 1.3 ± 5.0 | 14.3 |
| August | 21.9 | 30.8 | 18.3 | 41.0 | 26.0 ± 2.2 | 26.9 ± 5.6 | 0.9 ± 3.7 | 13.3 |
| Total Average | 20.9 ± 1.0 | 30.8 ± 0.3 | 17.2 ± 0.9 | 41.3 ± 1.4 | 26.3 ± 0.8 | 27.5 ± 0.9 | 1.2 ± 0.2 | 14.1 ± 0.6 |
Table 9.
Surface temperature exterior, Muthgasse, average values of the summer months, unfiltered data.
Table 9.
Surface temperature exterior, Muthgasse, average values of the summer months, unfiltered data.
| | Unfiltered Data |
|---|
| | Surface Temperature, Exterior (°C) |
|---|
| | GM1 | GM2 | RM | GM1 | GM2 | RM |
|---|
| | Min. | Max. | Min. | Max. | Min. | Max. | Average | Average | Average |
|---|
| June | 15.6 | 33.4 | 14.5 | 32.0 | 15.6 | 44.1 | 24.4 ± 3.7 | 23.9 ± 3.5 | 26.2 ± 6.1 |
| July | 18.1 | 33.6 | 18.5 | 32.3 | 16.6 | 43.8 | 25.5 ± 3.7 | 25.2 ± 3.1 | 26.6 ± 6.4 |
| August | 18.5 | 33.7 | 18.8 | 31.5 | 17.1 | 44.8 | 25.2 ± 3.2 | 24.9 ± 2.6 | 26.0 ± 5.7 |
| Average | 17.4 ± 1.3 | 33.6 ± 0.1 | 17.3 ± 2.0 | 31.9 ± 0.3 | 16.0 ± 0.6 | 44.2 ± 0.4 | 25.0 ± 0.5 | 24.7 ± 0.6 | 26.3 ± 0.2 |
Table 10.
Surface temperature exterior, Muthgasse: average values of the summer months, filtered data.
Table 10.
Surface temperature exterior, Muthgasse: average values of the summer months, filtered data.
| | Filtered Data |
|---|
| | Surface Temperature, Exterior (°C) |
|---|
| | GM1 | GM2 | RM | GM1 | GM2 | RM |
|---|
| Heat Wave | Min. | Max. | Min. | Max. | Min. | Max. | Average | Average | Average |
|---|
| June | 16.7 | 33.4 | 16.7 | 32.0 | 16.5 | 44.1 | 26.4 ± 3.4 | 26.0 ± 3.1 | 28.2 ± 6.0 |
| July | 21.7 | 33.6 | 22.0 | 32.3 | 19.3 | 43.8 | 28.7 ± 3.2 | 28.2 ± 2.6 | 30.3 ± 6.3 |
| August | 22.5 | 33.3 | 22.7 | 31.1 | 20.7 | 44.1 | 27.3 ± 2.9 | 26.7 ± 2.2 | 28.4 ± 5.7 |
| Average | 20.3 ± 2.6 | 33.4 ± 0.1 | 20.5 ± 2.7 | 31.8 ± 0.5 | 18.8 ± 1.7 | 44.0 ± 0.1 | 27.5 ± 0.9 | 27.0 ± 0.9 | 29.0 ± 0.9 |
Table 11.
Surface temperature, exterior, Muthgasse: difference between summer months, unfiltered data.
Table 11.
Surface temperature, exterior, Muthgasse: difference between summer months, unfiltered data.
| | Unfiltered Data |
|---|
| | Surface Temperature, Exterior (°C) |
|---|
| | GM1 | GM2 |
|---|
| | Difference | Difference |
|---|
| | Average | Maximum | Average | Maximum |
|---|
| June | 1.8 ± 3.4 | 11.8 | 2.3 ± 3.9 | 13.7 |
| July | 1.1 ± 3.3 | 12.0 | 1.4 ± 3.8 | 13.9 |
| August | 0.8 ± 2.9 | 11.3 | 1.1 ± 3.5 | 13.6 |
| Average | 1.2 ± 0.4 | 11.7 ± 0.3 | 1.6 ± 0.5 | 13.7 ± 0.1 |
Table 12.
Surface temperature, exterior, Muthgasse: difference between summer months, filtered data.
Table 12.
Surface temperature, exterior, Muthgasse: difference between summer months, filtered data.
| | Filtered Data |
|---|
| | Surface Temperature, Exterior (°C) |
|---|
| | GM1 | GM2 |
|---|
| | Difference | Difference |
|---|
| | Average | Maximum | Average | Maximum |
|---|
| June | 1.8 ± 3.4 | 11.8 | 2.2 ± 3.9 | 13.7 |
| July | 1.5 ± 3.6 | 12.0 | 2.1 ± 4.2 | 13.9 |
| August | 0.9 ± 3.1 | 11.3 | 1.4 ± 3.7 | 13.6 |
| Average | 1.4 ± 0.4 | 11.7 ± 0.3 | 1.9 ± 0.4 | 13.7 ± 0.1 |
Table 13.
Results of the exterior surface temperature in comparison with other investigations.
Table 13.
Results of the exterior surface temperature in comparison with other investigations.
| | | Kopalgasse
(Table 7) | Muthgasse
(Table 9) | Hoelscher et al. [13] |
|---|
| Reduction of exterior surface-temperature (Tse) | Average | 1.5 | 1.4 (1.9) 1 | 2.2 |
| Maximum | 15.8 | 11.7 (13.7) 1 | 13.9 |


