
Development of a New Model for the Formation of Wax Deposits through the Passage of Crude Oil within the Well


Abstract
:1. Introduction
1.1. Preventing and Removing of Wax Deposits
1.2. Digitalization of the Oil Industry
1.3. Mechanisms for the Formation of Wax Deposition
1.4. Mathematical Models of the Formation of Wax Deposition
1.5. Oil Flow Modes
2. Materials and Methods
2.1. “Wax Flow Loop” Installation
2.2. Definition of WAT
2.3. Fluid Properties and Operational Parameters of Oil Wells
3. Intermediate Results of Creating a Wax Deposition Formation Model
3.1. A series of Laboratory Studies on Fluid Sample “A”
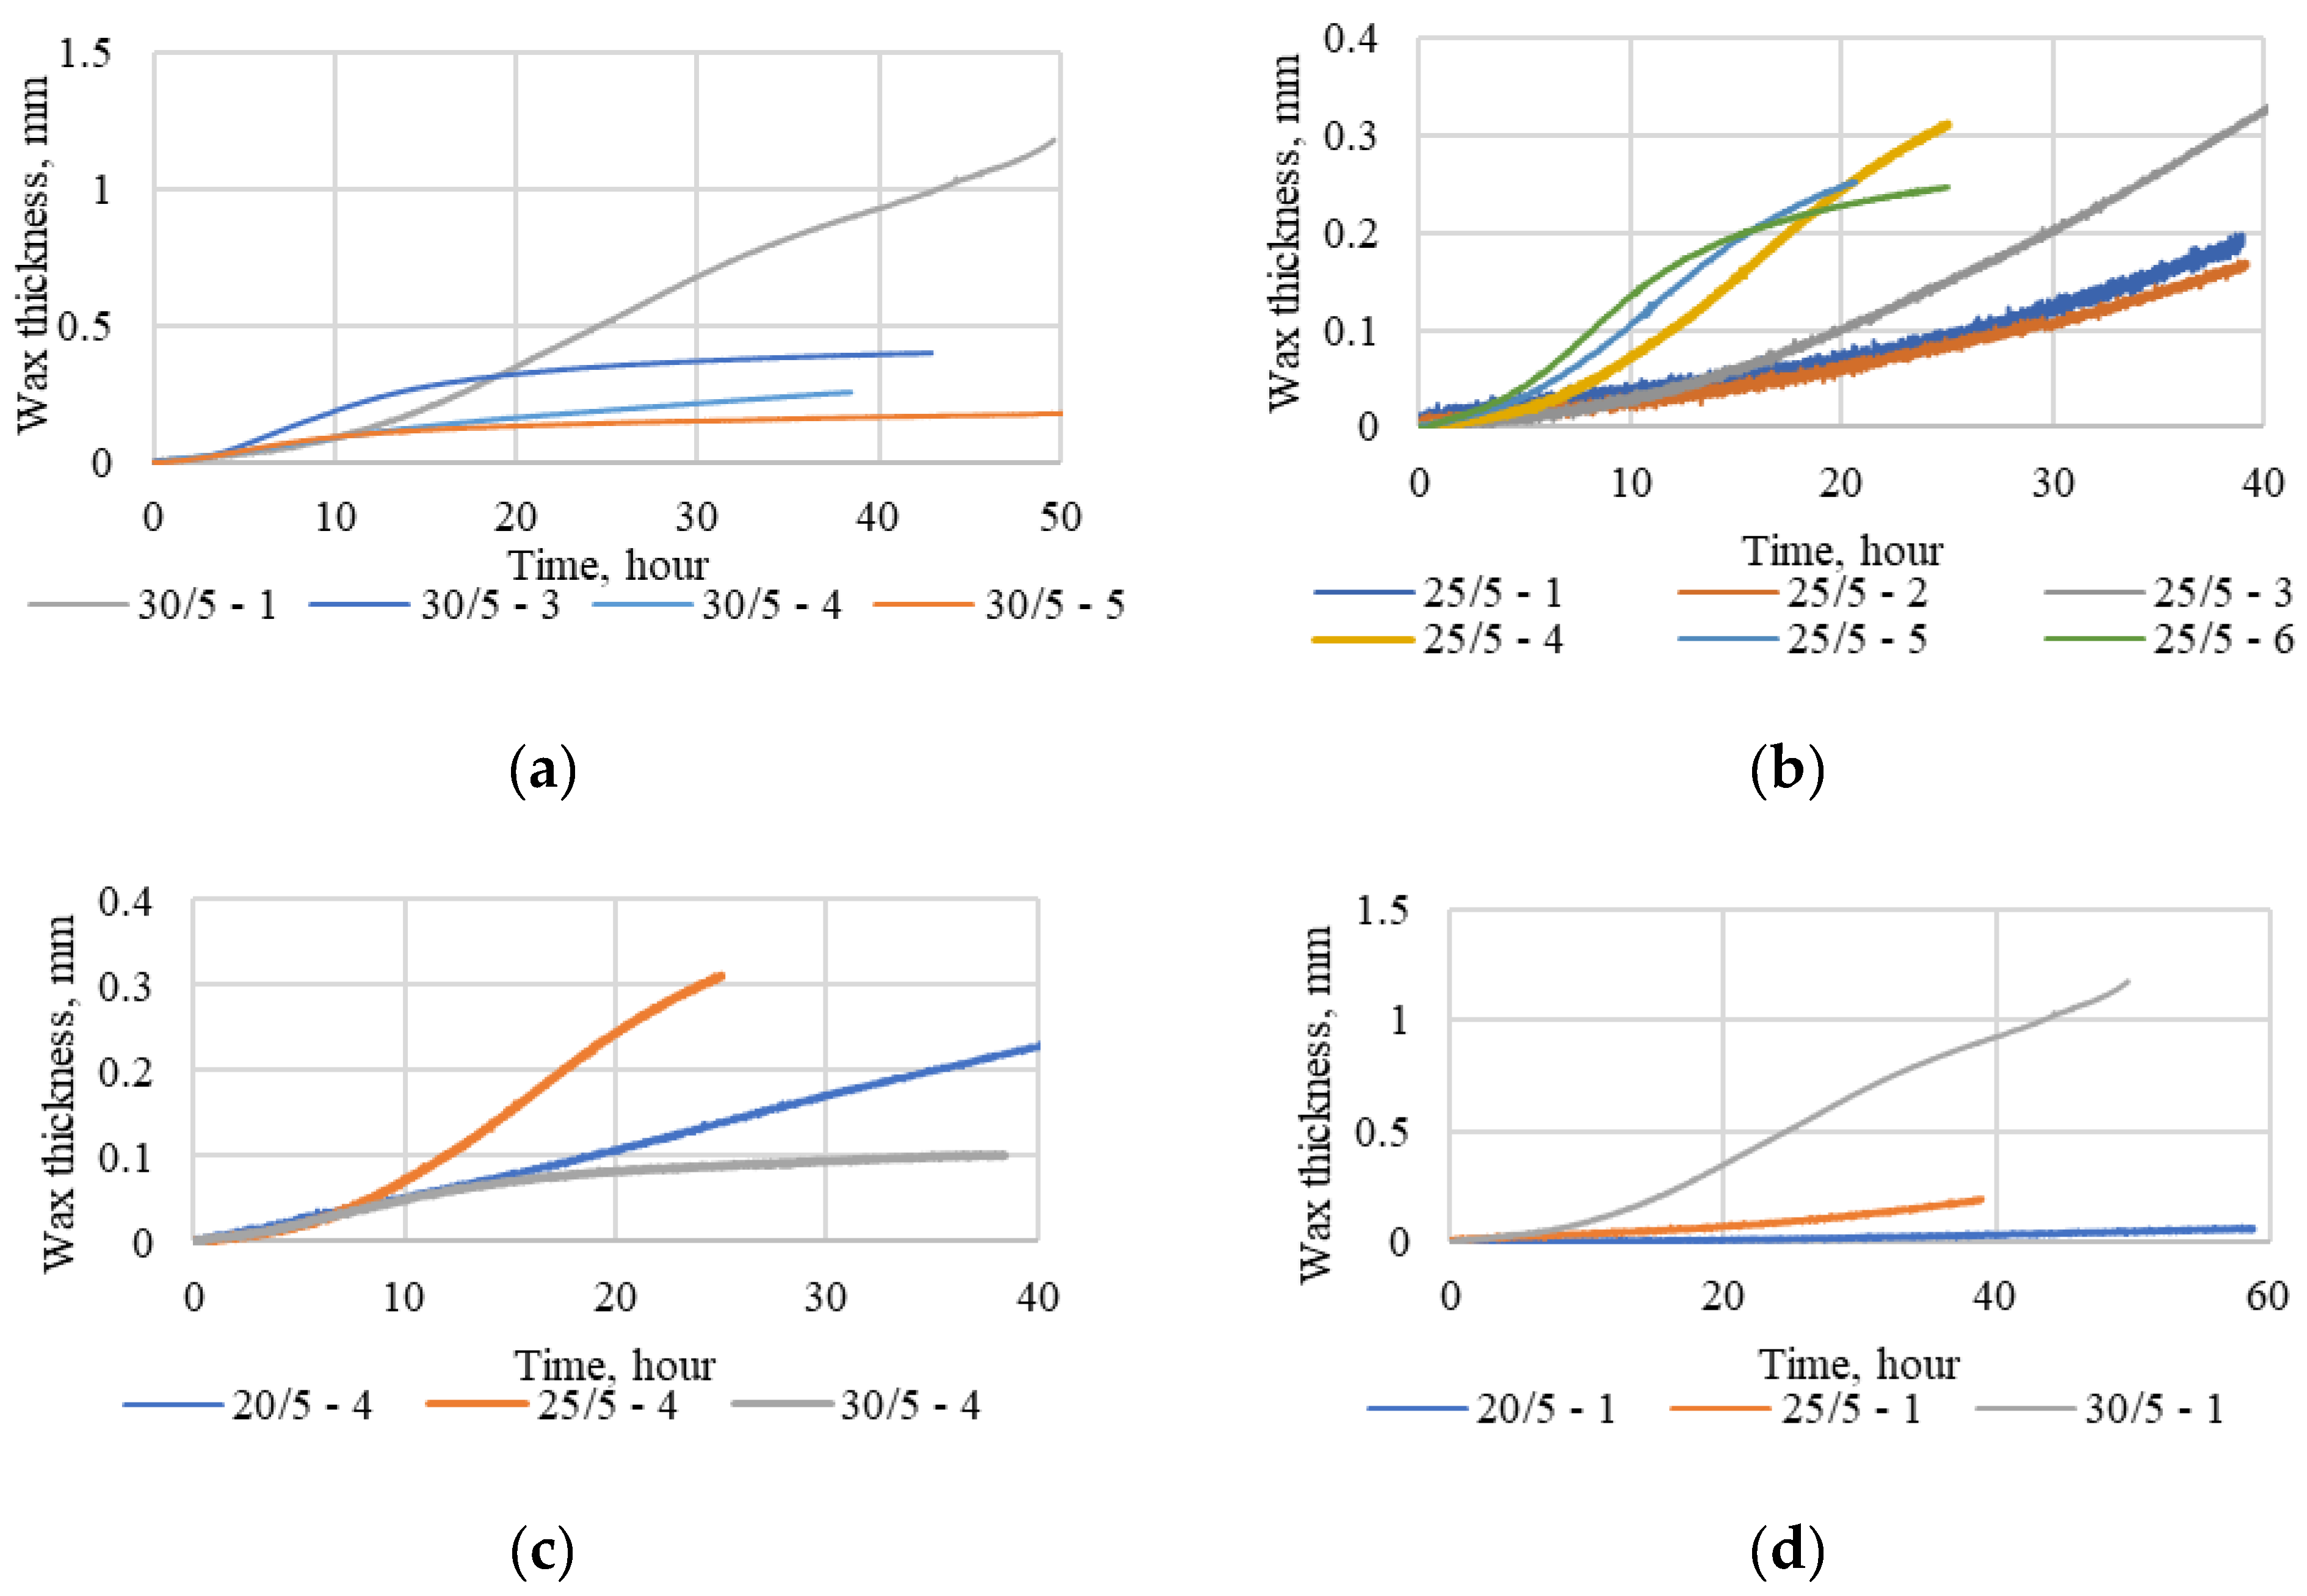
- Analysis of Figure 2a indicates a decrease in the rate of wax formation with an increase in the oil flow rate. At high oil temperature and movement speed, the liquid does not have time to cool down to achieve WAT and the highest intensity of wax deposition formation. As a result, a decrease in the flow rate leads to its cooling and the flow reaches WAT with an increase in the intensity of wax formation.
- At the same time, the opposite dependence is observed in Figure 2b, an increase in the flow rate leads to an increase in the intensity of wax deposition formation. This is due to the fact that the oil temperature during the study is equal to WAT. This means that with an increase in the speed of oil movement, the oil temperature in the test section remains higher, respectively, the intensity of the sediment formation process increases.
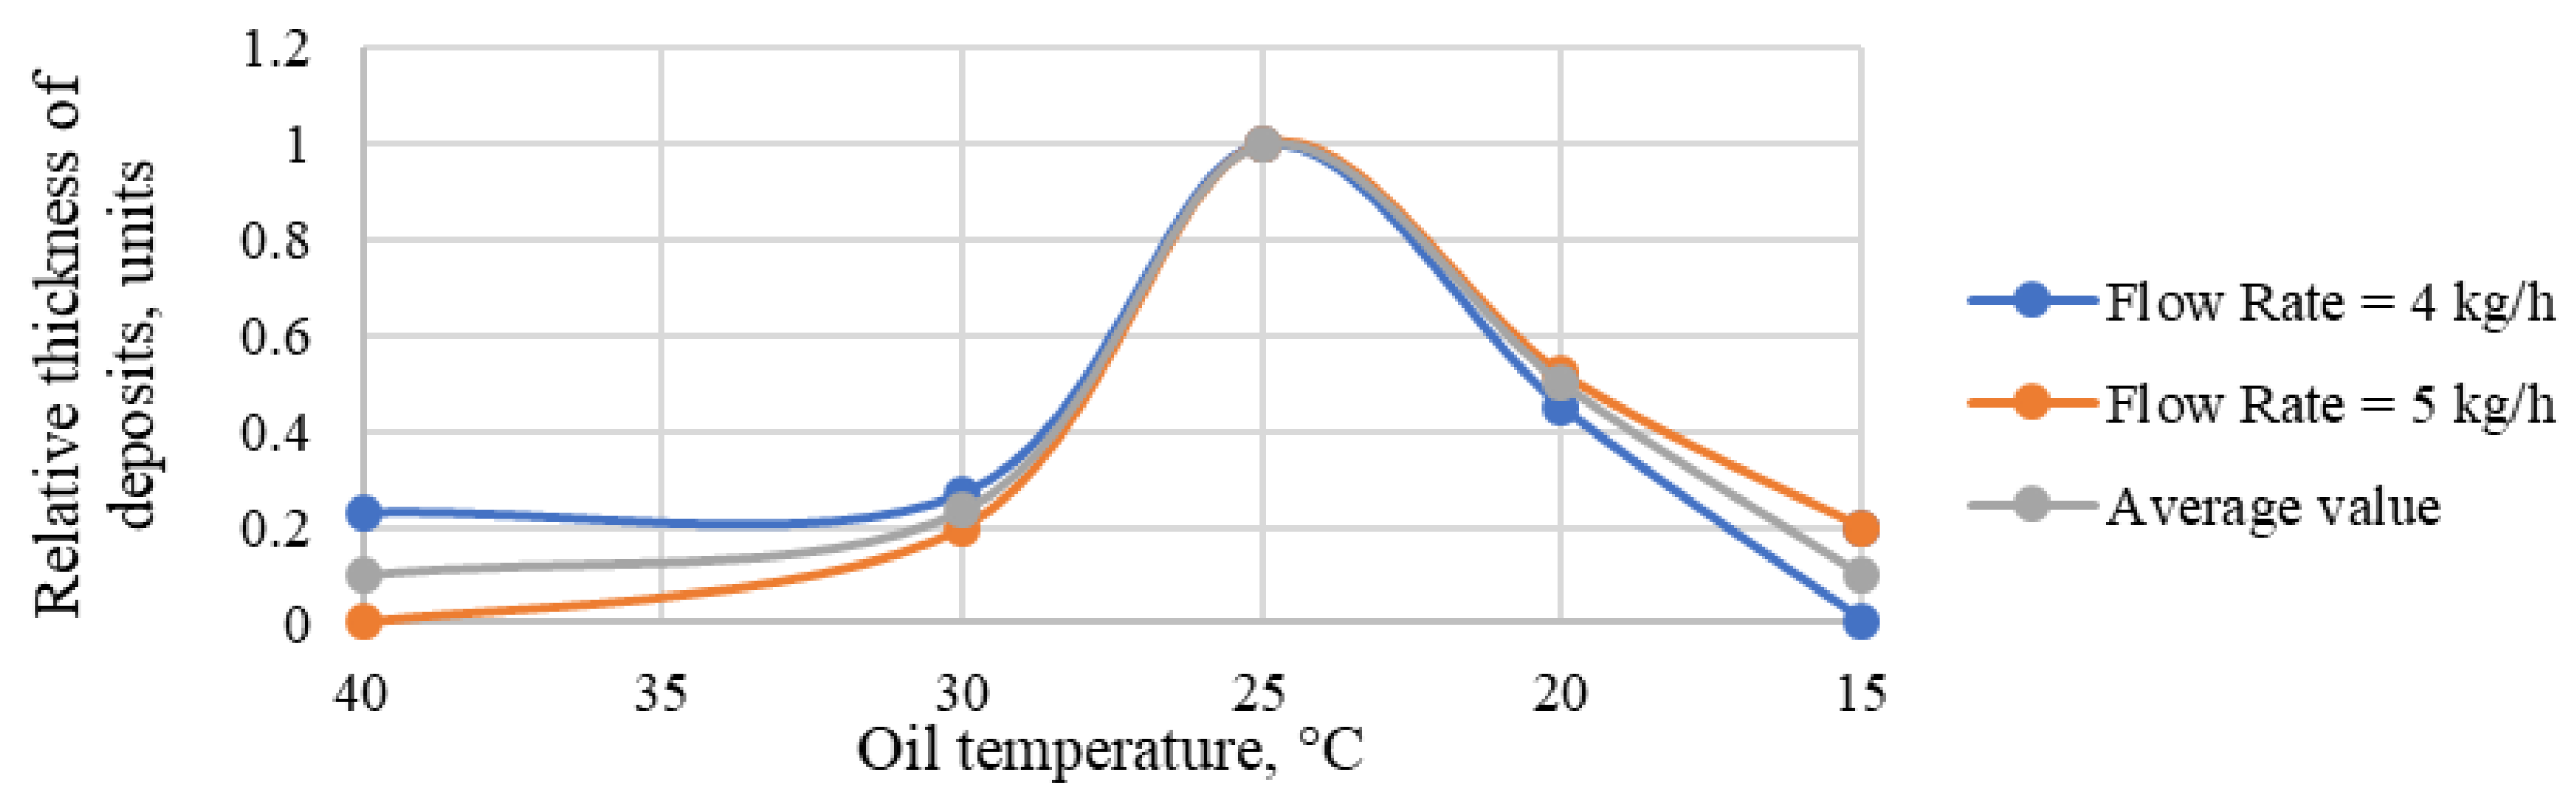
- When considering Figure 2c, it can be noted that at an oil velocity of 4 kg/h, the greatest intensity of wax deposition formation, is observed at a temperature corresponding to WAT. At the same time, Figure 2d shows studies at a lower speed (1 kg/h), at which the greatest intensity of wax deposition formation is achieved at a temperature exceeding WAT (30 °C). This dependence can also be explained by oil cooling. In the study of oil with a temperature above WAT (30 °C) at high speed, this temperature is maintained, as a result of which the formation of deposits is not so intense. At a low temperature of the oil flow, it cools, reaching the highest intensity at a temperature of 25 °C. At the same time, studies at 25 °C and a flow rate of 1 kg/h lead to rapid cooling of oil and a sharp decrease in the intensity of the sediment formation process.
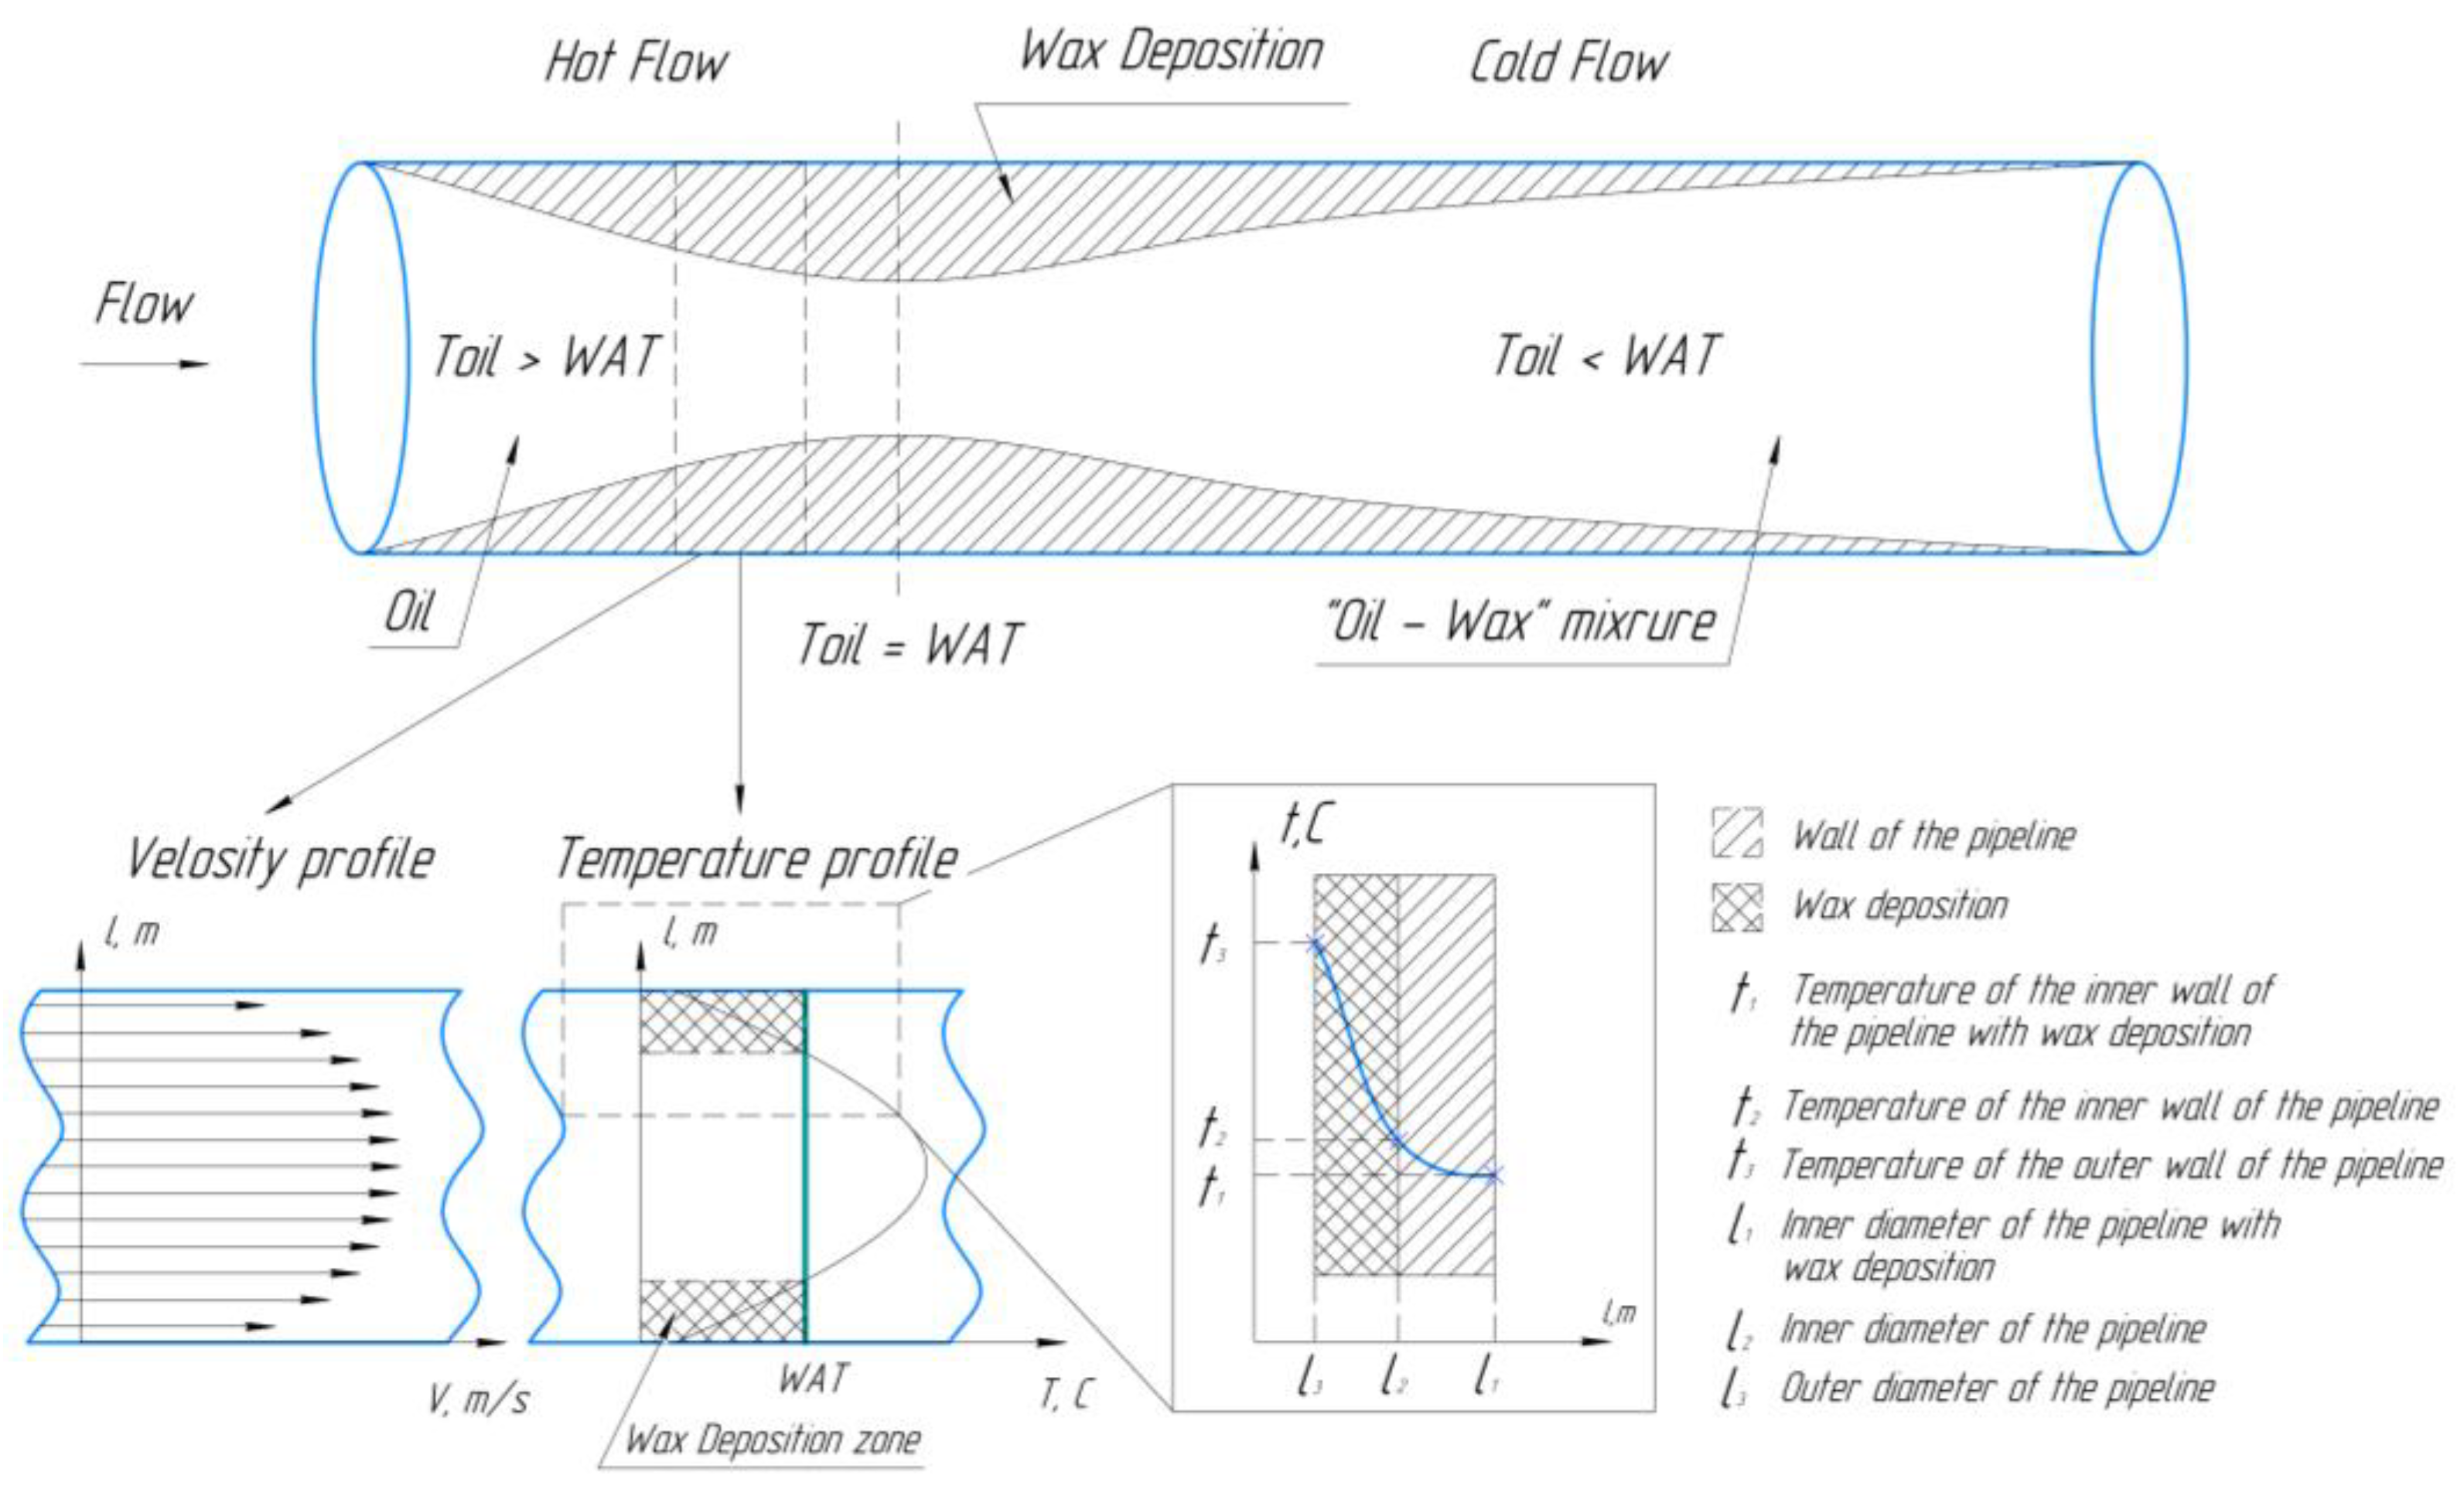
3.2. Application of the Theory of “Hot” and “Cold” Flow
3.3. Studies with a Change in Wall Temperature
3.4. Transfer of Laboratory Research to Field Conditions
4. Wax Deposit Formation Prediction Model
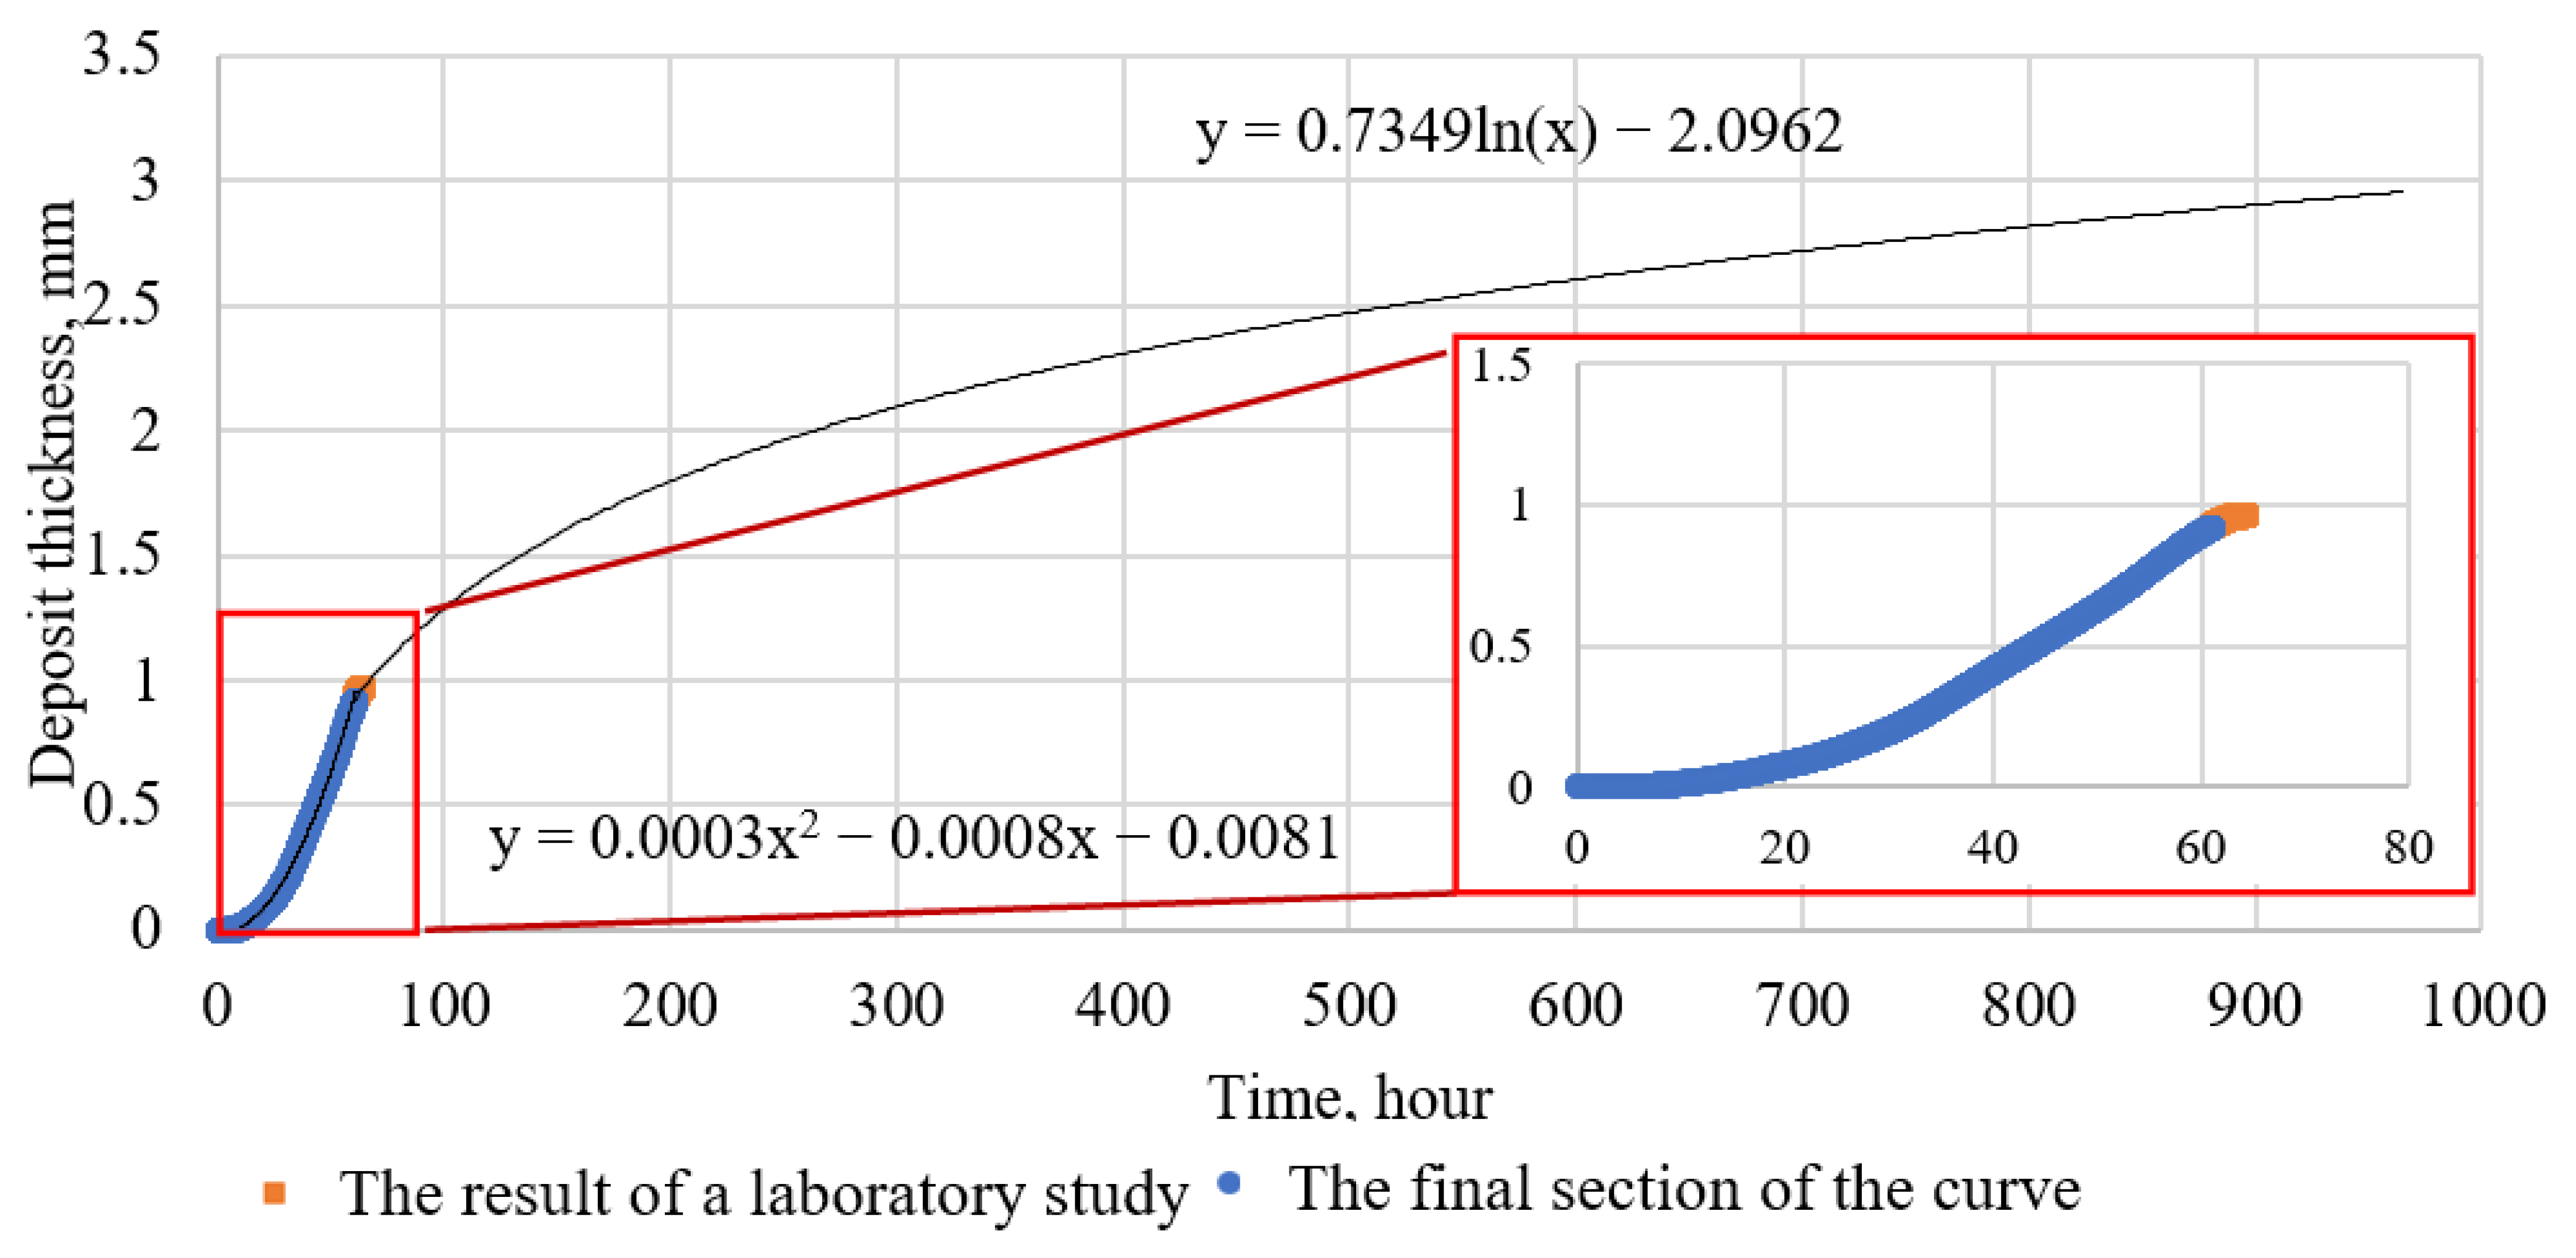
- Performing a “basic” study on the “Wax Flow Loop” installation, it is necessary to determine the shape of the curve for the formation of organic deposits. After the study, it must be approximated for use as a mathematical function. Let us provide, as an example, the result of a laboratory study of an oil sample taken from well No. 8. The properties of the oil sample from the target oil well and parameters of this well are shown in Table 2. Figure 5 shows the result of the study of this sample on the “Wax Flow Loop” installation.
- In addition, a study to estimate the WAT of this oil is necessary. For this sample this value is 16 °C.
- The study performed on the Wax Flow Loop installation is valid only for the conditions in the test section. However, during the movement of oil through the lift column or a linear oil pipeline, it cools and the conditions for wax deposition formation change significantly. It is important to consider that the constancy of the temperature gradient does not mean the constancy of the intensity of wax deposition formation. As described earlier, oil cooling can lead to wax crystallization inside the stream, as a result of which the intensity of wax deposition formation is significantly reduced. To take into account the conditions of oil movement in the developed model, two coefficients are used.
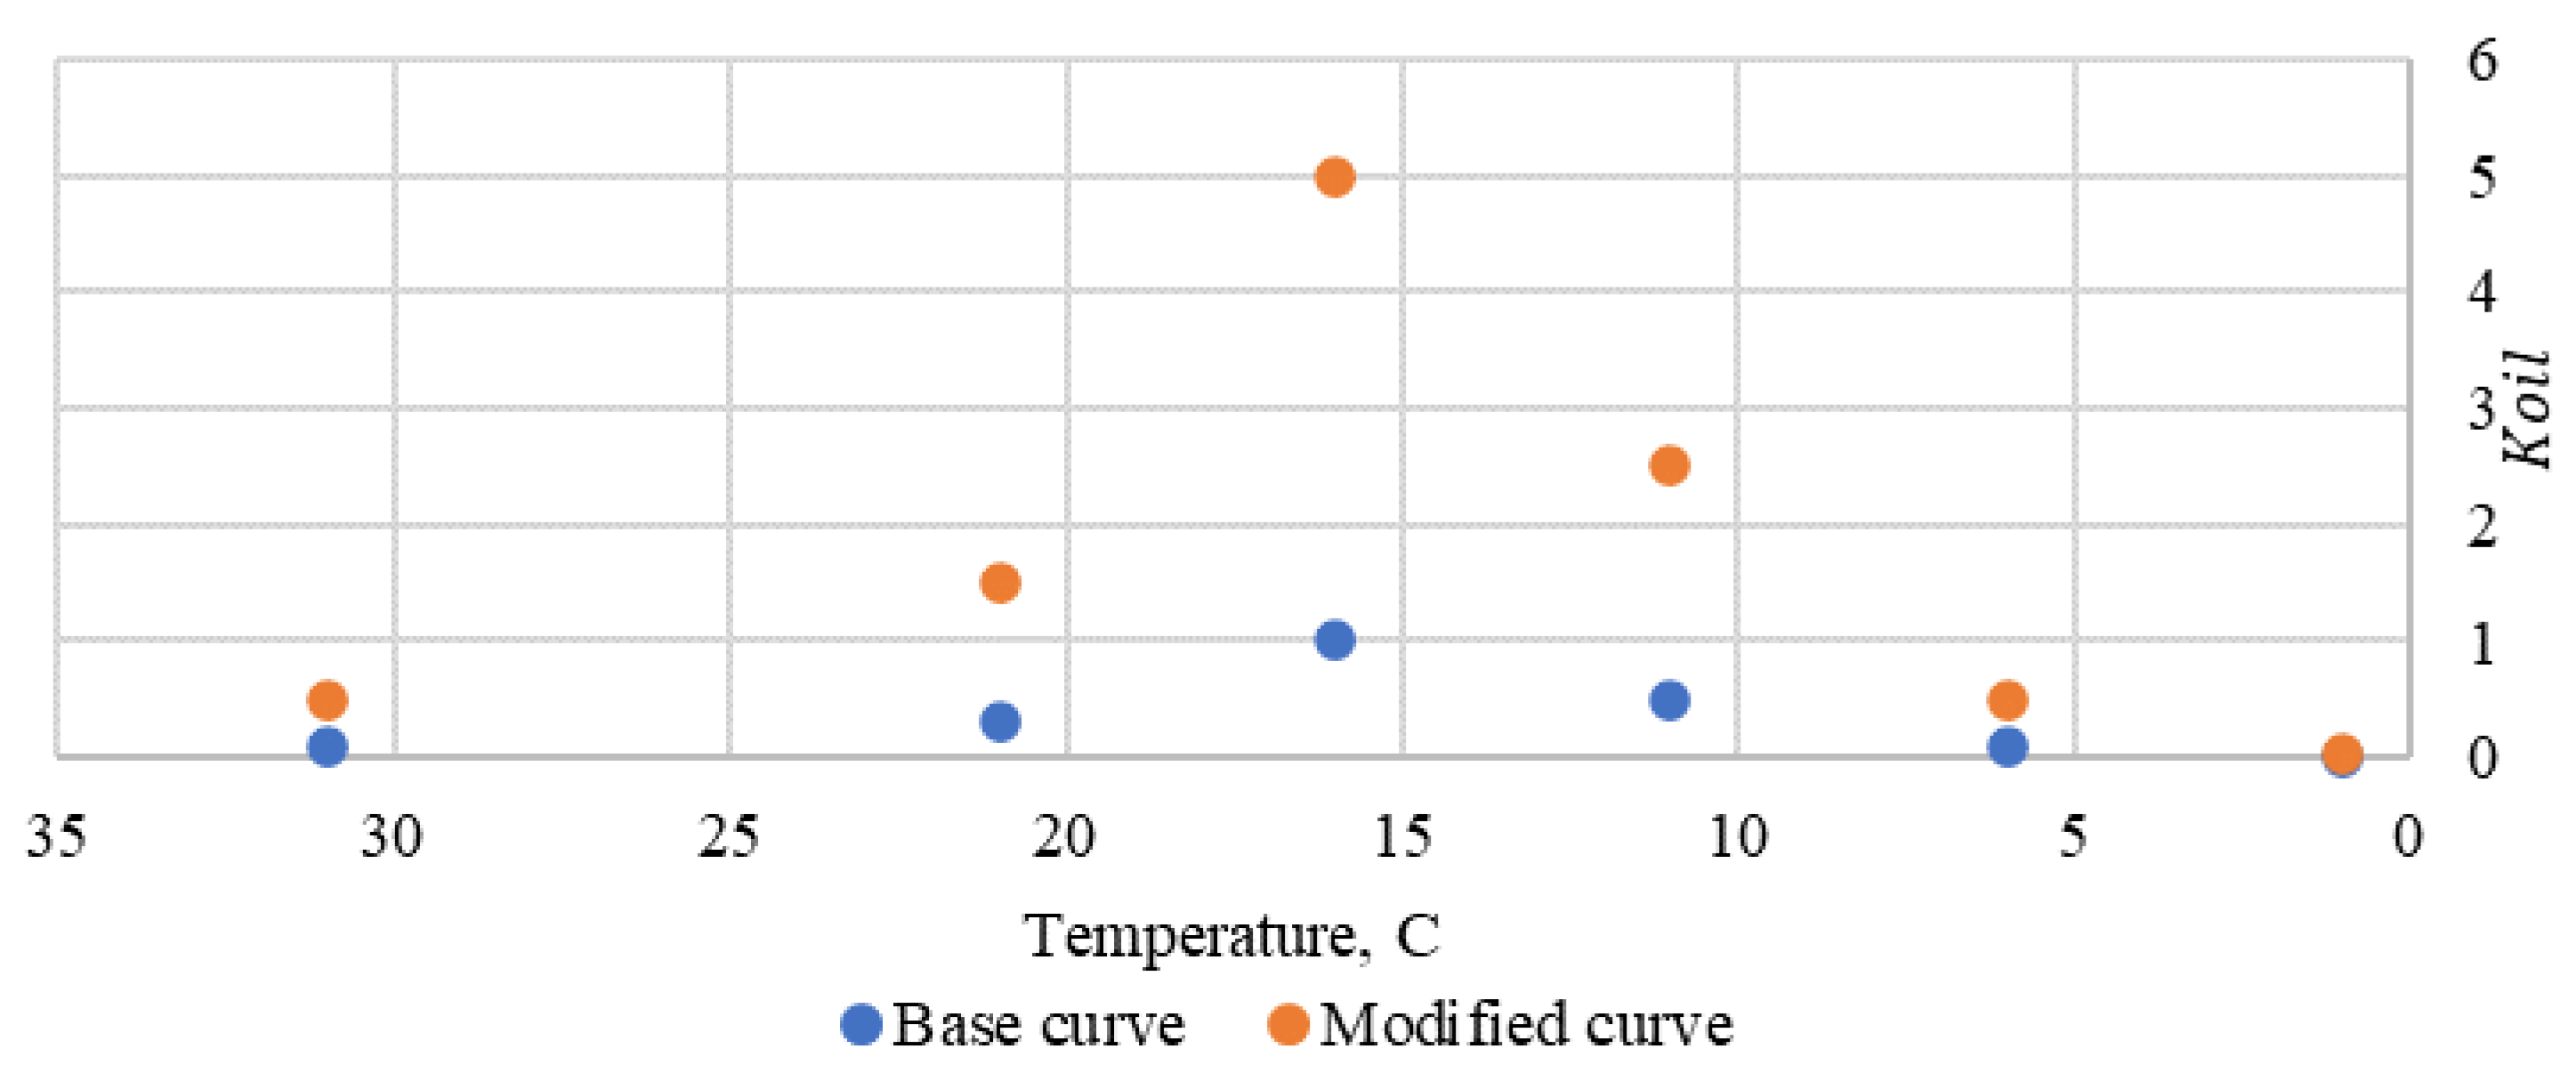
- A coefficient is needed that considers the change in oil temperature (). To determine the value of this coefficient at each moment of time, it is necessary to construct a curve (basic curve), the shape of which was obtained in Section 3.2. This curve is plotted against the WAT value of each oil. At the same time, it is necessary to consider the conditions for performing the study. So, in this example, the study on the Wax Flow Loop installation was performed at an oil temperature of 25 °C. In this regard, the curve must be modified by dividing all values by the value of the base curve at the temperature of the study. This process is shown in Figure 6.
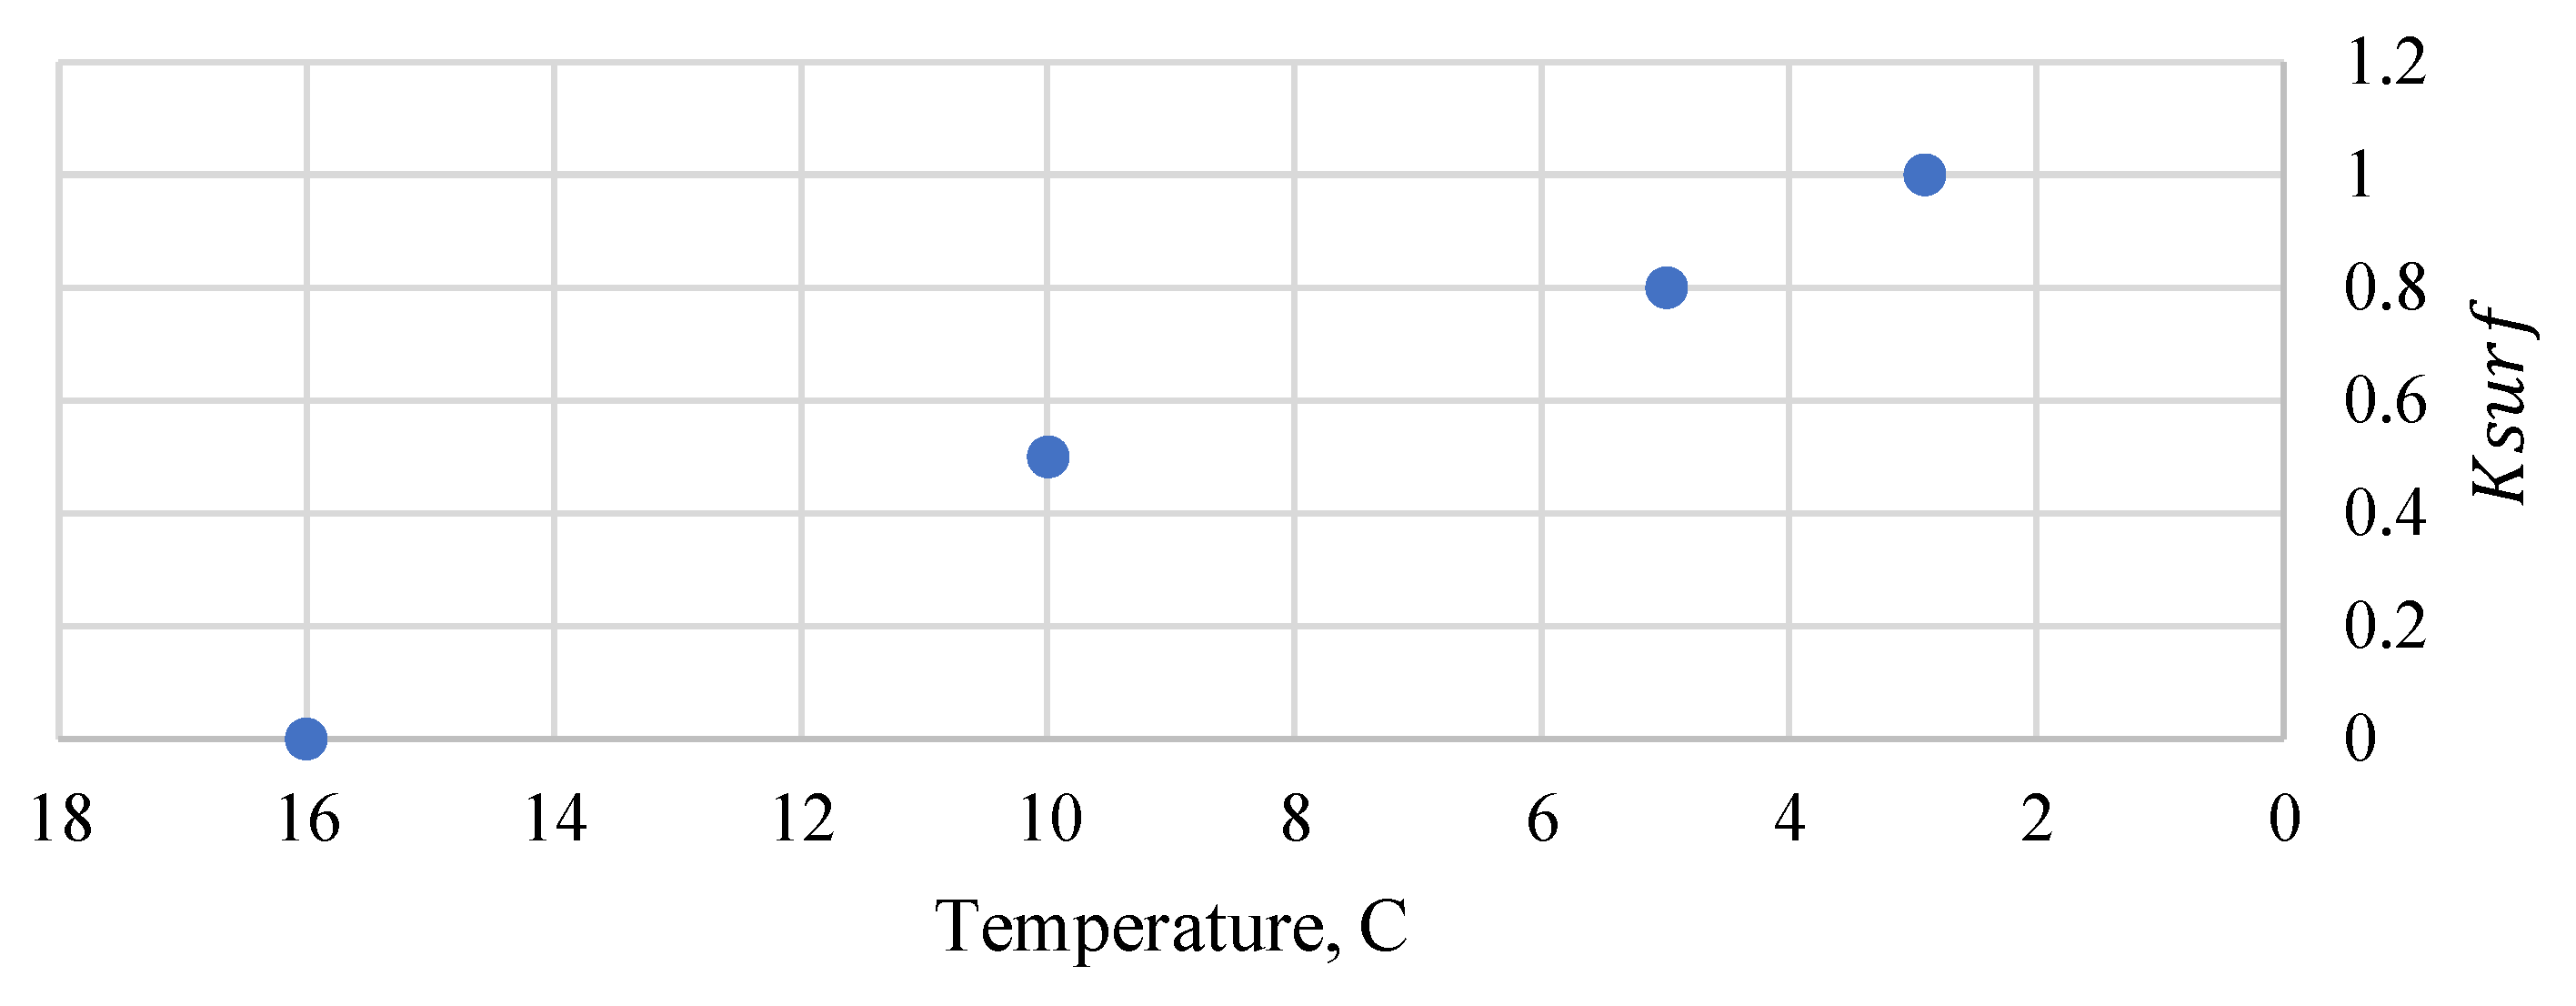
- The coefficient for the wall temperature ( is built based on the coefficients presented after the analysis of Figure 4. It is obvious that above WAT, the formation of deposits does not occur, and as the temperature decreases, the dynamics of the increase in intensity is also assumed to be identical for all the considered oils. An example of the curve is shown in Figure 7.
- The simulation time is set, the temperature profile along the oil wellbore is calculated (Figure 8a). Based on the simulation time, the approximation law is determined and, by supplying the simulation time to it, the base thickness of the deposits is determined. For example, when performing simulation for a period of 936 h using the logarithmic according to the law described in Figure 5, the base deposit thickness is 2.93 mm.
- Based on the calculated wall temperature and the oil flow temperature, the coefficients and are determined. An example is shown in Figure 8b.
- The influence of water cut is assumed to be linear, since only the initial and final points of the influence of water cut are reliably known, and it is obvious that with its increase, the intensity of wax deposition formation decreases.
5. Results of Application of the Developed Model
6. Discussion
- At present, the technique has not been explored in batch wells. The reason for this is the peculiarities of the operating mode of these wells;
- The technique considers the effect of the water cut as a linear one since it is not possible to correctly assess the effect of the water phase on the Wax Flow Loop installation;
- The methodology does not consider the change in oil properties when associated petroleum gas is dissolved in it, which is a technological limitation of the installation;
- It is also important to consider in detail the results with the largest deviation. As an example, in Figure 9, we present the results of comparing the wax profiles for wells No. 1 and 5.
7. Conclusions
- Based on laboratory studies, the authors developed a new empirical model of the formation of paraffin deposits. The developed model is based on the results of laboratory studies, water cut in the product, temperature of the oil flow and the internal surface of the tubing. The model considers the phenomena of hot and cold flow, as well as oil WAT.
- As a result of the application of the developed methodology on several oil wells, it was obtained that the standard deviation of maximum wax thickness is 6.0%, and the depth with the greatest wax thickness is 3.5%, which is a fairly high result. The paper also provides examples of simulation results, where there is a significant deviation of the calculated thickness from the actual one. After analyzing these examples, the possible reasons for the deviation are described, which are the technological features of the well repair.
- The developed model makes it possible to simulate the spatial and temporal distribution of organ deposits along the length of the elevator column to assess dangerous areas and periods of well cleaning from the formed deposits.
- The use of this technique for predicting the formation of deposits in an oil well in industrial conditions has shown that it allows: optimizing existing methods of sediment control, choosing optimal methods, and preventing emergencies. These results are obtained due to the possibility of evaluating the optimal intervals for installing heating cables, mechanical cleaning of the well, and conditions for hot flushing.
Supplementary Materials
Author Contributions
Funding
Institutional Review Board Statement
Informed Consent Statement
Data Availability Statement
Conflicts of Interest
References
- Nurgalieva, K.S.; Saychenko, L.A.; Riazi, M. Improving the Efficiency of Oil and Gas Wells Complicated by the Formation of Asphalt–Resin–Paraffin Deposits. Energies 2021, 14, 6673. [Google Scholar] [CrossRef]
- Nguyen, V.T.; Pham, T.V.; Rogachev, M.K.; Korobov, G.Y.; Parfenov, D.V.; Zhurkevich, A.O.; Islamov, S.R. A comprehensive method for determining the dewaxing interval period in gas lift wells. J. Pet. Explor. Prod. Technol. 2023, 13, 1163–1179. [Google Scholar] [CrossRef]
- Lekomtsev, A.V. Development of an asphalt-resin-paraffin deposits inhibitor and substantiation of the technological parameters of its injection into the bottom-hole formation zone. Periódico Tchê Química 2020, 17, 769–781. [Google Scholar]
- Kayumov, M.S.; Tronov, V.P.; Guskova, I.A.; Lipaev, A.A. Taking into account the peculiarities of the formation of asphalt-resin-paraffin deposits at the late stage of oil field development. Oil Ind. 2006, 3, 48–49. [Google Scholar]
- Sandyga, M.S.; Struchkov, I.A.; Rogachev, M.K. Formation damage induced by wax deposition: Laboratory investigations and modeling. J. Pet. Explor. Prod. Technol. 2020, 10, 2541–2558. [Google Scholar] [CrossRef]
- Zhang, X.; Huang, Q.; Chen, W.; Zhang, Y.; Gao, X.; Liu, Y.; Wang, Y. Field Pigging Modeling for Predicting Wax Breaking Force and Wax Removal Efficiency of Disk Pig. SPE J. 2022, 27, 3864–3883. [Google Scholar] [CrossRef]
- Nebogina, N.A.; Prozorova, I.V.; Yudina, N.V. Features of formation and sedimentation of water-oil emulsions. Oil Refin. Petrochem. 2008, 1, 21–23. [Google Scholar]
- Struchkov, I.A.; Rogachev, M.K. Risk of wax precipitation in oil well. Nat. Resour. Res. 2017, 26, 67–73. [Google Scholar] [CrossRef]
- Sousa, A.L.; Matos, H.A.; Guerreiro, L.P. Preventing and removing wax deposition inside vertical wells: A review. J. Pet. Explor. Prod. Technol. 2019, 9, 2091–2107. [Google Scholar] [CrossRef]
- Revel-Muroz, P.A.; Bakhtizin, R.N.; Karimov, R.M.; Mastobaev, B.N. Joint use of thermal and chemical methods of exposure during transportation of high–viscosity and solidifying oils. Sci. Work. NIPI Neft. SOCAR 2017, 2, 49–55. [Google Scholar]
- Lei, Y.; Han, S.; Zhang, J. Effect of the dispersion degree of asphaltene on wax deposition in crude oil under static conditions. Fuel Process. Technol. 2016, 146, 20–28. [Google Scholar] [CrossRef]
- Bai, J.; Jin, X.; Wu, J.T. Multifunctional anti-wax coatings for paraffin control in oil pipelines. Pet. Sci. 2019, 16, 619–631. [Google Scholar] [CrossRef] [Green Version]
- Ilushin, P.; Vyatkin, K.; Kozlov, A. Development of an approach for determining the effectiveness of inhibition of paraffin deposition on the wax flow loop laboratory installation. Inventions 2021, 7, 3. [Google Scholar] [CrossRef]
- Kassenova, Z.; Kozhabekov, S.; Zhubanov, A.; Galymzhan, A.; Seilkhanov, T. Synthesis of comb-like copolymers based on alkyl fumarates and their application as pour-point depressants for akshabulak crude oil. Results Eng. 2023, 17, 100820. [Google Scholar] [CrossRef]
- Lekomtsev, A.; Kozlov, A.; Kang, W.; Dengaev, A. Designing of a washing composition model to conduct the hot flushing wells producing paraffin crude oil. J. Pet. Sci. Eng. 2022, 217, 110923. [Google Scholar] [CrossRef]
- Hoteit, H.; Banki, R.; Firoozabadi, A. Wax deposition and aging in flowlines from irreversible thermodynamics. Energy Fuels 2008, 22, 2693–2706. [Google Scholar] [CrossRef]
- Mahir, L.H.A.; Fávero, C.V.B.; Ketjuntiwa, T.; Fogler, H.S.; Larson, R.G. Mechanism of wax deposition on cold surfaces: Gelation and deposit aging. Energy Fuels 2018, 33, 3776–3786. [Google Scholar] [CrossRef]
- Merino-Garcia, D.; Margarone, M.; Correra, S. Kinetics of waxy gel formation from batch experiments. Energy Fuels 2007, 21, 1287–1295. [Google Scholar] [CrossRef]
- Petrochenkov, A.; Ilyushin, P.; Mishurinskikh, S.; Kozlov, A. Development of a Method for Improving the Energy Efficiency of Oil Production with an Electrical Submersible Pump. Inventions 2023, 8, 29. [Google Scholar] [CrossRef]
- Ilyushin, P.Y.; Vyatkin, K.A.; Kozlov, A.V. Development of intelligent algorithms for controlling peripheral technological equipment of the well cluster using a single control station. Bull. Tomsk. Polytech. Univ. Geo Assets Eng. 2022, 21, 1287–1295. [Google Scholar]
- Fan, K.; Li, S.; Li, W. Experimental study on the wax deposit properties in the radial direction in crude oil pipeline: Wax precipitation, carbon number distribution. Pet. Sci. Technol. 2022, 40, 2319–2335. [Google Scholar] [CrossRef]
- Hosseinipour, A.; Japper-Jaafar, A.; Yusup, S.; Ismail, L. Application of the Avrami theory for wax crystallisation of synthetic crude oil. Int. J. Eng. 2019, 32, 18–27. [Google Scholar]
- Singh, P.; Venkatesan, R.; Fogler, H.S.; Nagarajan, N. Formation and aging of incipient thin film wax-oil gels. AIChE J. 2000, 46, 1059–1074. [Google Scholar] [CrossRef] [Green Version]
- Veiga, H.M.B.; e Souza, L.B.; Fleming, F.P.; Ibanez, I.; Linhares, R.C.; Nieckele, A.O.; Azevedo, L.F.A. Experimental and numerical study of wax deposition in a laboratory-scale pipe section under well-controlled conditions. Energy Fuels 2020, 34, 12182–12203. [Google Scholar] [CrossRef]
- Fan, K.; Li, S.; Li, R. Development of wax molecular diffusivity correlation suitable for crude oil in wax deposition: Experiments with a cold-finger apparatus. J. Pet. Sci. Eng. 2021, 205, 108851. [Google Scholar] [CrossRef]
- Creek, J.; Lund, H.J.; Brill, J.P.; Volk, M. Wax deposition in single phase flow. Fluid Phase Equilibria 1999, 158, 801–811. [Google Scholar] [CrossRef]
- Bhat, N.V.; Mehrotra, A.K. Modeling of deposit formation from “waxy” mixtures via moving boundary formulation: Radial heat transfer under static and laminar flow conditions. Ind. Eng. Chem. Res. 2005, 44, 6948–6962. [Google Scholar] [CrossRef]
- Soedarmo, A.A.; Daraboina, N.; Sarica, C. Validation of wax deposition models with recent laboratory scale flow loop experimental data. J. Pet. Sci. Eng. 2017, 149, 351–366. [Google Scholar] [CrossRef]
- Yang, J.; Lu, Y.; Daraboina, N.; Sarica, C. Wax deposition mechanisms: Is the current description sufficient? Fuel 2020, 275, 117937. [Google Scholar] [CrossRef]
- Ehsani, S.; Mehrotra, A.K. Validating heat-transfer-based modeling approach for wax deposition from paraffinic mixtures: An analogy with ice deposition. Energy Fuels 2019, 33, 1859–1868. [Google Scholar] [CrossRef]
- Mehrotra, A.K.; Ehsani, S.; Haj-Shafiei, S.; Kasumu, A.S. A review of heat-transfer mechanism for solid deposition from “waxy” or paraffinic mixtures. Can. J. Chem. Eng. 2020, 98, 2463–2488. [Google Scholar] [CrossRef]
- Veiga, H.M.B.; Fleming, F.P.; Azevedo, L.F.A. Wax deposit thermal conductivity measurements under flowing conditions. Energy Fuels 2017, 31, 11532–11547. [Google Scholar] [CrossRef]
- Kasumu, A.S.; Mehrotra, A.K. Solids deposition from two-phase wax–solvent–water “waxy” mixtures under turbulent flow. Energy Fuels 2013, 27, 1914–1925. [Google Scholar] [CrossRef]
- van der Geest, C.; Melchuna, A.; Bizarre, L.; Bannwart, A.C.; Guersoni, V.C. Critical review on wax deposition in single-phase flow. Fuel 2021, 293, 120358. [Google Scholar] [CrossRef]
- Giacchetta, G.; Marchetti, B.; Leporini, M.; Terenzi, A.; Dall’acqua, D.; Capece, L.; Grifoni, R.C. Pipeline wax deposition modeling: A sensitivity study on two commercial software. Petroleum 2019, 5, 206–213. [Google Scholar] [CrossRef]
- Theyab, M.A. Wax deposition process: Mechanisms, affecting factors and mitigation methods. Open Access J. Sci. 2018, 2, 112–118. [Google Scholar] [CrossRef] [Green Version]
- Ilyushin, P.Y.; Vyatkin, K.A.; Kozlov, A.V. Development and verification of a software module for predicting the distribution of wax deposition in an oil well based on laboratory studies. Results Eng. 2022, 16, 100697. [Google Scholar] [CrossRef]
- Wang, W.; Huang, Q.; Wang, C.; Li, S.; Qu, W.; Zhao, J.; He, M. Effect of operating conditions on wax deposition in a laboratory flow loop characterized with DSC technique. J. Therm. Anal. Calorim. 2015, 119, 471–485. [Google Scholar] [CrossRef]
- Bidmus, H.O.; Mehrotra, A.K. Heat-transfer analogy for wax deposition from paraffinic mixtures. Ind. Eng. Chem. Res. 2004, 43, 791–803. [Google Scholar] [CrossRef]
- Merino-Garcia, D.; Correra, S. Cold flow: A review of a technology to avoid wax deposition. Pet. Sci. Technol. 2008, 26, 446–459. [Google Scholar] [CrossRef]
- Bidmus, H.O.; Mehrotra, A.K. Solids deposition during “cold flow” of wax− solvent mixtures in a flow-loop apparatus with heat transfer. Energy Fuels 2009, 23, 3184–3194. [Google Scholar] [CrossRef]
- Arumugam, S.; Kasumu, A.S.; Mehrotra, A.K. Modeling of solids deposition from “waxy” mixtures in “hot flow” and “cold flow” regimes in a pipeline operating under turbulent flow. Energy Fuels 2013, 27, 6477–6490. [Google Scholar] [CrossRef]
- Ehsani, S.; Haj-Shafiei, S.; Mehrotra, A.K. Experiments and modeling for investigating the effect of suspended wax crystals on deposition from’waxy’mixtures under cold flow conditions. Fuel 2019, 243, 610–621. [Google Scholar] [CrossRef]
- Aslanov, H.; Novruzov, A.; Harun, A. En pipelines by integrating wax modeling and pigging performance. SPE Prod. Oper. 2019, 34, 625–634. [Google Scholar]
- Ehsani, S.; Haj-Shafiei, S.; Mehrotra, A.K. Deposition from waxy mixtures in a flow-loop apparatus under turbulent conditions: Investigating the effect of suspended wax crystals in cold flow regime. Can. J. Chem. Eng. 2019, 97, 2740–2751. [Google Scholar] [CrossRef]
- Ilyushin, P.Y.; Vyatkin, K.A.; Kozlov, A.V. Investigation of rheological properties of oil during the formation of wax deposits. Results Eng. 2022, 14, 100434. [Google Scholar] [CrossRef]
- Ilyushin, P.Y.; Vyatkin, K.A.; Kozlov, A.V. Development of a Method for Estimating Thermal Conductivity of Organic Deposits on the Wax Flow Loop Laboratory Installation. Int. J. Eng. 2022, 35, 1178–1185. [Google Scholar]


| Parameter | Dimension | Value | ||
|---|---|---|---|---|
| «A» | «B» | |||
| Oil density | in reservoir * | kg/m3 | 819 | 860 |
| degassed ** | 859 | 815 | ||
| Oil dynamic viscosity | in reservoir * | mPa·s | 7.0 | 0.9 |
| degassed ** | 45.6 | 2.8 | ||
| Content in oil | Asphaltenes | % | 1.7 | 0.5 |
| Resins | 34.9 | 5.2 | ||
| Paraffins | 7.2 | 6.3 | ||
| Wax appearance temperature | °C | 26 | 21 | |
| Parameter | Dimension | Value | ||||||||||
|---|---|---|---|---|---|---|---|---|---|---|---|---|
| No. 1 | No. 2 | No. 3 | No. 4 | No. 5 | No. 6 | No. 7 | No. 8 | No. 9 | No. 10 | |||
| Well operation parameters | ||||||||||||
| Well flow rate | for oil | t/day | 5.1 | 8.1 | 4.1 | 20.5 | 14.9 | 6.8 | 4.1 | 7.2 | 6.8 | 14.9 |
| for liquid | m3/day | 14.3 | 23.4 | 6.3 | 56 | 34 | 9.8 | 7.1 | 11.9 | 10.3 | 19.5 | |
| Product water cut | % | 53.6 | 62.5 | 21.9 | 56 | 50 | 16 | 34.2 | 60 | 23 | 12 | |
| Pressure | Reservoir | MPa | 10.3 | 13.1 | 8.7 | 11.7 | 15.6 | 12.3 | 10.2 | 10.3 | 15.8 | 8.9 |
| Bottomhole | 8.2 | 5.6 | 6.4 | 9.2 | 9.54 | 1.39 | 9.06 | 8.2 | 8.4 | 4.43 | ||
| Buffer | 1.2 | 0.7 | 0.5 | 1.8 | 0.7 | 0.7 | 1.9 | 1.2 | 0.8 | 2.1 | ||
| Annulus | 1.2 | 0.7 | 0.72 | 1.8 | 0.7 | 0.7 | 1.9 | 1.20 | 0.6 | 2.1 | ||
| Gas factor | m3/t | 9 | 9 | 37.2 | 37.2 | 40 | 40 | 66.5 | 9.0 | 131.2 | 66.5 | |
| Oil saturation pressure with associated petroleum gas | MPa | 12.1 | 12.1 | 10.1 | 10.1 | 9.2 | 9.2 | 10.7 | 12.1 | 15.8 | 10.7 | |
| Reservoir temperature | 31 | 31 | 24 | 24 | 25 | 25 | 26 | 29.5 | 30 | 27 | ||
| Type of downhole pumping equipment | - | Rod pump | ESP | Rod pump | ESP | ESP | Rod pump | Rod pump | Rod pum | ESP | ESP | |
| Pump descent depth | m | 937 | 1438 | 1397 | 1357 | 1500 | 1350 | 1198 | 1480 | 1904 | 1500 | |
| Reservoir depth | 1710 | 1580 | 1436 | 1405 | 1538 | 1386 | 1567 | 1530 | 2547 | 1644 | ||
| Dynamic level | 850 | 905 | 731 | 663 | 632 | 1317 | 841 | 980 | 1648 | 1357 | ||
| Fluid properties | ||||||||||||
| Oil density | in reservoir * | kg/m3 | 914 | 914 | 834 | 834 | 870 | 870 | 813 | 841 | 745 | 814 |
| degassed ** | 919 | 920 | 884 | 900 | 917 | 899 | 860 | 873 | 821 | 857 | ||
| Oil dynamic viscosity | in reservoir * | mPa·s | 87.1 | 87.1 | 6.3 | 6.3 | 12.3 | 12.3 | 3.73 | 7.0 | 1.25 | 4.3 |
| degassed ** | 104.5 | 101.49 | 30.07 | 20.47 | 105.3 | 80.65 | 30.3 | 18.5 | 4.04 | 10.66 | ||
| Content in oil | Asphaltenes | % | 3.88 | 4.93 | 2.64 | 2.75 | 7.36 | 4.98 | 2.80 | 1.6 | 1.35 | 2.2 |
| Resins | 31.77 | 30.6 | 24.62 | 30.73 | 28.29 | 26.46 | 13.52 | 17.6 | 10.88 | 21.64 | ||
| Paraffins | 2.31 | 3.17 | 2.4 | 2.9 | 2 | 1.66 | 6.84 | 2.1 | 3.23 | 3.31 | ||
| Wax appearance temperature | 20 | 20 | 35 | 35 | 34 | 34 | 20 | 16 | 25 | 20 | ||
| No. | Maximum Wax Thickness, mm | Depth with Maximum Wax Thickness, m | ||||
|---|---|---|---|---|---|---|
| Actual | Calculated | Deviation, % | Actual | Calculated | Deviation, % | |
| 1 | 3.5 | 4.5 | 28.6 * | 200 | 20 | −90.0 * |
| 2 | 7.5 | 8.27 | 10.3 | 170 | 20 | −88.2 * |
| 3 | 9 | 10.16 | 12.9 | 260 | 265 | 1.9 |
| 4 | 30 | 24.7 | −17.7 | 260 | 265 | 1.9 |
| 5 | 8.6 | 10.7 | 24.4 * | 109 | 0 | - * |
| 6 | 7 | 9.5 | 35.7 * | 90 | 100 | 11.1 |
| 7 | 12.6 | 13.26 | 5.2 | 160 | 0 | - * |
| 8 | 4 | 3.98 | −0.5 | 260 | 282 | 8.5 |
| 9 | 1.68 | 1.96 | 16.7 | 770 | 792 | 2.9 |
| 10 | 6.8 | 7.1 | 4.4 | 150 | 160 | 6.6 |
| Standard Deviation | - | - | 6.03 | - | - | 3.5 |
Disclaimer/Publisher’s Note: The statements, opinions and data contained in all publications are solely those of the individual author(s) and contributor(s) and not of MDPI and/or the editor(s). MDPI and/or the editor(s) disclaim responsibility for any injury to people or property resulting from any ideas, methods, instructions or products referred to in the content. |
© 2023 by the authors. Licensee MDPI, Basel, Switzerland. This article is an open access article distributed under the terms and conditions of the Creative Commons Attribution (CC BY) license (https://creativecommons.org/licenses/by/4.0/).
Share and Cite
Ilushin, P.; Vyatkin, K.; Kozlov, A. Development of a New Model for the Formation of Wax Deposits through the Passage of Crude Oil within the Well. Sustainability 2023, 15, 9616. https://doi.org/10.3390/su15129616
Ilushin P, Vyatkin K, Kozlov A. Development of a New Model for the Formation of Wax Deposits through the Passage of Crude Oil within the Well. Sustainability. 2023; 15(12):9616. https://doi.org/10.3390/su15129616
Chicago/Turabian StyleIlushin, Pavel, Kirill Vyatkin, and Anton Kozlov. 2023. "Development of a New Model for the Formation of Wax Deposits through the Passage of Crude Oil within the Well" Sustainability 15, no. 12: 9616. https://doi.org/10.3390/su15129616