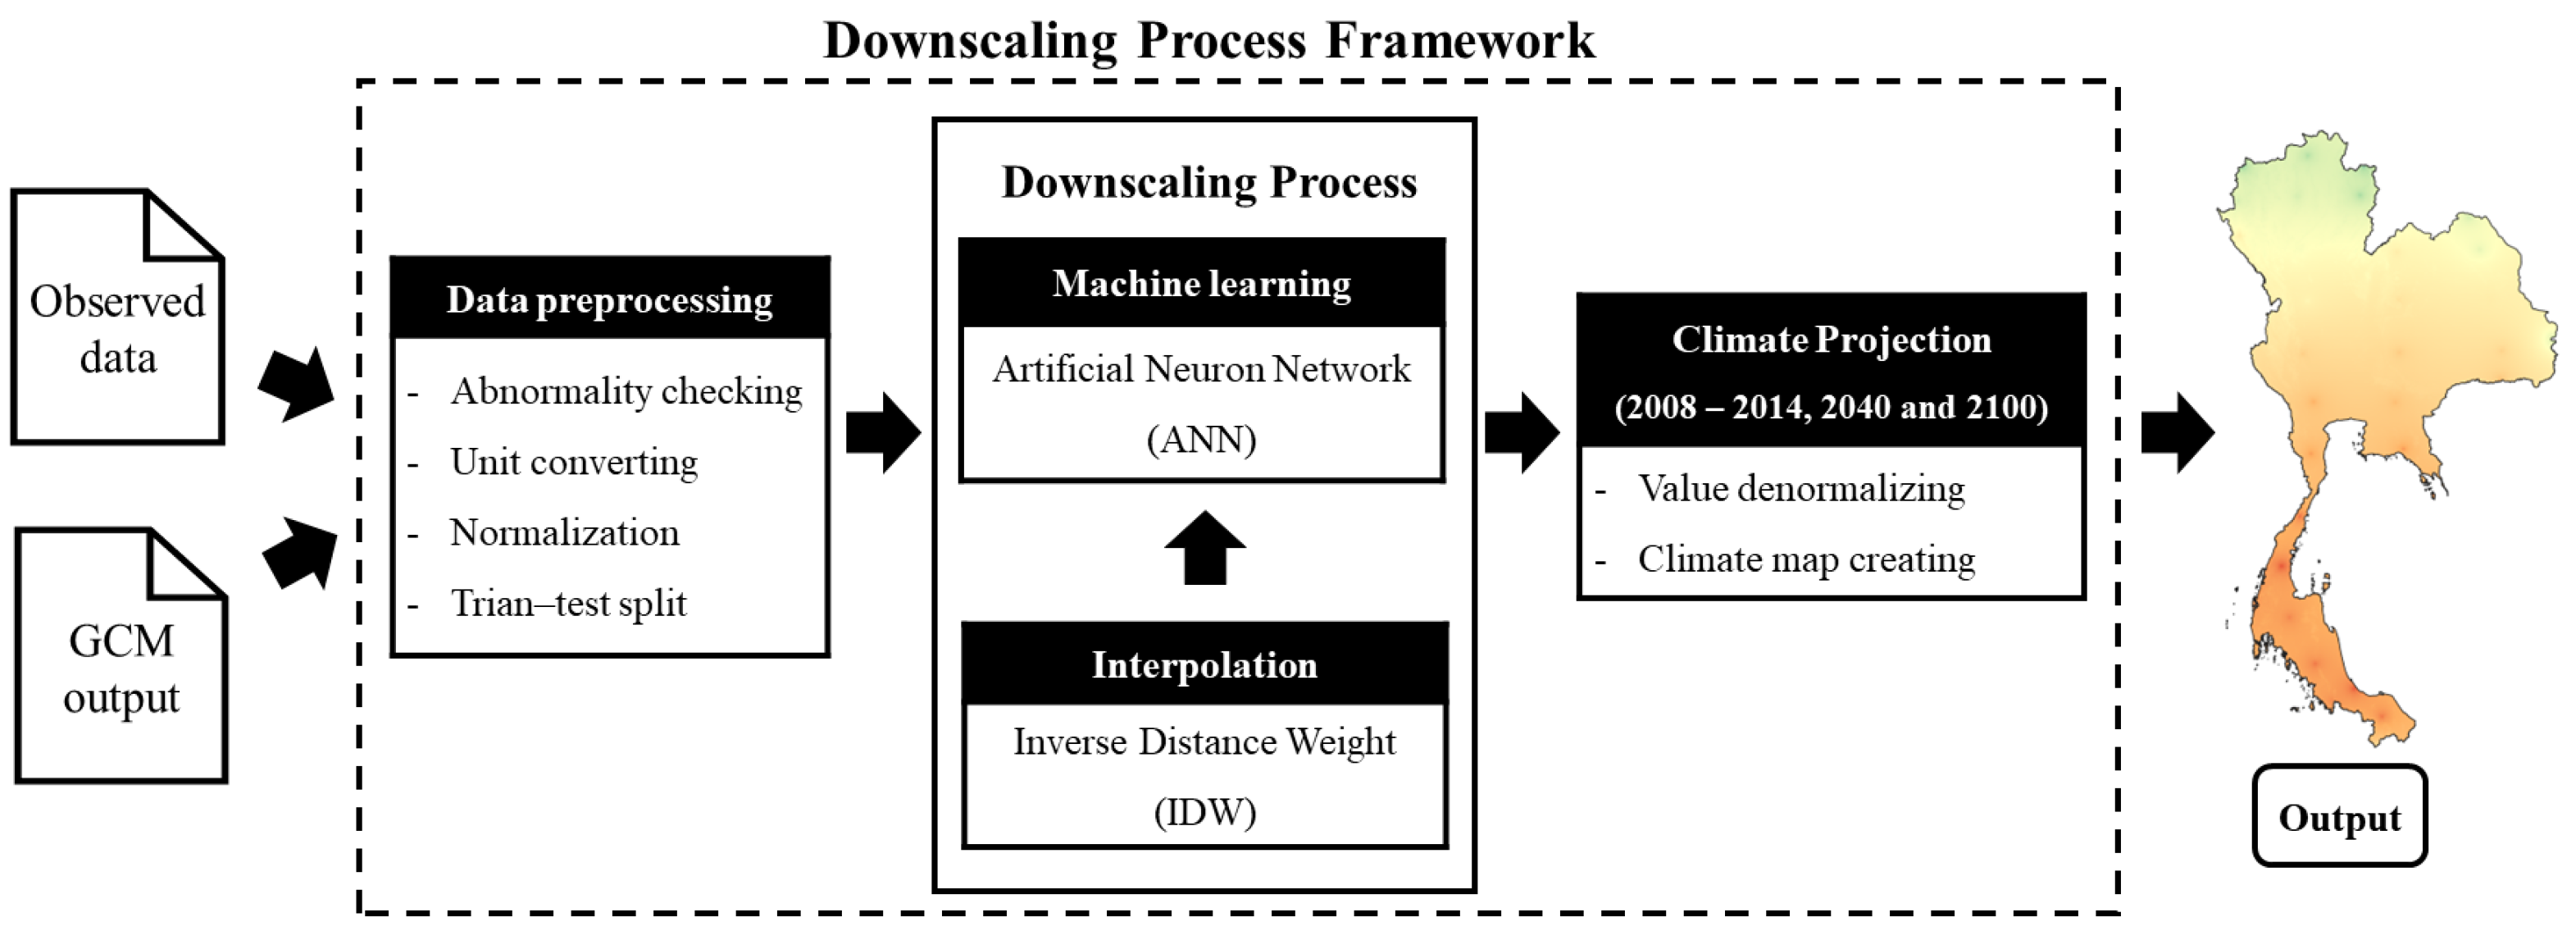
5.1. Performance of the IDW-ANN Framework
To evaluate the performance of the proposed framework, two metrics were involved. For validity, the annual downscaled result was compared with the 30-year normal value, as shown in
Table 6. The slight difference appeared in the average temperature. IDW-ANN provided a result lower than the normal value of 0.2 °C. In contrast, the given result in precipitation sum was higher than the statistic of 130.98 mm.
For accuracy, the scores of all metrics for the IDW-ANN did not exceed 0.1 in all data sets and variables. Please note that for RMSE and MAE, the lower score means the better. According to
Table 7, the scores of validation were higher than the others, but still in the same range as the training and test set. For R
2, as described previously, it is a reflection of how much the model could explain the variance of the target value, in this case, climate value. In addition, the greater score of R
2 was better. From the evaluation, the R
2 scores of IDW-ANN downscaled results, both temperature and precipitation, were around 0.7–0.75. Therefore, it could be concluded that IDW-ANN quite does well in calibrating the prediction from the GCM, both for temperature and precipitation.
Considering the evaluation, it could be said that IDW-ANN is able to downscale GCM output in the historical period to be close to the actual values from the observed data, even though the downscaled result showed a higher value than the normal value of the mean annual precipitation sum. In addition, RMSE, MAE, and R2 of all data sets are not distinctly different. Therefore, the models seem not to be overfitted to the training set. With all the results, it could be concluded that IDW-ANN has the ability to downscale the output of the GCM with low error under the limitation of data quantity.
In Thailand, there have been a few previous studies about downscaling GCM output, mostly for precipitation [
47,
48]. These studies were performed on different scales, number of stations, and data sets. Nevertheless, when compared with the studies methods, the proposed IDW-ANN is less complex by using a smaller number of input variables for calibrating the GCM output. In addition, the downscaling process in this research did not involve a reanalysis of data.
By using the IDW-ANN, the framework is quite flexible for downscaling the output into high spatial resolution. It is able to be applied for downscaling data for another desired resolution under the limitation of historical observed data. However, in order to apply the framework to downscale another climate model or to downscale another area, the parameter setting of the methods may require a new set.
Moreover, as presented in all the figures of climate projection, dark and light spots appear. This is caused by the interpolation method. As described, IDW is the spatial interpolation that uses the distance between points for estimating the newly generated value. Hence, the newly generated points which close to the existing ones usually have a higher similarity than the furthers as shown in the presented figures. Even if it does not affect the accuracy and validity of the results, it should be smoother.
5.2. Comparison of Climate Situation: History (2008–2014) and Future (2040 and 2100)
According to the GCM output downscaling by using the IDW-ANN downscaling process, there are visible differences between the results in historical (2008–2014), a baseline in this study, and the two future scenarios (SSP1-2.6 and SSP3-7.0) in 2040 and 2100. The details of the change in both climate variables of all scenarios are described as follows.
With the downscaling result in the historical data, the annual precipitation sums from 2008–2014 show the average overall area at 1718.48 mm. The lowest level of precipitation was 1393.86 mm, while the maximum was 2181.78 mm. According to
Figure 8a, the level of precipitation in the lower half part of Thailand was higher than in the upper. The sum of precipitation was mostly higher than 1512.50 mm annually, with only small amounts of the area at the top, which is less than the value. In the same way, the annual average temperature of the same period shows a similar pattern. The average temperature in the upper part of Thailand was less than 26.5 °C, cooler than the remaining parts and the highest level occurs in the south (higher than 27.0 °C ), as shown in
Figure 11a. This could be because the precipitation and temperature level of Thailand are both typically high in the southern part, but low in the northern. However, in 2040 and 2100, the pattern of the climate variables shows a distinct difference. By using ANOVA, both the annual precipitation sums and the average temperature of the two future scenarios are significantly different from the historical data with 95 percent of confidence level.
Starting with SSP1-2.6, an ideal scenario with low radiative forcing, an average of overall annual precipitation sums in 2040 has an opportunity to be higher than the historical. In
Figure 10a, a huge difference between the scenario and historical mostly occurs in the upper area. For the upper, the precipitation has increased, especially in the northern region. In contrast, in the south, a decrease occurs instead. While in 2100, the average precipitation in the country level is also likely to be increased from the historical but decreased from 2040 in the same scenario. Even though the pattern of the precipitation in 2100 is similar to the historical data, as shown in
Figure 8c, the difference map in
Figure 9a shows that most of the area may face a situation of the decreasing the precipitation levels in the next 80 years.
For the temperature, in 2040, most areas show a similar level in pattern with the historical data, which is in the range of 26.5 to 28.0 °C. According to
Figure 12a, the temperature level in the upper part may be higher than the historical data up to 0.36 °C but seems to be decreased in the half lower part. Moreover, from the absolute value of the difference, the high level of change in temperature mostly occurred in the upper of the country (+/−0.17–+/−0.52). With the same scenario in 2100, the high level of temperature is expanded from the south to the north. To be simplified, most of the area has a chance to be hotter than the historical data. Compared with 2040, the amount of area with less than 26.5 °C seems to be slightly decreased. According to
Figure 11c, the temperature in the upper of Thailand may increase from around 0.19 to 0.36 °C, which is higher than the other area. In the same way, the difference value between the historical and 2100 in temperature at the same area is also highest in the scenario as shown in
Figure 12b.
With the worst scenario, the SSP3–7.0, the average of the annual precipitation sums is also higher than the historical for both 2040 and 2100, at 28 and 115 mm, respectively. In 2040, some parts in the central show a decrease in the precipitation level. At the same time, the area which may have precipitation of more than 1850.00 mm is more apparent in the south. For 2100,
Figure 8e shows a distinct difference in the precipitation level from all scenarios and all periods. The prediction indicates that the precipitation level may become higher in most areas of Thailand, especially in the upper part. Compared with the historical data, a small change mostly appears in the south with less than 105.75 mm of the absolute different value as shown in
Figure 10d. While in the central area, there is a chance that the precipitation may increase up to 176.25 mm or more for the northern part.
In accordance with
Figure 11d, the temperature level of most areas in 2040 may become higher than 26.5 °C. The top part of Thailand may face a huge change in the range of 0.25–0.70 of the absolute value of the difference, which is shown in
Figure 13c. In contrast, the change seems to be smaller in the lower part. However, the pattern of the temperature level in 2100 is obviously distinct from all scenarios and periods. The prediction in
Figure 11e shows that the temperature of all areas will be increased from the historical. Even the temperature in the top is cooler than the others, but still higher than the historical around 1 °C. From
Figure 12d, it could be said that the high level of temperature is expanded and shifted from the lower to the upper. Moreover,
Figure 13d displays that the temperature level of all areas in 2100 under the SSP3-7.0 scenario probably changes at a huge level, especially in the upper part.
By comparing two future scenarios, the changes in both climate variables in 2040 under the scenarios and 2100 under SSP1-2.6 are similar. For the annual precipitation level, the northern area shows a decrease in value. In addition, the pattern of the precipitation level distribution seems to have shifted downward, while the temperature shows an inverse pattern. From the result in
Figure 11, the temperature level distribution pattern probably shifts from southern to northern. To be specific, the three situations predict that the temperature in the upper part of Thailand will be higher than the historical data. Nevertheless, the prediction of precipitation and temperature in 2100 under SSP3-7.0 is in a distinctly different pattern. An enormous increase in both variables in all areas of Thailand is predicted to occur. It could be said that the situation in 2100 under SSP3-7.0 is representative of the worst case scenario.
According to the prediction from the GCM under two future scenarios, the northern area of the country should be given high attention, also prompt planning for the adaptation, and response is essential. As presented in the results, the northern part of Thailand has an opportunity to face the change in the level of climate variables more severe than the other area in the same period and scenario. The precipitation in the north is predicted to be increasing in all scenarios, especially in 2040 under SSP1-2.6 and 2100 under SSP3-7.0. In the same way, the temperature level will also probably become higher.
Considering the present world situation, it is quite similar to the stimulated socio-economic scenario of SSP3, e.g., the occurrence of regional conflicts. Therefore, it could be said there is a probability that the situation in SPP3-7.0 will occur in the next 20 years, 2040. With the projections, the annual precipitation level tends to increase, in line with the average temperature. The change in climate level has a probability to impact on ecosystems of the country. In fact, the terrestrial biome is mainly classified by temperature and precipitation [
34]. Therefore, the change of these variables may affect the position of biome and may threaten natural resource and food security [
49,
50,
51]. Therefore, in order to be prepared for the change of climate, a climate change response of Thailand based on the worst scenario is suggested to be planned. To reduce the severity of the impact which probably occurred from the change, a comprehensive and practical adaptation plan which covers all important sectors of human beings and natural management is necessary and should be published by the government and related organizations. In addition, an explicit climate action should be included in the development plan of the country. Moreover, greenhouse gas emissions reduction is also important and should be performed along with the preparation for the future.


