1. Introduction
Port-cities are vital to modern society and create considerable economic benefits for people on local, national and international scales [
1]. Despite the considerable benefits they provide, port-city residents have seen a reduction in tangible local benefits provided by ports [
2,
3], whilst facing negative impacts created by ports and their associated activity. Ports produce a range of negative impacts such as air, water, soil, waste, noise, light and biological pollution, as well as visual intrusions and community severance. Pollution is a considerable negative impact of ports that can be created by shipping within the port, the use of port land and the impact of transport to and from ports [
4]. Some of these negative environmental externalities may create a global impact, such as emissions of greenhouse gases, whilst other impacts have a strong localised effect, such as SOx, NOx and particulate matter (PM) air pollution, as well as noise and light pollution. These impacts create a range of environmental issues, as well as social consequences such as negative impacts on human health and well-being [
5]. In addition, pollution from ports has been shown to produce large economic costs for the cities they occur in [
6]. It is therefore of great importance that ports reduce pollution if sustainable development in ports is to be achieved and ports’ environmental impacts reduced.
The United Nations sustainable development goals highlight key areas which must be addressed if sustainable development is to be achieved [
7]. These are:
No poverty.
Zero hunger.
Good health and well-being.
Quality education.
Gender equality.
Clean water and sanitation.
Affordable and clean energy.
Decent work and economic growth.
Industry, innovation and infrastructure.
Reduced inequalities.
Sustainable cities and communities.
Responsible consumption and production.
Climate action.
Life below water.
Life on land.
Peace, justice and strong institutions.
Partnership for the goals.
Amongst these, goals 3, 6, 7, 8, 9, 10, 11, 12, 13, 14 and 15 are highly applicable to the port-city context, with port-cities also playing roles in addressing the other goals. Addressing pollution in port-cities is vital to addressing goals 3, 11, 13, 14 and 15, as well as impacting other goals such as 12 by encouraging new approaches such as the circular economy, ultimately reducing the production of waste.
This paper aims to provide a comprehensive overview of pollution issues in port-cities and associated mitigation measures, and then present findings from a global survey which highlights areas of consensus between port and city authorities which could be prioritised to enable sustainable development in port-cities. This will provide a global perspective on the issue, which is important to capture views from countries at varying stages of development, which may influence their views and approaches towards pollution issues. Different countries and geographical areas may face different challenges; it is therefore important that all voices are heard.
1.1. Pollution Issues in Port-Cities
Air pollution from ports has been highlighted as a source of increasing concern [
8]. Within a port city, the emissions created by the port can form a large percentage of the total city emissions. A good example of this is Hong Kong, where port activities were estimated to contribute 54% of SO
2 and 33% of NOx in terms of emissions (by weight) annually within the city [
5]. Air pollution can create a range of negative health impacts, ranging from short-term effects such as coughing, shortness of breath and increased rates of hospitalisation, to long term issues such as respiratory, cardiovascular and mental disorders [
9]. Outdoor air pollution has been estimated to cause 4.2 million deaths per year [
10]. Reducing levels of air pollution could create significant health-related benefits and financial savings for healthcare and welfare systems. This makes air pollution a highly important issue in port cities, which is reflected in the European Sea Port Association (2022) ranking air quality as the number two environmental priority of European ports, with climate change as number one [
11].
Ports also create water pollution via the ships themselves, such as accidental oil spills and leaks, bilge and slop discharges, dirty ballast water, grey- and black-water discharges and anti-fouling paint, whilst also containing many activities with the potential to create water pollution, such as ship repair, cargo handling, storage and dredging, storm water and car park runoff, water stagnation and eutrophication and anoxia risks due to weak water turnover, dry dock operations, dredging and water thermal pollution. In addition to this, ports may also be areas with high levels of industrial activity which can lead to further water pollution, such as from scrap metal yards [
12], which large ports are likely to contain. Water quality was ranked as number 5 in ESPO’s top 10 environmental priorities for 2022 [
11]. The OECD [
5] reported that 70% of global oil spills were caused by normal shipping operations, rather than large accidents or illegal dumping, with Miola et al. [
4] showing that 80% of oil spills took place within harbour waters. This suggests that port-cities could be potential hotspots of water pollution.
Ports produce large quantities of waste, which varies depending on the type of vessels the ports serve. Examples include wastewater, plastic pollution, oily and toxic sludges, waste from retrofit and maintenance of vessels, damaged fishing gear and end of life equipment. Cruise ships in particular produce large amounts of food- and cabin-related waste, contributing 25% of waste from ships despite only making up <1% of the global shipping fleet [
5]. Ship waste and garbage/port waste are 7th and 8th in ESPO’s top 10 environmental priorities [
11], highlighting the importance of these issues. The large quantities of waste produced by ships and ports has the potential to provide new opportunities via the circular economy if facilities and rigorous plans are put in place to enable this. In particular, there is likely to be a substantial increase in residual sludge landed at ports from exhaust gas cleaning equipment (scrubbers) fitted to large ships, much of which will be potentially toxic. Even when scrubber discharges comply with IMO regulations, they can still be harmful to the environment [
13].
Light pollution can create issues for local residents, as well as disruption to wildlife, especially nocturnal animals. Light pollution can be created in ports through night-time activity such as loading/unloading, security lights and from the ships themselves. An example of the negative impact is provided by Dominoni [
14], who reports that light pollution can lead to deaths in bird populations. Light pollution can lead to health impacts on human populations due to its impact on sleeping patterns [
15]. Residents of port-cities, particularly within areas close to the port, may suffer the adverse effects of light pollution.
Ports and related traffic produce a large amount of noise pollution from road and rail vehicle movements, goods movement (from machinery such as quay-cranes, pumps, etc.), from the ships themselves such as main and auxiliary engines, heating and ventilation units, construction, industrial activity within the port, etc. Noise transmission can be airborne, through water or via the structures themselves. This can produce a range of consequences for affected residents, such as difficulty sleeping and stress [
5]. Munzel et al. [
16] have found that noise pollution may lead to an increased risk of cardio-vascular disease, and there are impacts on aquatic organisms due to underwater noise [
17]. This highlights the importance of reducing port-related noise in future ports.
Ports may create soil pollution through industrial activity and the transport of hazardous cargo, as well polluting soils as a side effect of air, water and waste pollution. Al-Jabri et al. [
18] and Rastmanesh et al. [
19] found elevated levels of pollutants such as heavy metals in close proximity to port areas. This soil pollution can lead to detrimental impacts on human health, as well as harming the environment. The presence of the port can damage soils in other ways. Having large areas of covered surfaces can increase run-off and accelerate soil erosion. Ports can interfere with sediment transport and modify the coastline by changing rates of coastal erosion.
Ports can have a detrimental impact on biodiversity, via introduced invasive species such as the sea lamprey [
20]. Invasive species can impact the functioning of native ecosystems, leading to biodiversity loss, degrading ecosystem services and creating socio-economic consequences [
21]. The use of ballast water, and the discharge of this water, enables the global spread of aquatic invasive species [
22]. Noise, light and thermal pollution can also have negative impacts on biodiversity [
23]. By modifying the shoreline, reclaiming land and affecting the supply and distribution of sediment, ports can significantly change the environment in the surrounding area. Ports of the future will have to reduce their negative impact on local biodiversity and ensure effective bio-security regimes.
As urban areas expand, there has been an increase in so-called visual pollution [
24]. Ports can create considerable visual intrusion, with infrastructure that often dominates the surrounding landscape. Ports may contain industrial facilities, piles of waste/scrap metals, large cranes and stacks of containers and security fencing, amongst others, which reduces the quality of visual amenity in the area. A loss of visual amenity may contribute to poor mental health and wellbeing [
25]. This means the visual impact of the port should also be considered as an important aspect in sustainable port development.
Pollution created by port activity can come directly from the ships, from the port and its associated industries or from associated traffic. The close proximity of port and city and the mixing of port and city traffic can lead to elevated levels of road traffic congestion, particularly from passenger cars/buses and heavy goods vehicles. This produces a local negative impact in the form of longer travel times, decreased efficiency and additional pollution due to the longer journeys [
26]. Shinar [
27] found that increased traffic congestion leads to an increase in road accidents and driver aggression. Globally, the majority of inland freight transportation is by lorries, which increases road usage in and around port-cities. The presence of high numbers of lorries on the road has been shown by Giuliano and O’Brien [
28] to lead to a disproportionate amount of traffic congestion and road traffic accidents. Traffic congestion produces a range of negative impacts for an urban area. Increased journey times lead to more fuel being used, which produces more air pollution [
26]. The increased idling, accelerating and braking reduces the lifespan of vehicles [
5]. Increased journey times lead to economic losses, disruption to emergency services and higher levels of stress among motorists, leading to elevated levels of road rage [
27]. The costs of traffic congestion to the UK economy, for example, was estimated as £37.7 billion per year, with a cost of £1168 per motorist [
29]. Reducing traffic congestion in port-cities would create social, environmental and economic benefits, making port-cities much better places to live and work.
1.2. Remedies for Pollution
Various solutions have been proposed to reduce some of these negative environmental impacts. However, the many different aims and objectives of ports and cities may lead to areas of tension and a lack of cooperation. In many cases, this means certain solutions are not viable, as ports and cities may not cooperate. This may be especially difficult for expensive solutions such as shore-to-ship power (so-called “cold ironing”), which the port may be encouraged to adopt and finance despite many of the benefits accruing outside the area the port authority controls. In order for future port-city development to be sustainable, a greater understanding of the port’s views on pollution, levels of interest in specific solutions and barriers to these solutions is needed. This can then be better aligned with the interests of cities, enabling greater levels of cooperation towards sustainable port-cities. Numerous measures are available to help manage and reduce negative environmental impacts created by port activity. A range of these are presented in
Table 1.
1.2.1. Air Pollution
Air pollution is among the largest negative impacts produced by ports and port-related activity. For this reason, it is an important potential source of tension between port and city authorities. ESPO [
11] identified climate change and air quality as the number one and two environmental concerns for ports in Europe. Methods for reducing air pollution from the port include shore-to-ship power, vessel speed reduction (slow steaming), alternative fuels such as LNG and hydrogen, renewable energy, clean ships, reducing traffic congestion and electric port vehicles and equipment.
Despite proving effective at reducing air pollution [
30,
31] these methods are not widespread, and the majority of world ports do not implement them. Shore-to-ship power, also known as alternative marine power, shore power or cold ironing, is the practice of providing an electricity supply to ships in port. This enables ships to turn off their main and auxiliary engines, reducing the use of the ship’s fuel oil. Shore power has already been implemented in a number of world ports, such as Long Beach and Gothenburg [
26], and it has been shown to lead to large reductions in air pollution. Hall [
32] found reductions of CO
2 (25%), SO
2 (46%), CO (75%) and NOx (92%) if shore power were to be implemented in the UK. Zis et al. [
33] found a reduction of 57–60% of particulate matter. Despite evidence that shore power is effective at reducing air pollution, many barriers remain to its implementation [
34]. Winnes et al. [
35] found that up to 50% of air emissions from ships are attributable to ships that visit the port less than ten times per year. This reduces the attractiveness of measures such as shore-to-ship power, which requires high investment costs and requires ships to be compatible. Another barrier is the electricity demand. If all European ports utilised shore power by the year 2020, Winkel et al. [
35] found that this increase in electrical demand would account for 0.1% of European electricity demand. This additional demand creates a barrier and requires further investment, especially in regard to transmission and distribution of electricity. Potentially the largest barrier to the implementation of shore power is the high investment costs required [
36]. Zis et al. [
33] found shore power to cost up to 1 million USD to retrofit existing ships and half a million EUR per connection installed. The high costs create significant barriers because investors do not necessarily directly benefit from the installation of shore power, due to the environmental and social benefits being difficult to quantify. These benefits may be more desirable to city authorities, rather than port authorities. In many countries at present, ship fuel is not taxed, which creates a further obstacle as the electricity supply generated by shore power would incur a tax in many cases [
5]. Khersonsky et al. [
37] show that the most significant barrier to shore power in Europe is not technological, but financial. It may be possible for financing to become more manageable if ports and cities can work together, as the city would benefit greatly from its installation. Due to the profitability issues, alternative techniques are being considered, such as vessel speed reduction zones and LNG generators.
Vessel speed reduction has been suggested as an effective way to reduce CO
2 emissions from global shipping [
26]. This is especially true for container ships, which, despite making up only 4% of the global shipping fleet, contribute 22% of CO
2 emissions [
38]. Speed reductions of 10%, 20% and 30% reduced CO
2 emissions by 19%, 36% and 51%, respectively [
39], showing that vessel speed reduction could be an effective way of reducing CO
2 emissions from shipping. For port-cities, vessel speed reduction can have a positive effect on air quality, due to reducing the amount of fuel being used. Reducing vessel speed to 12 knots within 20 nautical miles of the port has been suggested by Long Beach as part of its green flag incentive program [
26]. Implementation of this policy has been shown to reduce SO
2 by up to 48% by [
40] when utilised in Kaohsiung, Taiwan. Application in a Nordic port has also been shown to reduce NO2 by 15%, PM10 by 10% and SO
2 by up to 90% when used in conjunction with low sulphur fuel as required in Nordic ports [
41].
Despite proving to be an effective method for air quality improvement, considerable barriers remain for the implementation of vessel speed reduction zones as suggested by the green flag incentive program. To implement such a policy globally was shown to cost between
$30 and
$200 per ton of CO
2 for all shipping in 2009 [
38], so is likely even higher now, and may require a greater number of ships to be used to keep up with demand. To implement such a policy in port-cities would have an impact on services that are dependent on providing services as quickly as possible, such as ferry services. Again, these are barriers that may be possible to overcome with greater cooperation between all the stakeholders in port-cities.
Given the considerable barriers to implementing shore-to-ship power, many ports have instead chosen to use liquefied natural gas (LNG) as fuel for ships and port equipment. LNG fuel produces lower CO
2 emissions, as well as reductions in NOx, SOx and PM [
42]. The use of LNG makes other practices, such as exhaust gas heat recovery, simpler due to creating fewer pollutants [
42]. This may enable a reduction in fuel consumption if technological improvements are made to ships. LNG fuel is encouraged by environmental regulations introduced by the IMO [
43]. Wang and Notteboom [
44] stated that ports should attempt to establish cooperation with key stakeholders involved in the port, city and governments. This cooperation can help improve the likelihood of the development of LNG infrastructure.
Another method for reducing air pollution from ports and related activity is the use of electrical port equipment such as cranes and tractors. Yu et al. [
45] identified CO
2 from yard tractors as a leading source of CO
2 from port activity. CO
2 emissions from most port-related activities have been reducing; however, emissions from cargo handling equipment have increased as a percentage of emissions). They found that CO
2 emissions from cargo handling equipment in the port increased to 27% of total port-related emissions in 2014. This shows that port equipment is a major source of port-related air pollution affecting cities. An example of implementation of electric equipment is the port of Busan, which has introduced electric cranes, replacing the existing diesel-powered cranes [
26]. This improvement in air quality may only be small in comparison to other methods, but the barriers to implementation are less when compared with methods such as shore power and vessel speed reduction zones.
Electric or modernised vehicles could be used to move goods once they arrive in port. At present, there is a dependence on petrol- or diesel- traction. Changing to electric lorries or trains has been implemented in a number of ports [
26] and could be an effective way of improving air quality in port cities, with greater use of trains reducing traffic congestion and further improving air quality by reducing fuel usage among non-port related traffic [
5]. Merely improving the existing port equipment can have a dramatic effect on air quality. A truck retirement program in San Pedro Bay [
46] reduced the mean age of trucks used in the port from 12.7 years to 2.5 years. This led to a 54% reduction in particulate matter, a 48% decrease in NOx and a 30% decrease in CO [
46] This was, however, also accompanied by ammonia emissions increasing by 20 times as a result of LNG-powered trucks, so this technique has its flaws.
International regulation, such as the MARPOL convention [
47], places limits on air pollution from ships, and these limits are set to become stricter in the future, with a sulphur limit of 0.5% by 2020 [
5]. The current level of 3.5%, introduced in 2012, has already encouraged the reduction of SOx emissions. The MARPOL regulations allow for the creation of emissions control areas (ECA), which can reduce air pollution within specified zones, such as the Baltic and the North Sea ECAs [
5]. These zones implement a stricter standard of 0.1% sulphur content. It has been estimated that the North American EPA will lead to 14,000 fewer deaths from air pollution by 2020 [
48].
Another option for reducing air pollution, alongside other benefits such as traffic reduction, is shifting some or all of the port activity to other areas. This could be through the usage of dry ports and extended gates, offshore ports and port relocation. This has been used in various ports around the world such as Shanghai, Marseille and Busan [
26]. This option is very expensive but can be used when there are other pressures, such as land availability. It is unlikely that such a policy would be introduced with air quality improvement as the dominant factor.
Overall, the various measures available for improving air quality have been proven to be effective and successful; however, considerable barriers remain. These barriers are mostly related to financing, since those who may be expected to invest in such techniques are not the ones who benefit the most from their implementation.
1.2.2. Traffic
Another negative impact created by ports which could be a substantial source of tension between ports and cities is traffic congestion. Port-cities often experience elevated levels of traffic congestion [
26] and this brings with it a range of negative impacts. These include an increase in air pollution, severance, rat-running, nuisance, road rage, longer travel times, a decrease in efficiency and productivity and even an increase in road traffic accidents [
5]. These negative impacts can be experienced by many who live in a port-city, leading to a reduction in their quality of life.
A range of solutions are available to reduce port-related traffic congestion, such as designated freight corridors, extended gates, dry ports, greater use of rail, gate appointment systems and emerging technologies such as autonomous vehicles, smart phone apps and vehicle tracking.
Designated freight corridors are designed to reduce or stop the mixing of port and city traffic, thereby removing the impact on city traffic. Successful implementation of designated freight corridors, such as the Alameda Corridor in Los Angeles, USA and a freight tunnel in Valparaiso, Chile, have demonstrated the uses of this method [
26]. A recent European example is the freight tunnel constructed in Dublin [
49]. It is, however, expensive, and requires land and cooperation between relevant stakeholders. This creates considerable barriers for the construction of designated freight corridors that, in many cases, make them not a viable option unless they utilise existing infrastructure. The impact of these corridors is also potentially detrimental if they are poorly implemented, such as the Dublin Port Tunnel, which, despite reducing traffic congestion, has resulted in vehicles travelling longer distances and therefore creating more air pollution [
50].
One way to bypass this problem is to make greater use of railways to transport cargo. Transporting goods via rail removes vehicles from the road network, reducing traffic congestion. This method can be implemented for cargo; however, it is more challenging to implement for passenger ports where passengers may choose to travel to the port by any means they desire. If existing railways do not exist, the construction of this infrastructure again requires considerable investment, land and cooperation between relevant stakeholders.
Extended gates and dry ports can be used to reduce traffic congestion, by moving some or all of the processing and distribution to the hinterland, away from the city centre. This has been successfully implemented in Shenzhen [
51]. This approach faces the same barriers to implementation, such as financing, land availability and cooperation between stakeholders. Traffic congestion is one area where it is clear that cooperation between port and city stakeholders is essential if any progress is to be made, especially in areas without the existing infrastructure that could be utilised, such as railways.
1.2.3. Biodiversity
Ports can be a source of biological pollution, such as invasive species. There are numerous policies available to reduce biosecurity risks and protect biodiversity. Ballast water is a potential source of invasive species; therefore, management and treatment of ballast water is an important method for reducing the biological impact of a port. International regulations, such as the BWM convention, introduced mandatory ballast water management [
52]. Ports may operate and be responsible for areas that have been designated as important for biodiversity, such as Ramsar sites.
Ports may choose to set aside land for natural areas. An example of this is the port of Brisbane, which introduced a policy that ensured 5% of the land allocated to new developments is set aside as a green area [
53]. Ports, due to their coastal location, may be subject to regulations and frameworks set up to manage the coastal zone. Combined coastal and river management can improve the protection afforded to coastal areas, reducing the negative impacts created by ports concerning biodiversity.
Ships colliding with marine animals such as whales can also be reduced by introducing vessel speed reduction. This has been shown by Leaper [
54] to lead to a reduction of potentially up to 50% in whale strikes when vessel speed is reduced by 10%. Fishing nets, discarded fishing gear and association plastic pollution can also have considerable negative impacts on marine organisms.
1.2.4. Noise
Noise pollution is a problem in port cities due to the close proximity of the port to residential areas, leading to a range of negative effect on human health, as well as producing negative impacts for other forms of life. Reduction measures focus on the source of noise, the transmission of noise and the reception of noise. Noise pollution is an issue that can best be tackled by ports and cities working together. Cities may be able to take action to reduce the reception and, to a certain extent, the transmission of noise, but ports must take action themselves to reduce the sources of noise pollution. Specific areas can be influenced by a port, such as the source and transmission, or limiting certain activities during the night. In contrast, the reception of noise is mostly influenced by the city and residential areas and can be addressed by measures such as building codes and building insulation [
55]. Tree planting or the use of vegetation can be used as a method for reducing noise pollution, as well as providing additional visual and environmental benefits.
1.2.5. Water
Various methods to reduce water pollution and improve water quality exist. Regulations have formed an important part of the response to water quality issues associated with the maritime industry, such as creating no-discharge zones [
56], regulating the quantity and frequency of discharges via permits [
57] and controlling the usage of harmful anti-fouling treatments [
58]. As the regulation limiting discharges has increased, another important consideration for controlling water pollution in port-cities is the provision of waste water reception facilities, the provision of which is a legal requirement in certain areas, such as the EU [
59]. Ships also produce sludge and sewage, which requires careful handling and facilities.
Technological improvements to ships have reduced the risk of large-scale oil spills, although considerable improvements can still be made. Ports that provide bunkering services can reduce oil spills by containing oil spill prevention equipment and encouraging oil spill prevention training [
5]. Reducing pollution from oil, ship ballast and sewage from ships is important, as well as managing the potential impact of newer technologies such as the discharge of water from open-loop scrubbers and the handling in port of wastewater from closed-loop scrubbers.
1.2.6. Light
A range of measures exist to reduce the presence of light pollution. Among these methods is decreasing the height of and increasing the spacing between light poles in ports, as suggested by Elsahragty and Kim [
60], and the use of LED lighting [
61]. New technologies may enable light pollution to be reduced, such as using plasma bulbs [
62]. Plasma bulbs and LED lighting have the benefit of using less energy, potentially decreasing associated carbon emissions and air pollution whilst saving money. Improved management of the way lighting is used can help to reduce light pollution. A good example is the LeafNut system [
63], which allows centralised control of all lighting and selective dimming of lighting in areas of low use. This ensures that lighting is used only when it is required.
1.2.7. Waste
Waste in ports can be managed by regulations, as well as improved management of waste and provision of waste reception facilities. Ports can provide facilities for the reception and management of waste created by ships, port operations and port-related industries. Ports have to adapt to a world of limited resources and increasing resource depletion [
64], as well as leading adoption of new approaches such as industry 4.0 [
65] and the circular economy [
3].
Port-related industries should also seek to reduce, re-use and recycle, embracing circular economy thinking, with Roberts et al. [
3] finding high levels of support for the circular economy among port authorities. This can help reduce the quantity of waste, as well as reducing the amount of waste that finds its way into the environment. Port authorities may be able to encourage improved waste management by encouraging environmental management systems (EMS) and corporate social responsibility amongst stakeholders in port activities.
1.2.8. Soil
Soil pollution and erosion can be reduced by reducing other forms of pollution, such as oil spills, littering and chemical leaks, as well as improving the management of the landscape and regenerating the soil. Regulation and monitoring can be used to ensure land contamination does not occur and that contaminated land is remediated.
1.3. Objectives
If port-cities are to better manage the negative impacts created by pollution, the barriers to implementing mitigation measures need to be overcome, and greater cooperation between stakeholders is needed. At present, there is a lack of global studies on this issue, with most studies investigating individual case study cities or regions, such as Europe [
10]. Considering the fact many of the world’s most polluting and densely populated port-cities are located in the developing world, it is important that viewpoints from a diverse range of countries are considered. This research aims to:
Identify the views of port and city authorities globally regarding the importance of pollution and the importance of addressing different types of pollution
Identify which solutions have high levels of support and what the obstacles to these solutions are.
Identify areas of potential cooperation between port and city authorities.
2. Materials and Methods
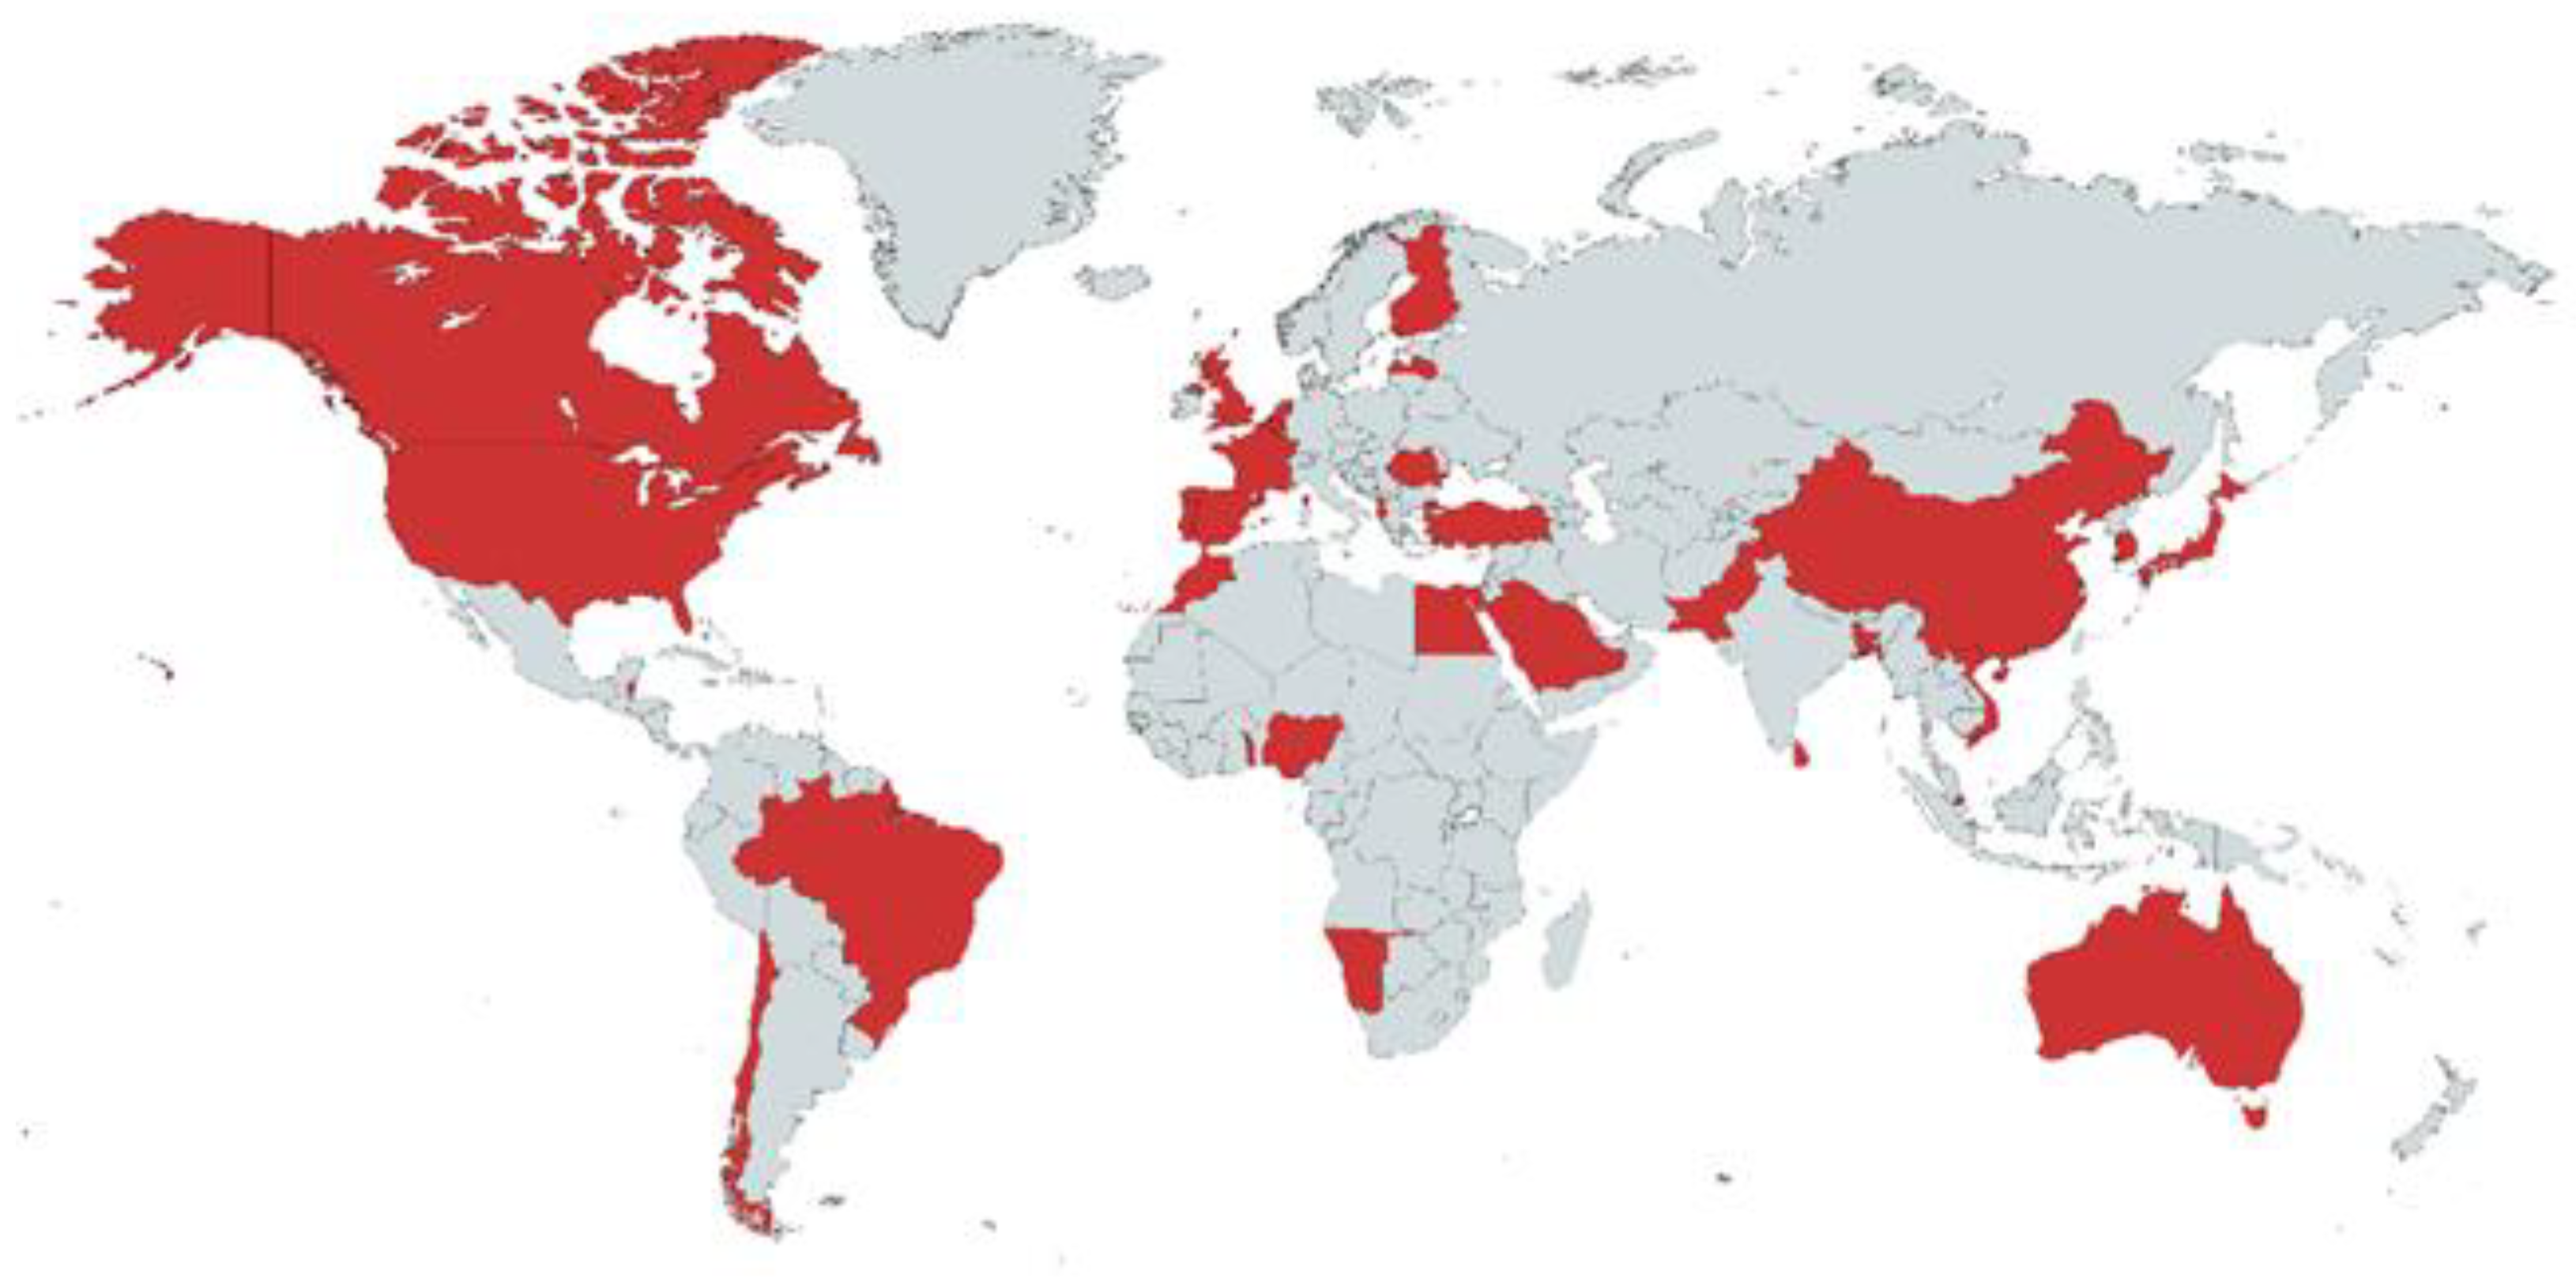
This research was conducted by distributing an online questionnaire to professionals employed by port authorities in 26 countries (Albania, Australia, Belgium, Belize, Brazil, Egypt, Canada, Chile, China, Finland, France, Japan, Latvia, Morocco, Namibia, Netherlands, Portugal, Romania, Saudi Arabia, Singapore, South Korea, Spain, Sri Lanka, Togo, UK and the USA). Response levels for questions varied, with a maximum of 51 participants. A separate online questionnaire was distributed to senior professionals working for city authorities in 13 countries (Australia, Bangladesh, Chile, China, France, Nigeria, Pakistan, South Korea, Sri Lanka, Turkey, UK, USA, Vietnam). The distribution of these respondents from both questionnaires is highlighted in
Figure 1.
Ports and cities were initially targeted using lists of the world’s largest ports according to cargo tonnage [
66], TEU [
67] and passenger numbers [
68,
69,
70]. Additional port-cities were included if relevant professionals with suitable expertise were found during the search process, regardless of their size. The final sample contains 16% of the world’s top 100 container ports [
67], 10% of the world’s top 100 largest cruise ports [
70] and a geographical distribution covering a large variety of countries at varying levels of development. Responses were higher for port authorities than cities, and collection of data from cities was particularly disrupted by the COVID-19 pandemic. Due to targeting port and city authority staff with high levels of seniority, the exact port-cities used have been anonymized in order to encourage more honest answers and make identification impossible.
Professionals with adequate expertise in port and city authorities were identified in numerous ways, such as using port authority websites and the professional networking website LinkedIn. In addition, the British Ports Association (BPA) distributed the port questionnaire to UK ports. Participants linked to a port or city authority’s LinkedIn page were approached if their role in the port was related to management, operations, planning, engineering or the environment. In some cases, the final participant was recruited via recommendations from the person who was contacted initially. The questionnaire contained political, economic, social, technological, legal and environmental (PESTLE) sections. The PESTLE framework was chosen as an appropriate tool for conducting a broad fact-finding exercise and has been helpful in analysing internal and external factors. The questionnaire was only available in English, which limits the sample only to respondents who were able to understand the questionnaire. This made it impossible to find respondents in certain countries. Respondents were free to leave a question blank if they did not understand or did not know the answer.
The study was conducted according to the guidelines of the Declaration of Helsinki and approved by the Ethics Committee of The University of Southampton (ID 55821)
4. Discussion
Ports are key sources of pollution, and
Table 2 and
Table 3 highlight the issues of air, water, noise and waste pollution from ports.
Table 2 especially shows that air, water and noise pollution from ports are a source of concern from wider society. Ports appear to view all forms of pollution as important, with the exception of light pollution (
Table 3), and the majority of ports have measures in place to address all forms of pollution, again with the exception of light pollution (
Table 5). Both air pollution and water pollution have a high percentage of respondents stating they are very important issues. However, only air pollution sees an increase between current measures in place and plans for future measures. Air pollution appears to be an issue ports are paying increasing attention to for the future. ESPO’s top 10 environmental priorities ranks climate change first, air quality second, noise fourth, ship waste seventh, water quality fifth and port waste eighth. This survey suggests that globally there is a different order of priorities, with water quality being the number one issue in terms of respondents ranking it as very important among ports (
Table 3). This may be due to European ports having introduced many mitigation measures already, which are largely absent globally.
Both port and city authorities highlight the importance of dealing with waste, water, noise and air pollution in
Table 3 and
Table 4, and these are the top four most important environmental issues for both ports and cities in terms of the percentage listing it as important or very important. Interestingly, ports were more likely to list waste as important rather than very important, suggesting it is not at the top of their priorities. There also seems to be a consensus between ports and cities that light pollution is not a serious concern. Waste, water and air pollution are all areas in which significant progress could be made if port and city authorities were to work together. Whilst this cooperation does take place in some cases, it is especially absent in ports that are privately owned, often resulting in separate areas of jurisdiction, separately drawn up masterplans and a lack of cooperation.
Soil pollution and invasive species are issues that ports rarely receive complaints about (
Table 2), with the majority never receiving a complaint. Despite this, they are both regarded as important or very important by 78% and 80% of ports in the study, respectively (
Table 3). However, city authorities appear to regard invasive species as a less serious issue, with 50% of the sample choosing very unimportant, unimportant or neither unimportant nor important. This suggests that port authorities are much more engaged with this issue than city authorities, which may be due to the fact ports may feel this is more their responsibility than cities do. Given the high levels of importance attached to these forms of pollution, and the low levels of complaints, it may be the case that ports are largely dealing with these issues in a way that is deemed sufficient, or that it is an issue that local residents do not experience and have lower levels of awareness of.
Light pollution is seen as a largely unimportant issue for both port and city authorities (
Table 3 and
Table 4), with low levels of interest in tackling light pollution among respondents. LEDs are the most widely adopted measure to combat it and remain so in the future (
Table 13). Given the low levels of interest in tackling light pollution, this adoption may be for other reasons, such as financial savings. Although light pollution is shown to be neither a significant source of complaints (
Table 2) nor a significant priority for ports or cities (
Table 3 and
Table 4), it does not mean that light pollution becomes a less serious issue, and there is still evidence of its harmful impact on the environment and human health. It may be the case that awareness of light pollution and its impacts is generally lower than awareness of other forms of pollution.
Table 18 shows that measures for combating light pollution face very low levels of barriers compared to the other forms of pollution, with only high costs providing an important or very important barrier for the majority of respondents. If lighting systems can be changed in an inexpensive way, or a way that allows future financial savings, such as LEDs, then the adoption of measures for combating light pollution may be relatively easy. One way for light pollution to be reduced whilst producing potential financial savings is for the port authorities to purchase light as a service. This also allows the lighting system to be maintained and serviced by the provider who retains responsibility [
71] and provides an opportunity for circular economy thinking. Ports should therefore be encouraged to implement changes in this area when possible, and greater awareness of the impacts of light pollution may encourage this. Due to the low level of importance ports and cities attach to this issue, it may require a third party to step in and raise aware of this issue if progress is to be made. Organisations such as universities or environmental consultancies may be suitable for this.
Waste is highlighted as a key issue, with 92% of ports and 97% of cities regarding it as important or very important to deal with (
Table 3) and with 90% of ports having measures in place and 74% intending to expand on existing measures (
Table 5). Around 74% of ports are interested in increasing re-use and recycling within the port (
Table 15), and 52% have facilities for re-use and recycling (
Table 14). However, 62% have no recycling plans in place (
Table 14). This suggests that, although ports are willing to make progress in this area, their approaches are not very coordinated or rigorous. This may be a procedural, rather than infrastructural, issue. Ports should therefore be encouraged to adopt procedures that make the most of existing facilities and increase re-use and recycling, such as an environmental management system (EMS). The review and evaluation inherent within an EMS should push ports to improve and reach higher levels of recycling and re-use. Ports should also encourage circular economy activities to change waste from being a pollution issue and into an economic opportunity. This could be achieved by introducing the port-city circular economy framework highlighted in Roberts et al. [
3]. Leadership and a lack of awareness of the opportunities offered by the circular economy have been identified as key barriers in the literature to the circular economy [
3]. This is another area which calls out for greater cooperation between stakeholders. The issue of waste may vary in ports that attract large volumes of cruise ships, which produce vast amounts of waste [
5]. In these ports, there may be fewer opportunities for circular economy thinking; however, opportunities will still exist, such as using food waste from cruise ships to produce feed for aquaculture [
72].
Noise pollution is a large source of complaints regarding port pollution (
Table 2) and is regarded as an important or very important issue to address by 82% of the ports and 91% of cities in the study. In total, 68% of ports have measures in place and 66% intend to introduce further measures (
Table 3 and
Table 5). This illustrates that ports and cities are aware of the issue and there is a desire to address this in the future. Measures that may reduce noise pollution such as shore-to-ship power, electric port vehicles or harbour vessels, electric port equipment and building efficiency improvements are all of interest to over 70% of port and city respondents (
Table 7 and
Table 9). Measures that may reduce noise by moving traffic have more varied responses, with increased use of rail interesting 72% of the port sample, designated freight corridors 41% and road freight traffic control 38% (
Table 7). For city authorities, the figures are 76%, 55% and 52%, respectively (
Table 9). High costs are shown to be a key barrier to these measures (
Table 18), with designated freight corridors also experiencing significant obstruction from city and municipal authorities, local interest groups/pressure groups and private stakeholders. Once again, there is a consensus between port and city authorities, but high costs present a significant barrier. Building improvements is the option that experiences the lowest levels of obstacles, with only high costs and technological limitations providing major sources of obstacles. Alternatively, tree planting may be a relatively inexpensive way to reduce noise pollution and provide other environmental and visual benefits, such as urban cooling and increased biodiversity [
73]. Tree planting can also help meet other sustainability agendas and therefore may be a desirable option for port-cities.
Water pollution is a key issue for ports in this study, with the majority of ports receiving complaints (
Table 2), and 90% of ports listing it as important or very important. Water pollution received the highest number of respondents categorising it as a very important issue (
Table 3) of all the forms of pollution investigated in this study. It is also the form of pollution with the joint highest level of adoption of measures designed to address it (90%). Some 81% of ports have plans for further measures to combat water pollution, which is also the highest level in this study (
Table 5). Furthermore, 97% of city authorities also believe water pollution is important or very important (
Table 4). This suggests that ports and cities are aware of the issue and are invested in addressing it. The high number of complaints suggests that these attempts are at present not sufficient. This may be due to the fact water pollution may be created by the ships themselves, which the ports have less power to control, or by accidents which were unforeseen and may be difficult to contain as a result. Water pollution may also be caused by road traffic and run-off into water bodies. Water pollution is an issue that local residents may encounter more often, such as through visiting local coastlines, making it a very visible issue. This may be an essential issue for port-cities to address if they are to maintain their societal license to operate.
Traffic congestion is an important source of pollution in port cities and is shown to be detrimental to port operations (
Table 17).
Table 18 shows that high costs and private stakeholders are the main sources of barriers to measures for reducing traffic congestion. Designated freight corridors experience high levels of barriers from high costs, city and municipal authorities, local interest groups/pressure groups and private stakeholders. Dry ports and extended gates also face high levels of barriers from high costs, city and municipal authorities and private stakeholders.
Table 12 shows that both dry ports and extended gates have very low levels of interest from port authorities, with a large number of respondents being neither interested nor disinterested. Adoption of various measures for reducing traffic congestion is low, as shown in
Table 11, and future plans for adoption are even lower. Gate appointment systems are the most popular option and remains so in the future. Given the low percentages of freight transported by rail (
Table 10), with the majority of ports transporting less than 20% by rail, and high levels of interest in increasing the amount of freight transported by rail from both port and city authorities (
Table 7 and
Table 9), it appears that this may be the most suitable measure to implement. This faces significant barriers from high costs, cooperation with city and municipal authorities and private stakeholders (
Table 18). It is therefore important that these barriers are overcome if the usage of rail to transport freight is to be increased. This may also be beneficial for other forms of pollution such as air pollution, and if the train line is located suitably, it may also reduce noise pollution. Due to the mutual interest, this may be an area that port and city authorities can cooperate to address, such as by undertaking joint master planning.
Air pollution is the most common source of daily and weekly complaints about pollution, and also the form of pollution that ports are the least likely to never receive complaints about (
Table 2). Around 85% of ports regard air pollution as an important or very important issue to address, and this is reflected in the increased adoption of measures to combat air pollution in the future (
Table 3 and
Table 5). It is also highlighted as a key issue for city authorities, with 97% regarding it as important or very important. Air pollution is the only form of pollution which sees an increase from current levels of measures in place and plans for further measures in the future. This suggests that air pollution is a key focus of ports’ efforts to reduce pollution. Among the measures for reducing air emissions displayed in
Table 6, LNG sees the biggest increase between current and future levels, whilst renewable energy, shore-to-ship power and electric port vehicles and harbour vessels also see an increase. Renewable energy sees the highest levels of interest from ports, with 88% of the sample expressing an interest, followed by electric port equipment (86%), building efficiency improvements (82%), electric port and harbour vessels (80%) and shore-to-ship power (72%). For cities, the percentages are 91%, 90%, 95% and 95%, respectively, suggesting very high levels of interest from cities. All of the measures are of interest to a majority of the sampled ports, with the exceptions of emissions control areas and road freight traffic control, which were not of interest to the majority of ports. Renewable energy, electric port vehicles and harbour vessels and building efficiency improvements all face barriers due to high costs, with 82%, 85% and 79% of the sampled ports listing the financial cost as an important or very important barrier. However, barriers from other sources are low, except for technological limitations (
Table 18). In many cases, the technology already exists, so the technological barrier may refer more to infrastructural issues at the port that makes it unable to access certain technologies. This may further increase the financial cost. Considering the social, environmental and economic benefits cities and other stakeholders may gain from helping ports to reduce air pollution, working with ports to address the financial barriers may be the best solution to the issue of air pollution in port-cities.
Table 16 highlights how port authorities are willing to invest to address environmental issues at cost, and
Table 8 shows that city authorities are willing to support the port in reducing its environmental impact. It therefore may be possible for ports and cities to work together towards mutually beneficially air pollution mitigation measures.
Overall, there appears to be an awareness of pollution issues in port-cities, and a desire to address it that is shared by both port and city authorities. However, considerable barriers remain, most notably financial challenges. These issues can only be addressed if there is greater cooperation between ports and cities, which can enable improved collaboration in terms of overcoming these challenges. The most obvious way to implement this would be to introduce joint masterplans drawn up by the port and city together, rather than planning in isolation. Most of the city authorities surveyed also lacked any staff member or office that was responsible for dealing with the port, resulting in a lower sample size for cities. It was often challenging to find someone who felt they had the required expertise to answer the questionnaire. This may also be one of the key issues, as city authorities may be prevented from cooperating more closely with ports by institutional issues and a lack of a direct point of contact/cooperation. This could also be improved by encouraging city authorities to designate a member of staff/department responsible for port-city cooperation, or for ports and cities to jointly create such a position that exists as a shared department between them.


 ,
, 
