Abstract
Identifying the evolutionary patterns and drivers of regional water use is a prerequisite for achieving the strictest water resource management system. This study used the Tapio-LMDI model to analyze the decoupling state and driving factors between economic development and production water use in Jiangsu Province from 2004 to 2020. The results show that: (1) From the evolution of the water use structure, the total water use in Jiangsu Province shows a decreasing trend from 2004 to 2020. Among them, the production water use decreased by 9.59%. From the characteristics of economic development (constant prices), the growth of Jiangsu’s gross regional product (GDP) from 2004 to 2020 reached 363%. (2) In terms of the decoupling status, economic development and production water use in Jiangsu Province underwent a “weak decoupling—strongly decoupling” transition and achieved “strongly decoupling” in 2020, with a decoupling elasticity coefficient of −2.30. (3) From the perspective of the decoupling drivers, the reduction in production effects has contributed to the decoupling between economic growth and water use in Jiangsu Province. By sector, the decline in the water use intensity effect and the industrial structure effect in the primary and secondary sectors were the main reason for the decline in its water use, while the increase in the industrial structure effect and economic scale effect of the tertiary sector has effectively contributed to the increase in water use in the tertiary sector. Therefore, there is an urgent need to improve the water use efficiency of the primary and secondary sectors, accelerate the transformation and upgrading of the tertiary sector, and realize a “strongly decoupling” pattern between economic development and production water use in Jiangsu Province.
1. Introduction
Water resources are the material basis for human survival. It is irreplaceable in promoting economic development, maintaining social stability and guaranteeing ecological security [1]. The continuing economic development has increased the demand for water resources, leading to a constant imbalance between water supply and demand [2,3,4]. The water resources in China are uneven in distribution and face serious water shortage, with per capita water resources ranking low globally. In recent years, with the increasing level of economic development, some of China’s regional water resources have become out of balance, and the conflict between water supply and demand has become prominent.
There are many river networks in Jiangsu Province, with abundant water in transit; however, the amount of available water resources is relatively small and difficult to manage. The average annual precipitation in the province is 996.0 mm, and the average annual surface runoff is 27.05 billion m3. The specific performance is as follows: Firstly, the per capita water resource is low. The province’s multi-year average water resources are 36.34 billion m3, and the per capita water resources occupancy is 458 m3 per person, only 21% of the national per capita water resources occupancy. Secondly, the spatial and temporal distribution of water resources is uneven. In terms of time, most of the water resources in Jiangsu Province are distributed during the flood season, with large inter-annual variations in runoff; in terms of space, the overall water resources in Jiangsu Province are less in the north than in the south, with the average water resources per unit area rising from north to south. In addition, the province lacks the construction conditions of large and medium-sized reservoirs for water storage and regulation. Thus, reservoir storage cannot meet the demand for water utilization during the year. At the same time, Jiangsu Province is a major economic center in China, with an average annual GDP growth rate of 12% in 2020, and an economic structure that has been transformed into one where the tertiary sector is the most prominent, the secondary sector next, and the primary sector is the lowest. Therefore, clarifying the evolution of production water use in Jiangsu Province and its driving factors in alleviating water shortage is important.
Production, domestic, and ecological water constitute the “Production-Domestic-Ecological” water use structure. Understanding the water use structure of a country or region is vital for water resources management. However, the “Production-Domestic-Ecological” water use structure is highly concentrated on production water; thus, optimizing the structure of production water to realize the optimization of the “Production-Domestic-Ecological” structure, and providing a guarantee of water resources for the domestic and ecological sectors. The structure of production water use refers to the manner of mutual combination and proportional relationship among primary, secondary and tertiary sector water use; the production water use structure is closely related to regional economic development. Analyzing the evolving structure of production water and its driving factors makes it significant to rationally allocate regional water resources.
Many studies have been performed on the evolution of water use. Sun analyzed the evolution of the water use structure in the Yellow River basin using information entropy, the Lorenz curve, Gini coefficient and the Mann–Kendall (MK) test [5]. Wang analyzed the evolution of the water use structure in Qingyang City based on Renyi’s alpha order function, identified the key drivers of different types of water use through standardized information flow, and explained the abrupt changes in the water use structure [6]. Bao used theoretical methods, such as information entropy and the equilibrium degree, to analyze the water use structure of the Yangtze River Economic Zone and its driving factors [7]. Matthew used a multi-layer model to compare the attitudinal, demographic, and structural drivers of indoor and outdoor residential water use in a northern Utah household [8]. Scholars have mainly used information entropy theory, the Gini coefficient and the MK test to explore regional water-use changes. However, the above methods are difficult to use to explore the relationship between changes in water use and economic development.
In the 1960s, the hot issue of “decoupling economic development from resources and environment” was raised for the first time [9]. In the 21st century, the decoupling relationship between water resources and economic development has attracted the attention of scholars worldwide [10,11]. Tasbasi used the Tapio model to calculate the income elasticity of water demand in Bulgaria, measured the effects of population, per capita income and intensity on water demand through the WPAT equation, and finally, studied the spatial variation of water use based on the local dissimilarity index [12]. Zhao applied environmental Kuznets curve pairs and decoupling models to analyze the textile industry’s water footprint and economic development in China [13]. Pan analyzed the decoupling relationship between economic development and the water use of food and energy in northwest China, and the driving factors, by using the Tapio-LMDI model [14].
In the process of analyzing the driving factor, the factor decomposition method is often dominant. Among the methods used are index decomposition analysis (IDA), structural decomposition analysis (SDA), and production-theoretical decomposition analysis (PDA) [15]. IDA can quantitatively analyze the direction of each factor on the dependent variable; the decomposition model, simply with fewer amounts of data [16]. The IDA method includes the AMDI (arithmetic mean divisia index) and the LMDI (logarithmic mean divisia index). Based on its strong applicability and flexibility, the LMDI method has become an effective tool for analyzing the drivers, carbon emission, and water use impact factors [17,18]. Therefore, the LMDI method was chosen to analyze the factors influencing the production water in Jiangsu Province. However, in terms of the decomposition of the driving factors, scholars mainly analyze the driving factors from the perspective of economic development and total water consumption [19,20,21], or economic growth and agriculture or industry water use [22,23], neglecting the water consumption of the tertiary sector. With the transformation and upgrading of the industrial structure in Jiangsu Province, the output value of the tertiary sector gradually surpasses the secondary sector in the process of economic development. In addition, its water consumption has become less than the secondary sector, which is a part of the decomposition of the driving factors of industrial structure development and production water decoupling that cannot be neglected.
In summary, the decoupling trend of production water use in Jiangsu Province from 2004 to 2020 and its driving factors are analyzed based on the LMDI-Tapio model, which is a two-stage approach, namely the LMDI logarithmic decomposition method and the Tapio decoupling model. This paper uses the Tapio decoupling model to initially analyze the relationship between production water use and economic development in Jiangsu Province. Subsequently, it combines the LMDI model to establish a decomposition model of the driving factors to further explore the underlying causes of the decoupling effect between production water use and economic development in Jiangsu Province. Using the LMDI-Tapio model to quantify the decoupling relationship between production water use and economic development, the dynamic changes in the correlation between them can be more intuitively reflected. This is important to rationally allocate water resources and establish a water-saving society in Jiangsu Province.
2. Materials and Methods
2.1. Study Area
Jiangsu Province (30°45′–35°20′ N, 116°18′–121°27′ E) is located in the center of the eastern coast of China. The proportion of plain and water surface is the highest in China, a major geographical advantage of Jiangsu Province. The 2021 China Statistical Yearbook showed Jiangsu Province’s GDP in the top three of China in 2020, with the total economic output exceeding one billion yuan. At the same time, according to the 2004–2020 Water Resources Bulletin of Jiangsu Province, the precipitation in Jiangsu Province from 2004 to 2020 was as shown in Figure 1 below. It can be seen that the overall precipitation in Jiangsu Province fluctuated from 2004 to 2020. The maximum precipitation of 1410.50 mm occurred in 2016, and the minimum of 784 mm in 2004.
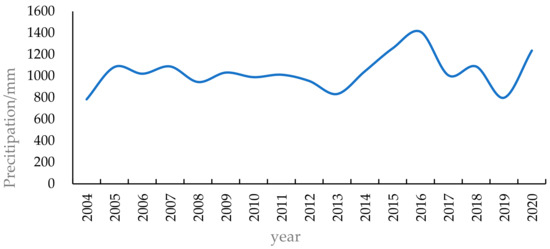
Figure 1.
Trends in precipitation in Jiangsu Province from 2004 to 2020.
Jiangsu Province has dense water systems and is relatively rich in transit water resources; however, the water endowment conditions are not optimistic, with the average annual water resources at 36.34 billion m3 and the per capita water resources at 458 m3, about 1/5 of the national per capita water resources, far below the world level. Water resources are unevenly distributed in the region, with a gradual upward trend from north to south. The water resources bulletin of Jiangsu Province in 2020 showed that the total water consumption in Jiangsu Province was 45.27 billion m3, with production water accounting for 89.1%, while the proportion of domestic and ecological water consumption was 9.8% and 1.1%, respectively. The primary, secondary and tertiary sectors’ water consumption accounted for 66.1%, 30.0% and 3.9%.
2.2. Sources and Transformation of Data
The total water use, and primary, secondary, and tertiary sector water use, data were obtained from Jiangsu Water Resources Bulletin from 2004 to 2020. The water supply sources in Jiangsu Province mainly include surface water sources, groundwater sources and water supply from non-conventional sources. The GDP data and the primary, secondary and tertiary sector output were obtained from the Jiangsu Statistical Yearbook from 2005 to 2021. The output value of the three sectors and the GDP of Jiangsu Province have been adjusted according to the constant prices in 2000 to eliminate the influence of price factors.
In this study, production water is subdivided into primary, secondary and tertiary sector water use; the specific sectors are shown in Table 1 below.

Table 1.
Production water use classification and its hierarchy.
2.3. Measures
(1) Based on the Kaya constancy equation for production water
In order to explore the driving factors of production water use in Jiangsu Province, the Kaya constant equation constructed in this paper, based on the Zhang study [24], is as follows:
where Wprod is production water use (billion m3); f, s and t are the primary, secondary and tertiary sectors, respectively; Wi is i sector water use (billion m3); Gi is i sector output, respectively (billion yuan); Ti is the water intensity effect, which is the ratio of water use to the output value for the sector (m3/billion yuan); Qi is the industrial structure effect, which is the ratio of the output value to the regional GDP for the sector; G is the regional GDP (billion yuan).
(2) Decomposition of LMDI model factors
Based on the Kaya constant equation for production water use constructed above, the LMDI decomposition method is used to analyze the driving factors of production water. The LMDI decomposition method mainly includes additive and multiplicative decomposition forms. The multiplicative form mainly reflects the magnitude of the influence of the different drivers; the additive form focuses on the amount of the different drivers’ influence [17]. The concept of additive decomposition is clear and has some physical meaning, so the LMDI additive decomposition form is chosen.
The effects of each driving factor of water use in the sector are as follows:
Water use intensity effects:
Industrial structure effects:
Economic scale effect:
where ΔWprod is the production effect; ΔWi is i industrial effects (i stands for primary, secondary and tertiary sector); ΔTi, ΔQi, ΔGi are the water use intensity effects, industrial structure effects, and economic scale effect. and are the water use of each sector in year t and the base year, respectively; , and Gt are the water use intensity effect, industrial structure effect, and economic scale effect of each sector in year t, respectively; , and G0 are the water use intensity effect, industrial structure effect, and economic scale effect of each sector in the base year, respectively. The rest of the explanation is as above.
(3) Tapio decoupling models
Decoupling was originally developed by the Organization for Economic Cooperation and Development (OECD), to explore how to break the link between environmental quality damage and economic development and to measure the state of economic development and resource consumption. Decoupling between water resources and economic development means achieving optimal economic growth with minimal water use within a given economic scale and technological level. Referring to related scholars [25], the types of decoupling were classified into three types and eight states, as shown in Table 2.
Table 2.
Relationship between the decoupling state and decoupling index.
Based on previous studies [13,26,27], the decoupling relationship between economic development and production water use in Jiangsu Province was constructed.
The decoupling relationship between primary, secondary and tertiary sector development and the each sector’s water use was constructed as follows.
where D (Wprod, G) is the decoupling elasticity coefficient between the regional GDP and production water use; D (Wi, Gi) is the decoupling elasticity coefficient between the output value of sector i and its water use; and are the value of water use and the output value of sector i in year t − 1; other definitions as above.
Figure 2 shows a summary of the research methods used in this paper. Based on the analysis of the changes in water use structure and economic development in Jiangsu Province from 2004 to 2020, using the Tapio decoupling model, the relationship between production water use and economic development in Jiangsu Province is initially analyzed. Then, the LMDI decomposition model is combined to establish a decomposition model of the driving factors to further explore the underlying causes of the decoupling effect between production water use and economic development in Jiangsu Province.
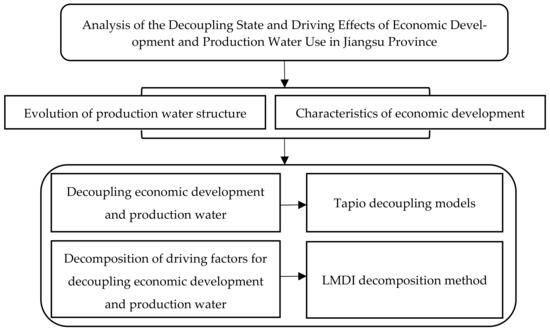
Figure 2.
A method for analyzing the state of decoupling and the driving factors of production water and economic development.
3. Results
3.1. Analysis of the Evolution of Production Water Structure in Jiangsu Province
The changes in water use in different sectors in Jiangsu Province from 2004 to 2020 are shown in Figure 3. The total water use in Jiangsu Province decreased from 51.46 billion m3 in 2004 to 45.27 billion m3 in 2020, with a 13.67% decrease in water consumption. Among them, the total water use in Jiangsu Province showed a slight upward trend from 2004 to 2011 and a significant decrease in 2013. In 2012, the State Council implemented the strictest water resources management system in Jiangsu Province, promoting water use efficiency in Jiangsu Province. Production water use was consistent with the trend in total water consumption, showing a slight upward and downward trend, from 48.20 billion m3 in 2004 to 40.36 billion m3 in 2020. Specifically, the primary sector’s water use was declining, from 29.15 billion m3 (2004) to 26.60 billion m3 (2020), reaching a maximum of 31.03 billion m3 in 2011. Water use in the primary sector began to show a downward trend in 2012. The secondary sector’s water use showed a trend of rising (2004–2007) and then falling (2008–2020), and the variation from 2014 to 2020 was relatively stable, remaining at 12~13 billion m3. The tertiary sector’s water use was on the rise from 2004 to 2020. With the transformation and upgrading of the industrial structure in Jiangsu Province, tertiary sector water steadily increased from 630 million m3 in 2004 to 1.58 billion m3 in 2020.
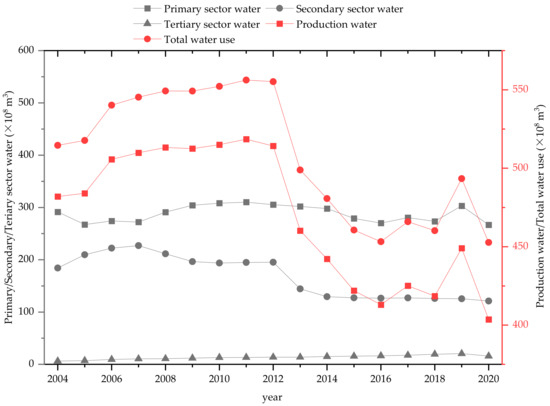
Figure 3.
Changes in production water in Jiangsu Province from 2004 to 2020.
The water use structure of Jiangsu Province from 2004 to 2020 is shown in Figure 4. The proportion of production water in the total water use decreased from 93.66% in 2004 to 89.15% in 2020. The proportion of other water (domestic and ecological water) increased steadily from 6.34% (2004) to 10.85% (2020). Specifically, the primary sector is the main water sector in Jiangsu Province, accounting for 56.65% of the total water use in 2004 to 58.89% in 2020. The following is the secondary sector, the share of water use gradually decreased during the study period, from 35.79% in 2004 to 26.77% in 2020. Tertiary sector’s water use increased year by year from 2004 to 2020; however, the proportion of water used remained low, although it rose from 1.22% in 2004 to 3.49% in 2020. Overall, the primary sector’s water use was on a decreasing trend, its proportion was still large. The primary sector was still the main water consumer. Therefore, improving the water use efficiency of the primary sector is the key to controlling the total water use and is a prerequisite for the sustainable and efficient utilization of water resources in Jiangsu Province.
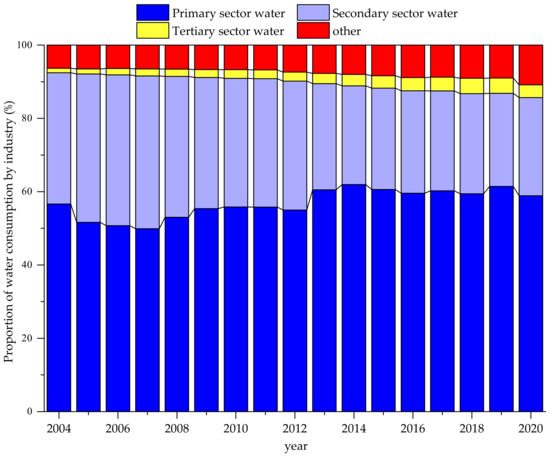
Figure 4.
Change in the proportion of production water in Jiangsu Province from 2004 to 2020. (Note: Other refers to the sum of domestic and ecological water use).
3.2. Analysis of the Characteristics of Economic Development in Jiangsu Province
The GDP of Jiangsu Province and the output value of each sector from 2004 to 2020 are shown in Figure 5. The output value in the figure was adjusted according to the constant price in 2000. The GDP of Jiangsu Province grew rapidly from 2004 to 2020. Specifically, the primary sector showed a slight increase, but its proportion of GDP was small. The output value of the secondary sector increased from 765.91 billion yuan in 2004 to 2720.99 billion yuan in 2020. The tertiary sector’s output value also increased significantly, its proportion also increased steadily, and in 2015, its output gradually began to exceed that of the secondary sector.
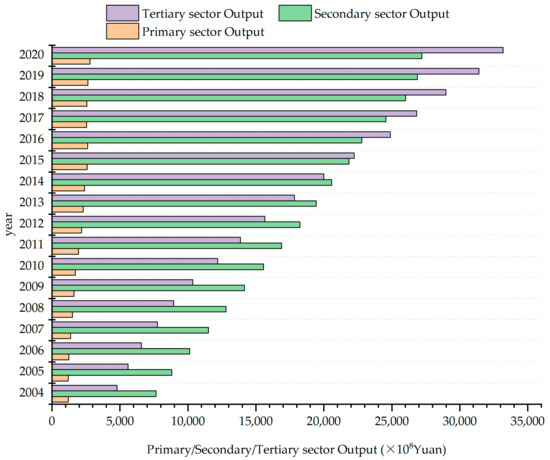
Figure 5.
The regional output value characteristics in Jiangsu Province from 2004 to 2020.
3.3. Empirical Analysis of Decoupling Economic Development and Production Water in Jiangsu Province
The Tapio decoupling model was used to measure the decoupling status of economic development and production water use in Jiangsu Province from 2004 to 2020. The results are shown in Table 3. Economic development and production water use changed from a “weak decoupling” to a “strongly decoupling” type. Among them, the primary sector’s output and its water use moved through “strongly decoupling—weak decoupling—strongly decoupling”. The secondary sector’s output and water use changed from the “expansive coupling” type in the early stage to the “strongly decoupling” type in the later stage. The tertiary sector’s output and water use constantly changed between the “weak decoupling—strongly decoupling” types.
Table 3.
Decoupling status of industrial development and production water use in Jiangsu Province from 2004 to 2020.
Specifically, in 2005, the primary sector’s output and its water use were “strongly decoupling”. During the “11th Five-Year Plan (2006–2010)”, there were more years of “weak decoupling” between primary sector output and water use, indicating that the output of the primary sector in Jiangsu Province was based on high water consumption at this time. There were more years of “strongly decoupling” between the primary sector’s output and its water use in the “12th Five-Year Plan (2011–2015)”, which indicates that the management of water use in the primary sector in Jiangsu Province strengthened with the economic development. During the “13th Five-Year Plan (2016–2020)”, the decoupling state between primary sector output and water use in Jiangsu Province changes significantly, with “weak negative decoupling” and “expansive negative decoupling” between 2017 and 2019, and decoupling elasticity coefficients of −1.18 and −2.33, respectively, in an undesirable decoupling state. In addition, the “strongly decoupling” type was achieved again in 2020.
The secondary sector’s output and its water use underwent a “weak decoupling—strongly decoupling” change in the remaining years, except for 2005. At the same time, in the “13th Five-Year Plan”, the “strongly decoupling” type featured in most years. The water use efficiency gradually improved in parallel with the economic development of the secondary sector.
From 2005 to 2019, the decoupling between the tertiary sector’s output and its water use in Jiangsu Province was mainly with “weak negative decoupling” in 2006 and 2018, and the decoupling elasticity coefficients were 1.81 and 1.28, which were an undesirable state of development. In 2020, the output of the tertiary sector and its water use were “strongly decoupling” for the first time, with a decoupling elasticity coefficient of −4.04. The economy of the tertiary sector continues to develop, and its water use efficiency also begins to improve.
During the “11th Five-Year Plan” (2006–2010) and before 2005, there were more years of “weak decoupling” between economic development and production water use, indicating that economic development and water use in Jiangsu Province had not yet reached developmental balance. The number of years with the “strongly decoupling” type during the “12th Five-Year Plan (2011–2015)” increased significantly, and the primary and secondary sectors began to show the “strongly decoupling” type, indicating that Jiangsu Province began to pay more attention to production water use in parallel with economic development. During the “13th Five-Year Plan (2016–2020)”, the decoupling type of Jiangsu Province experienced the decoupling state of “weak—expansive negative—strongly”. In 2019, the decoupling type of Jiangsu Province showed “expansive negative decoupling”. In 2020, all three industrial development and water use results showed a “strongly decoupling” pattern. The elasticity coefficient of the decoupling of production water use and economic development reached −2.73, which began to show a stable “strongly decoupling” trend.
3.4. Decomposition of Driving Factors for Decoupling Economic Development and Production Water in Jiangsu Province
The LMDI additive model was used to measure the driving factors of decoupling economic development and production water use in Jiangsu Province. The results are shown in Table 4 below.
Table 4.
Decomposition of the decoupling drivers of economic development on production water use in Jiangsu Province, 2004–2020.
The decrease in the effect of the primary sector in 2005 inhibited the growth of production water use. However, the increase in the effect of secondary production was the main reason for the growth of production water use in Jiangsu Province in 2005.
During the “11th Five-Year” Plan, the increase in the tertiary sector effect was the main reason for the increase in production water use. The effect of the primary sector still fluctuated and increased except for 2007, and the increase in the primary sector was the main reason for the rise in production water use in Jiangsu Province in 2008 and 2010. The effect of the secondary sector gradually decreased in 2010, and the decrease in the effect of the secondary sector in 2009 offset the increase in production water use in Jiangsu Province and caused a decrease in the total effect of water use in Jiangsu Province.
During the “12th Five-Year Plan”, the effect of the primary (2012–2015) and secondary (2013–2015) sectors gradually began to decline. However, the effect of the tertiary sector still played a role in promoting production water use. Specifically, the increase in the production effect in 2011 led to increased total water consumption in Jiangsu Province; while in 2012–2015, the decline in the effect of the primary and secondary sectors inhibited the growth of production water use in Jiangsu Province. It was also the main reason for the decline in total water consumption.
During the “13th Five-Year Plan”, the three production water use sectors experienced a continuous shift from “promotion to suppression”. Specifically, the decrease in the effect of the primary and secondary sectors in 2016 and 2018 was the main reason for the decrease in the total production effect in Jiangsu Province. The increase in the effect of the primary sector in 2017 and 2019 was the main reason for the rise in the total production water use in Jiangsu Province. The decrease in the effect of the primary, secondary and tertiary sectors in 2020 effectively inhibited total production water use growth in Jiangsu Province. It was also the main reason for the “strong decoupling” between economic development and production water use in Jiangsu Province.
By industry, the economic scale effect was the main reason for the primary sector’s water use growth. The water use intensity (except in 2017 and 2019) and the industrial structure (except in 2011, 2012 and 2020) inhibited the increase in the primary sector’s water use in Jiangsu Province in most years (Figure 6a). More specifically, from 2004 to 2016, the water use intensity effect of the primary sector in Jiangsu Province showed an overall inhibiting effect. It went through a “pulling (1.98 billion m3)—inhibiting (−0.90 billion m3)—pulling (1.90 billion m3)—inhibiting (−5.09 billion m3)” pattern from 2017 to 2020. From 2004 to 2010, the industrial structure had a negative inhibiting effect on primary sector water use. The industrial structure adjustment made the primary sector’s water use gradually increase from 2011 to 2012. In summary, the reduction in the water use intensity effect and the industrial structure effect was the main reason for the decline in water consumption in the primary sector and was the reason for the “strongly decoupling” type in the primary sector.
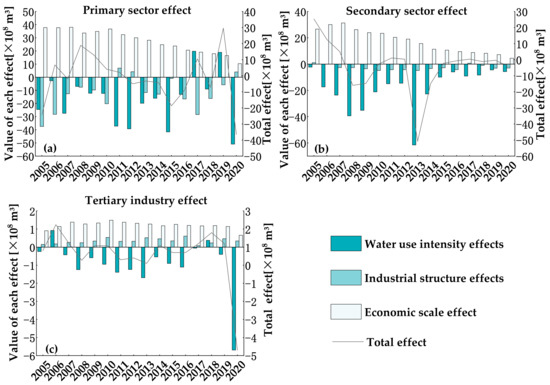
Figure 6.
Decomposition of water use drivers by sub-sector.
The economic scale effect promoted the increase in secondary sector water use. Still, the decrease in the water use intensity effect was the main reason for inhibiting the secondary sector’s water use (Figure 6b). More specifically, the water intensity effect of the secondary sector’s output (−6.15 billion m3) had the greatest inhibiting effect on its water use in 2013. The effect of the industrial structure of the secondary sector mainly played an inhibiting role in the increase in the secondary sector’s water use from 2005 to 2016, which changed from an “inhibiting to pulling” effect in 2017 and continued to inhibit the increase in the secondary sector’s water use in 2018. In summary, the reduction in the water intensity and industrial structure effects were the main reasons for the decline in the secondary sector’s water use. It was also why the secondary sector’s output and water use were “strongly decoupling”.
The industrial structure and economic scale effect promote increased tertiary sector water use, while the water intensity effect negatively inhibits the tertiary sector’s water use in most years (except for 2005 and 2018) (Figure 6c). More specifically, during 2006–2017, the water use intensity effect in the tertiary sector improved. It was sufficient to offset the promotion of the tertiary sector’s water use by the industrial structure effect and the economic scale effect. In 2018, the water intensity effect of the tertiary sector was increased, causing an “expansive negative decoupling” between its output and water use. The water use intensity effect in the tertiary sector began to decline in 2019. In 2020, the reduction in water use intensity offset the increase in the industrial structure and economic scale effect for the first time, which was the main reason for the “strongly decoupling” type shown by the tertiary sector and its water use.
4. Discussion
Water resources in Jiangsu Province have an uneven spatial-temporal and inter-annual distribution, and the water endowment is not optimistic. The province’s annual total water resources are 36.34 billion m3, and the per capita water resources holdings are 458 m3/per, only 21% of the national per capita water resources [1]. Therefore, to achieve a “strongly decoupling” state between economic development and the production water in Jiangsu Province, it is necessary to continuously strengthen the water resources development and utilization technology. On the one hand, this strengthens the collection of various types of basic water resources data using big data platforms and other technical means of analysis; on the other hand, it enhances the intensity of the development and use of unconventional water sources, as far as possible, to include unconventional water sources in the study of the optimal allocation of water resources.
The proportion of production water use in Jiangsu Province is large, and controlling it is a prerequisite for achieving the strictest water resource management system. In recent years, the primary sector’s water use in Jiangsu Province has been declining; however, its proportion is still large. To improve water use efficiency and reduce the water use intensity effect in the primary sector, it is vital to vigorously develop water-saving irrigation technology. The water use of the secondary sector has been stabilizing in recent years, and its industrial structure effect has shown a downward trend. The secondary sector, with high water consumption and high emissions, is not conducive to the sustainable development of Jiangsu Province’s economic society; thus, importing high-tech systems is the key to achieving the secondary sector’s economic growth and improving its water use efficiency. The tertiary sector in Jiangsu Province has been in stable development in recent years and has a certain pulling effect on the growth of the regional GDP. At the same time, the water use efficiency of the tertiary sector has been improving, which is the main reason for Jiangsu Province achieving a “strongly decoupling” state between economic development and production water use. In conclusion, it is important to carry out water conservation during production to guarantee other water uses (domestic and ecological environment water use) and to realize the decoupling of economic development and water use in Jiangsu Province.
Previous studies on the decoupling status and driving factors between economic development and production water use focused on agriculture or industry water use. The decoupling status and driving factors between economic growth in the tertiary sector and its water use were ignored. As primary and secondary sector development in Jiangsu Province has slowed down, the tertiary sector has gradually become the leading force of economic development in Jiangsu Province, promoting the restructure and upgrade of the industrial structure. At the same time, in 2020, the economic development of the three sectors in Jiangsu Province and their industrial water use have been “strongly decoupling” for the first time, gradually forming a balanced development pattern.
The fifth assessment report of the IPCC showed that the global surface temperature would rise by 0.9~1.3 °C from 2016 to 2035. Under climate change, the spatial and temporal distribution of water resources will be increasingly mismatched with the layout of socioeconomic development, and global water security will face greater challenges [28,29]. Jampanil et al. showed that industrial water use in the UK would change by 3.6–6.1% under a medium-high climate scenario. Jampanil showed that industrial water use in Thailand would increase by 0.2% in the mid-21st century due to climate change [30]. Zhang showed that climate change affects different sectors of industrial water use differently, with 22 of the 34 industrial water use sectors in Hebei Province being affected by rainfall and temperature change rates, with the changes ranging from −15.11% to 37.36% [31]. Wang constructed a statistical model to predict the changes in domestic water use in the Huaihe River basin based on the effects of climate change. The results showed that as the average temperature increased by 1 °C, the domestic water use in each sub-basin of the Huaihe River increased by 0.549 × 10⁸~5.759 × 10⁸ m3 [32]. In summary, not only will agricultural water use be affected by climate change, but water use in the industrial and domestic sectors will also change. However, the impact of climate change has not been considered in the analysis of the changes in production water use and the driving factors. The impact of climate change upon water use in the primary, secondary and tertiary sectors needs further improvement.
5. Conclusions
The Tapio-LMDI method was used to quantitatively analyze the decoupling status and driving factors between economic development and production water use in Jiangsu Province. The conclusions are as follows:
(1) From 2004 to 2018, the overall decoupling type between economic development and production water use in Jiangsu Province was in a “strongly-weak decoupling” type, with an “expansive negative decoupling” type in 2019, and a stable “strongly decoupling” state beginning in 2020. The primary sector’s output and its water use experience “strongly decoupling—negative decoupling—strongly decoupling”, respectively. The secondary sector’s output and its water use change from the “expansive coupling” type in the early years to a “strongly decoupling” type at the later stage. The tertiary sector’s output and its water use are constantly maintained as the “weak decoupling” type, until achieving the “strongly decoupling” type in 2020.
(2) From 2004 to 2020, the decrease in water use intensity and industrial structure effect in the primary and secondary sectors had a suppressive effect on the increase in total water consumption in Jiangsu Province. Water use efficiency in the tertiary sector has improved gradually, and the intensity effect of water use has been reduced. The increase in the industrial structure effect and economic scale effect of the tertiary sector was the main reason for the increase in water use in the tertiary sector.
The following policy recommendations are made based on the above conclusions:
(1) Jiangsu Province should implement high-quality development, strengthen industrial transformation and upgrading, and improve its water use efficiency to control total regional water use.
(2) Work should be carried out to conserve water in the production sector in Jiangsu Province, such as improving the irrigation water use efficiency for farmland and the reuse rate for industrial water while also strengthening water conservation in the domestic water use sector.
(3) Industrial structure effects should be further reduced and attention paid to the contribution of the water use intensity effect, especially in the primary sector, in achieving the transformation and upgrade of the industrial structure required to ensure food security.
Author Contributions
All authors contributed to the study conception and design. Data collection was carried out by T.Z., X.W., H.W. and X.Z. Data analysis was performed by T.Z., X.W., G.Q. and Y.K. The first draft of the manuscript was written by T.Z., X.W. and H.W. Review and writing the final draft were performed by T.Z., X.W., G.Q., S.S., Y.K., H.W. and X.Z. All authors have read and agreed to the published version of the manuscript.
Funding
This study was supported by National Natural Science Foundation of China (No. 52121006); Young Top-Notch Talent Support Program of National High-level Talents Special Support Plan; Research Project of Ministry of Natural Resources (No. 20210103); Research Project of Jiangsu Provincial Department of Natural Resources (No. 2021003, 2022022); Research Project of Jiangsu Land and Resources Research Center (No. 2020TDZY06, ZK202106, ZK22003); Six Talents Peak Project of Jiangsu Province (No. JNHB-068); 333 High-level Talents Cultivation Project of Jiangsu Province and Research Project of Jiangsu Water Conservancy Research Institute (No. 2022019); and Research Team of Gansu Agricultural University, College of Water Resources and Hydroelectric Engineering (No. Gaucwky-01) for providing financial support for this research. We are also thankful to anonymous reviewers and editors for their helpful comments and suggestions.
Institutional Review Board Statement
Not applicable.
Informed Consent Statement
Informed consent was obtained from all subjects involved in the study.
Data Availability Statement
The datasets generated during and/or analyzed during the current study are available from the corresponding author.
Acknowledgments
All the authors are appreciated for providing helpful suggestions during this research.
Conflicts of Interest
The authors declare no conflict of interest.
References
- Wang, X.J.; Jin, Z.F.; Chen, Y.; Gu, L.Y.; Zhang, X. Research on Rigid Constraint Mechanism of water resources in territorial space planning. Nat. Resour. Econ. China 2021, 34, 4–9. [Google Scholar]
- Gosling, S.N.; Arnell, N.W. A global assessment of the impact of climate change on water scarcity. Clim. Chang. 2016, 134, 371–385. [Google Scholar] [CrossRef]
- He, R.; Tang, Z.; Dong, Z.; Wang, S. Performance evaluation of regional water environment integrated governance: Case study from Henan Province; China. Int. J. Environ. Res. Public Health 2020, 17, 2501. [Google Scholar] [CrossRef]
- Koop, S.; Leeuwen, C.V. The challenges of water; waste and climate change in cities. Environ. Dev. Sustain. 2017, 19, 385–418. [Google Scholar] [CrossRef]
- Sun, J.Q.; Wang, X.J.; Shamsuddin, S.; Yin, Y.X.; Li, E.K. Spatiotemporal changes in water consumption structure of the Yellow River Basin; China. Phys. Chem. Earth 2022, 126, 103112. [Google Scholar] [CrossRef]
- Wang, X.J.; Qian, L.X.; Hong, M.; Zhang, J.Y. Evolution and abrupt change for water use structure through matrix-based Renyi’s alpha order entropy functional. Stoch. Env. Res. Risk A 2022, 36, 1413–1428. [Google Scholar] [CrossRef]
- Bao, X.R.; Zhang, X.N.; Zhang, W.T.; Xu, Y.; Zhang, Z.X. Analysis on the evolution and driving forces of water use structure in the Yangtze River Economic Zone. J. Yangtze River Sci. Res. Inst. 2022, 1–9. [Google Scholar] [CrossRef]
- Matthew, J.B.; Douglas, J.S.; Joanna, E.W.; Melissa, H. A multilevel analysis of the drivers of household water consumption in a semi-arid region. Sci. Total Environ. 2018, 712, 136489. [Google Scholar] [CrossRef]
- Carter, A.P. The economics of technological change. Sci. Am. 1966, 214, 25–31. [Google Scholar] [CrossRef]
- Apergis, N. Environmental Kuznets curves: New evidence on both panel and country-level CO2 emissions. Energy Econ. 2016, 54, 263–271. [Google Scholar] [CrossRef]
- Filatov, N.N.; Litvinenko, A.V.; Bogdanov, M.S. Water resources of the Northern Economic Region of Russia: The state and use. Water Resour. 2016, 43, 779–790. [Google Scholar] [CrossRef]
- Tasbasi, A. A threefold empirical analysis of the relationship between regional income inequality and water equity using Tapio decoupling model; WPAT equation; and the local dissimilarity index: Evidence from Bulgaria. Environ. Sci. Pollut. Res. 2020, 28, 4352–4365. [Google Scholar] [CrossRef]
- Zhao, H.; Lu, X.D.; Shao, Z.Z. Empirical analysis on relationship between water footprint of China’s textile industry and eco-environment. Ekoloji 2019, 28, 1067–1076. [Google Scholar]
- Pan, Z.Y.; Fang, Z.; Chen, J.Y.; Hong, J.; Xu, Y.S.; Yang, S.L. Driving factors of decoupling between economic development and water consumption in food and energy in Northwest China—Based on the Tapio-LMDI method. Water 2021, 13, 917. [Google Scholar] [CrossRef]
- Nagashima, F. The sign reversal problem in structural decomposition analysis. Energy Econ. 2018, 72, 307–312. [Google Scholar] [CrossRef]
- Ang, B.W.; Liu, N. Handling zero values in the logarithmic mean Divisia index decomposition approach. Energy Policy. 2007, 35, 238–246. [Google Scholar] [CrossRef]
- Wang, X.W.; Li, R.R. Is urban economic output decoupling from water use in developing countries?—Empirical analysis of Beijing and Shanghai; China. Water 2019, 11, 1335. [Google Scholar] [CrossRef]
- Li, M.; Li, Q.F.; Liu, H.C. Analysis of water resources utilization in Shule River Basin Based on LMDI and decoupling index. China Rural. Water Hydropower 2022. Available online: http://kns.cnki.net/kcms/detail/42.1419.TV.20211216.0842.002.html (accessed on 17 May 2022.).
- Zhang, C.J.; Zhang, H.Q.; Chen, Q.Y.; Zhang, W. Factors influencing water use changes based on LMDI Methods. Resour. Sci. 2016, 38, 1308–1322. [Google Scholar]
- Zhu, S.Y.; Song, S.B.; Wang, X.J.; Wang, B.X. LMDI and STIRPAT model-based quantitative analysis and study on factors of impacts on regional water-use. Water Resour. Hydropower Eng. 2021, 52, 30–39. [Google Scholar]
- Shi, C.F.; Yuan, H.; Pang, Q.H.; Zhang, Y.Y. Research on the decoupling of water resources utilization and agricultural economic development in Gansu Province from the perspective of water footprint. Int. J. Environ. Res. Public Health 2020, 17, 5758. [Google Scholar] [CrossRef] [PubMed]
- Wu, D.; Li, A.; Zhang, C.J. Evaluation on the decoupling between the economic development and water resources utilization in the Beijing-Tianjin-Hebei region under dual control action. China Popul. Resour. Environ. 2021, 31, 150–160. [Google Scholar]
- Zhang, H.Q.; Chen, C.; Zhang, C.J. Driving effect of decoupling between economic growth and water consumption in Yangtze River economic belt—Comparative analysis based on “Eleventh Five-Year Plan” and “Twelfth Five-Year Plan” periods. J. Econ. Water Resour. 2020, 38, 30–35, 82. [Google Scholar]
- Lin, B.Q.; Liu, K. Using LMDI to analyze the decoupling of carbon dioxide emissions from China’s heavy industry. Sustainability 2017, 9, 1198. [Google Scholar]
- Tapio, P. Towards a theory of decoupling: Degrees of decoupling in the EU and the case of road traffic in Finland between 1970 and 2001. Transp. Policy 2005, 12, 137–151. [Google Scholar] [CrossRef]
- Wang, Q.; Jiang, R.; Li, R. Decoupling analysis of economic growth from water use in City: A case study of Beijing, Shanghai, and Guangzhou of China. Sustain. Cities Soc. 2018, 41, 86–94. [Google Scholar] [CrossRef]
- Cai, H.; Mei, Y.D.; Chen, Y.Y. An analysis of a water use decoupling index and its spatial migration characteristics based on extracting trend components: A case study of the poyang lake basin. Water 2019, 11, 1027. [Google Scholar] [CrossRef]
- Field, C.B.; Barros, V.R. Climate change 2014: Impacts; adaptation; and vulnerability. Part A: Global and sectoral aspects. Contribution of Working Group II to the Fifth Assessment Report of the Intergovernmental Panel on Climate Change. Guangdong Agric. Sci. 2014. [Google Scholar] [CrossRef]
- Vorosmarty, C.J.; Green, P.; Salisbury, J.; Lammers, R.B. Global water resources: Vulnerability from climate change and population growth. Science 2000, 289, 284–288. [Google Scholar] [CrossRef]
- Jampanil, D.; Suttinon, P.; Seigo, N.; Koontanakulvong, S. Application of input–output table for future water resources management under policy and climate change in Thailand: Rayong Province case study. In Proceedings of the PAWEES 2012 International Conference, Bangkok, Thailand, 27–29 November 2012. [Google Scholar]
- Zhang, X.; Zhang, J.Y.; Ao, T.Q.; Wang, X.J.; Chen, T.; Wang, B.X. Evaluating the impacts of climate change on industrial water demand by sector. Clim. Res. 2021, 84, 145–158. [Google Scholar] [CrossRef]
- Wang, X.J.; Zhang, J.Y.; Shahid, S.; Bi, S.H.; Elmahdi, A.; Liao, C.H.; Li, Y.D. Forecasting industrial water demand in Huaihe River Basin due to environmental changes. Mitig. Adapt. Strateg. Glob. Chang. 2018, 23, 469–483. [Google Scholar] [CrossRef]


Disclaimer/Publisher’s Note: The statements, opinions and data contained in all publications are solely those of the individual author(s) and contributor(s) and not of MDPI and/or the editor(s). MDPI and/or the editor(s) disclaim responsibility for any injury to people or property resulting from any ideas, methods, instructions or products referred to in the content. |
© 2023 by the authors. Licensee MDPI, Basel, Switzerland. This article is an open access article distributed under the terms and conditions of the Creative Commons Attribution (CC BY) license (https://creativecommons.org/licenses/by/4.0/).