Article

A Study on the Impacts of One-Strut Failure Scenarios for Deep Excavation in Loose to Medium-Dense Sand

by
Bin-Chen Benson Hsiung
1,
Khac-Hai Phan
2 and
Darn-Horng Hsiao
3,*
1
Department of Civil Engineering, National Chung-Hsing University, 145 Xingda Rd., South Dist., Taichung City 40227, Taiwan
2
Geotech Science Co., Ltd., 2F, No. 200, Section 3, Da-Tung Rd., New Taipei City 221, Taiwan
3
Department of Civil Engineering, National Kaohsiung University of Science and Technology, Kaohsiung City 807618, Taiwan
*
Author to whom correspondence should be addressed.
Sustainability 2023, 15(13), 10530; https://doi.org/10.3390/su151310530
Submission received: 16 April 2023 / Revised: 22 June 2023 / Accepted: 29 June 2023 / Published: 4 July 2023

Abstract

:
This study aims to identify the impacts of one-strut failure (OSF) during deep excavation in loose to medium-dense sand with respect to strut loads and wall deflections. The finite element software PLAXIS was used to carry out both 2D and 3D analyses. In addition, as two-dimensional (2D) analysis is commonly applied in engineering practice due to limited budget and time, the reasonable transferring of results obtained using 3D analyses to 2D analyses for OSF influences was explored. It was found that a failed strut located at the lowest level at the center of the excavation is the most critical case since it causes the most significant impacts on strut load transferring and additional wall deflection. In order to adequately demonstrate such impacts using 2D analyses, it is suggested that a reduction factor of axial stiffness of 2.5 should be adopted instead of removing an entire level of struts, as currently being used in 2D analyses of OSF.

1. Introduction

Concerns have been increasing over the years with regard to the efficiency of strutting systems under construction sequences because collapses in deep excavations are usually initiated by a partial failure of such systems (Whittle and Davies [1]; Puller [2]). A one-strut failure (OSF) analysis is, therefore, required to be implemented for underground construction in certain places and countries to prevent potential catastrophic failure (BS8002 [3]; TR26 [4]). The main purpose of checking the OSF scenario in design is to ensure that the failure of individual struts will not lead to the failure of the entire deep excavation. For a stable deep excavation under OSF conditions, it is assumed that the failure of any single strut, anchor, or tieback at any one location cannot lead to an unstable earth-retaining stabilization structure (ERSS) and additional load from a failed strut, anchor, or tieback can still be safely undertaken by the rest (Suthiwarapirak [5] and TR26 [4]).
Several research studies have been conducted to address these issues and to explore the behavior of deep excavation. One of the concerns is whether OSF could definitely lead to large-scale progressive failure, which eventually causes a total collapse of bracing systems. Numerical simulations of strut responses for a deep excavation in clay under an OSF phenomenon via inspection of the load transfers were conducted by Goh et al. [6]. Similarly, Phan et al. [7] studied the strut load transfers and distribution of horizontal effective stresses caused by OSF in sandy soil. Through finite element analyses of a deep excavation in clayey soil, Choosrithong and Schweiger [8] found that the failure of individual support elements could not lead to catastrophic failure of the whole excavation as long as a robust design was put in place to generate a larger stress redistribution capacity. Secondly, a deep excavation, generally speaking, has multiple levels of struts and each level has more than one strut; thus, the selection of position becomes very crucial in the investigation of OSF conditions. In most cases, the lowest strut level of a deep excavation is among the most dangerous situations caused by OSF in terms of stress distribution, load transfers, and wall deflections (Whittle and Davies [1]; Goh et al. [6]; Phan et al. [7], Choosrithong and Schweiger [8]; Pong et al. [9]). Interestingly, Liu et al. [10] found that a failed strut placed at a location in the middle of a deep excavation is the most important one since its strength redundancy is the smallest compared to others. Finally, uncertainties in engineering practice have led to a comparatively conservative design of OSF conditions in which a whole level of the horizontal temporary supporting system in a two-dimensional (2D) simulation has to be removed. An OSF analysis actually requires a three-dimensional (3D) analysis, but it is more time-consuming and costly if a 3D analysis is applied. Thus, 2D plane strain analyses are normally adopted in engineering practice to predict the performance of OSF cases. The removal of an entire level of struts in an OSF case not only inadequately meets the demands of real-life cases but also does not fulfill the purpose of sustainable development. For this reason, Pong et al. [9] proposed a method to reduce the axial stiffness of struts by a factor of 1.5 instead of removing a whole level of the horizontal temporary system as designers normally do to fulfill the requirements.
Previous research has revealed some interesting facts about OSF behavior; it overly relies on the interaction processes among neighboring struts and between struts and walls, strut locations, system stiffness, and types of soils. In this study, the impacts of OSF were explored in terms of maximum wall movements, axial strut loads, and load transfers. The concerns of deep excavations in different grounds (sand) and the location of failed struts were also included in the analysis. Finally, possible 3D/2D converting factors were examined and applied to 2D analysis of deep excavation in sand.

2. Materials and Methods

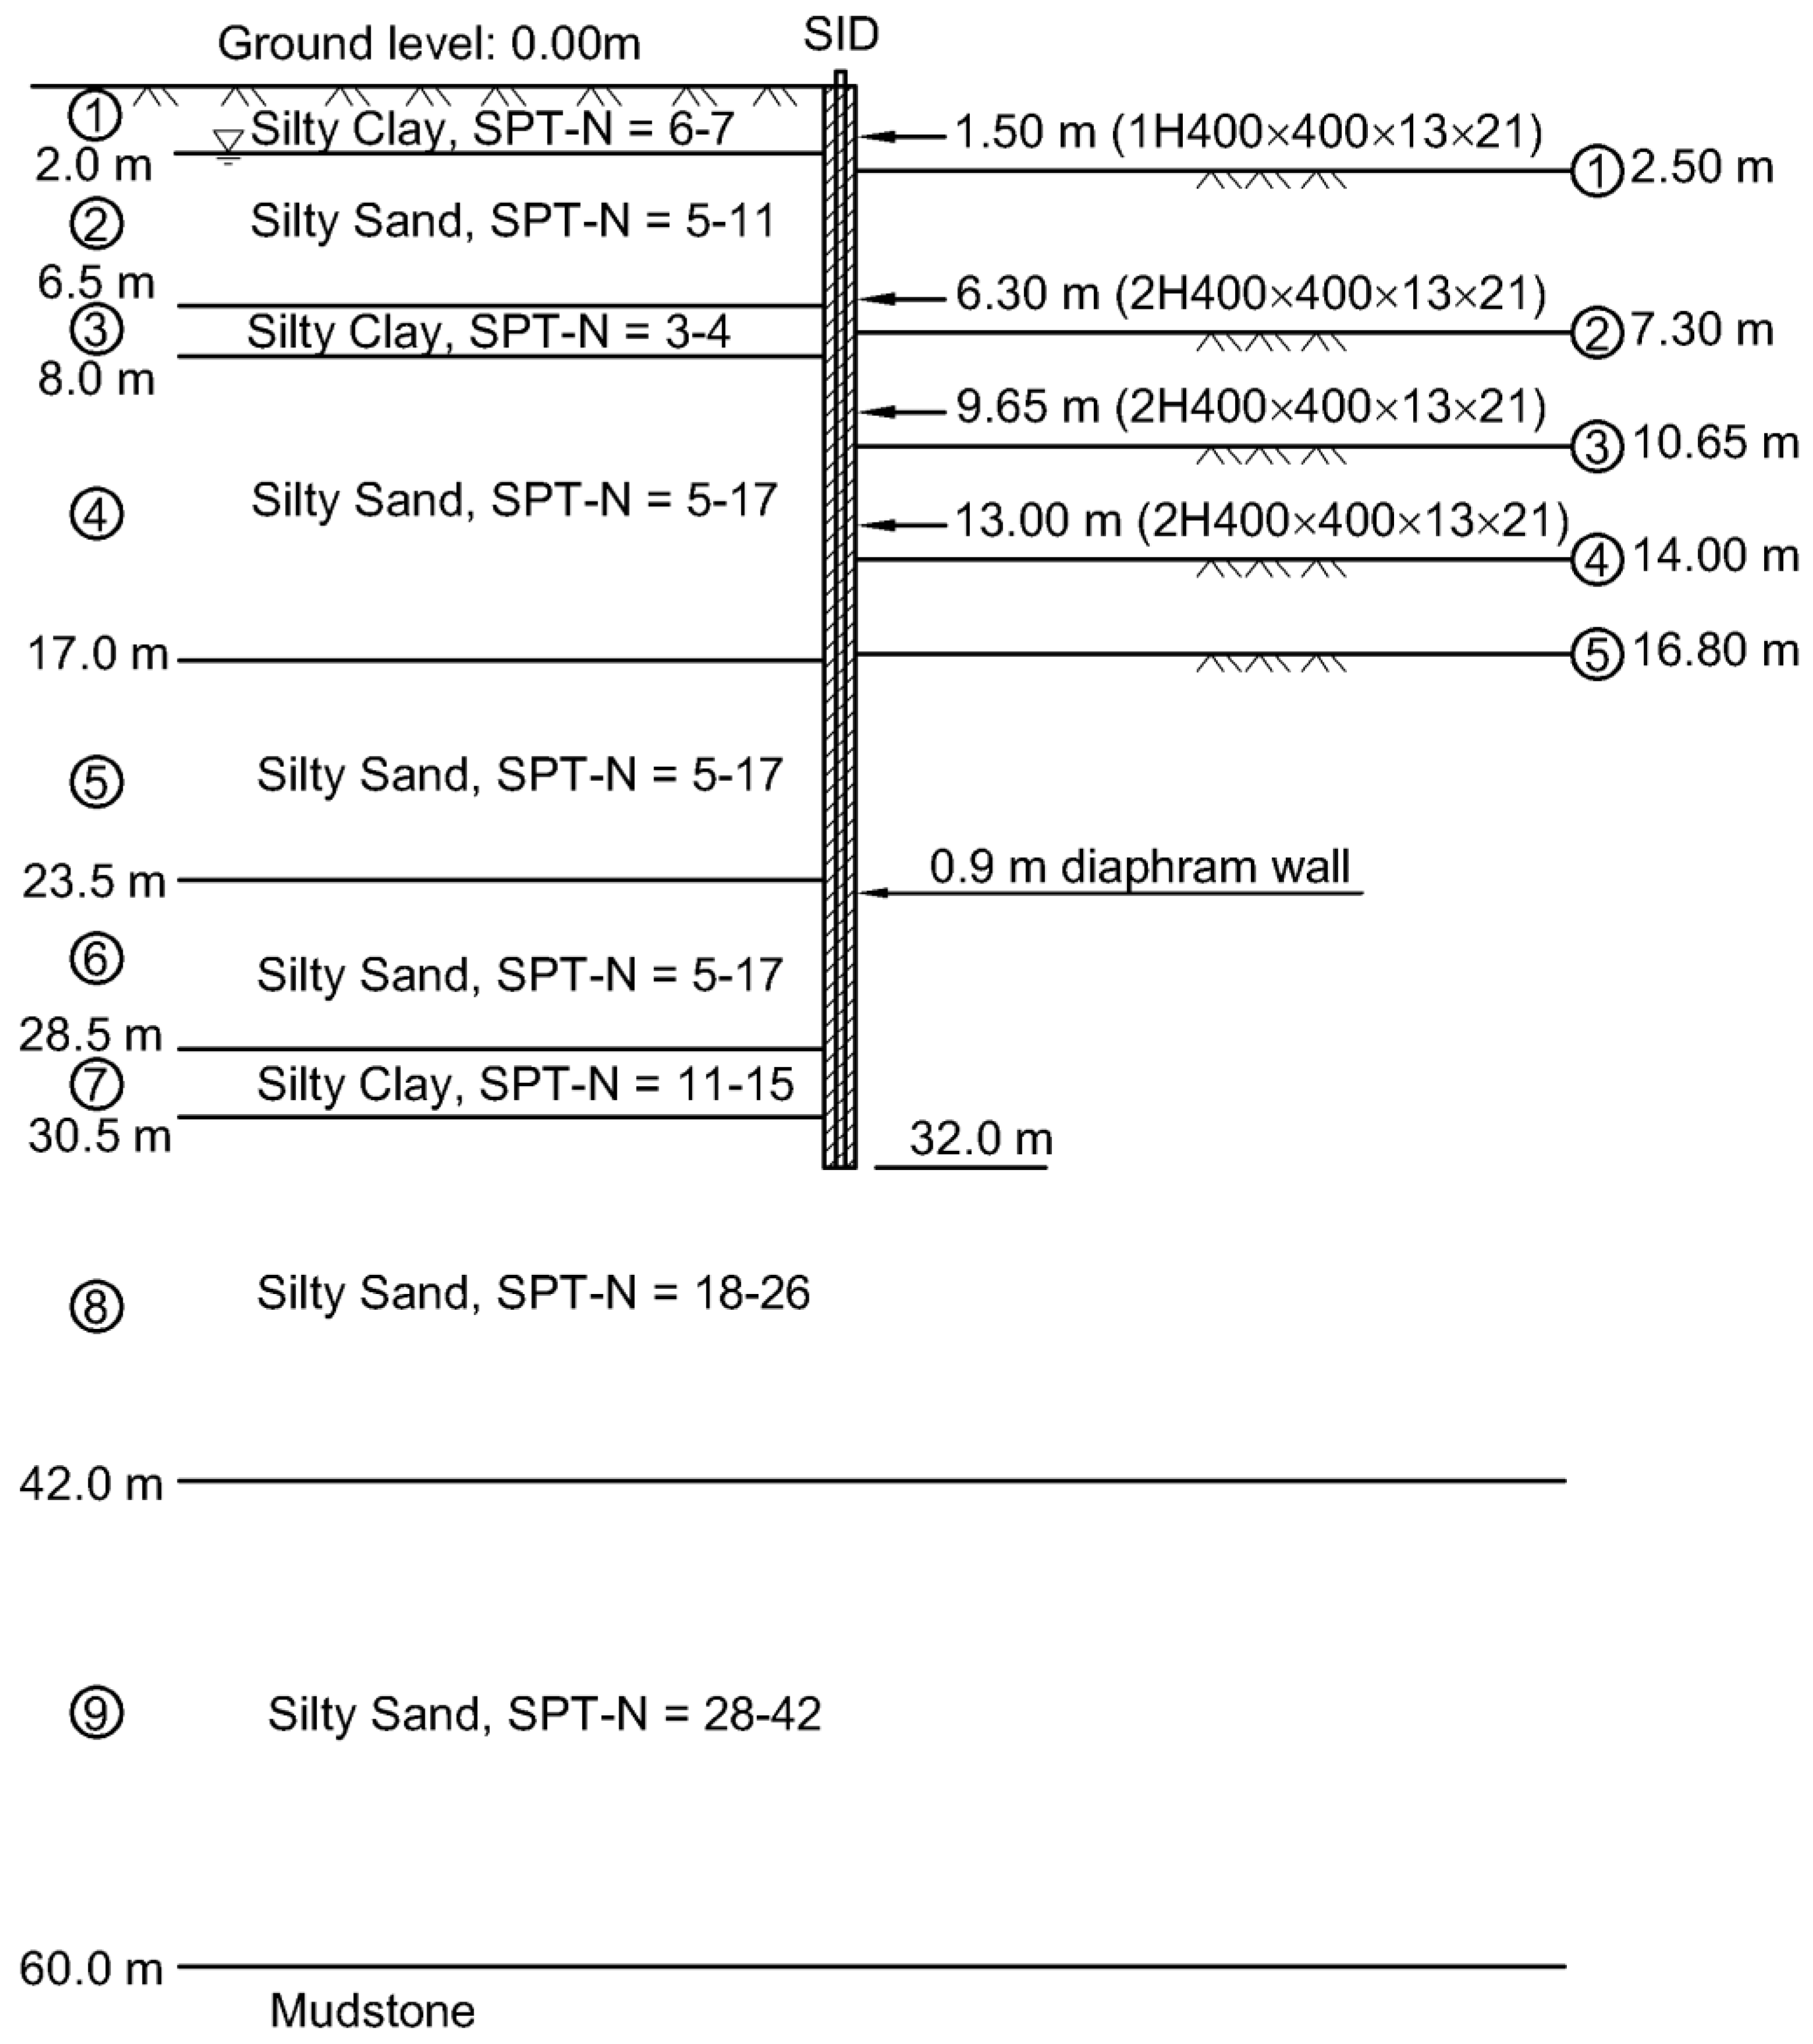
2.1. Project Background

Figure 1 shows the cross section and ground profile of an excavation case selected as the background of the benchmark project of this study. Similar to the previous works by Hsiung et al. [11] and Hsiung [12], a 16.8 m deep pit was retained with a 0.9 m thick and 32 m deep diaphragm wall. The bottom-up method was carried out to construct the excavation through 5 excavation stages. The deep excavation was supported by 4 levels of struts, with Sh = 5.5 m in the longitudinal spacing of each level. The lowest strut level was 13 m below the ground surface. The ground condition included a highly permeable thick layer of sandy soil and three thin clayey layers. Thus, the deep excavation was generally considered to fully rest on loose to medium-dense sand, and the groundwater level was found at 2 m below the surface level. More details of this project’s background can be found in Hsiung et al. [11].

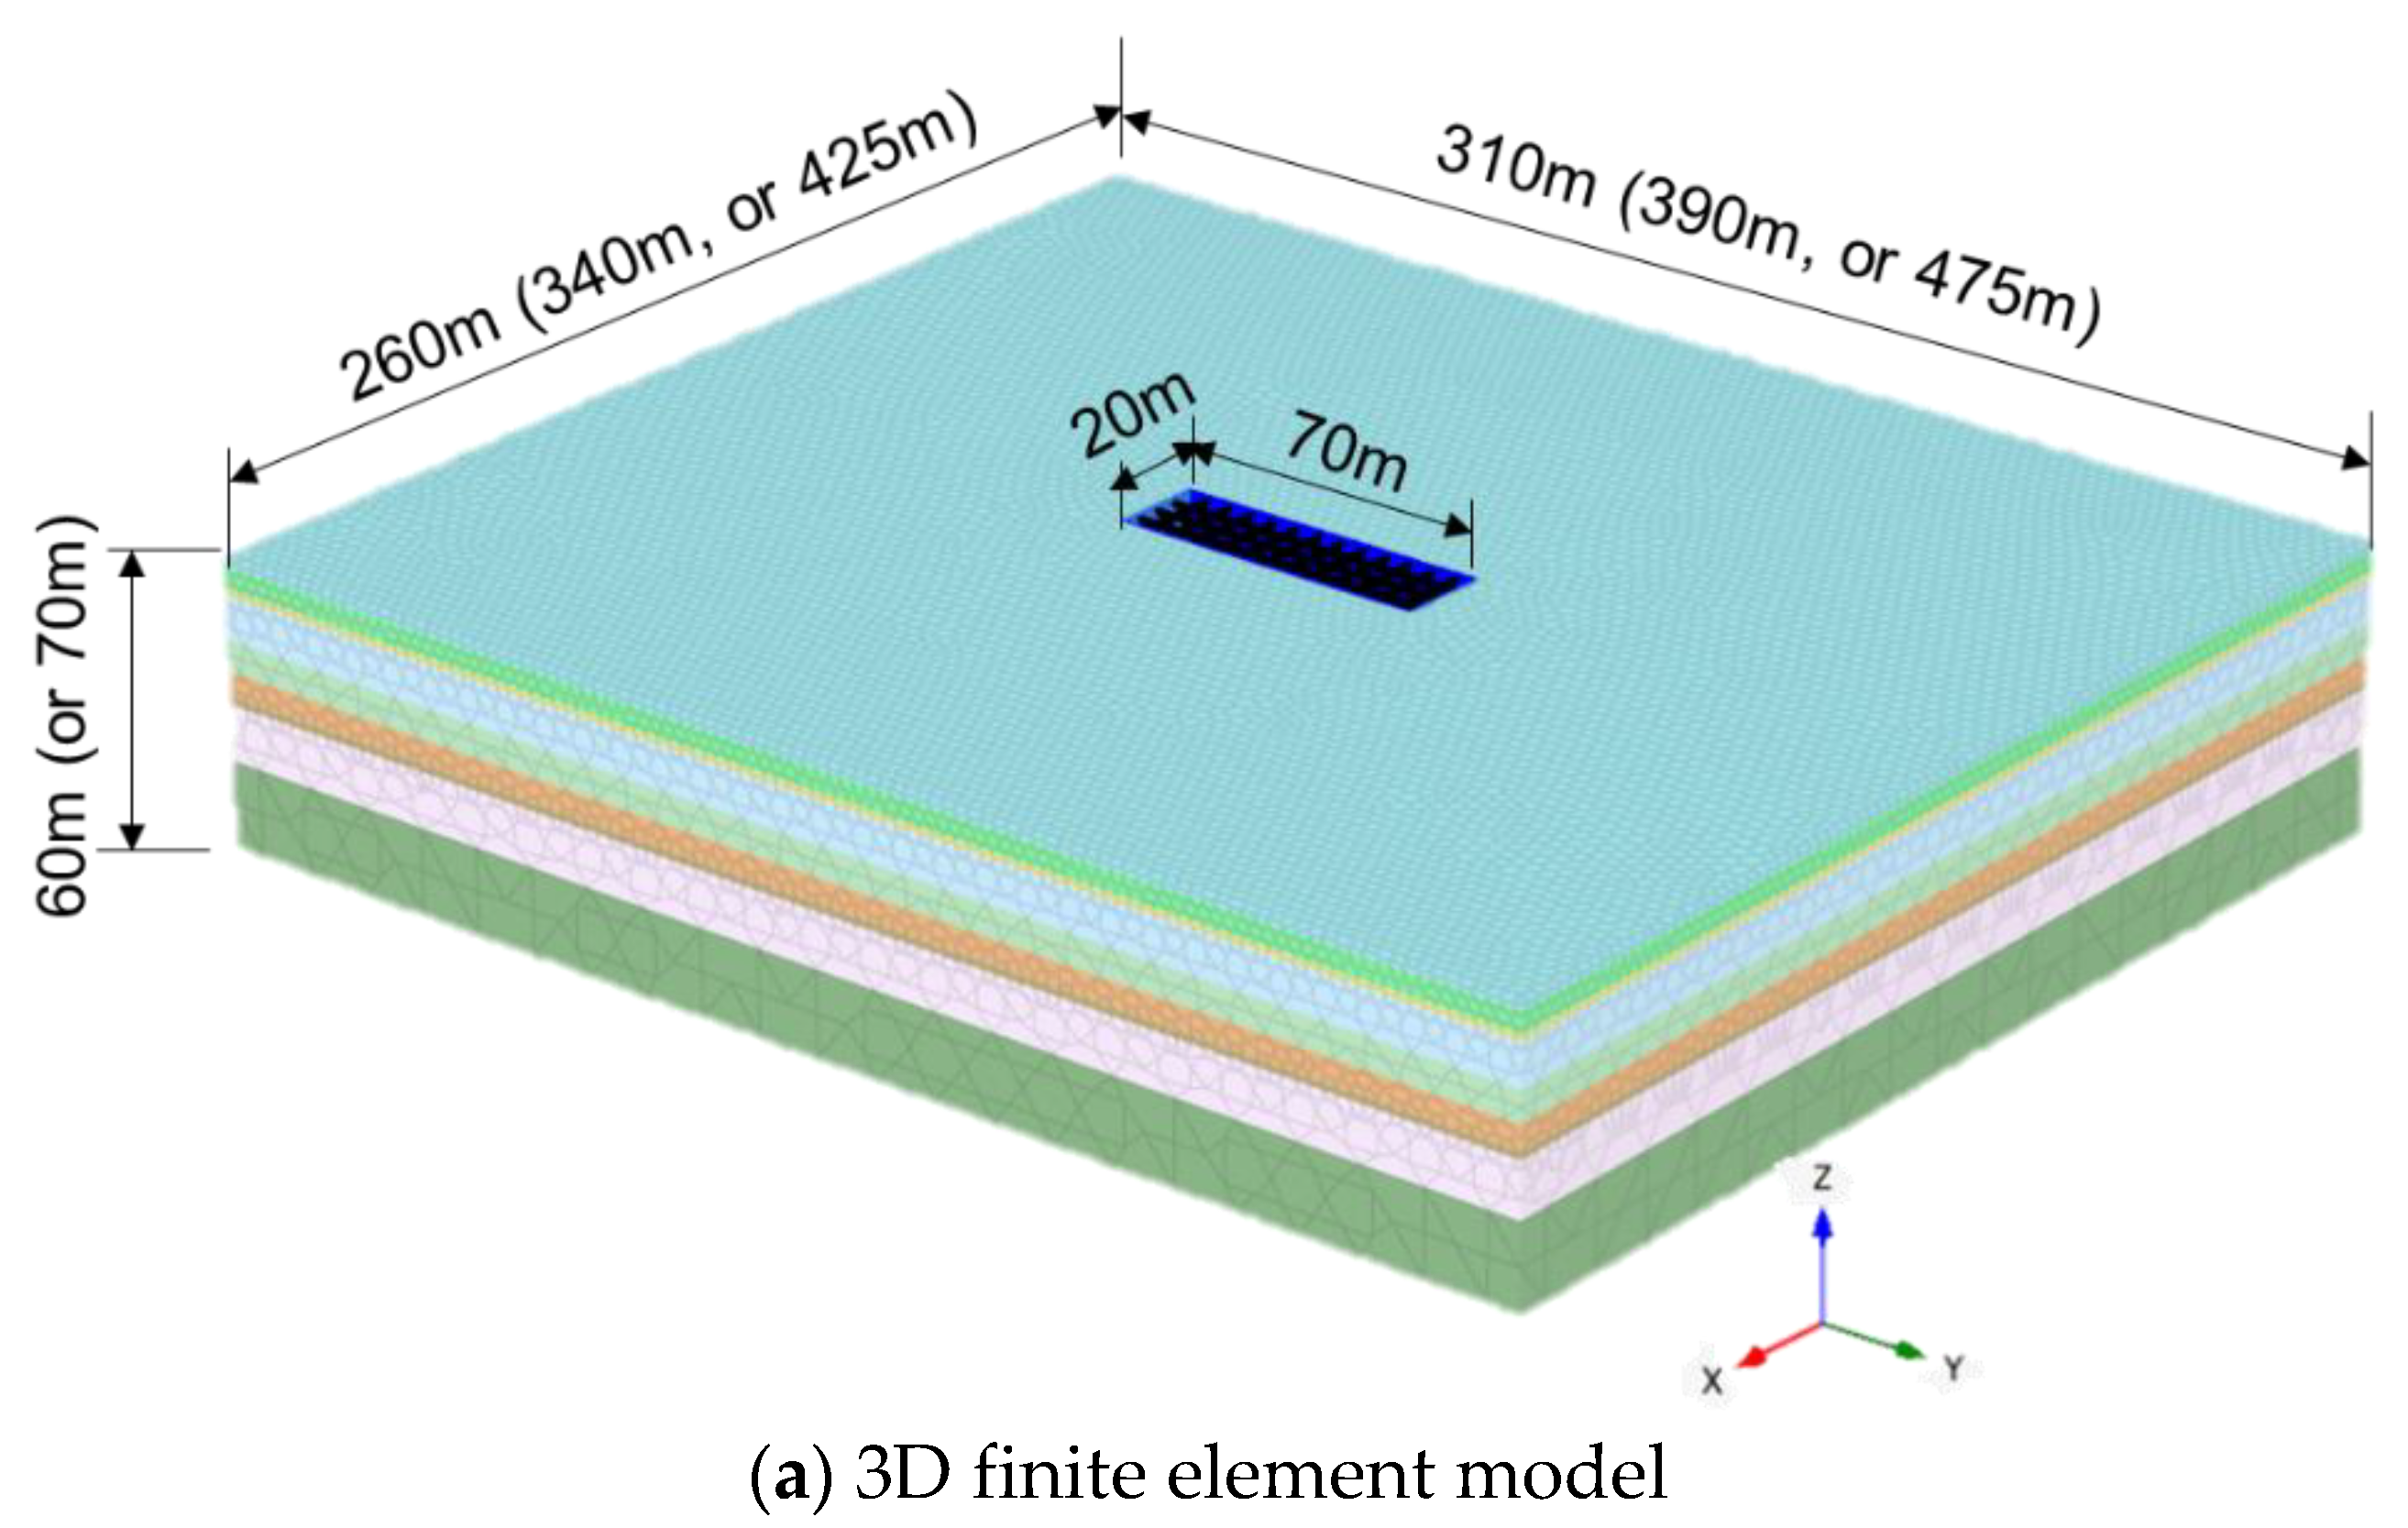
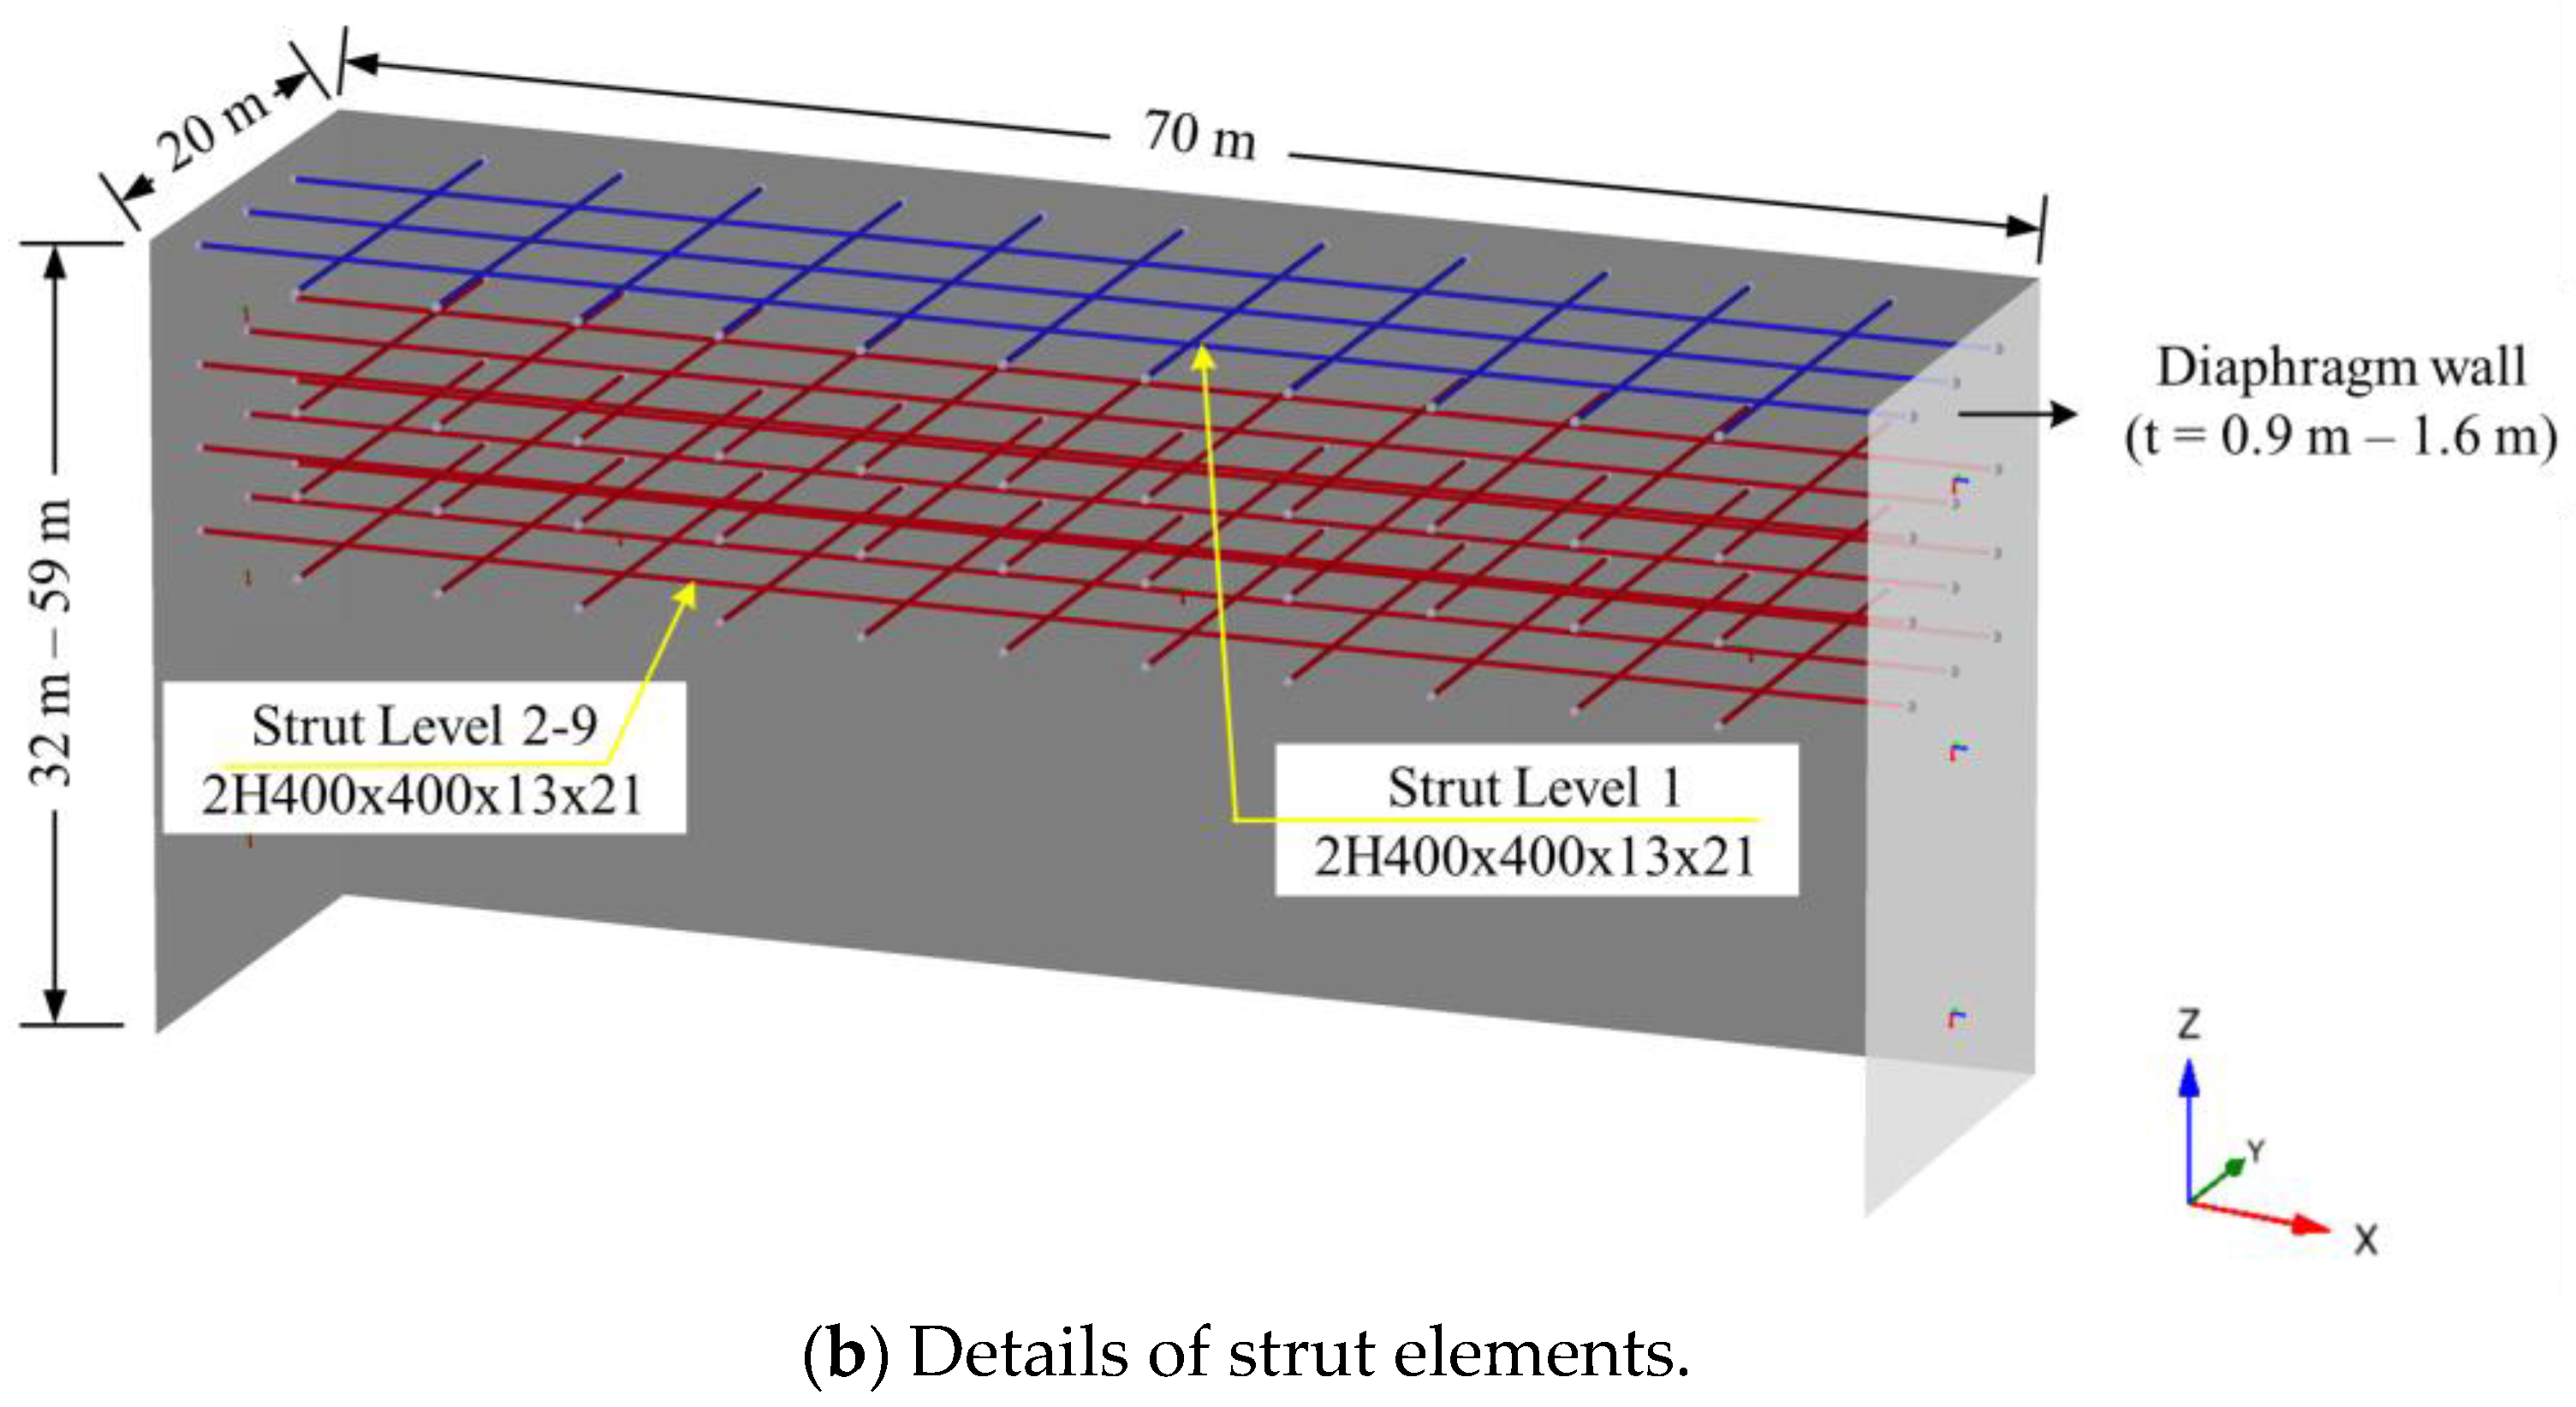
2.2. Proposed Case Studies and Methods

Numerical analyses were undertaken, and the finite element software PLAXIS 3D version 2017 was used to explore the OSF behavior of deep excavations in sand. First of all, the critical case of one-strut failure was modeled using the benchmark case as mentioned above. Second, possible 3D/2D converting factors were explored by considering the impacts of OSF on strut load transfers and distribution of wall deflection. By doing so, 5 other cases were examined by increasing the excavation depth of the benchmark case (i.e., 19.8 m to 30.8 m). In order to keep these excavations stable with the factor of safety against push-in larger than 1.5 (Ou [13]), the embedded wall length and strutting systems were appropriately generated. Hsiung and Phan [14] had already explained how the factor of safety against push-in was interpreted for all the cases demonstrated in this study. The details of each case are presented in Table 1. Furthermore, a comparison was made between the two-dimensional plane strain analysis and the three-dimensional analysis in terms of strut load transfer and wall deflection after the occurrence of one-strut failure in the deep excavations in sand.
To eliminate any impact of excavation activities on the boundary of the 3D model, the distance of the mesh boundary in the X and Y directions was set from 260 to 425 m and from 310 to 475 m, respectively, for different cases (Figure 2). Regarding the boundary in the Z direction, it was set to 60 m below the ground surface level, while the value was extended to 70 m in Case 6 due to the extremely long wall compared to other cases. The type of mesh was “fine” for all analyses. The sizes of the 3D model and the mesh are shown in Figure 2a. The finite element mesh used in the models included an average of 645,833 10-node tetrahedral elements with an average size of 4 m. The structural elements were modeled with a linearly elastic behavior. The steel strut and diaphragm wall were simulated, respectively, using the note-to-node anchor and plate elements. The properties of these structural elements are shown in Figure 2b. Soil responses were defined based on the Mohr–Coulomb (MC) model for clay and advanced soil models for sand, such as the Hardening Soil (HS) model.
The MC model with undrained B analysis was used to model the clay layers because of a lack of test data. In this model, the undrained shear strength Su was directly adopted instead of the effective cohesion c′ and friction ϕ′. The total friction angle ϕ and the dilatancy angle ψ were set to 0. The effective soil stiffness E′ was determined using Equation (1) below, as defined by Brinkgreve et al. [15]. The details of the soil parameter inputs for clayey soil are listed in Table 2a. Due to the very thin layers of clayey soil, the overall behavior of the deep excavations was insignificantly affected by these soil layers.
E = 2 ( 1 + v ) 3 × E u
where Eu is the soil undrained Young’s modulus, which was selected to be equal to 500 Su, and the Poisson’s ratio ν′ was set as 0.3 (Bowles [16], and Khoiri and Ou [17]).
As for the sand layers, a comparatively advanced constitutive soil model, HS, was selected to examine the mechanism of the excavation process in all of these soil layers. The HS model has three additional soil stiffness input parameters, E50ref, Eoedref, and Eurref, instead of E in the MC model. These three parameters must be obtained from the values of E50, Eoed, and Eur. The definitions of E50, Eoed, and Eur and their relationships with E50ref, Eoedref, and Eurref have been explained by Schanz et al. [18], and both Eoedref and Eurref could be directly defined by E50ref with the consideration of the unloading–reloading feature (i.e., Eoedref = E50ref and Eurref = 3E50ref). With regard to E50, it was taken from the Young’s modulus, E, and divided by 1.5, as suggested by Hsiung and Yang [19]. The Young’s modulus, E, of loose to medium-dense sands was interpreted from a linear regression equation (Equation (2)), as suggested by Hsiung et al. [11] and Hsiung and Yang [19]. The details of the HS model’s soil properties used in this study for loose to medium-dense sand are listed in Table 2b. Table 3 lists the structural input parameters used in the study. The plate element and node-to-node anchor element were used to simulate the diaphragm wall and steel strut, respectively. Further details of the definitions and interpretations of soil properties and structural parameters could also be found in Hsiung et al. [11] and Hsiung [12].
E = 1250 ( Z + 9.7 )
where E is the Young’s modulus of sandy soil, in kN/m2, and Z is the depth of the ground, in m.

3. Results and Discussion

3.1. Critical Case of Strut Failure

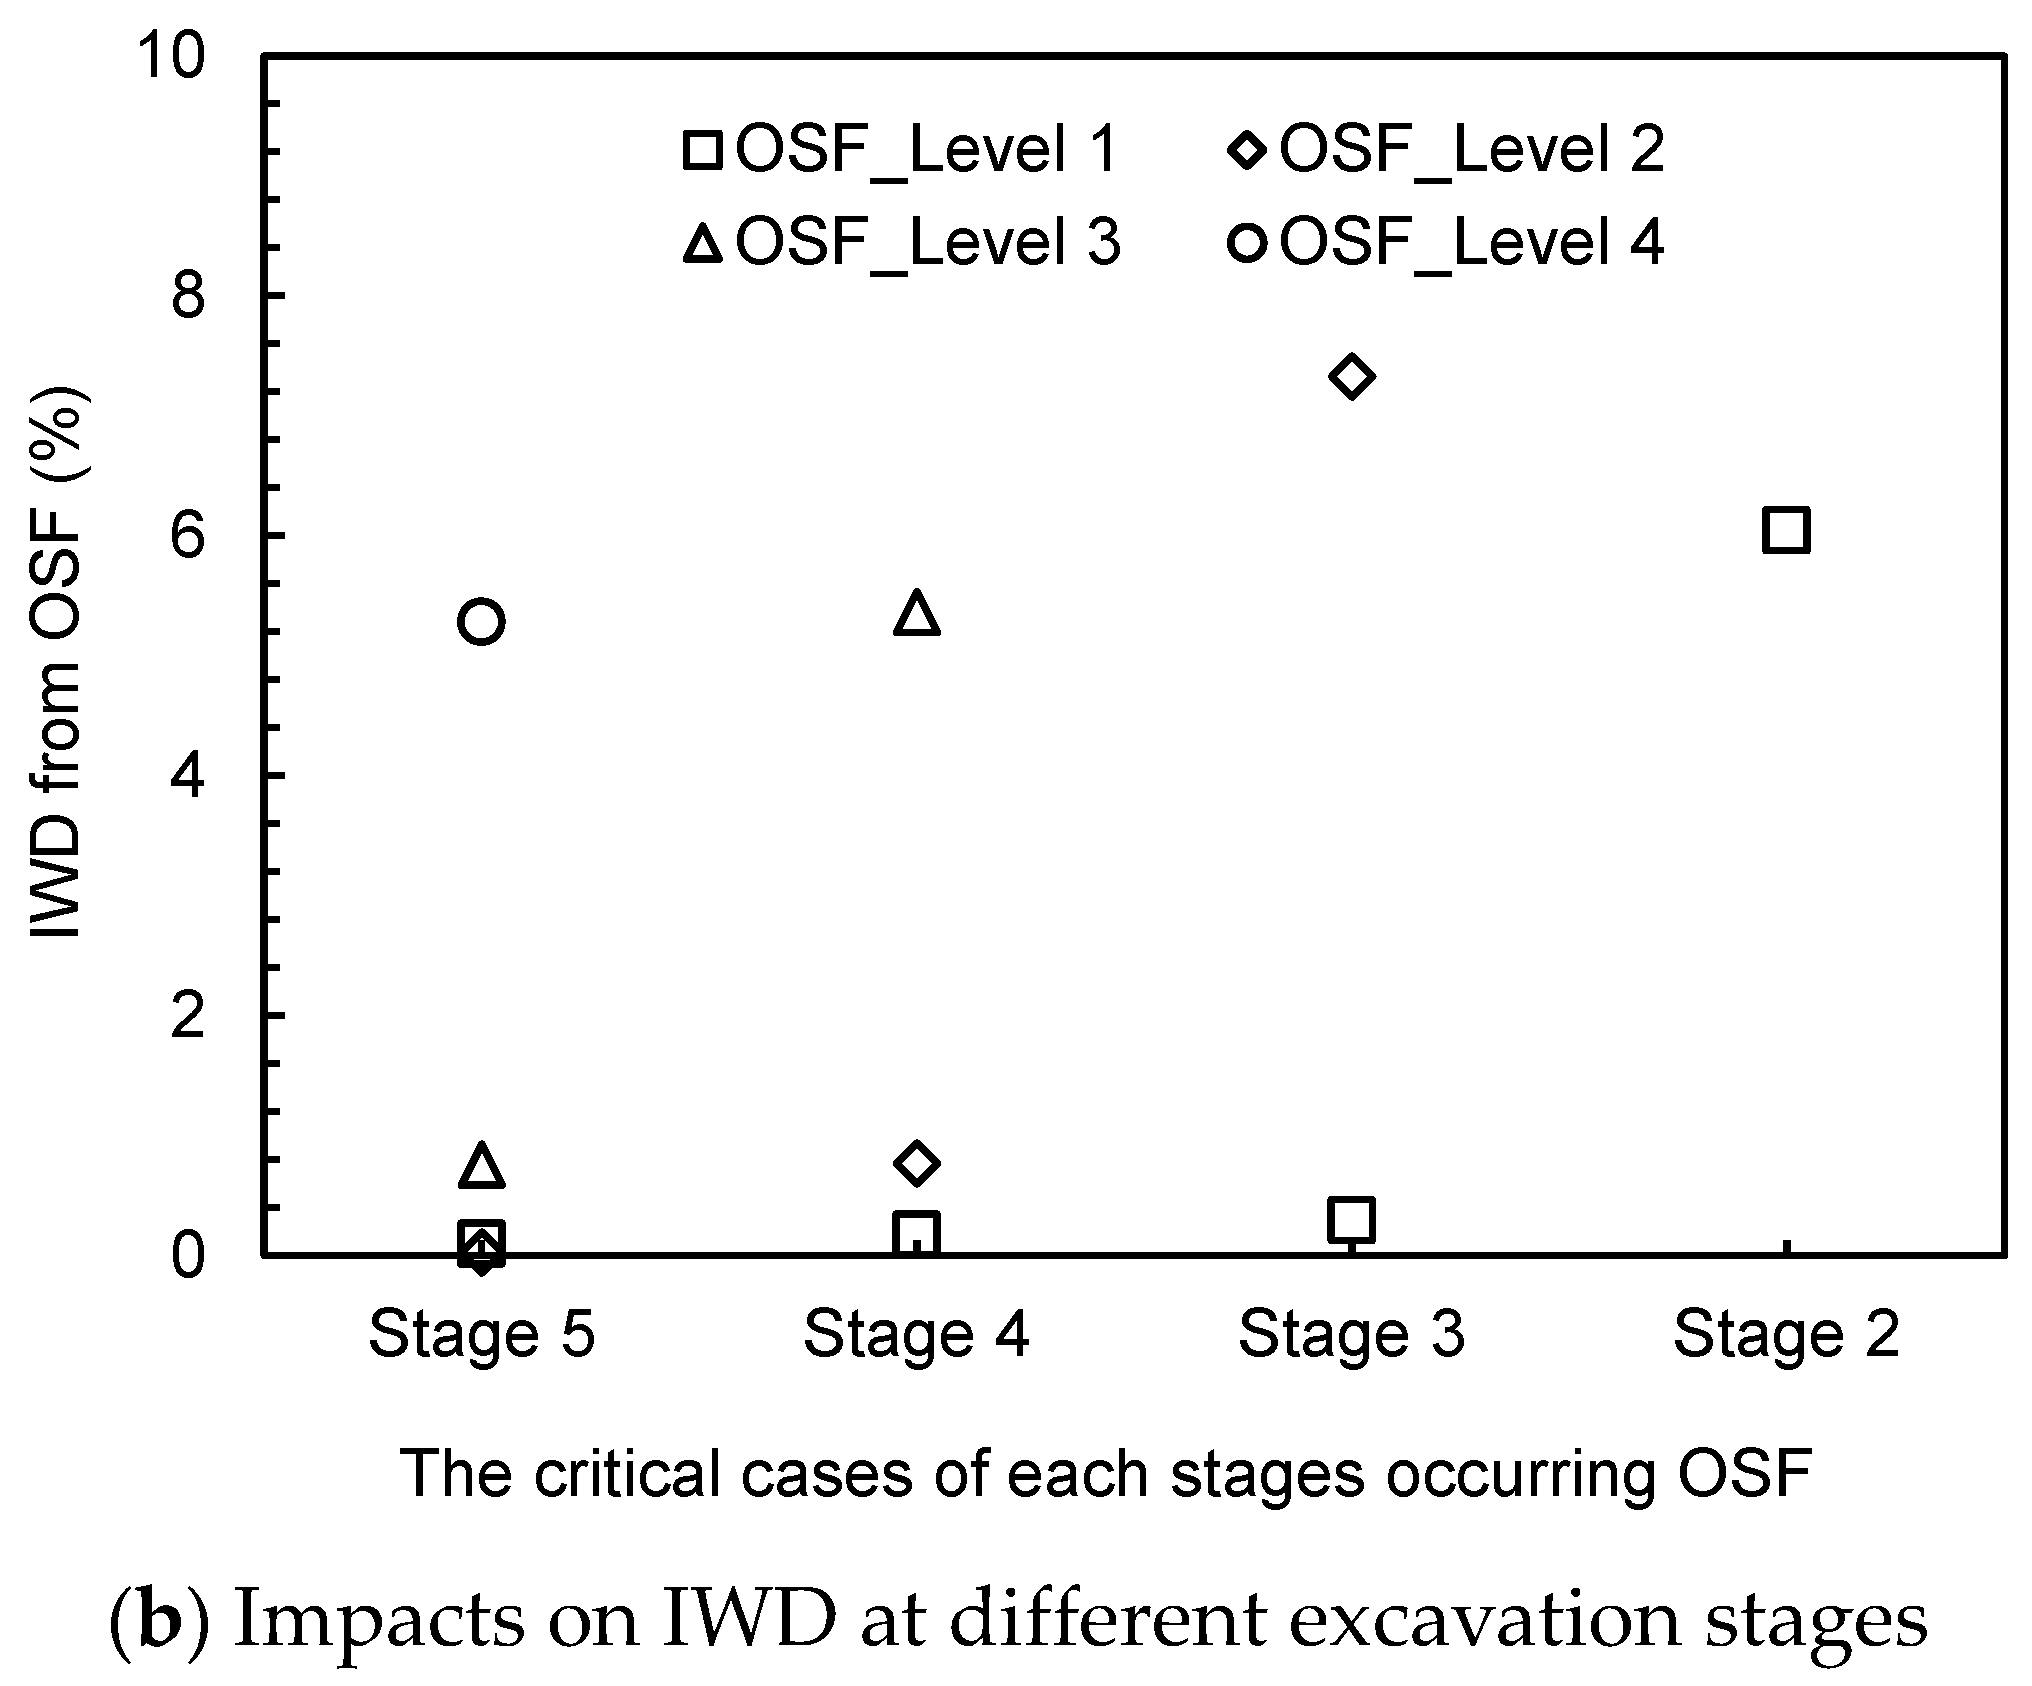
3.1.1. Increment of the Maximum Wall Movement

In order to quantify the impacts of OSF, some indices were considered and designed. First of all, the term “increment of the maximum wall deflection” (IWD) was defined and explored in these cases at their final stage where significant wall deflections had been generated. The IWD was calculated using Equation (3) as follows:
IWD ( % ) = δ O S F δ n o r m a l δ n o r m a l
where δOSF is the maximum wall deflection at the final stage after the occurrence of a single failed strut, and δnormal is the maximum wall deflection at the final stage without any strut failure.
In order to predict the location of strut failure that could lead to the critical situation, the plan views of a failed strut are shown in Figure 3 to present the assumed location of strut failure from the center to the corner of the excavation after completing the final excavation process. The failed strut was removed from the center to the corner of the excavation at each level for each run. Figure 4a depicts the changes in IWD with the position of strut failure at four different levels of struts. It can be clearly seen that the condition having the most significant impact on IWD is the one having the failed strut at Level 4 (the lowest one) located at the center of excavation, which is approximately 5.0% greater than the condition having the failed strut at Level 3. It can also be seen that having the failed strut in Level 1 and Level 2 seems to have an insignificant influence on IWD.
The same approaches were examined at various excavation stages to explore the impacts of OSF. For instance, OSF was initially set up to occur at Level 4 right after completing its final excavation stage (stage 5). As for stage 4 of excavation (excavation to 14 m below the surface level), the strut failure was set up to occur at Level 3 before the installation of Level 4 struts. Similarly, OSF at Level 2 and OSF at Level 1 were set up before installing Level 3 and Level 2 struts for stage 3 and stage 2 excavations, respectively. Figure 4b shows the changes in IWD through the different schemes of strut removal at each stage. In terms of results, the most significant change in IWD is always achieved once an existing lowest strut level is removed. In fact, the difference in terms of percentages of IWD for various excavation stages is in a range from 5 to 7%.
Further analyses were, thus, carried out, with the results shown in Figure 4. First, as the wall at the central part of the excavation has limited impact on the restraints of the corner, the displacement over there is anticipated to be the largest, and there is no doubt that the removal of a single strut at the center of the excavation leads to the most significant change in IWD. Second, the main function of the lateral supports is to provide sufficient resistance to the lateral earth pressure behind the wall, and that pressure is expected to increase in proportion to the ground depth. Thus, the removal of one single strut at the deepest level should contribute the most significant impact. Combining the results from the analyses above, it is thus concluded that OSF at the center of the lowest level of struts is the most critical case with respect to the maximum lateral wall displacement.

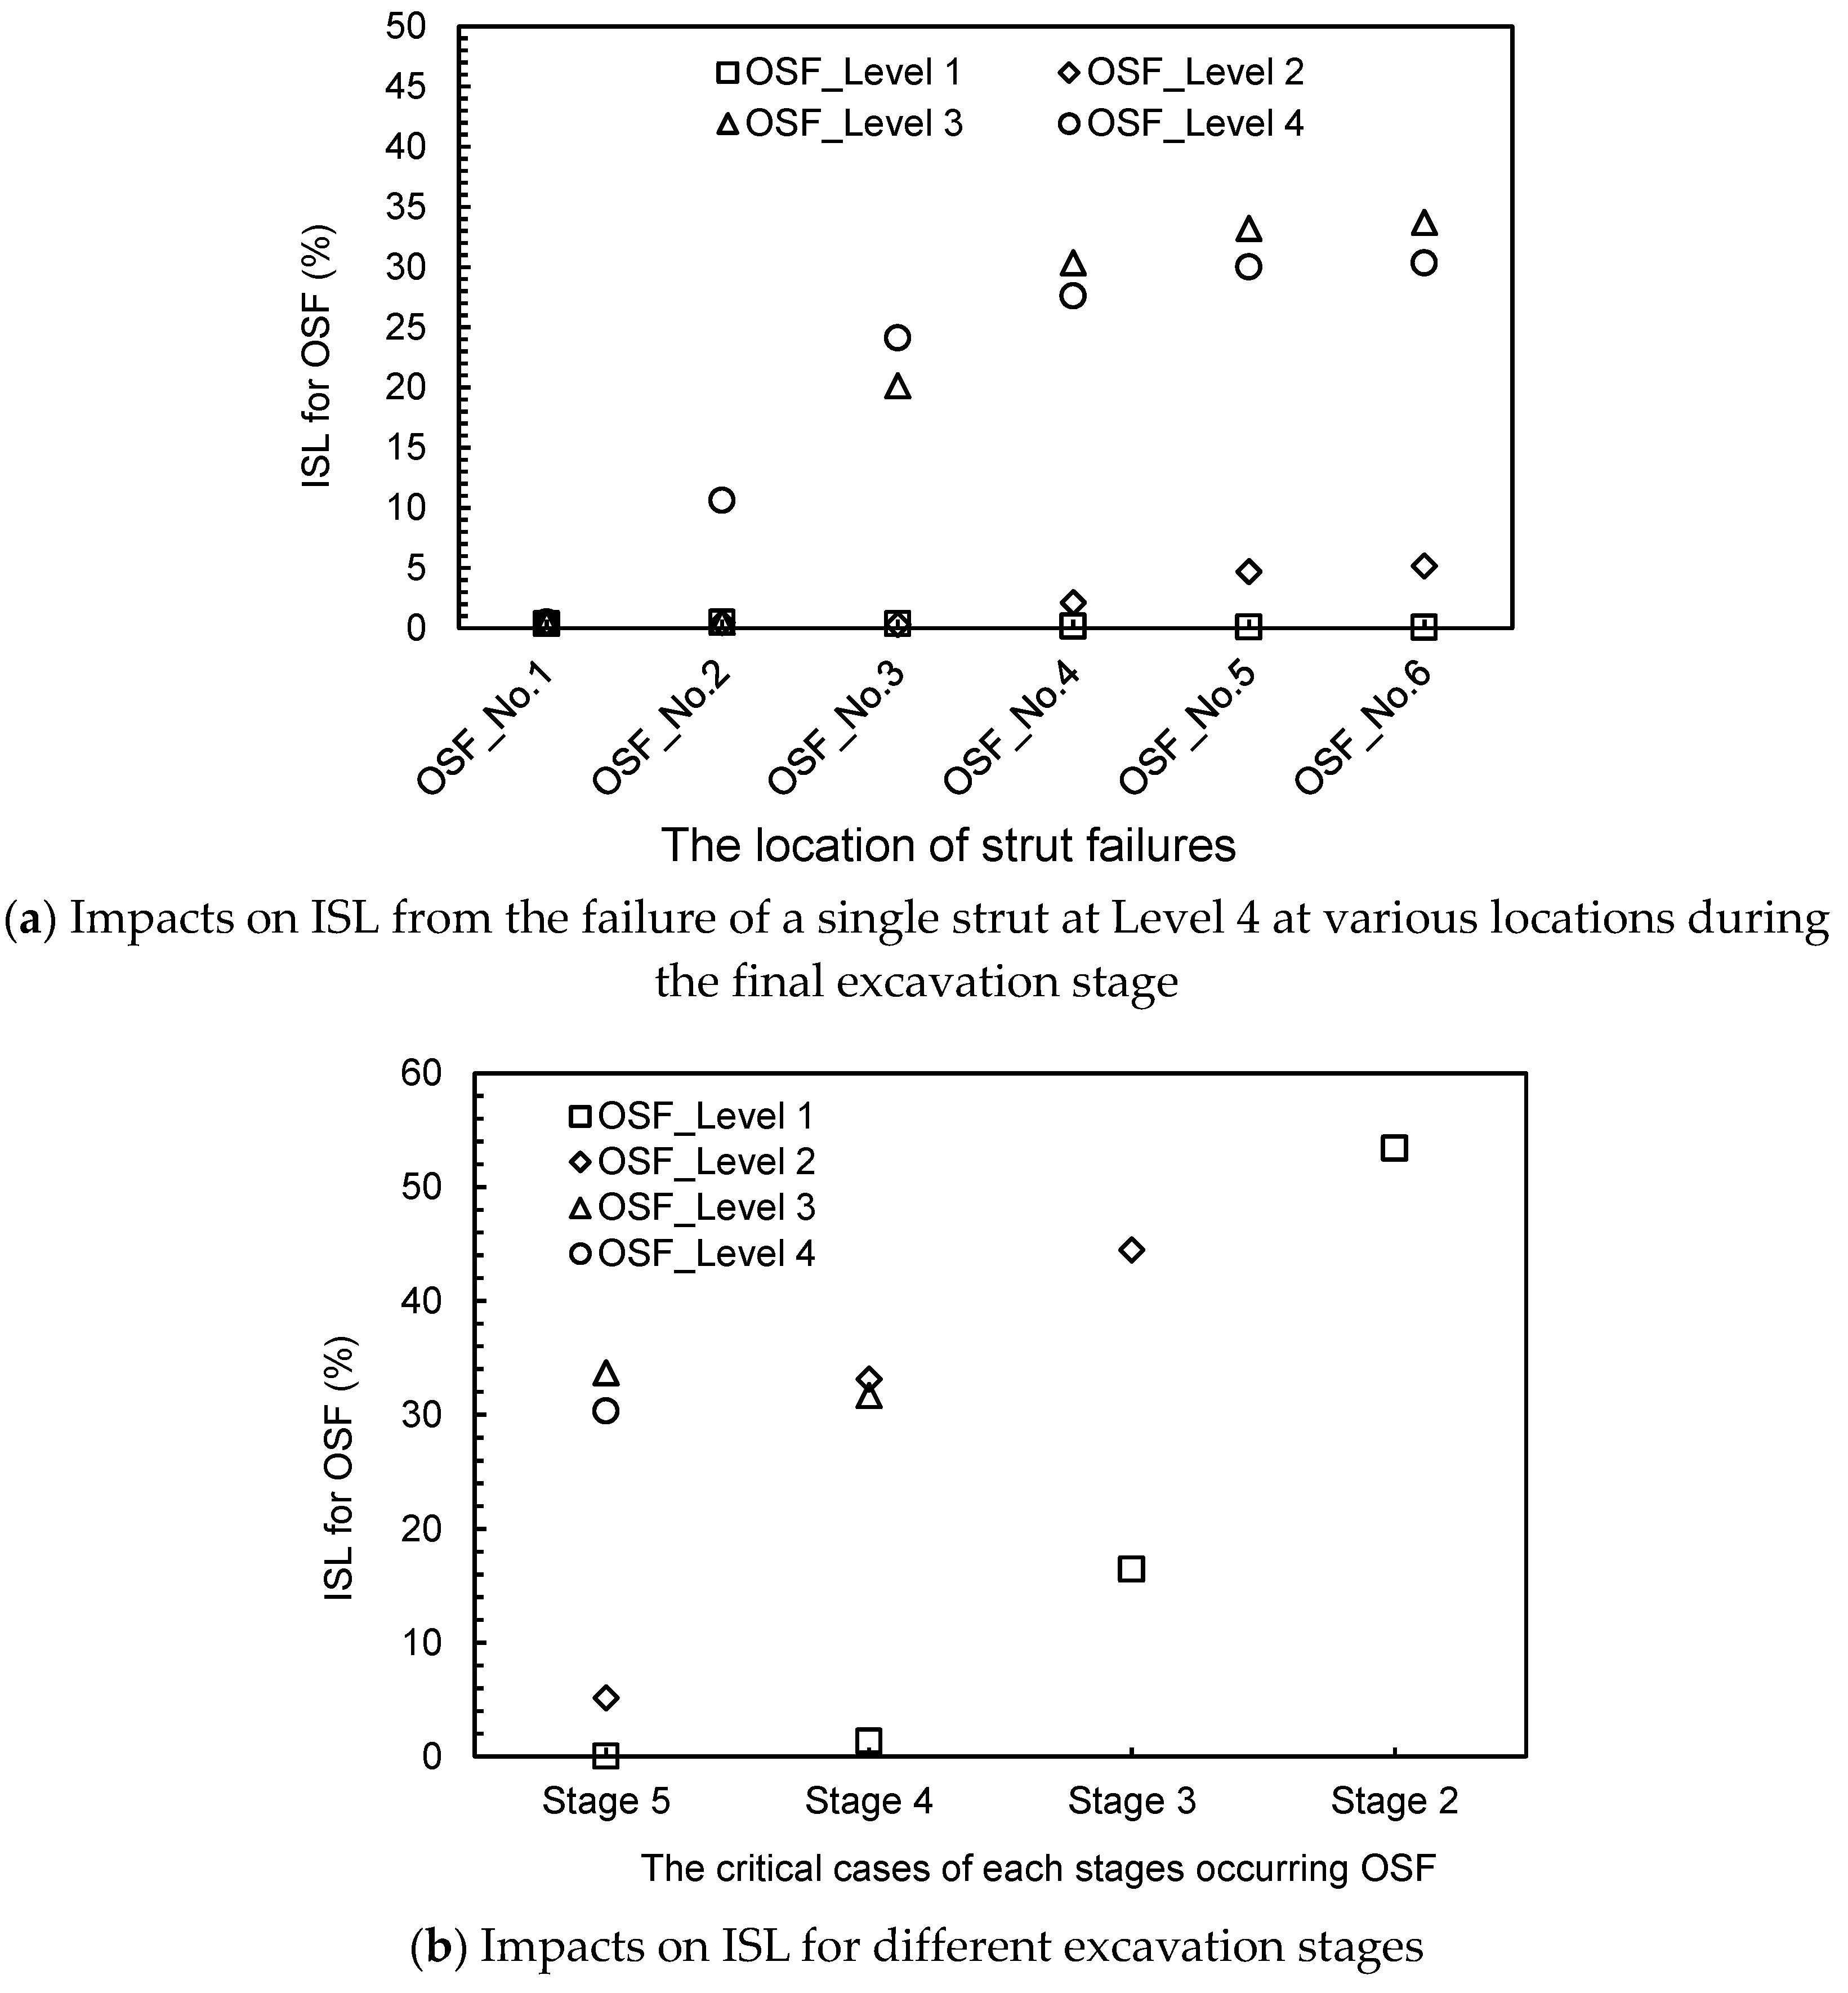
3.1.2. Increment in Axial Strut Loads

Aside from the maximum wall displacement, the axial loads on individual struts are also a key issue in the analyses of a deep excavation. It has been suggested that an increment in the axial loads on individual struts caused by OSF heavily relies on the ground profile and the type of excavation structures (Goh et al. [6]). In fact, each strut was measured in this study, wherein there was an OSF at various locations from the center to the corner of the excavation as well as different elevations of strut level. The term “increment of the maximum axial strut load” (ISL) was used to capture the critical strut failure in these previous cases similar to wall deflection. The calculation of ISL is based on Equation (4) below:
ISL ( % ) = N O S F N n o r m a l N n o r m a l
where NOSF is the maximum axial strut load after the occurrence of one failed strut, and Nnormal is the maximum axial strut load at the final stage without any strut failure.
Similar to the benchmark analyses presented in Section 3.1.1, Figure 5a illustrates the ISL associated with a failed strut at various locations during the final excavation stage. The tendency of the ISL to increase from the corner to the center of the excavation corresponds with the removal of one strut at various locations (No. 1 to No. 6; see Figure 3). The greatest ISL is attributed to a failed strut located at the center of the excavation, such as strut No. 6 when the strut failure occurs at Level 2, Level 3, and Level 4. Meanwhile, there is no change in ISL for the Level 1 strut. More importantly, the most significant effects from the removal of a single strut are related to Level 3 and Level 4, with over 30% of ISL at the location of strut failure near the center of the excavation. Yet, the OSF of shallower-level struts, such as Level 1 and Level 2, have a limited impact on ISL.
A similar approach to the evaluation of IWD to check the critical case or elevation of strut failure was investigated to discover the ISL after having OSF. Figure 5b shows the ISL related to various stages of excavation at four strut levels. In terms of results, the case of removing one strut at the lowest strut level and the case of removing one strut at one level above seem to have similar ISL and can be recognized as the most critical cases in both stages 5 and 4. Meanwhile, an OSF occurring at the lowest strut level in stage 3 is the most critical. It is thus concluded that the removal of one single strut at the center of the excavation should be the most critical case for various locations of the strut with respect to strut load. Moreover, from the viewpoint of the depth of strut, both the removal of the lowest strut and the removal of the strut above might have a chance to become the most critical one. However, it is also observed that the removal of a single strut could lead to significantly more severe impacts on strut load than the maximum wall displacement; thus, it is recommended that the load transfer of a strut should be a key concern in later study regarding excavations with a risk of OSF.

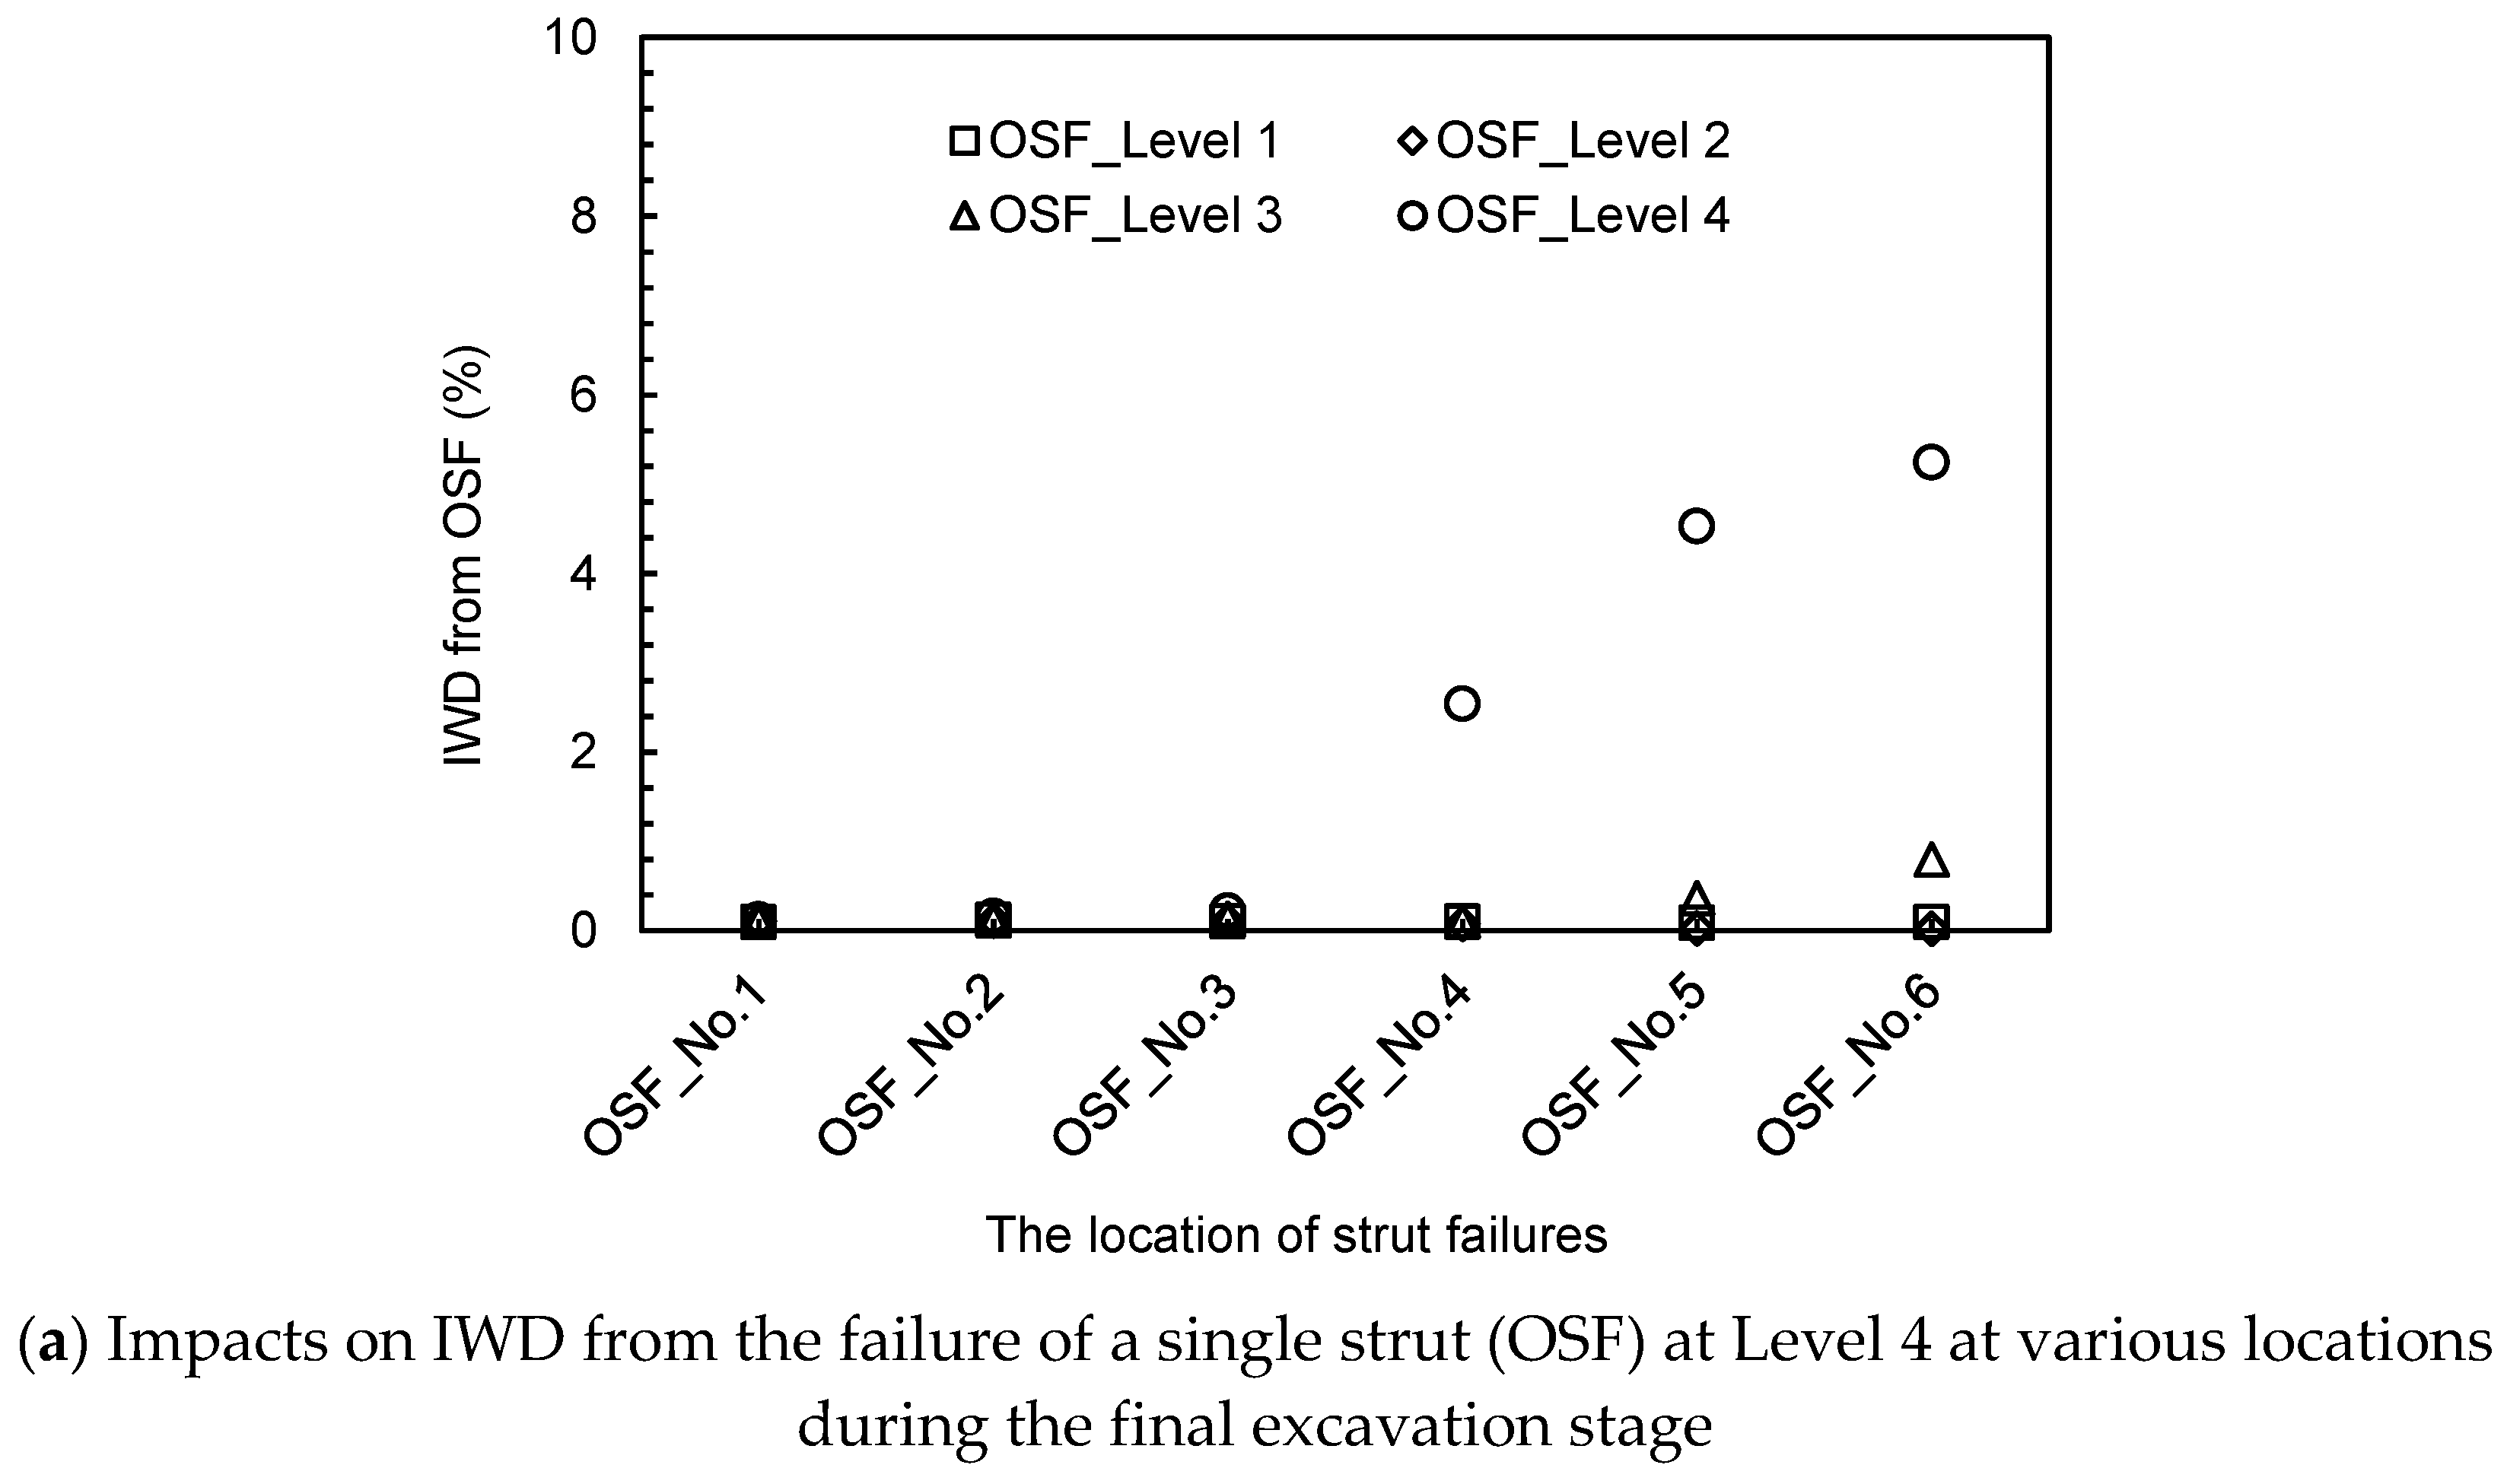
3.2. Influence of OSF on Load Transfers

Previous similar works were first reviewed, and Goh et al. [6] mentioned that load transfer from a failed strut to other struts is a key issue that has to be considered. Therefore, the load transfer factor (LT) was calculated using Equation (5) (Goh et al. [6]) as follows:
LT ( % ) = N p o s t N p r e N f a i l
where Npre is the load on a strut before having OSF with the remaining struts not failing; Npost is the load on the strut after having OSF with the remaining struts not failing; and Nfail is the load on a specific failed single strut before it fails. The aim of calculating the LT is mainly to understand how much load might be transferred from a failed strut to the rest of the struts once the excavation has an OSF. The load transferring is simply separated into two parts: (i) the failed strut transfers its load to its horizontal neighbors and (ii) the failed strut transfers its load to the vertical neighbors above it. It should be noticed that negative values of load transfers are excluded due to their insignificant effects on load transfers.
Figure 6 shows the LT to horizontal strut neighbors based on the distance between the failed strut and the struts which have to share its load, and closer neighbors of the failed strut receive a larger load, with up to 30% of the load of the failed strut before it fails. Regarding load transfer in the vertical direction, it is observed from the benchmark analyses that the load is mainly transferred to the strut above the failed strut. Figure 7 shows the changes in LT at various levels of struts for different excavation depths once the excavation has an OSF. As shown in the figure, the maximum LT is always found at the level above the lowest strut level in each case, and the maximum LT is in the range of 30 to 40% for struts installed at different depths. It could be observed that up to 30 to 40% of the load of the failed strut is transferred to the strut above it. LT gradually reduces as the distance between the other level of struts and the failed strut increases, which means less impact from the failed strut is anticipated.
It is anticipated that a single strut failure always causes its neighbors to bear additional load since the failed strut is no longer existent. Therefore, the influence zone of the failed strut in terms of load transferring to other struts was defined and explored in this study. The so-called “influence zone” was defined as being associated with the closest location where it could reach 0% of LT. As shown in Figure 6 and Figure 7, the influence range of load transferring due to an OSF is 11 m on each side in the horizontal direction, but it ranges from 6.7 to 12 m above the failed strut in the vertical direction depending on the excavation depth where the failed strut is located.

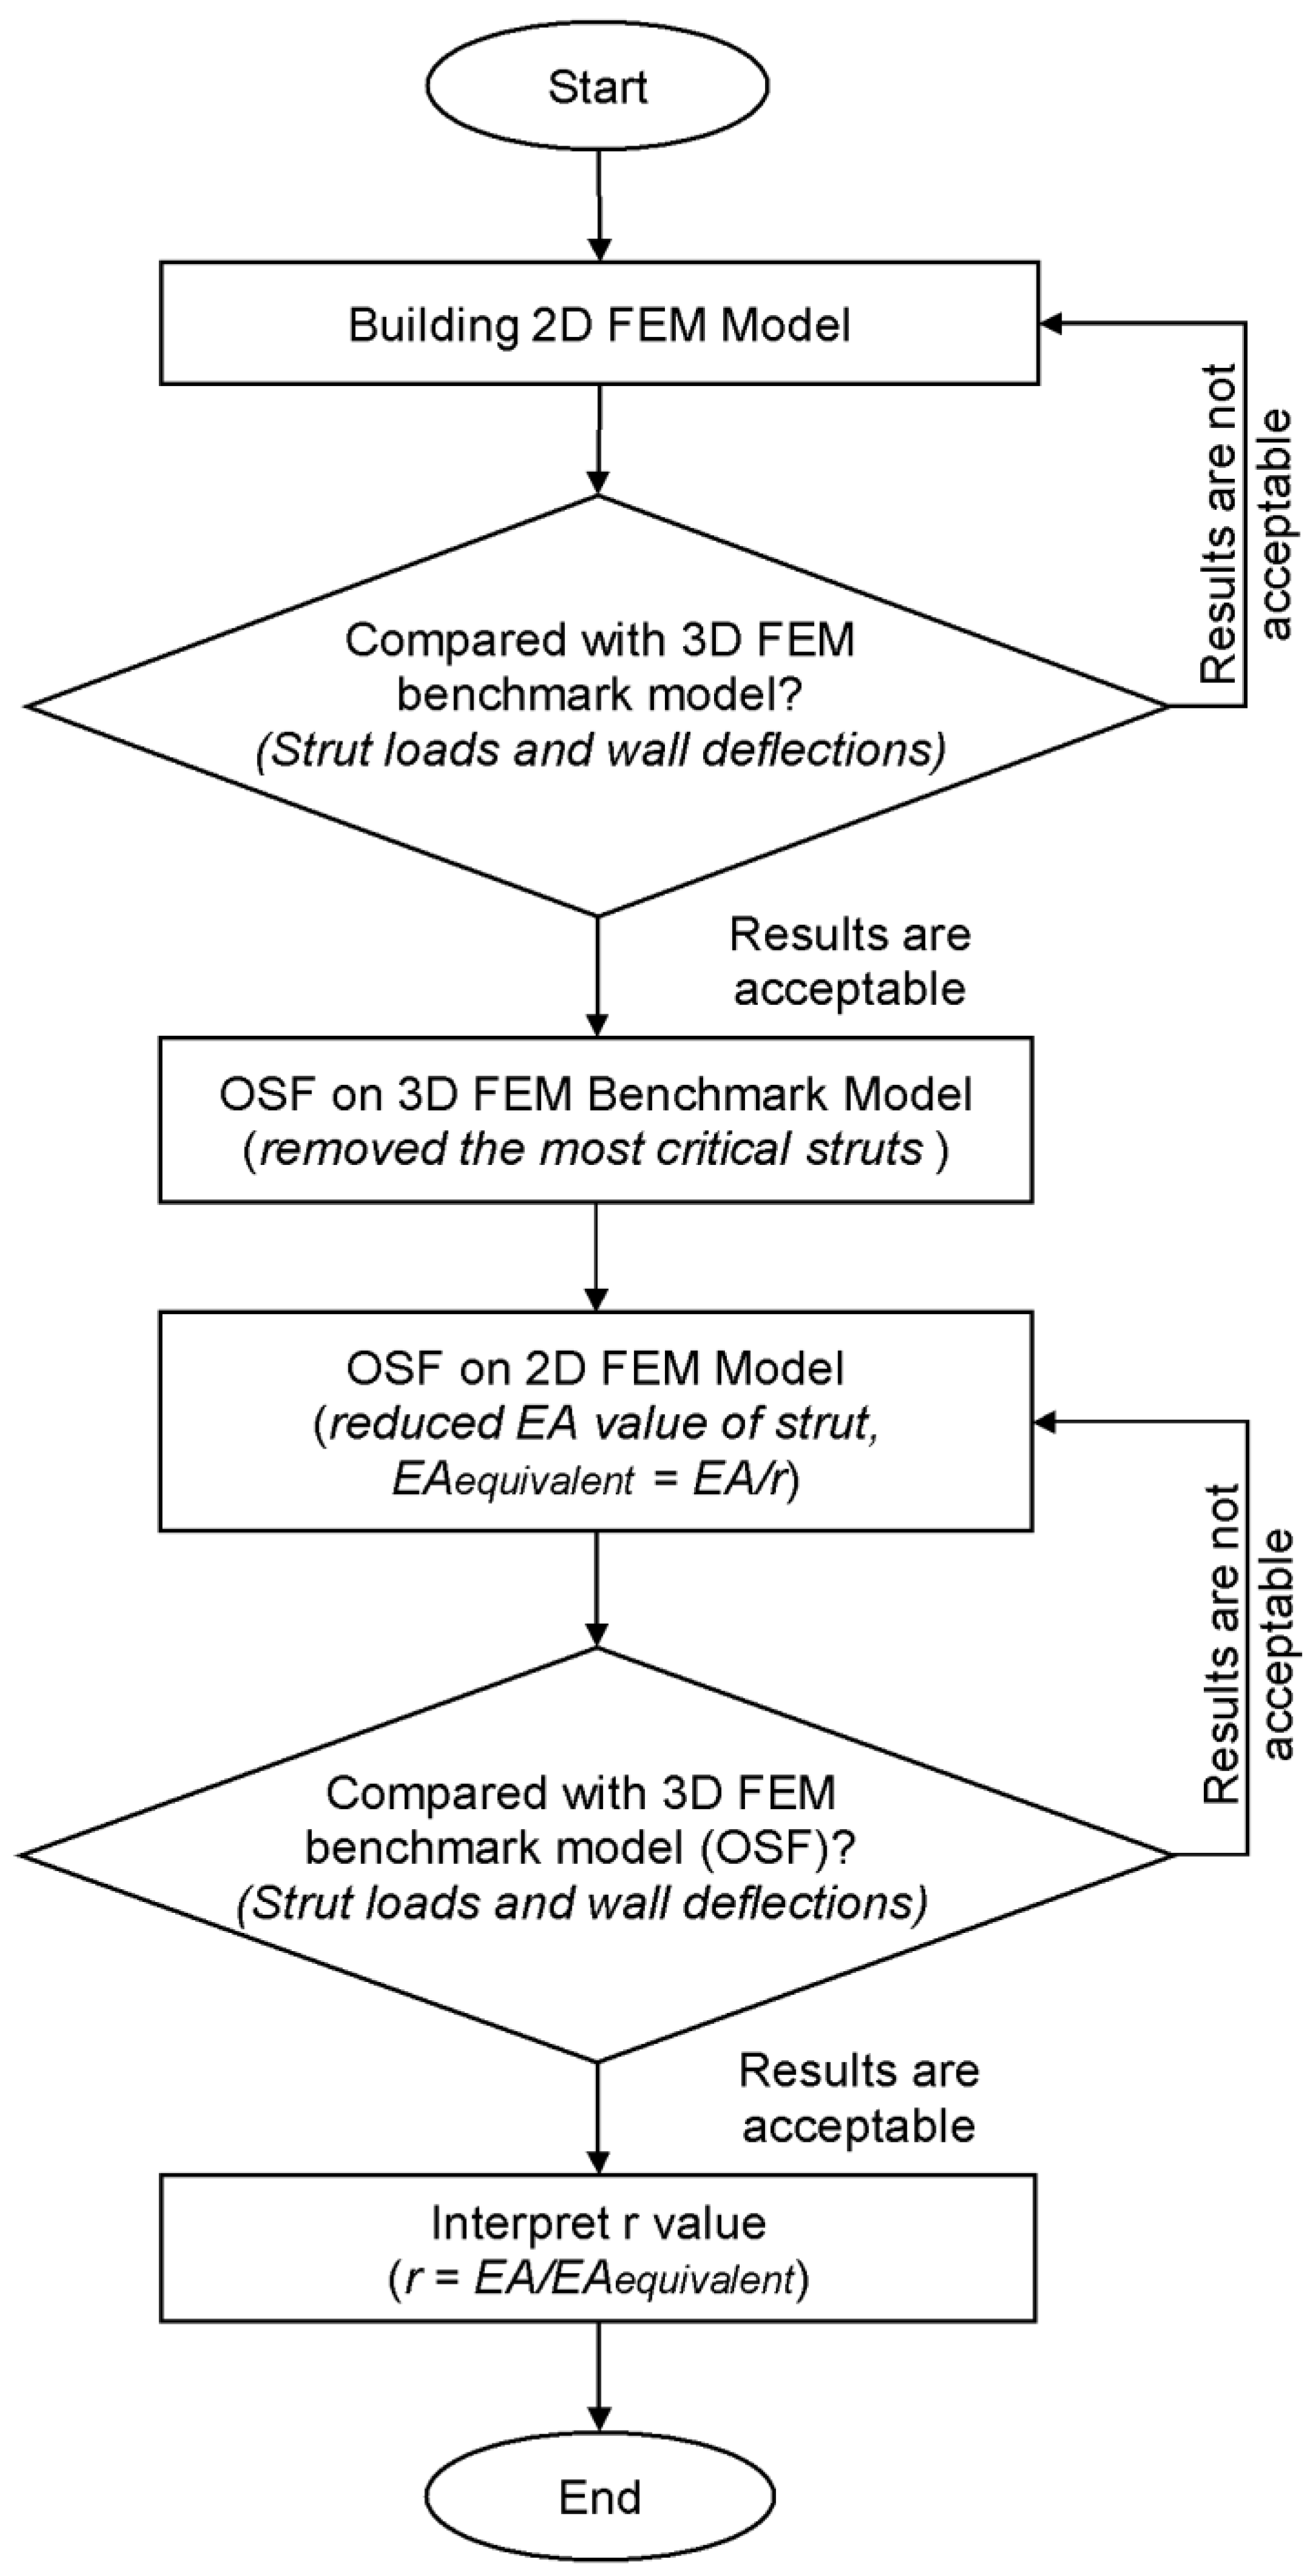
3.3. Conversion from 3D to 2D Analyses

3.3.1. Reduction Factor

In order to obtain a reasonable simulation of OSF, Pong et al. [9] proposed a simplified method using both the 2D geotechnical software PLAXIS 2D and the 3D structural software STAAD for analyses and made assumption for the OSF case using 3D structural analyses. It was found that the reduction factor of axial stiffness after removing the failed strut, instead of removing an entire strut level, was equal to 1.5 for the OSF case if 2D modeling was applied. However, many factors should be taken into account once the reduction factor of axial stiffness is obtained, such as ground profile (Goh et al. [6]). For this reason, different ground profiles, including sandy soil, various excavation depths, and strutting system, were adopted in this study to further explore the conversion of this factor for OSF.
The critical strut failure was examined by considering either the IWD or ISL, which was the case having the most significant impacts on additional displacements or strut loads. In engineering practice, it is common that only a 2D analytical tool is available for use, which is not possible to precisely detect the potential influences of OSF; thus, a rational conversion factor was explored and discussed herein. First of all, a conversion factor was determined in order to explore what the maximum wall displacement should be once an excavation in sand has an OSF. Based on the IWD evaluation, a failed strut that locates at the lowest level at the center of the excavation is the most critical OSF case, and it is taken into account as the basis for defining the equivalent axial stiffness of strut, which is essential as an input in 2D analyses.
As mentioned previously, 3D analyses are only occasionally applied in engineering practice due to limits in budget and time, so 2D analyses are generally undertaken instead. Considering the suggestions made by Goh et al. [6], a ratio conversion via reducing the axial stiffness of strut was explored and discussed in order to obtain acceptable wall displacement and strut load caused by OSF using 2D analyses. Therefore, a reduction factor, r, is presented, so an equivalent EA (EAequivalent) used in 2D analyses for representing OSF is determined based on Equation (6):
E A e q u i v a l e n t = E A r
in which EA is the “real” axial stiffness adopted for 3D analyses.
To better demonstrate how 2D/3D conversion was carried out in this study, Figure 8 shows the flowchart of interpretation of the r values for the OSF cases used in this study (“FEM” in the flowchart means “Finite Element Method”). It should be noted that the 3D benchmark model, Case A, was adopted based on a previous study in terms of models, soil properties, and structural parameters. First of all, a 2D plane strain model was built and repeatedly adjusted to minimize the results’ errors according to the 3D benchmark model in terms of wall deflection and strut load contribution. Once the 2D model had been successfully built and validated, the OSF phenomenon was investigated in both 3D and 2D simulations. In the 3D model, one strut located in the middle lowest strut level (fourth level) was removed. Accordingly, a simulation of strut failure using the 2D model via reducing the value of EA of the lowest strut level was conducted. Again, the wall deflections and strut loads were compared between the 2D and 3D models after the occurrence of the OSF. As a result, the r value was interpreted and optimized until reaching the desired value.
Based on the results of the parametric analyses, it is recommended that r should be in the range from 2.1 to 2.5. These r values are indeed larger than the one found in clays, which is r = 1.5 as reported by Pong et al. [9]. Different ground profiles, types of deep excavation, and supporting systems may lead to different r values. These factors deserve to be further studied in future research.

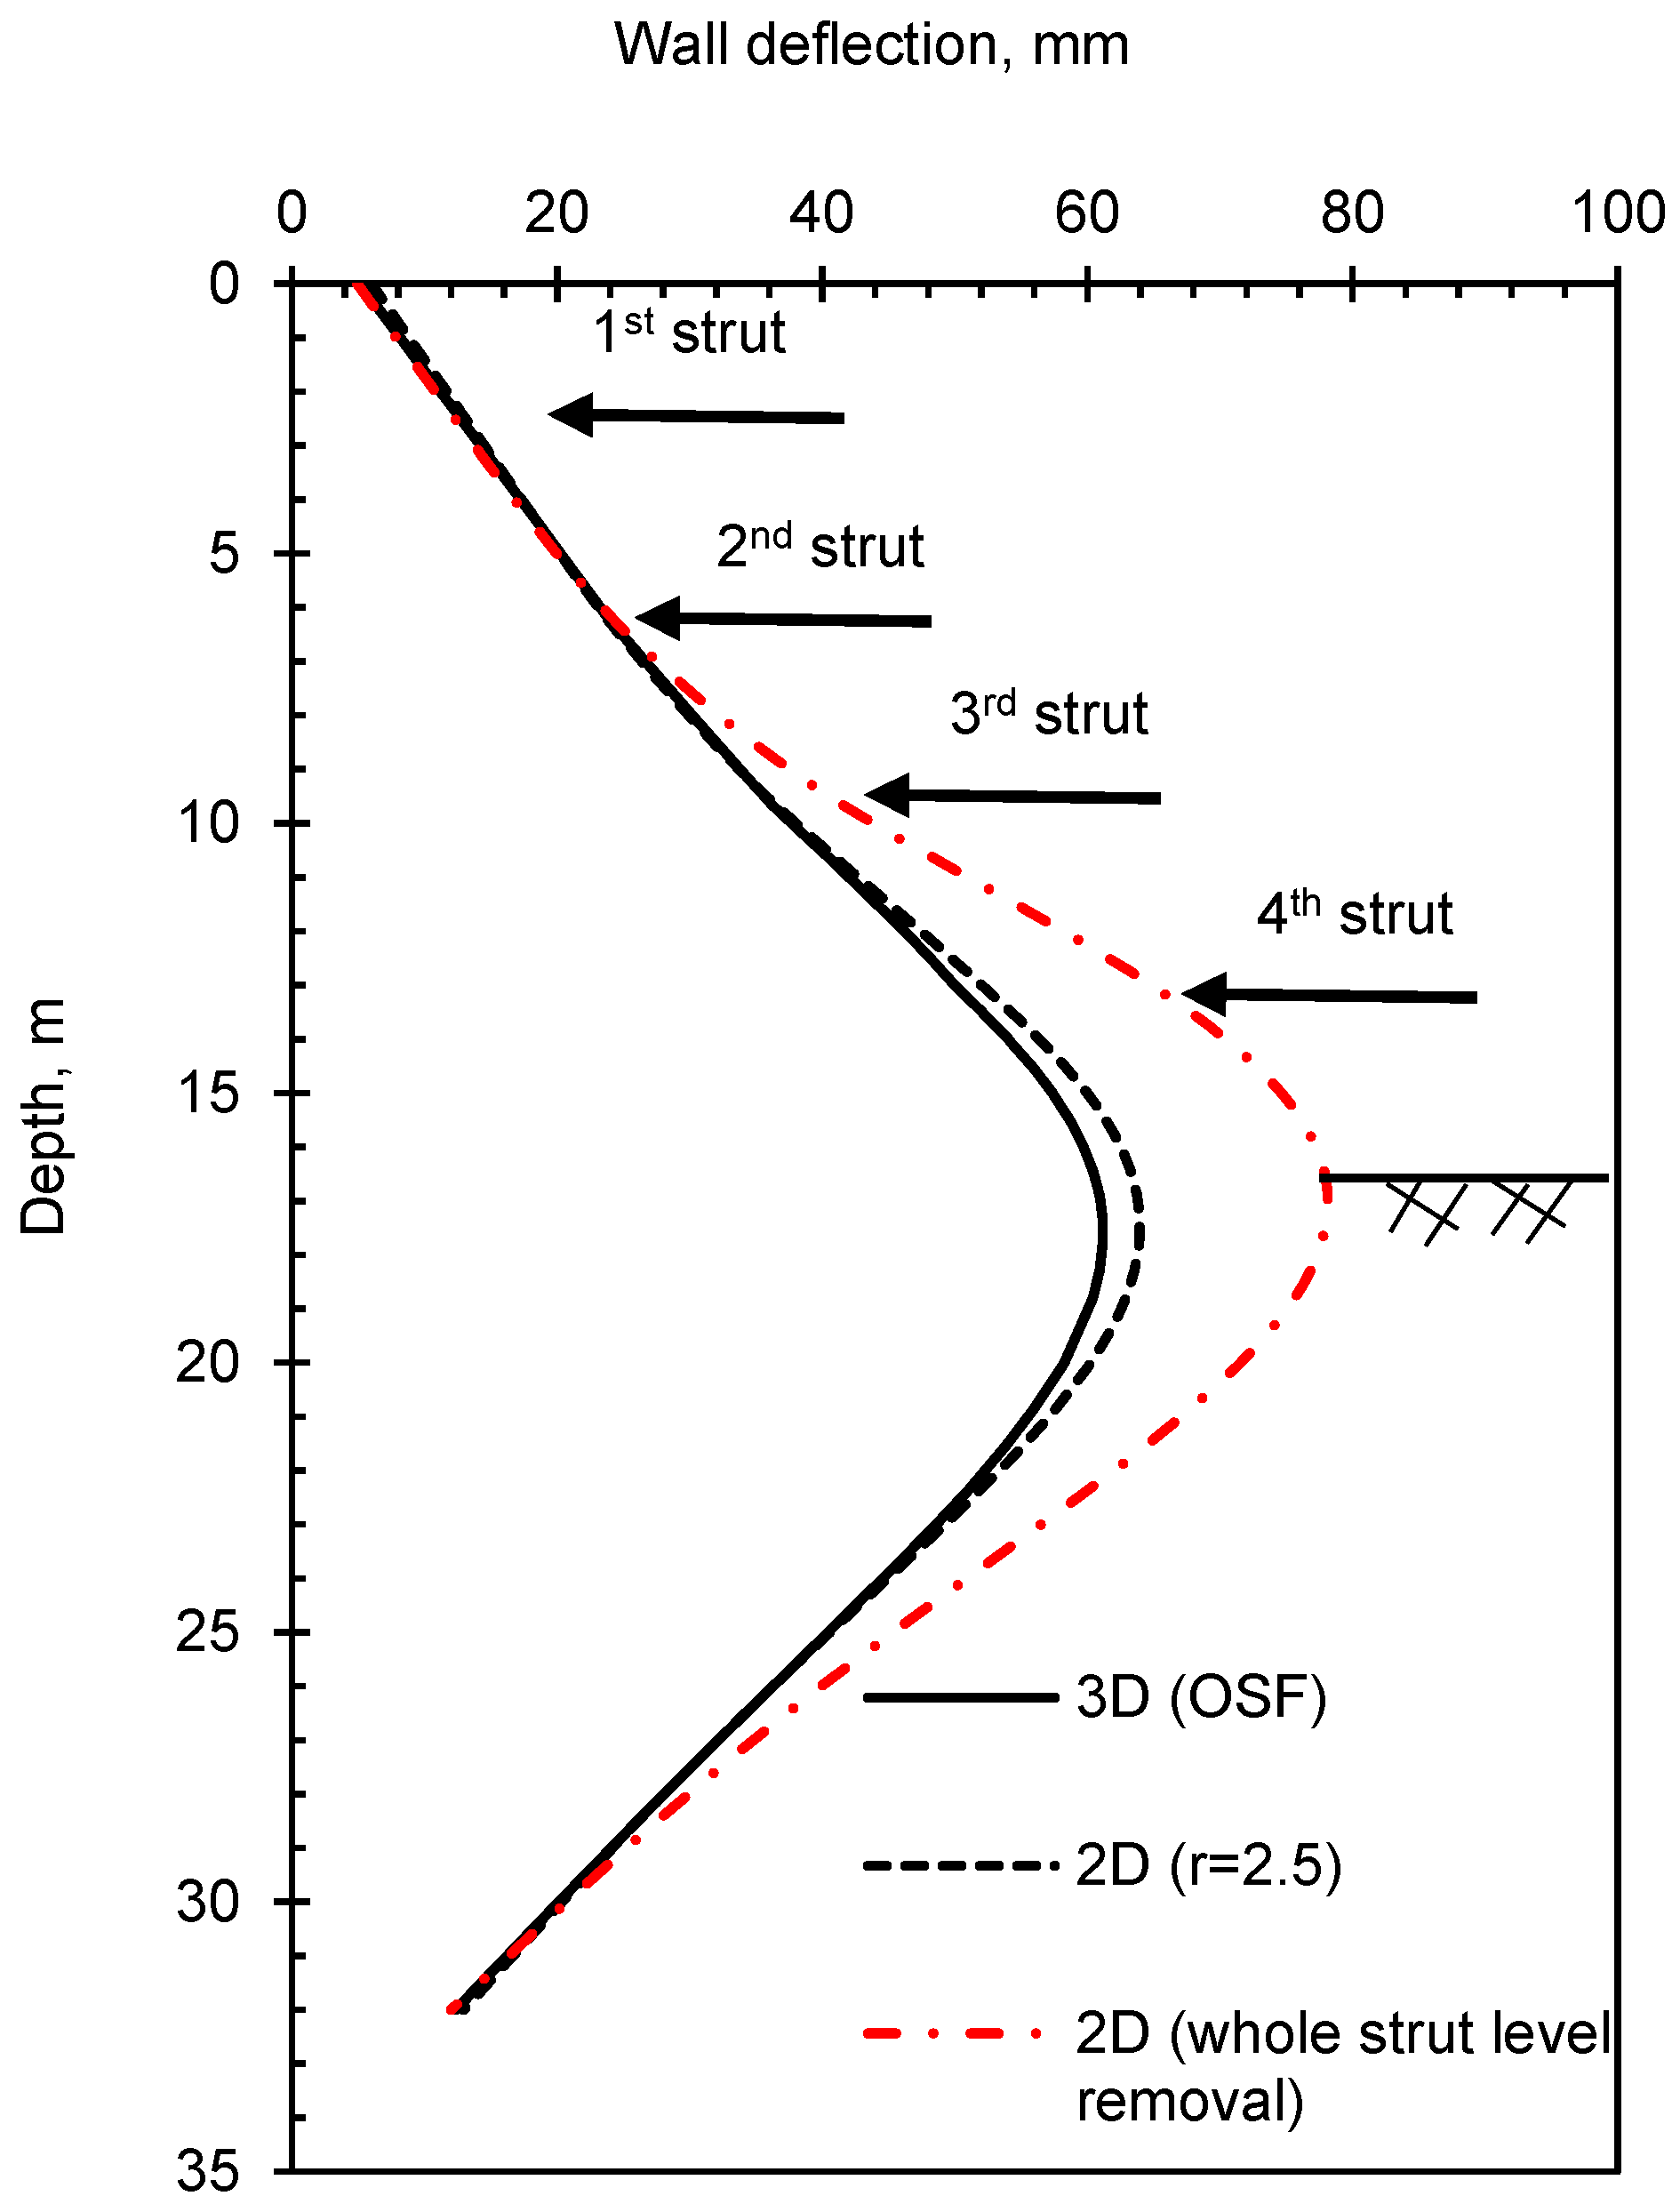
3.3.2. Validation of 2D Simulation with OSF

Further validation of the proposed solution using 2D simulation with the case having OSF was undertaken, and the same case as the one used in the benchmark analyses was selected (see Figure 1); r was set to be 2.5 for the interpretation of EAequivalent based on the results described in the previous section. However, the construction sequence of strut removal was slightly different from the model used for the benchmark (Case 1) analyses. In the validation model, the strut was removed before the start of the final excavation stage to simulate a failed strut based on the most critical case.
Figure 9 shows the comparison of strut loads based on the 2D and 3D simulations before and after having an OSF for the most critical case. It can be clearly seen that an OSF during excavation causes significant changes in the load distribution at the lowest (fourth strut level) and the second lowest strut levels (third strut level) in both the 2D and 3D analyses, as shown in Figure 9a (no failure of strut) and Figure 9b (the case having the OSF).
The strut loads obtained from the 2D and 3D analyses for the case having the OSF are shown in Figure 9b, and it is observed that the peak strut load can be predicted using 2D analyses, with a difference of only 500 kN. Table 4 shows the results of load transfer, and it can be observed that the 2D analyses with the removal of an entire strut level lead to an overestimation of strut loads. Figure 10 presents the predicted wall deflections from both the 2D and 3D analyses for cases having OSF, and it is found that the wall deflections according to the 3D analyses and 2D analyses using EAequivalent are similar, but the wall deflection from the case having an entire level of struts removed is much larger. It is noted that the maximum wall deflection is 61 mm and 64 mm for the 3D and 2D analyses, respectively, with a reduction factor of 2.5 for the axial stiffness of struts, which is close to each other; however, the value increases substantially to 78 mm if an entire level of struts is removed, which is an extra 45% higher wall deflection than that of field observation (Hsiung et al. [11]). The overall wall deflection is also similar between the 3D and 2D analyses with a reduction in the axial stiffness of struts. Additionally, as shown in Table 5, the results are similar in terms of IWD. Based on the results shown in Figure 9 and Figure 10 and Table 4 and Table 5, it is concluded that (1) the calculation of EAequivalent developed in this study could rationally predict strut load and wall displacements for an excavation having OSF and (2) both strut load and wall displacement could be overestimated significantly if an entire strut level is removed for the case having OSF, which is commonly used in current engineering practice. However, more studies are needed to investigate excavations with different ground profiles, construction sequences, and excavation depths to further validate the reduction factor for excavations having OSF.
Based on the details reported in Pong et al. [9], Goh et al. [6], and Zhang et al. [20], it is understood that only numerical simulations were carried out in previous works and there were no field observations or model testing of data to validate results, although an analysis of OSF is requested by certain authorities to ensure that there is no progress failure at an excavation due to the damage of one strut. First, a small-scale model test may not fully represent the strut and ground behavior induced by OSF. Second, the difficulty with field work is that the impact of OSF may only be observable from a full-scale field case, but the risk is comparatively high from the viewpoints of clients, design consultants, and contractors to deliver such test based on the aspect of engineering liability in practice, especially for deep excavations in soft ground. The authors have made their best effort, but it is still not possible to have any field observation data to validate the results obtained from the numerical analyses. Yi et al. [21] used a case study showing progressive collapse of an excavation in clay due to the inappropriate removal of struts, but normally all parties involved were not willing to share any detail to the public. This matter is highly related to the responsibilities and claims of the aftermath of construction accidents, which are typically confidential and not open to the public, thus leading to the difficulty of having field observation data to validate the results obtained from numerical analyses.

3.4. Novelty and Sustainability

The novelty and sustainability of this study are discussed in this section. First of all, two-dimensional analyses are widely accepted by engineering practice due to the limitations associated with tool availability, time, and budget. However, OSF could lead to catastrophic incident, so it has to be considered. However, OSF behavior is a three-dimensional behavior that cannot be adequately presented through the use of a simple two-dimensional analysis. Applying the results of this study, engineers could undertake two-dimensional analyses with consideration of OSF conditions, and this is the most important novelty offered by this study.
As indicated in Section 1, the results obtained from conventional two-dimensional analyses of OSF are comparatively conservative, and this means additional material may have to be used, which is unnecessary and does not fulfill the purpose of sustainability. The alternative solutions provided in this study are expected to reduce the quantity of ERSS, which can satisfy the goal of sustainable engineering.

4. Conclusions

The following conclusions can be drawn from the results of this research:
The most critical of one-strut failure (OSF) case in terms of wall deflections is a single strut failure at the lowest strut level located in the middle of the excavation. However, regarding the load transferring after one-strut failure, the riskiest case is that a single strut failure at the lowest strut level or at the level above in the middle of the excavation.
The influence zone of OSF in terms of load transfers was explored in this study. It is concluded that the horizontal influence of OSF is in the range that is two times the horizontal strut spacing (2 × Sh) on each side of the failed strut for all case studies. However, in the vertical direction, the OSF influence range depends on the depth showing the failed strut and changes from 6.7 to 12 m above the failed strut.
When one-strut failure occurs in the middle of the excavation at the lowest strut level, which is the most critical case for an excavation having OSF, the reduction factor of axial stiffness of strut, r, used for conversion from 3D to 2D simulation is suggested to be 2.5 in order to have comparatively reasonable strut loads and wall deflections in case 2D simulations are undertaken with the consideration of OSF scenarios.

Author Contributions

Project administration, writing—original draft, visualization, software, methodology, and investigation, K.-H.P.; methodology, writing—review and editing, supervision, validation, and visualization, B.-C.B.H. and D.-H.H. All authors have read and agreed to the published version of the manuscript.

Funding

This research received no external funding.

Institutional Review Board Statement

Not applicable.

Informed Consent Statement

Not applicable.

Data Availability Statement

All the data are publicly available, and proper sources are cited in the text. The data used to support the findings of this study are available from the corresponding author upon request.

Conflicts of Interest

The authors declare no conflict of interest.

References

  1. Whittle, A.; Davies, R. Nicoll Highway collapse: Evaluation of geotechnical factors affecting design of excavation support system. In Proceedings of the International Conference on Deep Excavations, Singapore, 28–30 June 2006; p. 30. [Google Scholar]
  2. Puller, M. Deep Excavations: A Practical Manual; Thomas Telford: Telford, UK, 2003. [Google Scholar]
  3. BS8002; Code of Practice for Earth Retaining Structures. British Standards Institution: London, UK, 1994.
  4. TR26. Technical Reference for Deep Excavation; Springer: Singapore, 2010. [Google Scholar]
  5. Suthiwarapirak, P. Design requirements and approval system of Singapore MRT project. In Proceedings of the 64th Annual Academic Lecture Meeting of the Civil Engineering Society, Fukuoka, Japan, September 2011; pp. 113–114. [Google Scholar]
  6. Goh, A.T.C.; Fan, Z.; Hanlong, L.; Wengang, Z.; Dong, Z. Numerical Analysis on Strut Responses Due to One-Strut Failure for Braced Excavation in Clays. In Proceedings of the 2nd International Symposium on Asia Urban GeoEngineering, Changsha, China, 24–27 November 2017; Springer: Singapore, 2018; pp. 560–574. [Google Scholar] [CrossRef]
  7. Phan, H.K.; Hsiung, B.C.B.; Huang, J. Behaviours and mechanism analysis of deep excavation in sand caused by one-strut failure. In Proceedings of the 16th Asian Regional Conference on Soil Mechanics and Geotechnical Engineering, Taipei, Taiwan, 14–18 October 2019; pp. 1–5. [Google Scholar]
  8. Choosrithong, K.; Schweiger, H.F. Numerical investigation of sequential strut failure on performance of deep excavations in soft soil. Int. J. Geomech. 2020, 20, 04020063. [Google Scholar] [CrossRef]
  9. Pong, K.; Foo, S.; Chinnaswamy, C.; Ng, C.; Chow, W. Design considerations for one-strut failure according to TR26–a practical approach for practising engineers. IES J. Part A Civ. Struct. Eng. 2012, 5, 166–180. [Google Scholar] [CrossRef]
  10. Liu, J.; Wu, S.; Wang, L.; Zhou, X. Local Failure and Reliability Analysis of Horizontal Struts in Deep Excavation Based on Redundancy Theory. In Hydraulic and Civil Engineering Technology VI, Proceedings of the 6th International Technical Conference on Frontiers of HCET, Sanya, China, 28–29 August 2021; IOS Press: Amsterdam, The Netherlands, 2021; pp. 356–366. [Google Scholar]
  11. Hsiung, B.C.B.; Yang, K.-H.; Aila, W.; Hung, C. Three-dimensional effects of a deep excavation on wall deflections in loose to medium dense sands. J. Comput. Geotech. 2016, 80, 138–151. [Google Scholar] [CrossRef]
  12. Hsiung, B.C.B. Observations of the ground and structural behaviours induced by a deep excavation in loose sands. J. Acta Geotech. 2019, 15, 1577–1593. [Google Scholar] [CrossRef]
  13. Ou, C.Y. Deep Excavation: Theory and Practice; Taylor & Francis Group: London, UK, 2006. [Google Scholar] [CrossRef]
  14. Hsiung, B.C.B.; Phan, H.K. Exploration of maximum wall deflection and stability for deep excavation in loose to medium-dense sand. J. Acta Geotech. 2023. [Google Scholar] [CrossRef]
  15. Brinkgreve, R.; Engin, E.; Swolfs, W. PLAXIS 3D Anniversary Edition, full Manual. Plaxis 2017. Available online: https://www.plaxis.com/support/manuals/plaxis-3d-manuals (accessed on 25 May 2017).
  16. Bowles, J.E. Foundation Analysis & Design, 5th ed.; McGraw-Hill Companies. Inc.: New York, NY, USA, 1996. [Google Scholar]
  17. Khoiri, M.; Ou, C.-Y. Evaluation of deformation parameter for deep excavation in sand through case histories. J. Comput. Geotech. 2013, 47, 57–67. [Google Scholar] [CrossRef]
  18. Schanz, T.; Vermeer, P.; Bonnier, P. The hardening soil model: Formulation and verification. Beyond 2000 in Comput. Geotech. 1999, 1, 281–296. [Google Scholar] [CrossRef]
  19. Hsiung, B.C.B.; Yang, K.-H. Displacement of ground and diaphragm wall induced by deep excavations in loose to medium dense sand. In Proceedings of the ICSMGE 2017-19th International Conference on Soil Mechanics and Geotechnical Engineering, Seoul, Republic of Korea, 17–22 September 2017. [Google Scholar]
  20. Zhang, W.; Zhang, R.; Fu, Y.; Goh, A.; Zhang, F. 2D and 3D numerical analysis on strut responses due to one-strut failure. Geomech. Eng. 2018, 15, 965–972. [Google Scholar]
  21. Yi, F.; Su, J.; Zheng, G.; Cheng, X.S.; Peng, H.T.; Liu, X.M.; Jia, J.W. Progressive collapse analysis and robustness evaluation of a propped excavation failed due to inappropriate strut removal. Acta Geotech. 2023, 2023, 1–27. [Google Scholar] [CrossRef]
Figure 1. Cross section and ground profile of the excavation case selected for this study (Reprinted/adopted with the permission from Hsiung et al. [11]).
Sustainability 15 10530 g001
Figure 2. Finite element models.
Sustainability 15 10530 g002aSustainability 15 10530 g002b
Figure 3. Plane view of the removal of one strut.
Sustainability 15 10530 g003
Figure 4. Impacts on IWD due to OSF at struts located at various locations during different excavation stages.
Sustainability 15 10530 g004aSustainability 15 10530 g004b
Figure 5. Impacts on ISL due to OSF at struts located at various locations at different excavation stages.
Sustainability 15 10530 g005
Figure 6. The distribution of load transfer (LT) to horizontal strut neighbors from a failed strut, ranging from the center to the corner of the excavation.
Sustainability 15 10530 g006
Figure 7. The maximum LT value is obtained for the level above the lowest strut level in each case.
Sustainability 15 10530 g007
Figure 8. The flowchart of r value interpretation via finite element analyses.
Sustainability 15 10530 g008
Figure 9. Comparison of strut loads based on 2D and 3D simulations for one strut failure using real 3D simulation and reduction in axial stiffness of the lowest strut level using 2D simulation.
Sustainability 15 10530 g009
Figure 10. Comparison of wall deflections among the cases having one strut failure in both 2D and 3D analyses.
Sustainability 15 10530 g010
Table 1. Proposed case studies with various excavation depths and strutting systems.
CasesExcavation
Depth, He (m)
Wall
Length (m)
Wall Thickness
(m)
Number of
Strut Level
Lowest
Strut Level (m)
The Factor of Safety
against Push-In
1 *16.8320.94131.7
219.8381515.81.95
322.8431.2618.82.02
425.8491.3721.82.07
528.8551.5824.82.1
630.8591.6927.82.15
* means the original case for the benchmark analysis.
Table 2. Soil properties adopted for the validation analyses.
(a) Clay
LayerDepth (m)Soil Typeγ
(kN/m3)
Su
(kPa)
ν′E
(kPa)
10.0–2.0Silty clay19.3280.312,133
36.5–8.0Silty clay19.7210.39100
728.5–30.5Silty clay18.6840.336,400
(b) Sand
LayerDepth (m)Soil Typeγ
(kN/m3)
c
(kN/m2)
ϕ
(°)
ψ
(°)
E50ref
(MPa)
Eoedref
(MPa)
Eurref
(MPa)
22.0–6.5Silty sand20.90.532226.226.278.7
48.0–17.0Silty sand20.60.532221.921.965.7
517.0–23.5Silty sand18.60.532224.124.172.2
623.5–28.5Silty sand19.60.533326.326.378.8
830.5–42.0Silty sand19.60.534429.629.688.7
942.0–60.0Silty sand19.90.534433.133.199.4
Note: Additional parameters not listed above include “vur”, which is the Poisson ratio of soil under unloading–reloading case and is assumed to be 0.2; the reference pressure is assumed to be 100 kPa, the power for the stress dependency of stiffness, m, is assumed to be 0.5; and the interface factor “Rinter” is assumed to be 0.67.
Table 3. Structural parameters used for the validation analyses.
(a) Reinforcement Concrete Diaphragm Wall
ParameterSymbolValueUnit
Compressive strength of concretef’c28MPa
Thicknessd0.9m
Young’s modulusEst24.8 × 106kN/m2
Young’s modulus × 70%70% Est17.36 × 106kN/m2
Unit weightw5.5kN/m2
Poisson’s ratioν0.2-
(b) Steel props
Strut
level
Strut levelPreload
(kN)
Section
area (m2)
EstA
(kN)
60% EstA
(kN)
Level 11H400 × 400 × 13 × 214500.02194.59 × 1062.75 × 106
Level 22H400 × 400 × 13 × 2110000.04379.18 × 1065.50 × 106
Level 32H400 × 400 × 13 × 2114000.04379.18 × 1065.50 × 106
Level 42H400 × 400 × 13 × 2114000.04379.18 × 1065.50 × 106
Note: “Est” represents the elastic modulus of the wall or strut; “A” is the cross-sectional area of the strut; “w” is the buoyancy unit weight of the diaphragm wall; and “preload” represents the preload applied to the strut.
Table 4. Comparison of LT at each strut level at the center of the excavation using 2D and 3D simulations.
StrutLT %
3D (Using the Maximum
Values)
2D (OSF Reduction in
Axial Stiffness)
2D (Removal of the Whole Strut Level)
S1000
S2+4.60+6.0
S3+32.5+26.8+128.0
Noted: “+” Positive sign means strut load is increased.
Table 5. Comparison of IWD using 2D and 3D simulations.
LocationIWD %
3D (Using the Maximum Values)2D (OSF Reduction in Axial Stiffness)2D (Removal of the Whole Strut Level)
Center8.56.730.2
Disclaimer/Publisher’s Note: The statements, opinions and data contained in all publications are solely those of the individual author(s) and contributor(s) and not of MDPI and/or the editor(s). MDPI and/or the editor(s) disclaim responsibility for any injury to people or property resulting from any ideas, methods, instructions or products referred to in the content.

