Article

Study on the Interaction Mechanism between Micropiles and Soil Landslides

1
School of Geology Engineering and Geomatics, Chang’an University, Xi’an 710054, China
2
Research Institute of Structural Engineering and Disaster Reduction, Tongji University, Shanghai 200092, China
3
PowerChina Northwest Engineering Corporation Limited, Xi’an 710065, China
4
China Jikan Research Institute of Engineering Investigations and Design, Co., Ltd., Xi’an 710043, China
5
China National Petroleum Corporation Changqing Oilfield Branch, Xi’an 710018, China
*
Author to whom correspondence should be addressed.
Sustainability 2023, 15(13), 10630; https://doi.org/10.3390/su151310630
Submission received: 12 May 2023 / Revised: 1 July 2023 / Accepted: 3 July 2023 / Published: 5 July 2023
(This article belongs to the Section Sustainable Engineering and Science)

Abstract

:
The interaction mechanism between micropiles and soil landslides is comprehensively investigated through static model tests and numerical simulations. The results show that the deformation damage mode of micropiles is mainly bending and shear damage. Because of bending deformation, cracks appear at the rear and front of the pile, respectively, about three times the pile diameter from the sliding surface. In addition, the plastic damage becomes more severe when approaching the back edge of the landslide body. Micropiles in the landslide body play a significant role in load sharing; more importantly, there is a certain pattern between the miniature piles. According to the experimental and numerical simulation results, the recommended load-sharing ratio for micropile design under static conditions is as follows: rear-row pile:middle-row pile:front-row pile = 0.411:0.348:0.241. The research in this paper reveals the good effect of micropiles against landslides, explains the mechanism of pile–soil interaction, and provides a theoretical reference for the research and application of micropiles in engineering.

1. Introduction

In China, landslides are a widely occurring geological hazard that severely constrain the development of regional economies due to their frequent occurrence and potential harm. On 12 August 2015, a catastrophic landslide occurred in Niangou Village, Zhongcun Town, Shanyang County, Shaanxi Province, which caused 12 fatalities, left more than 50 people missing, and resulted in direct economic losses of about CNY 500 million [1]. On 28 September 2016, a landslide occurred in Su Village, Beijie Town, Suichang County, Lishui City, due to the influence of Typhoon “Megi”, burying over 30 houses and causing more than 20 people to go missing [2]. The frequent occurrence of landslides not only seriously threatens the safety of people’s lives and properties in the affected areas, but also significantly constrains the sustained and healthy development of the national economy. In particular, for landslides such as “11.13 Lishui landslide” and “12.20 Shenzhen landslide”, which had undergone some engineering treatment, serious casualties still occurred, highlighting the insufficient understanding of existing landslide prevention and control technology research. Therefore, conducting research on landslide disaster control technology is of great significance for improving the prevention and control level of regional landslide geological hazards, ensuring the safety of people’s lives and property, and creating social and economic harmony.
Micropiles, also known as small-diameter piles, refer to small-diameter (generally 90~300 mm) and large length-to-diameter-ratio (generally greater than 30) grouted piles constructed by drilling machines, ultra-strong reinforcement, and pressure grouting technology. Micropiles have the characteristics of small disturbance to the stratum, small construction equipment, suitability for narrow construction areas, ability to completely avoid excessive excavation and damage to the environment, flexible pile arrangement, strong applicability to soil layers, and convenient and fast construction. Therefore, in recent years, micropiles have also begun to be used in landslide control engineering, especially in relief and emergency engineering, as well as in steep terrains, such as thick soil-covered mountainous road and railway slope sections, where micropiles have unique advantages. Many scholars have made bold attempts at the engineering application of micropiles. Bruce et al. [3] used micropiles to design the repair and reinforcement of a railway embankment slope in southern Ontario, Canada. Macklin et al. [4] systematically demonstrated the successful application of a micropile support system in a temporary support project in Colorado, USA. The paper of Su Juan Zhang [5] mainly introduced the construction technology and its main connections with superstructure in building heightening and transformation. Tae-Hyung Lee et al. [6] recommended the most effective model and design method to improve the reinforcement efficiency of micropiles by experimental results. The study of Tian-fei Hu et al. [7] proposed an anchored micropile structure consisting of a conventional micropile structure (CMS) and anchor ties. Kevin et al. [8] summarized the engineering experience of the Schnabel Foundation company in using anchor micropile retaining walls to successfully control the landslides along the Pigeon River in the United States. In terms of theoretical calculations, Tom Armour and others in their monograph on the design and construction of micropiles [9] systematically introduced the relevant design principles and design criteria for when micropiles are used as building foundations, but they did not propose suggestions or methods for the anti-sliding engineering design of micropiles. Shah et al. [10] focused on the performance of subgrade soil (fly ash) reinforced vertically with micropiles through numerical research, and analyzed the influence of various factors on the bearing capacity and settlement of the foundation system. The Japan High Bearing Capacity Micropile Association published relevant monographs in 2002 [11], which systematically discussed the application and design of micropiles in post-earthquake reconstruction projects, as well as the working performance and design principles of inclined micropiles, and proposed some practical technologies and methods. The study of Azzam, WR et al. [12] indicated that micropiles modified the bearing capacity failure of the strip footing from the general shear failure to the punching shear failure. In addition, Bruce et al. [3], Cantoni et al. [13], and Macklin et al. [4] also discussed the calculation models and methods of micropiles from different perspectives. Sun Shuwei et al. [14] conducted some research on the formation mechanism and structural characteristics of soil arches on micropile reinforcement slopes, which provided guidance for the engineering design and safety evaluation of micropile-reinforced clay slopes. Tang Jun et al. [15] focused their research on the application of micropile technology in the foundation reinforcement and transformation of existing buildings, successfully realized the foundation reinforcement and transformation of existing buildings, and effectively improved the use function of existing buildings. Qiang Xiaojun et al. [16] constructed the frame structure of the micropile group and carried out geocentrifugal model tests, and their results showed that the frame structure of the micropile group could effectively strengthen the slope.
For the characteristics of the micropile support structure, a simulation test of the interaction between micropiles and landslides is carried out in this paper. Multi-directional experimental studies are carried out on the failure mechanism of micropiles under different loading conditions. Through this systematic research, a deeper exploration of the anti-slip mechanism and failure mode of micropiles in landslide prevention and control will be conducted. It is hoped that the relevant conclusions can provide a basis for the design of micropiles in landslide prevention and control engineering.

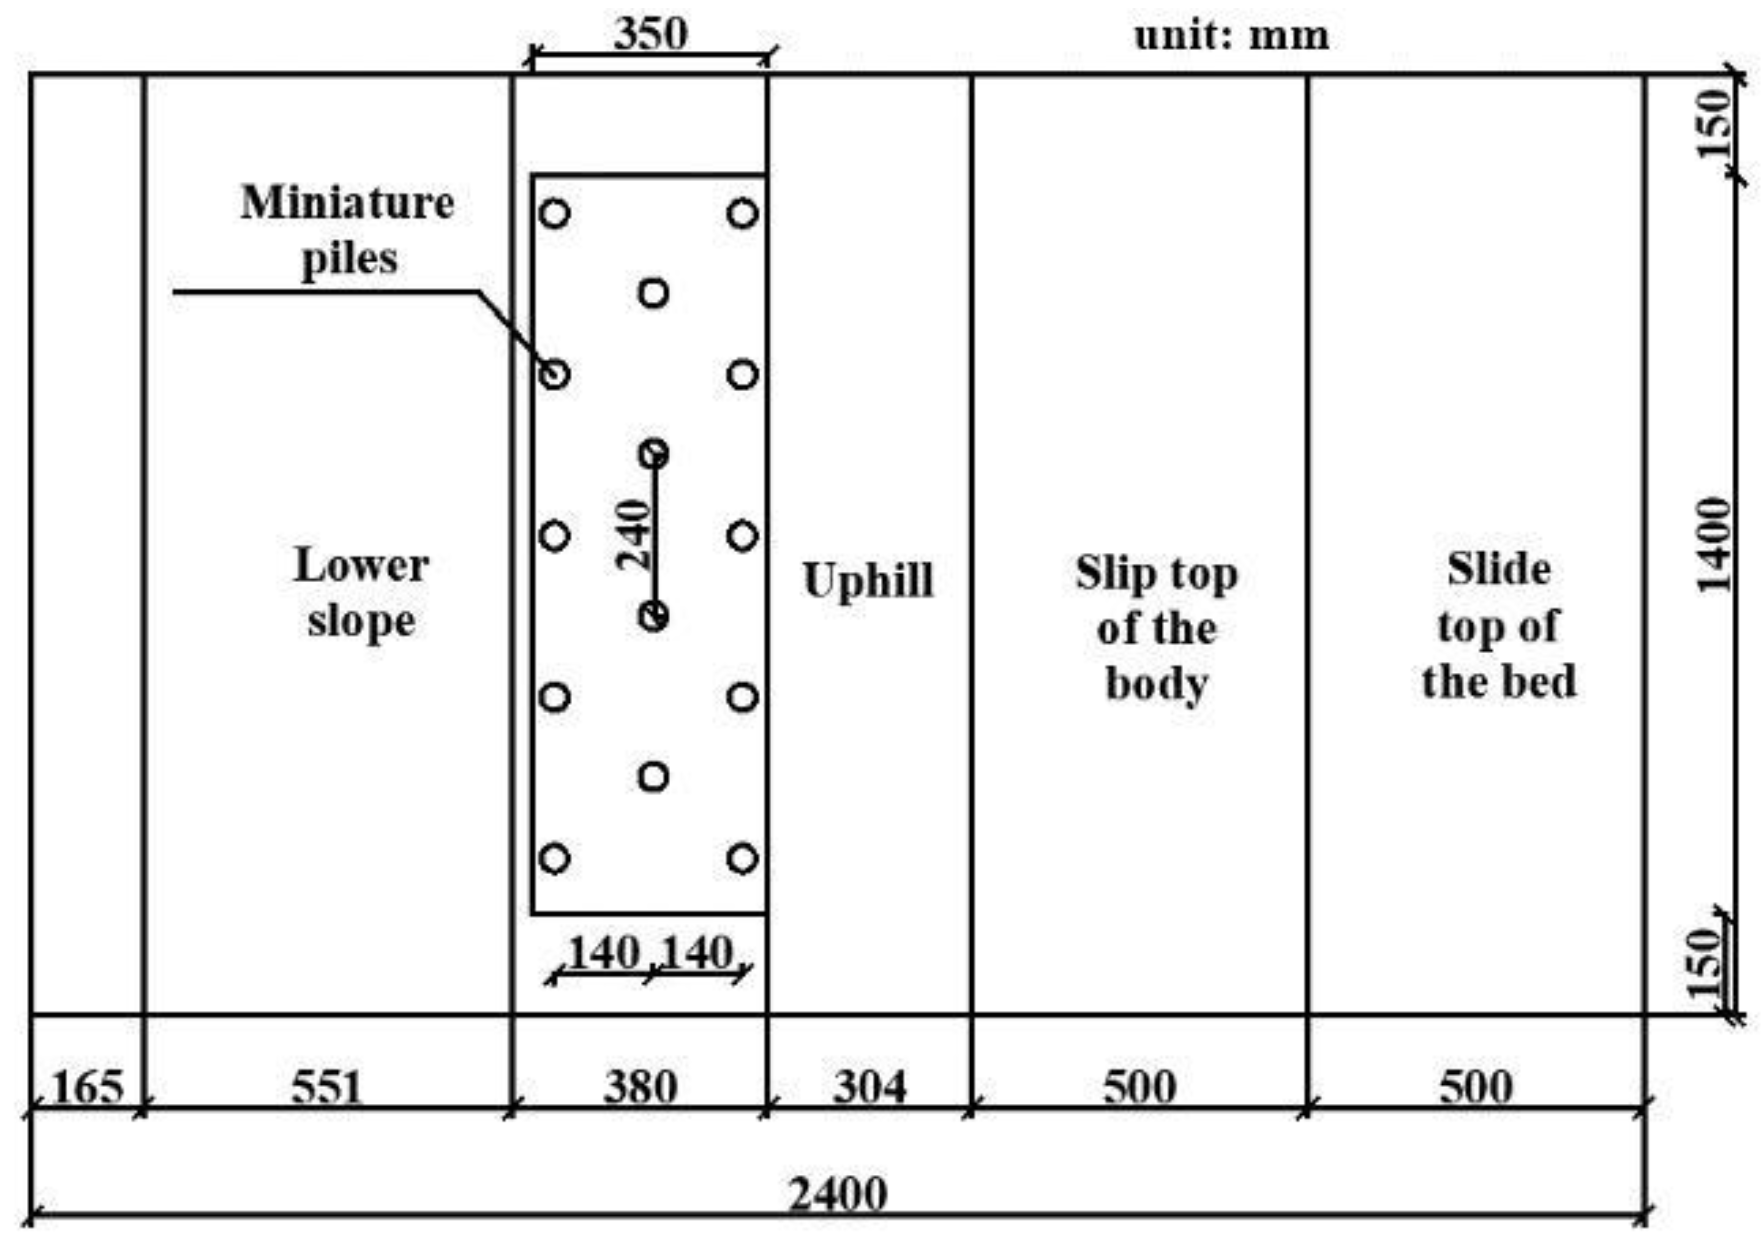
2. Introduction to the Test Protocol

2.1. Model Similar Design

To investigate how a group of micropiles interacts with a soil landslide, we simplified the landslide model to be a homogeneous one with a 1.2 m height difference between its front and rear edges. The landslide was supported by three rows of micropiles arranged in a clover shape. The landslide model and the arrangement of the micropiles are shown in Figure 1 and Figure 2.
Taking the actual project as an example, the size of the test site was reduced in equal proportion to the actual project to obtain the test model. Due to the size reduction, the physical parameters were changed accordingly, including the external force conditions such as material and gravity action, which produce corresponding changes. The corresponding model parameters were obtained by similar ratio theory [17,18] calculation. The test constructs the static test model without considering the gravitational acceleration effect, so the gravitational distortion model was used. Therefore, this experiment aimed to minimize distortion effects by setting the material density similarity ratio at 0.75:1 (prototype:model), while ensuring that other physical parameters of the materials satisfy similarity requirements. In this experiment, length, density, and elastic modulus were used as the basic dimensions to derive similarity relationships between other physical quantities through the Buckingham theorem (refer to Table 1).

2.2. Test Materials and Production Process

2.2.1. Landslide Soil

The research object of this paper is soil landslides, whose deformation is mainly controlled by the parameters of the sliding surface, so the requirements for the cohesive force and internal friction angle of the model soil can be relaxed. Referring to existing research data [19], this paper selected loess as the aggregate, and conducted proportion tests with barite powder, standard sand (medium sand with particle size of 0.5 mm~1.0 mm), bentonite, and water as auxiliary materials. Finally, the mixing ratio of each material was determined to be loess: barite powder: standard sand: bentonite = 50:30:6:14. The composite material with this ratio has been tested by geotechnical experiments, and its parameters are shown in Table 2, which can basically meet the experimental requirements.
The sliding surface was a classic circular arc with curvature determined by the Swedish Slice Method. A double layer of polyethylene plastic film simulated the surface, with no adhesion between layers and cohesive force c considered as 0. After three adjustment experiments, the internal friction angle of the film was about 22°, meeting all requirements.

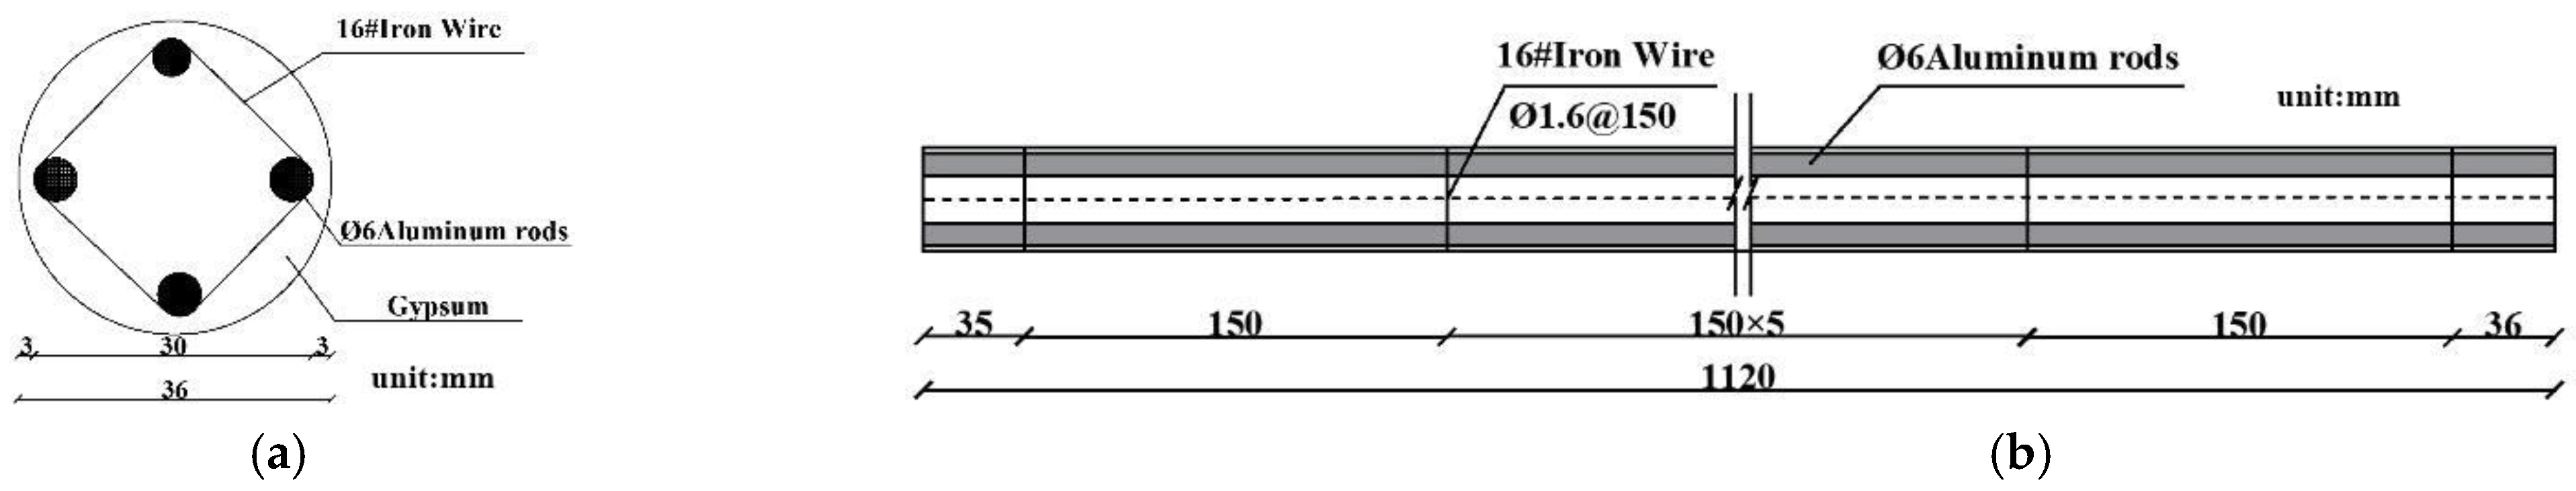
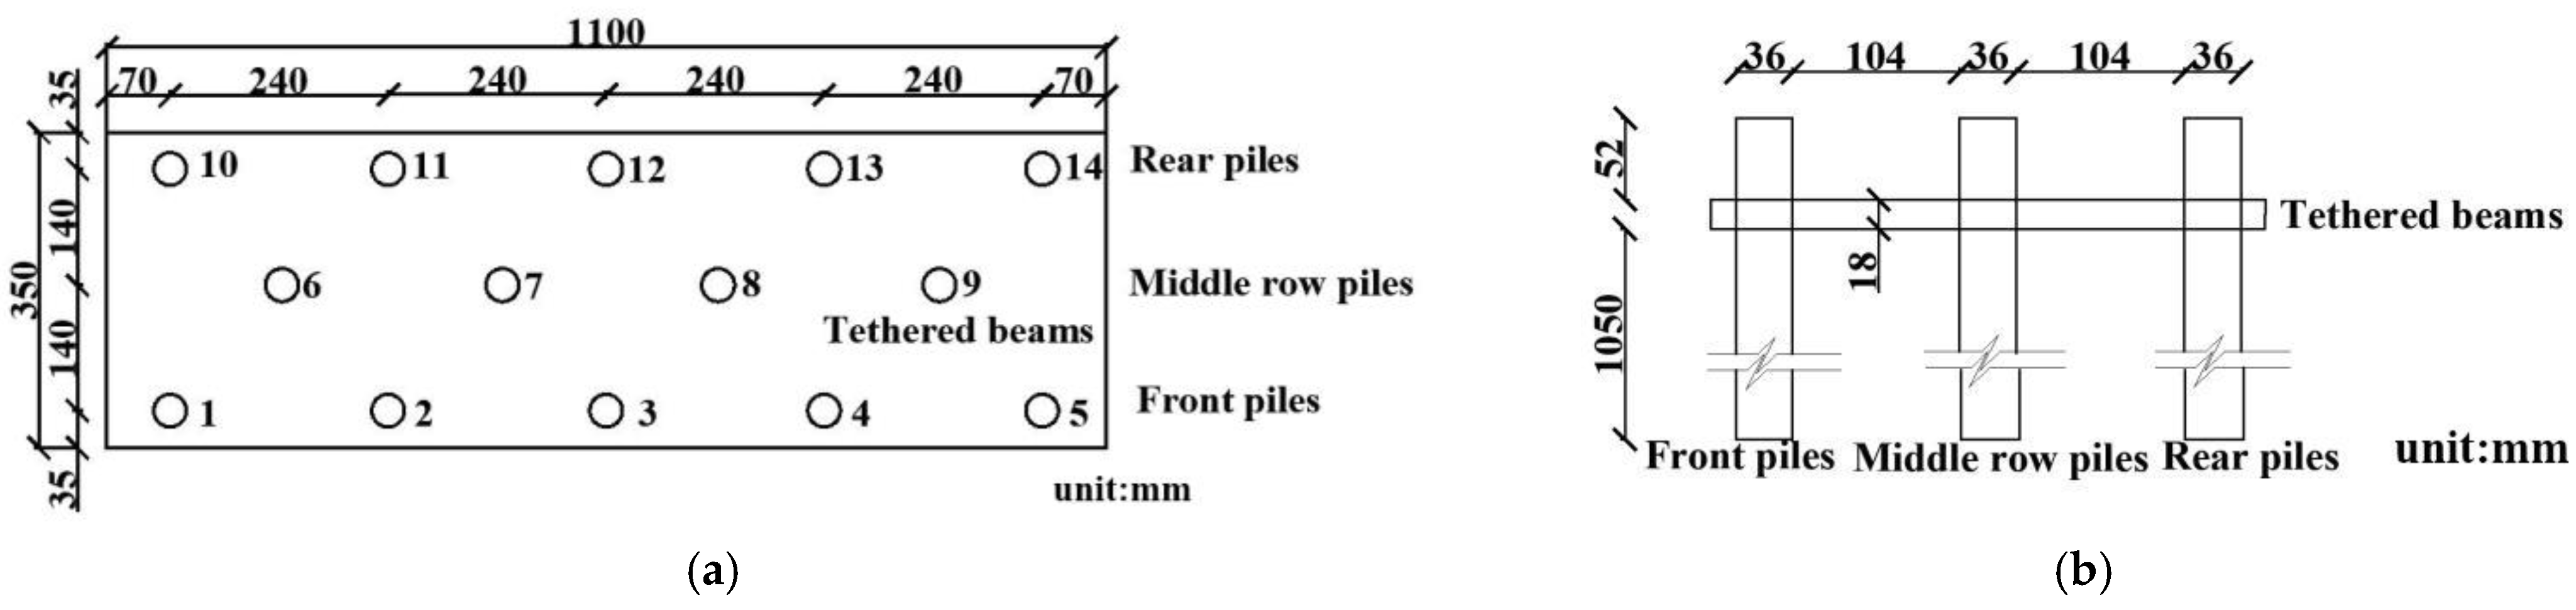
2.2.2. Testing the Micropiles and Landslide Model-Making Process

In order to conveniently measure the internal forces of the micropiles, four Φ6 aluminum rods and #16 iron wires (Φ1.6) were selected for the longitudinal and hoop reinforcement of the micropiles, respectively. As depicted in Figure 3, the reinforcement area measured 1.1304 × 10⁻⁴ m2. Gypsum was mixed with a water-to-plaster ratio of 1:0.7, resulting in an elastic modulus of approximately 4.5 × 10⁹ Pa. The composite elastic modulus of the pile body was currently around 1.167 × 10¹⁰ Pa, which satisfied the similarity requirements with a ratio of about 2.95.
Circular PVC pipes with a diameter of 40 mm and a wall thickness of 2 mm were used as molds for the micropiles. After the “steel cage” (aluminum rods) was placed, the grouting (gypsum slurry) was poured and cured to form the piles. To ensure sensor reliability, they were pre-buried in the micropiles. The schematic of the connection beam structure is shown in Figure 4.
The landslide model was constructed within a conventional rigid model box, with internal dimensions measuring 2.4 m in length, 1.4 m in width, and 1.6 m in height. Prior to the model construction, a layer of gravel was laid on the inside bottom of the box to reduce the relative movement between the box and the soil. The landslide model was built in a standard rigid box with internal dimensions of 2.4 m (L) × 1.4 m (W) × 1.6 m (H). The design of the micropile model follows the similarity relationship of the landslide model, and takes into account factors such as micropile fabrication, sensor arrangement, and difficulty of model installation. In the process of building the model, in order to ensure the consistency of the compactness of the accumulation during the test, the model filling followed the principle of “layered filling, layer by layer compaction”. The entire stacked body was compacted in two layers to ensure that the thickness of each layer did not exceed 200 mm. In the stacking process, the hammer was used to start from the four sides, and then continued to the middle construction; and finally the entire layer was evenly knocked the same number of times. When the slide part of the landslide model was filled, after filling to a certain height, the prefabricated and cured micropiles were installed. After the micropiles were installed and fixed, we continued to fill the sliding machine according to the position of the sliding surface designed by the model, and after the completion of the sliding machine filling, the sliding surface was leveled and a double-layer plastic film was laid. At this time, the model slide was filled. The model was filled to the design position and the corresponding sensor was placed. After the filling was completed, the model box was hoisted to the shaker table. Then, the slope was trimmed according to the model design, and the fixed connecting beam was installed with epoxy resin (as shown in Figure 4), and the model production work was completed. The specific construction process of the model in this experiment was as follows: fixing the micropile at the designated position → compacting the sliding bed → cutting the sliding surface shape → laying a plastic film → making the sliding body → cutting the slope surface → fixing the pile top plate. The constructed landslide model is shown in Figure 5.

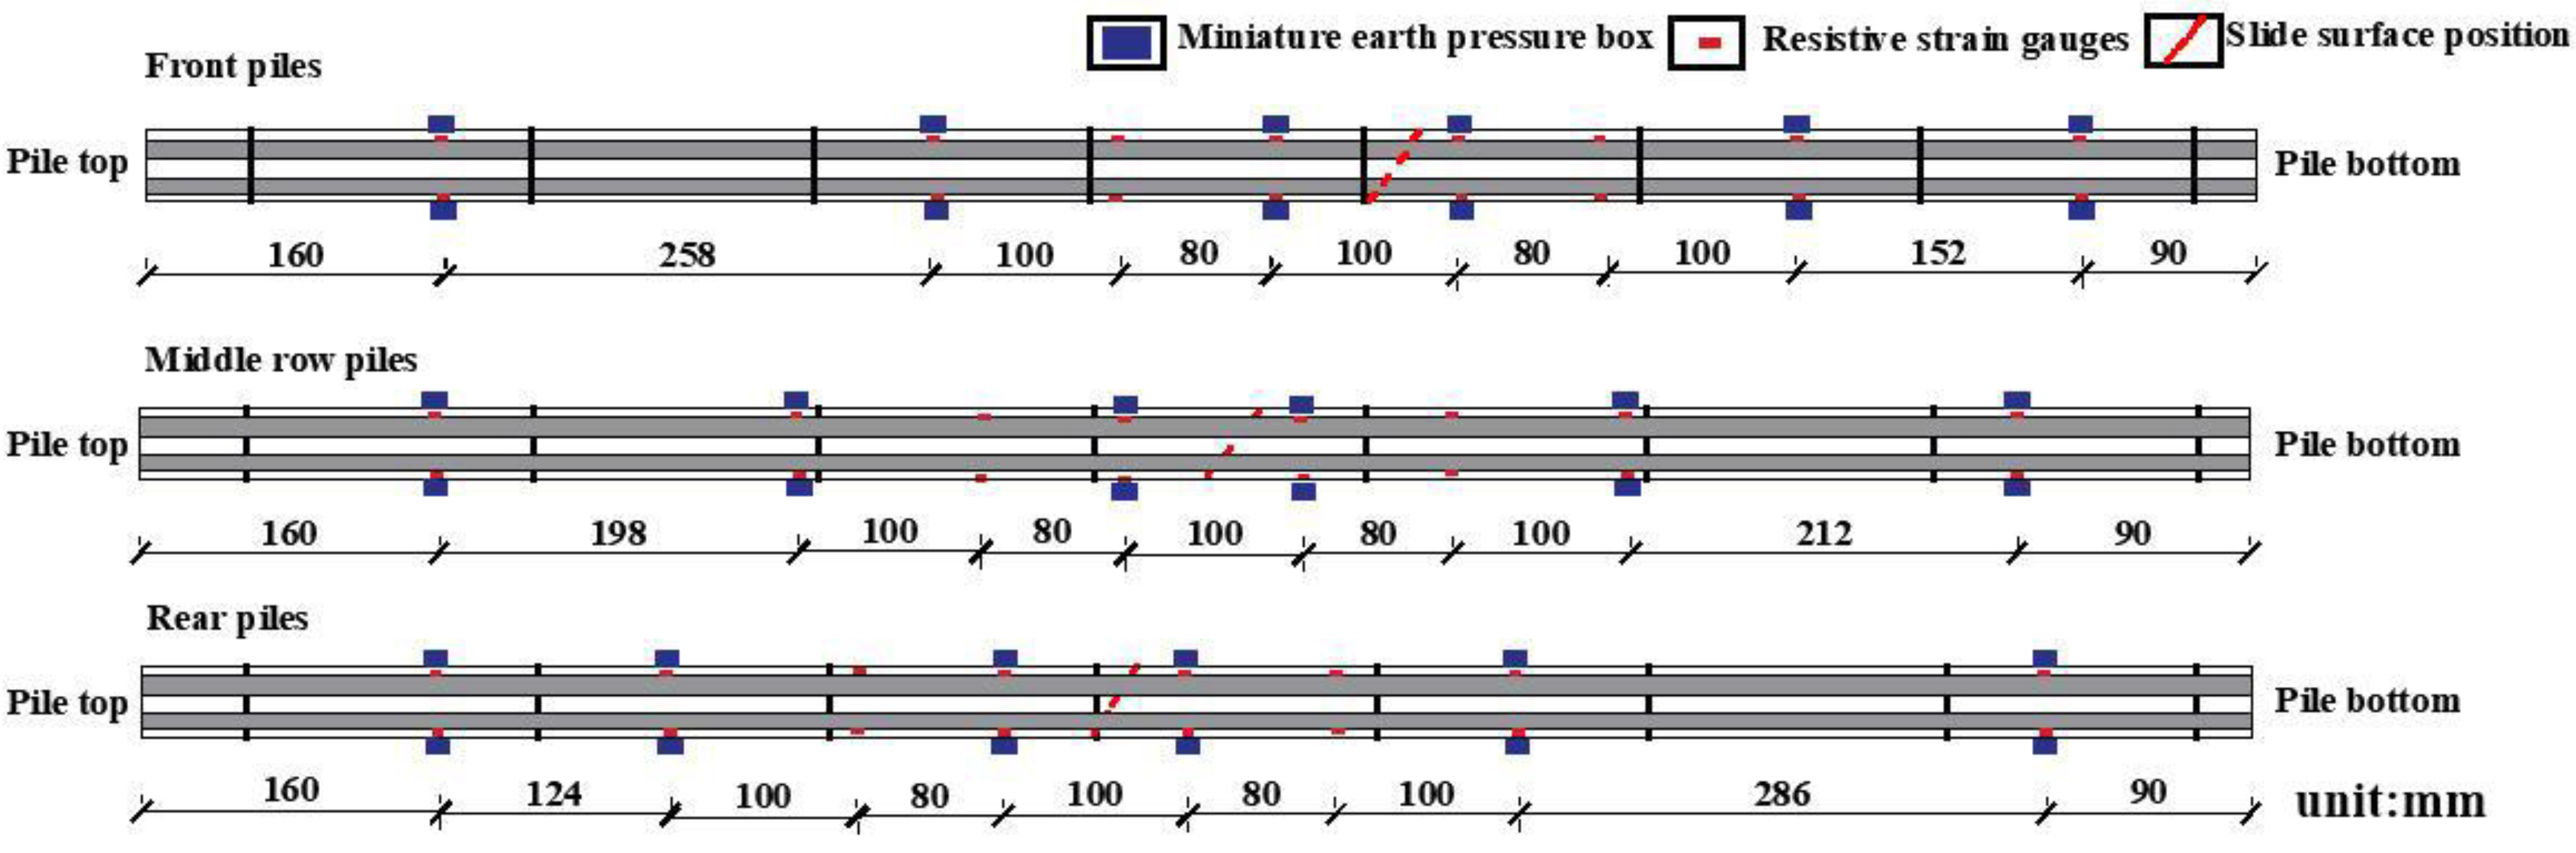
2.2.3. Monitoring Programs

The static test mainly included the force of the micropile, the deformation of the landslides, and the soil pressure distribution. The deformation of the landslide body is mainly measured by displacement gauges, and KTR2-100 resistance displacement gauges were used for the displacement measurement in the static test. The interior of the box was lined with 10 cm thick polystyrene foam board at both ends, effectively mitigating the reflection of incident waves from its boundaries. As depicted in Figure 6, two displacement gauges were positioned at the shear outlet of the landslide body and on the middle platform and top of piles #2 and #4, respectively, to monitor incremental deformation. To fully comprehend the soil pressure distribution within the landslide body, it was crucial to track the micropile internal force distribution.
In order to achieve this, six micropiles (#2, #4, #6, #9, #11 and #13) were selected as test piles, which is shown in Figure 7. BX120-5AA resistance strain gauges were attached to the outer side of the diagonal reinforcement of each pile, with their longitudinal distribution determined based on the micropile layout and position of the sliding surface.

3. Pile–Soil Interaction Test Analysis

Based on previous experiments, this article adopted the static model to study the mechanism of interaction between micropiles and soil landslides. This chapter centers on scrutinizing the data procured from the model test, and delves into the fundamental mechanism of the static interaction between micropiles and soil landslides through analyzing deformation characteristics and thrust distribution, as well as through an internal force analysis of the landslide.
According to the model design, the sloping soil was filled first, the micropiles were prefabricated and installed, then the sensor was laid, and finally the vertical loads were applied in the form of sandbag stacking. Next, the displacement, earth pressure, and pile stress distribution of the landslide body were measured and recorded during the test. In the test, the loading was graded at 2 kPa per stage until reaching a final load of 26 kPa, causing significant deformation and displacement of the sliding machine and body by over 8 cm. This indicated that the micropile had entered plastic failure stage, leading to the termination of the test.

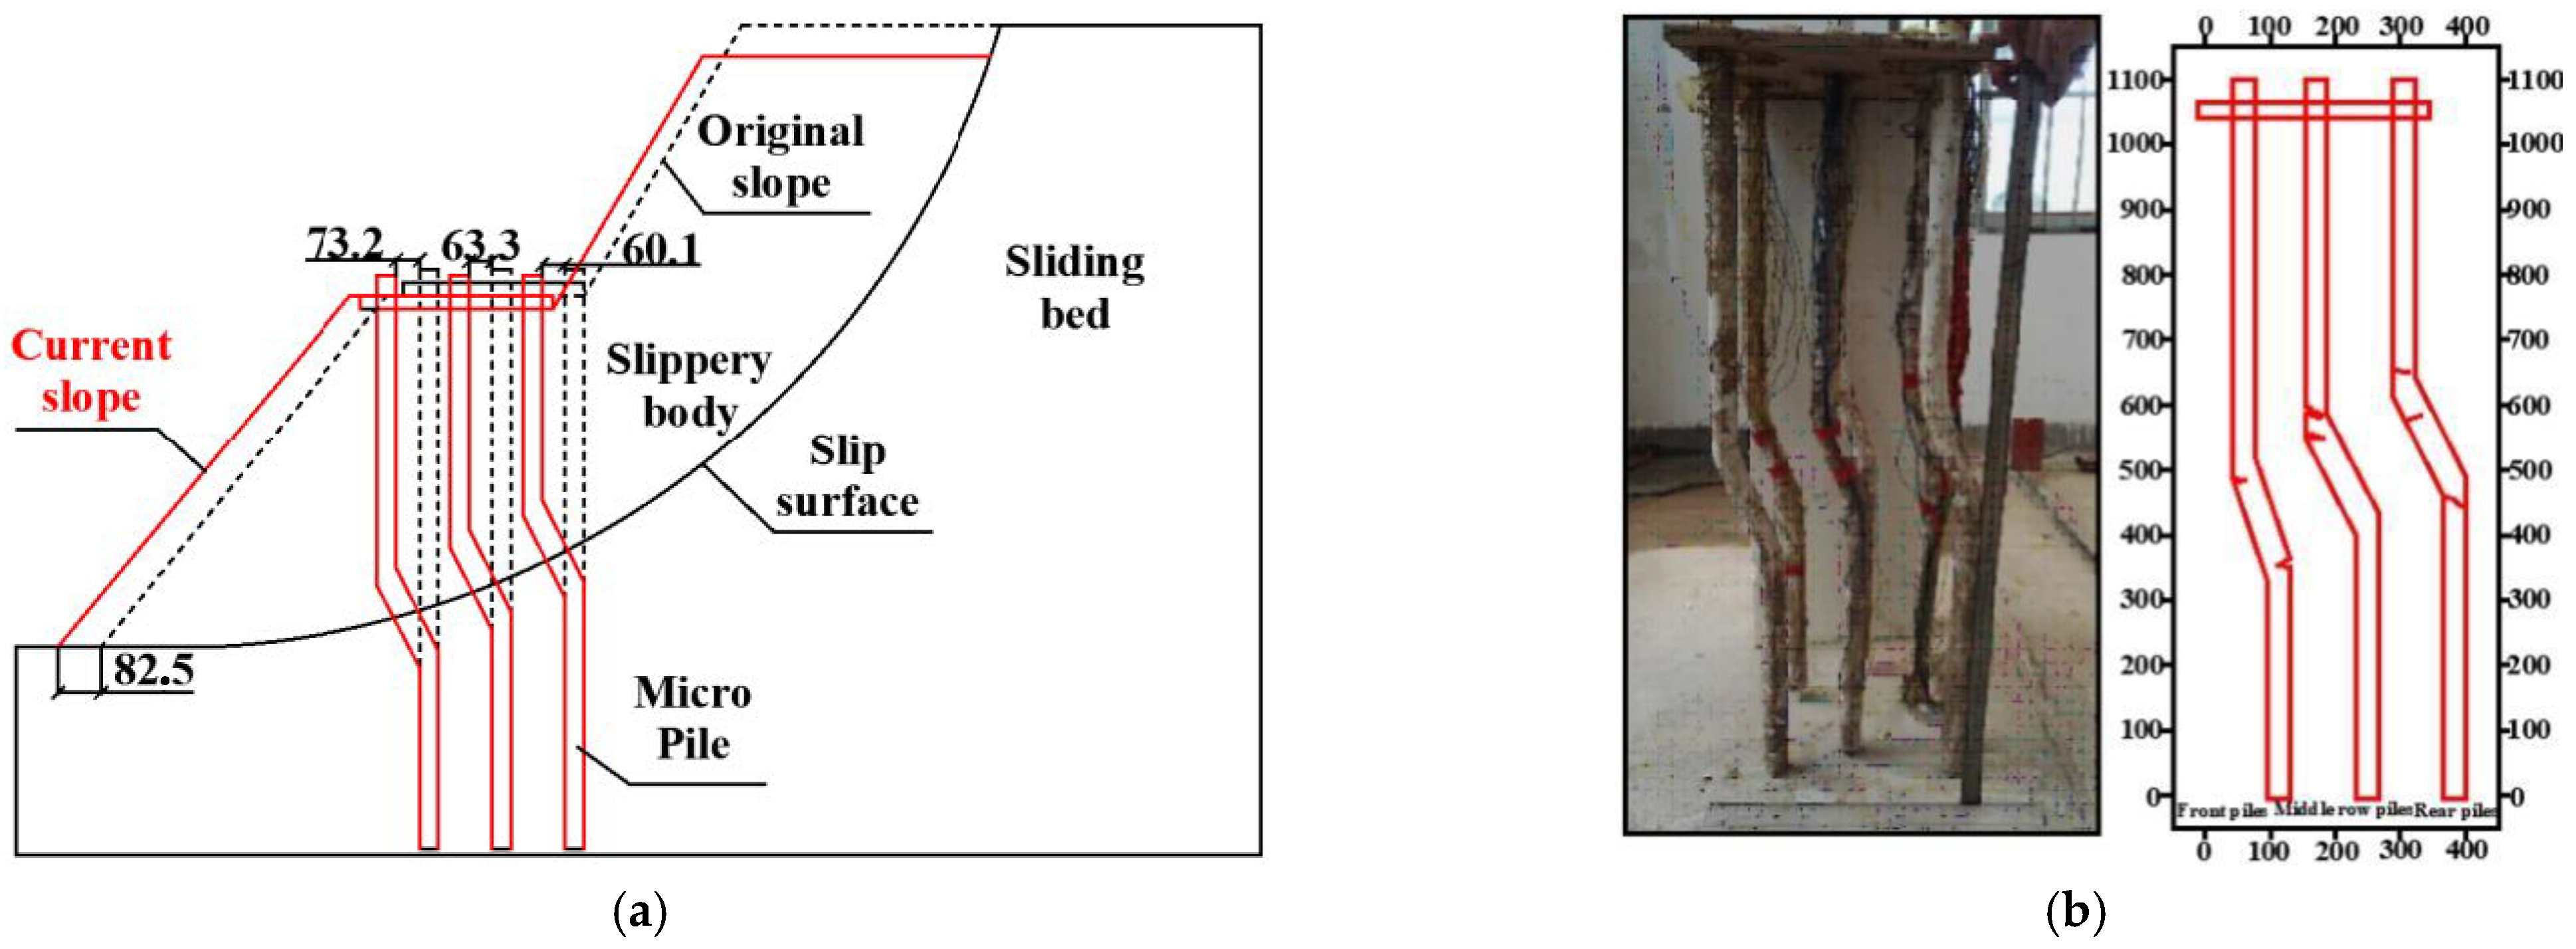
3.1. Analysis of Destructive Phenomena

Figure 8a shows the sketch of the deformation of the slope body and the micropile drawn according to the test phenomenon. From the figure, it can be observed that the landslide body deformed in an arc rotation mode along the preset sliding-surface position under static load. The micropile experienced bending deformation near the sliding surface due to the landslide thrust generated by the rotation of the sliding body, resulting in decoupling between the trailing edge of the linkage beam and landslide body. After the test was completed, the mini-pile group was excavated from the model. As shown in Figure 8b, the mini-piles were bent and deformed mainly at about 10 cm above and below the slip surface (about 3 times the pile diameter), and the corresponding tension cracks and extrusion damage were produced at the pile bend. The rear row of mini-piles suffered the most damage, followed by the middle row and then the front row, as shown in the pile crack distribution sketch. In summary, bending shear damage caused by misshapen deformation of the slide and slide bed was the main cause of static force-induced mini-pile damage, with greater severity observed closer to the back edge of the slide.

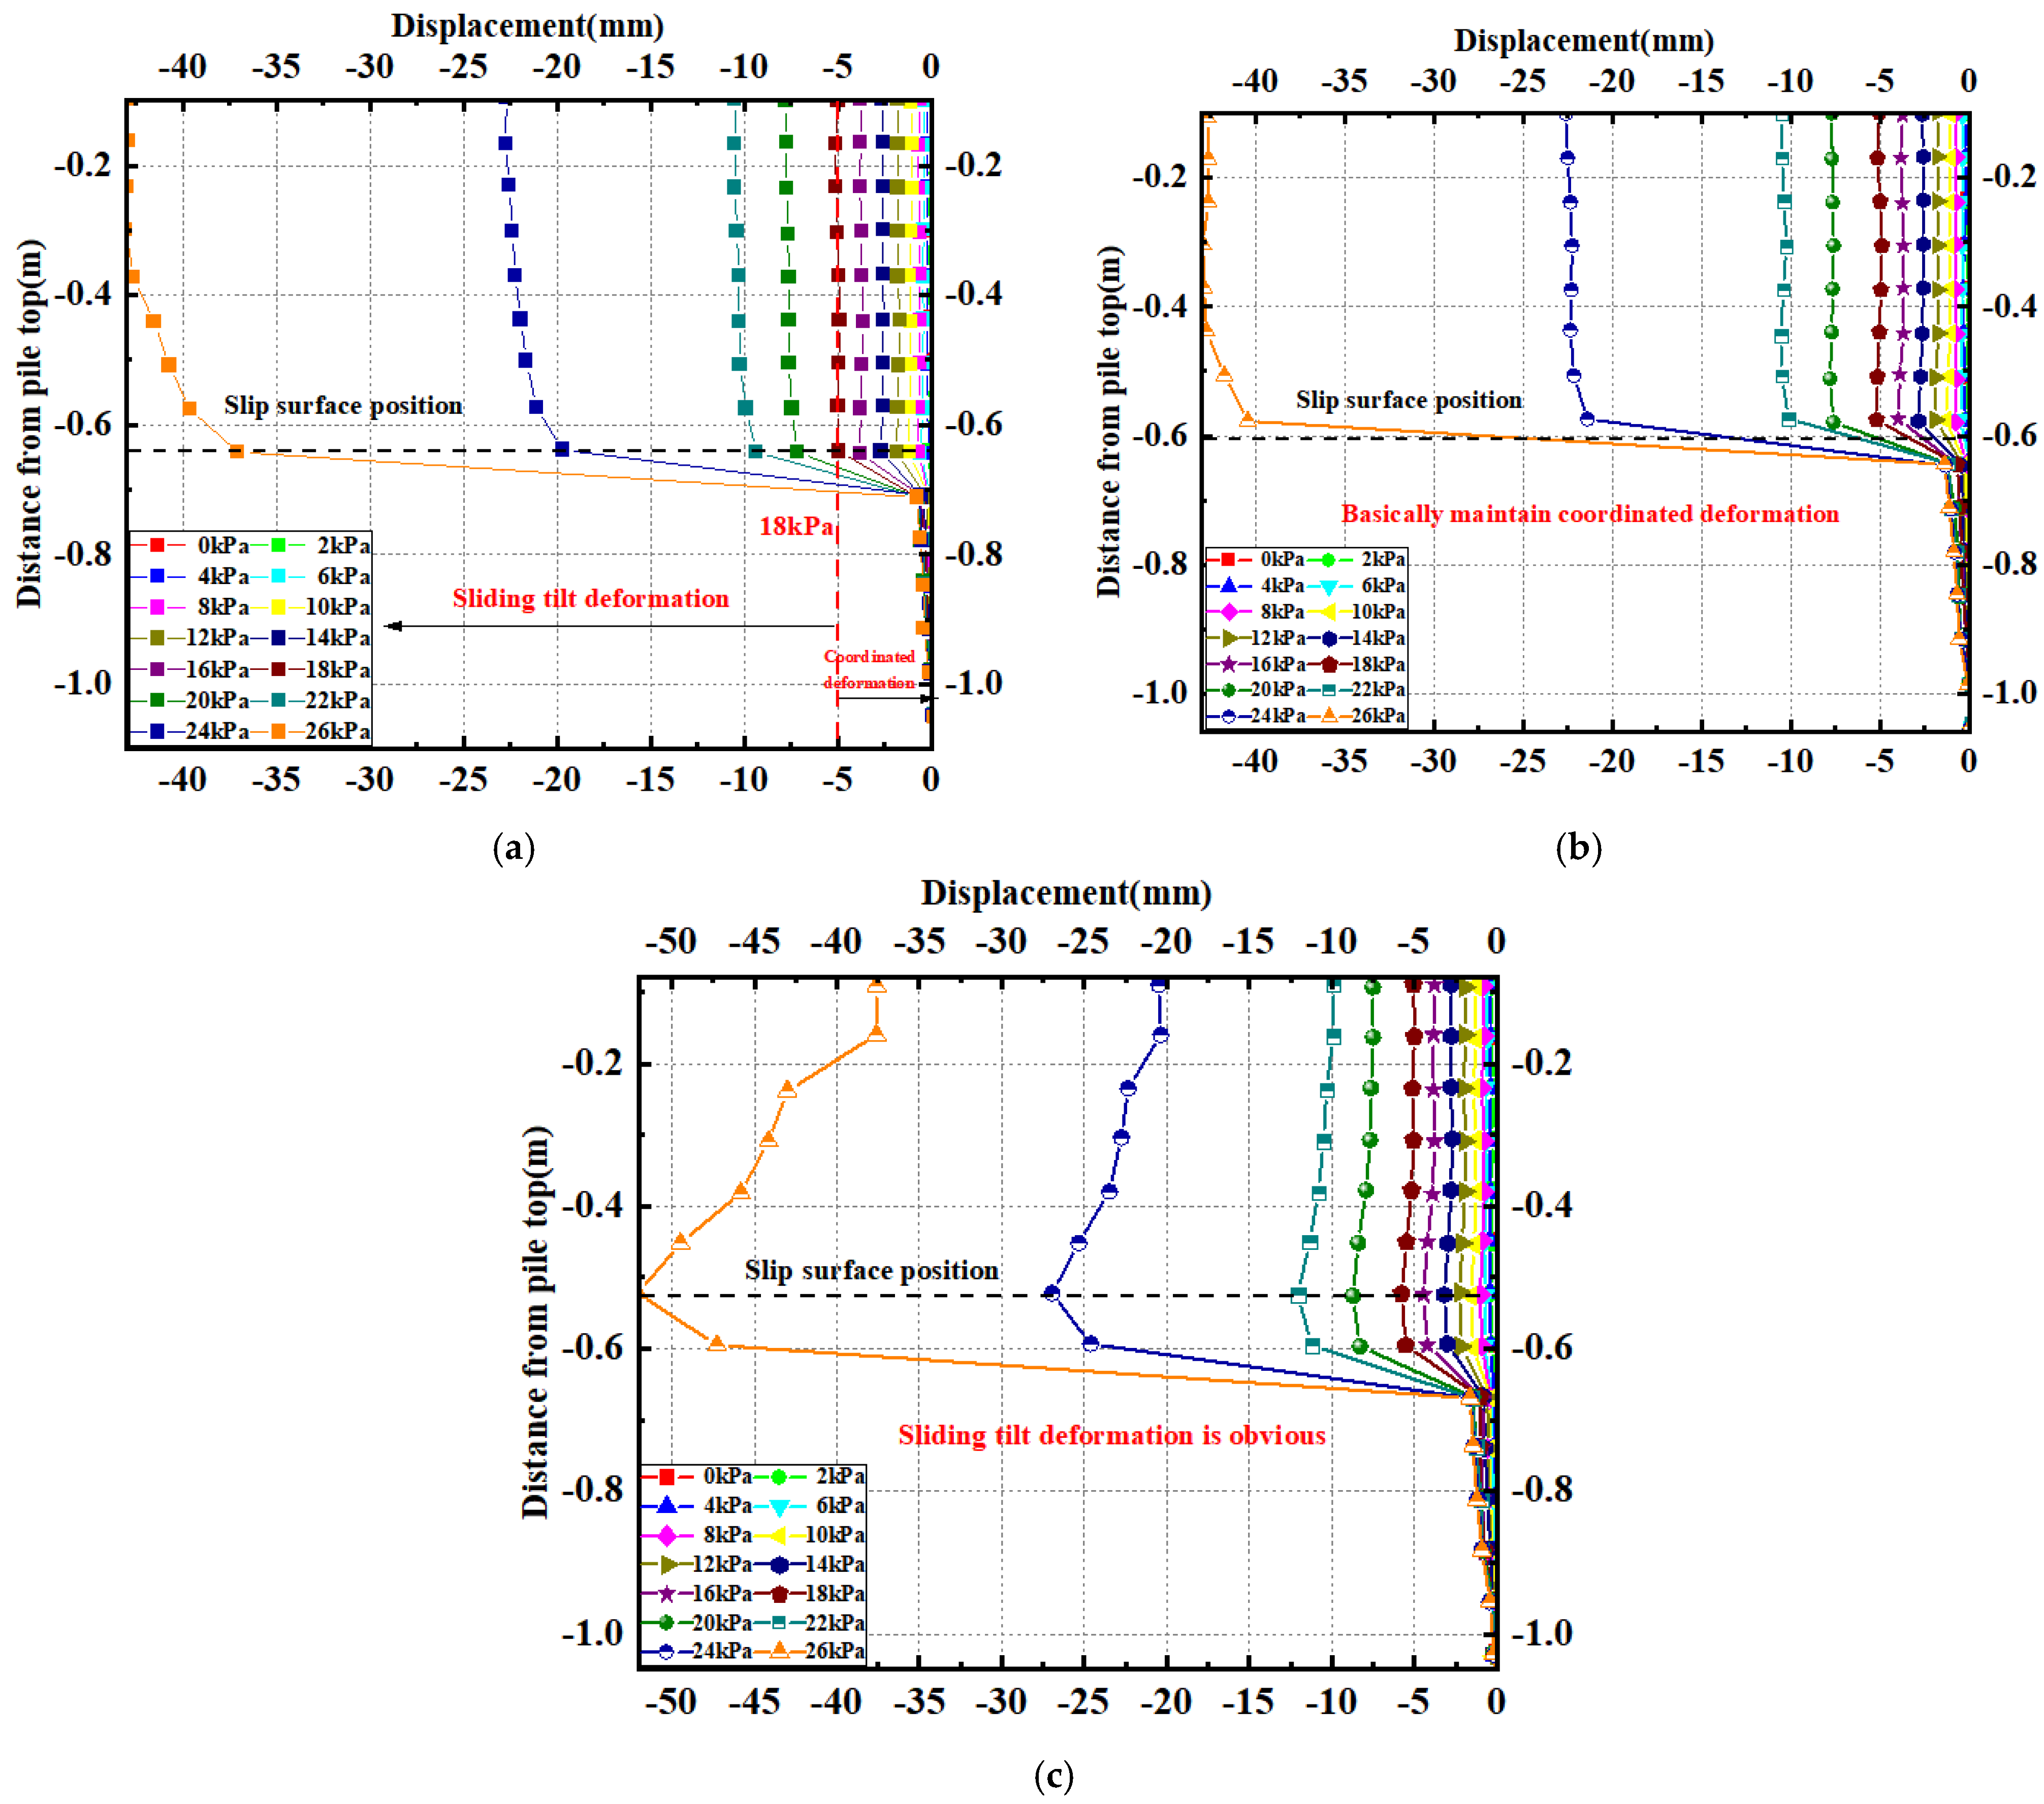
3.2. Displacement Data Analysis

Experimental data on displacement were mainly obtained from displacement sensors installed on the slope surface. The experiment was loaded 13 times, with an interval of 4–5 h between each loading. The experiment was conducted 13 times, with a 4–5 h interval between each trial. Displacement data were recorded hourly and partial records are shown in Figure 9.
As shown in the figure, point D1 is located on the inside of the platform, and its measurements results show that the settlement of the internal platform of the model continued to increase with the loading process. The settlement deformation rate in the middle part of the platform’s inner side was relatively stable and did not show any sudden changes. When the loading finished, the maximum vertical deformation at this location was about 19 mm. The D3 displacement sensor on top of pile 2 in the front row showed a consistent deformation pattern with that measured by the D5 displacement sensor at the foot of the slope in front of the landslide. Before the loading reached 22 kPa, the displacement at these two locations increased steadily with the increasing load. However, as the load increased, the micropile group’s support gradually failed and caused significant sliding deformation of the landslide. Mutations in disposal data were observed after the loading reached 24 kPa and 26 kPa. After the loading, the D3 measuring point at the top of the #2 pile in the front row showed a displacement of about 68 mm, while the D5 measuring point at the foot of the slope showed approximately 75 mm displacement.
From the displacement test results, it can be inferred that as the load increases, the displacement of the sliding mass also increases, and there is a critical load. When this load is exceeded, the displacement at the pile head and the foot of the slope increases rapidly, and it is determined that the micropile has entered the plastic deformation stage. This load is referred to as the critical failure load in this paper. In this static model test, the critical failure load is approximately 22 kPa.

3.3. Earth Pressure Data Analysis

The distribution of soil pressure inside the landslide mass and in front and behind the test piles was measured using a miniature soil pressure cell to obtain the distribution of soil pressure inside the model. The miniature test piles in this experiment were symmetrically distributed. The piles at #2, #6, and #11 on one side of the model were chosen as typical representatives for analysis.
As shown in Figure 10, the soil pressure distribution curves for each row of micropiles are shown for both the front and back. The soil pressure distribution patterns are consistent at the front and back of the micropiles. The soil pressure behind the pile is mainly concentrated in the loaded section and follows a triangular distribution that increases with loading. The force characteristics of the pile-embedded segment below the sliding surface are primarily determined by soil resistance induced by pile deformation under load. The distribution curve of the soil pressure in this segment also approximately follows a triangular distribution pattern, which increases with the increase in loading.
Comparing the soil pressure acting on different rows of micropiles, it can be observed that among the piles directly bearing the landslide thrust, the rear-row piles are subjected to the highest load, followed by the middle-row piles and then the front-row piles. For instance, at 26 kPa, the maximum value of the post-pile earth pressure borne by the rear-row piles is about 81.6 kPa, while it is around 64.1 kPa for the middle-row piles and 49.7 kPa for the front-row piles. In order to further investigate the sharing of landslide thrust among the different rows of micropiles, the difference between the soil pressure acting on the front and rear piles was calculated as the load carried by the piles. The statistics of the post-pile earth pressures shown in the diagram, which are in the vicinity of the critical damage loads, were taken in order to obtain the sharing-proportion of post-pile earth pressure for each row of piles, as shown in Table 3.
As shown in Table 3, the load proportion borne by the rear row of piles first increases and then decreases, reaching its maximum value at the critical failure load of 22 kPa. At this point, the ratio of the pile–soil pressure borne by each row of piles is rear row: middle row: front row = 0.411:0.348:0.241. As the load further increases, the role of the middle row of piles and the front row of piles is further enhanced. This indicates that the load sharing of the rear piles is limited after excessive deformation, and the corresponding load sharing of the front and middle rows of piles increases. Referring to relevant research [20], it can be inferred that there exists a plastic yield limit for the micropiles. After 22 kPa, the rear row of piles enters the plastic yield stage, and the bearing capacity reaches its limit. The increase in soil pressure caused by the increase in load can only be borne by the middle row of piles and the front row of piles together.

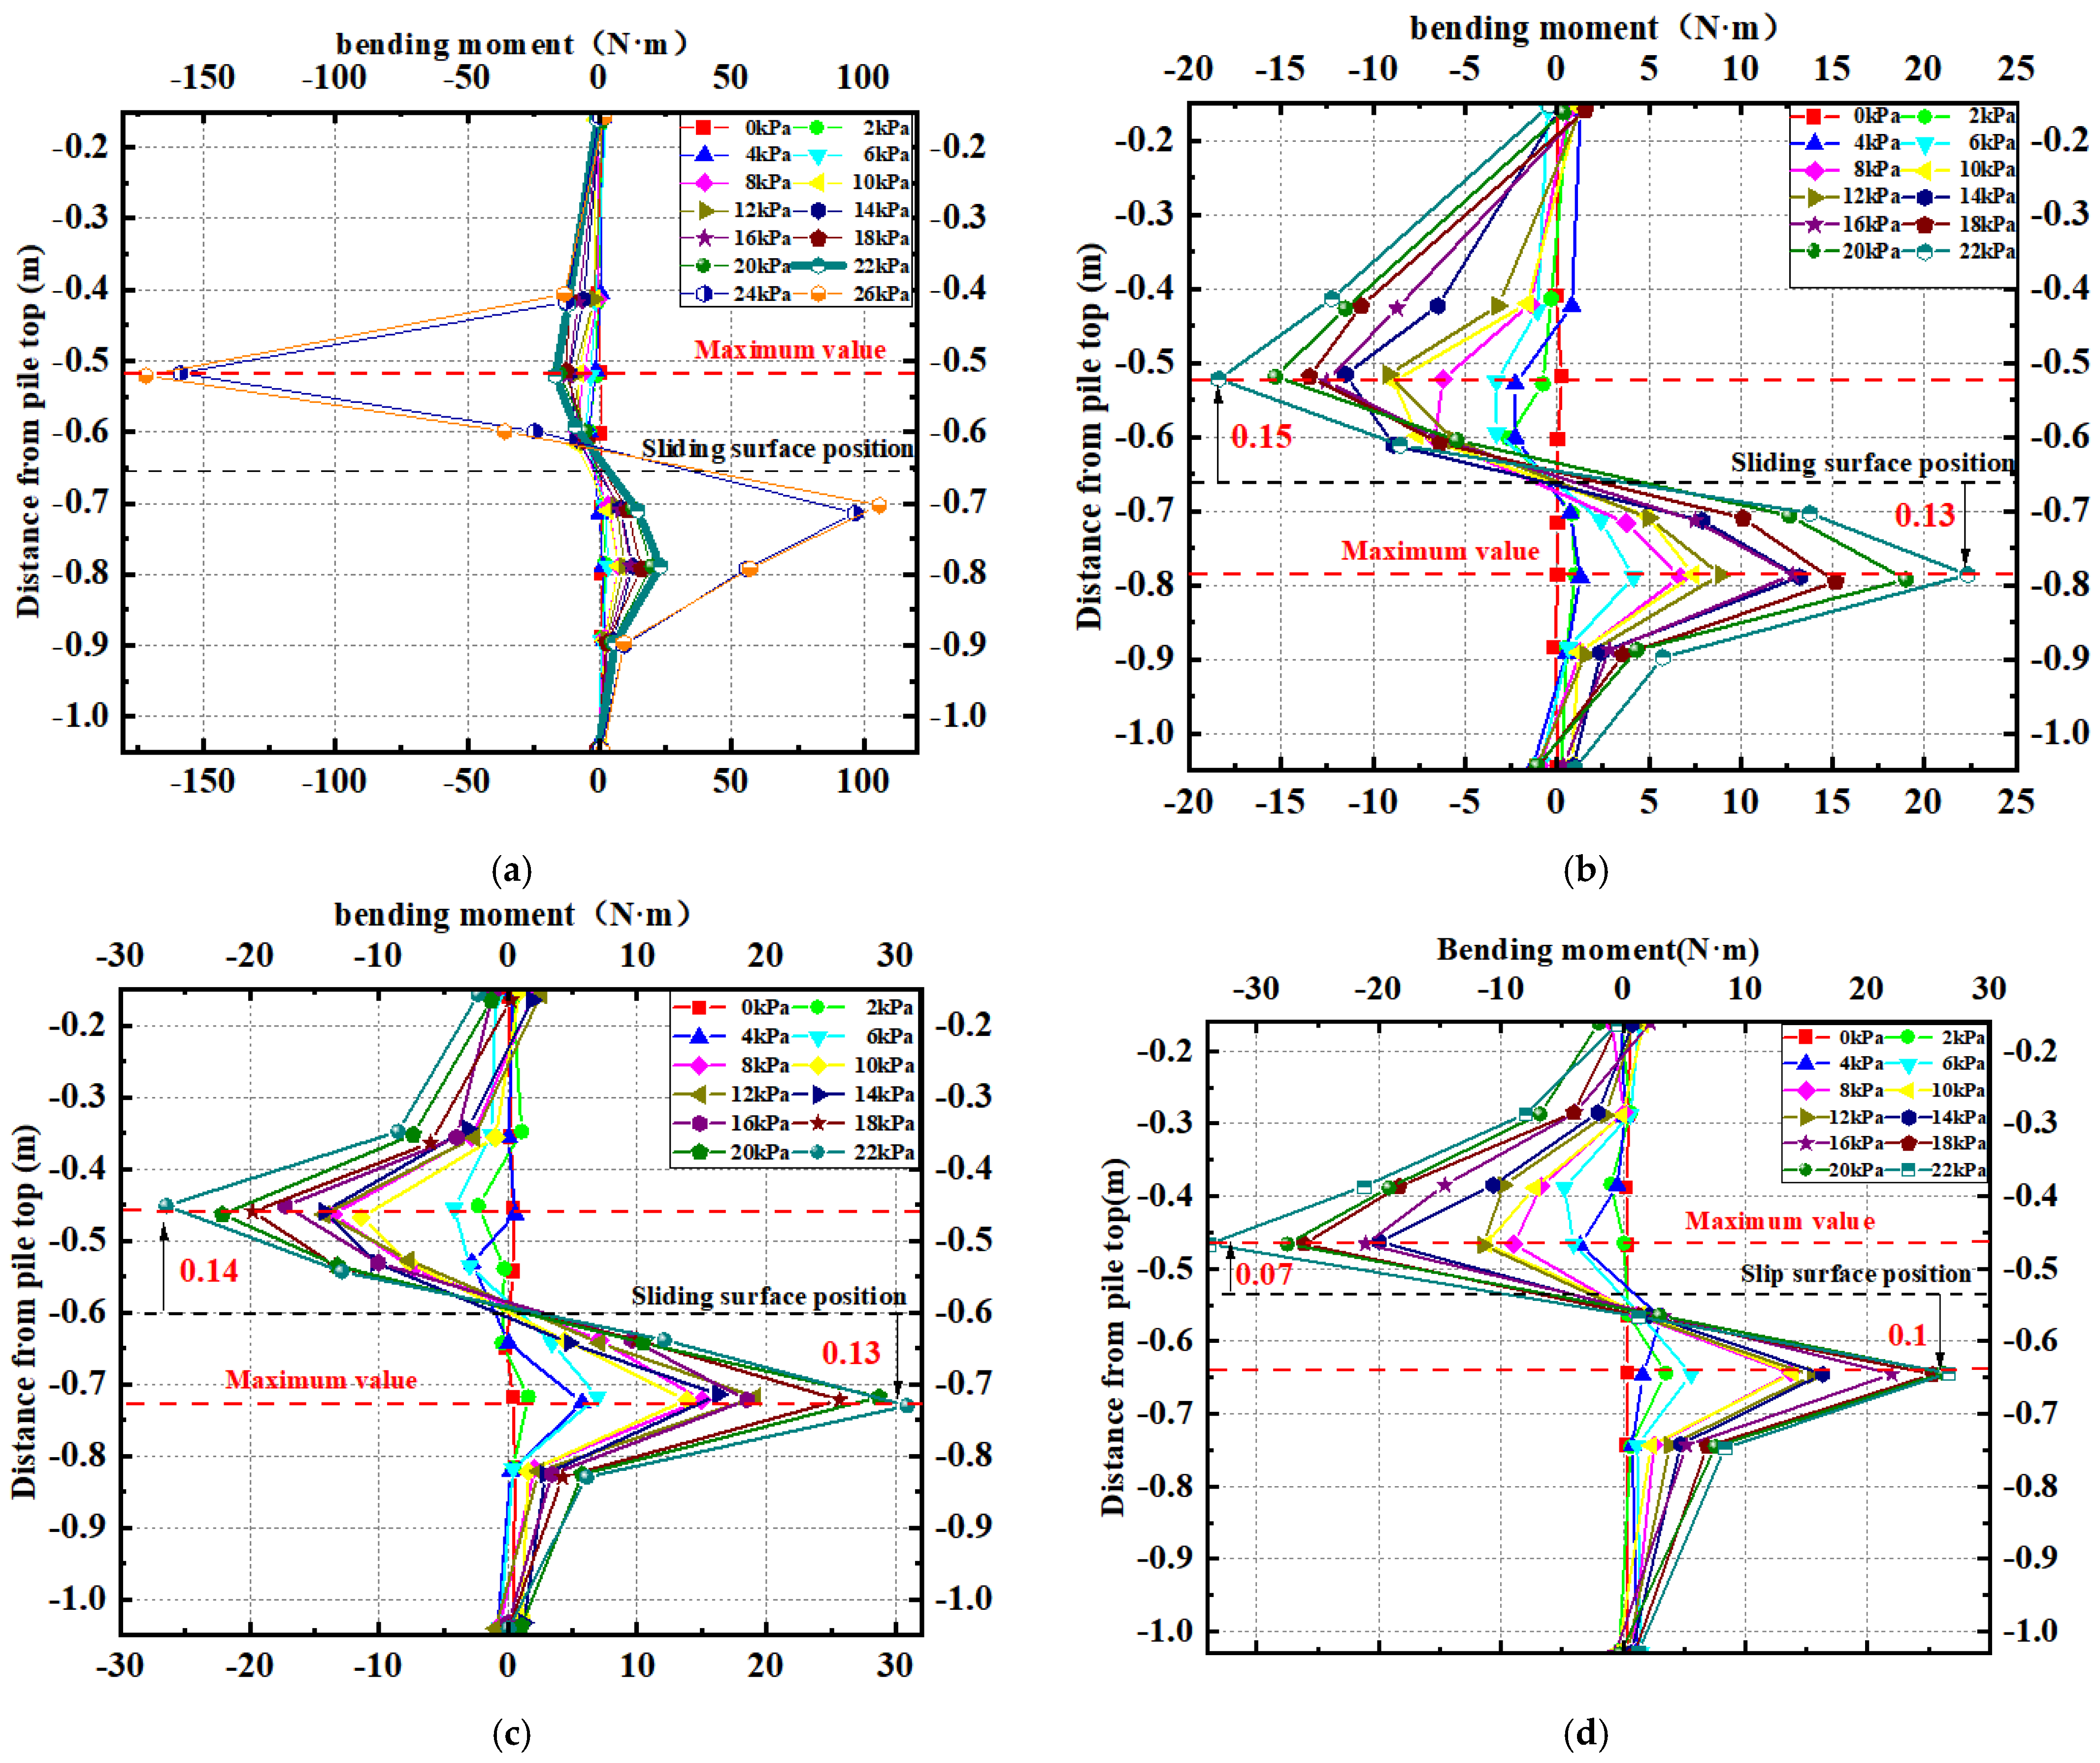
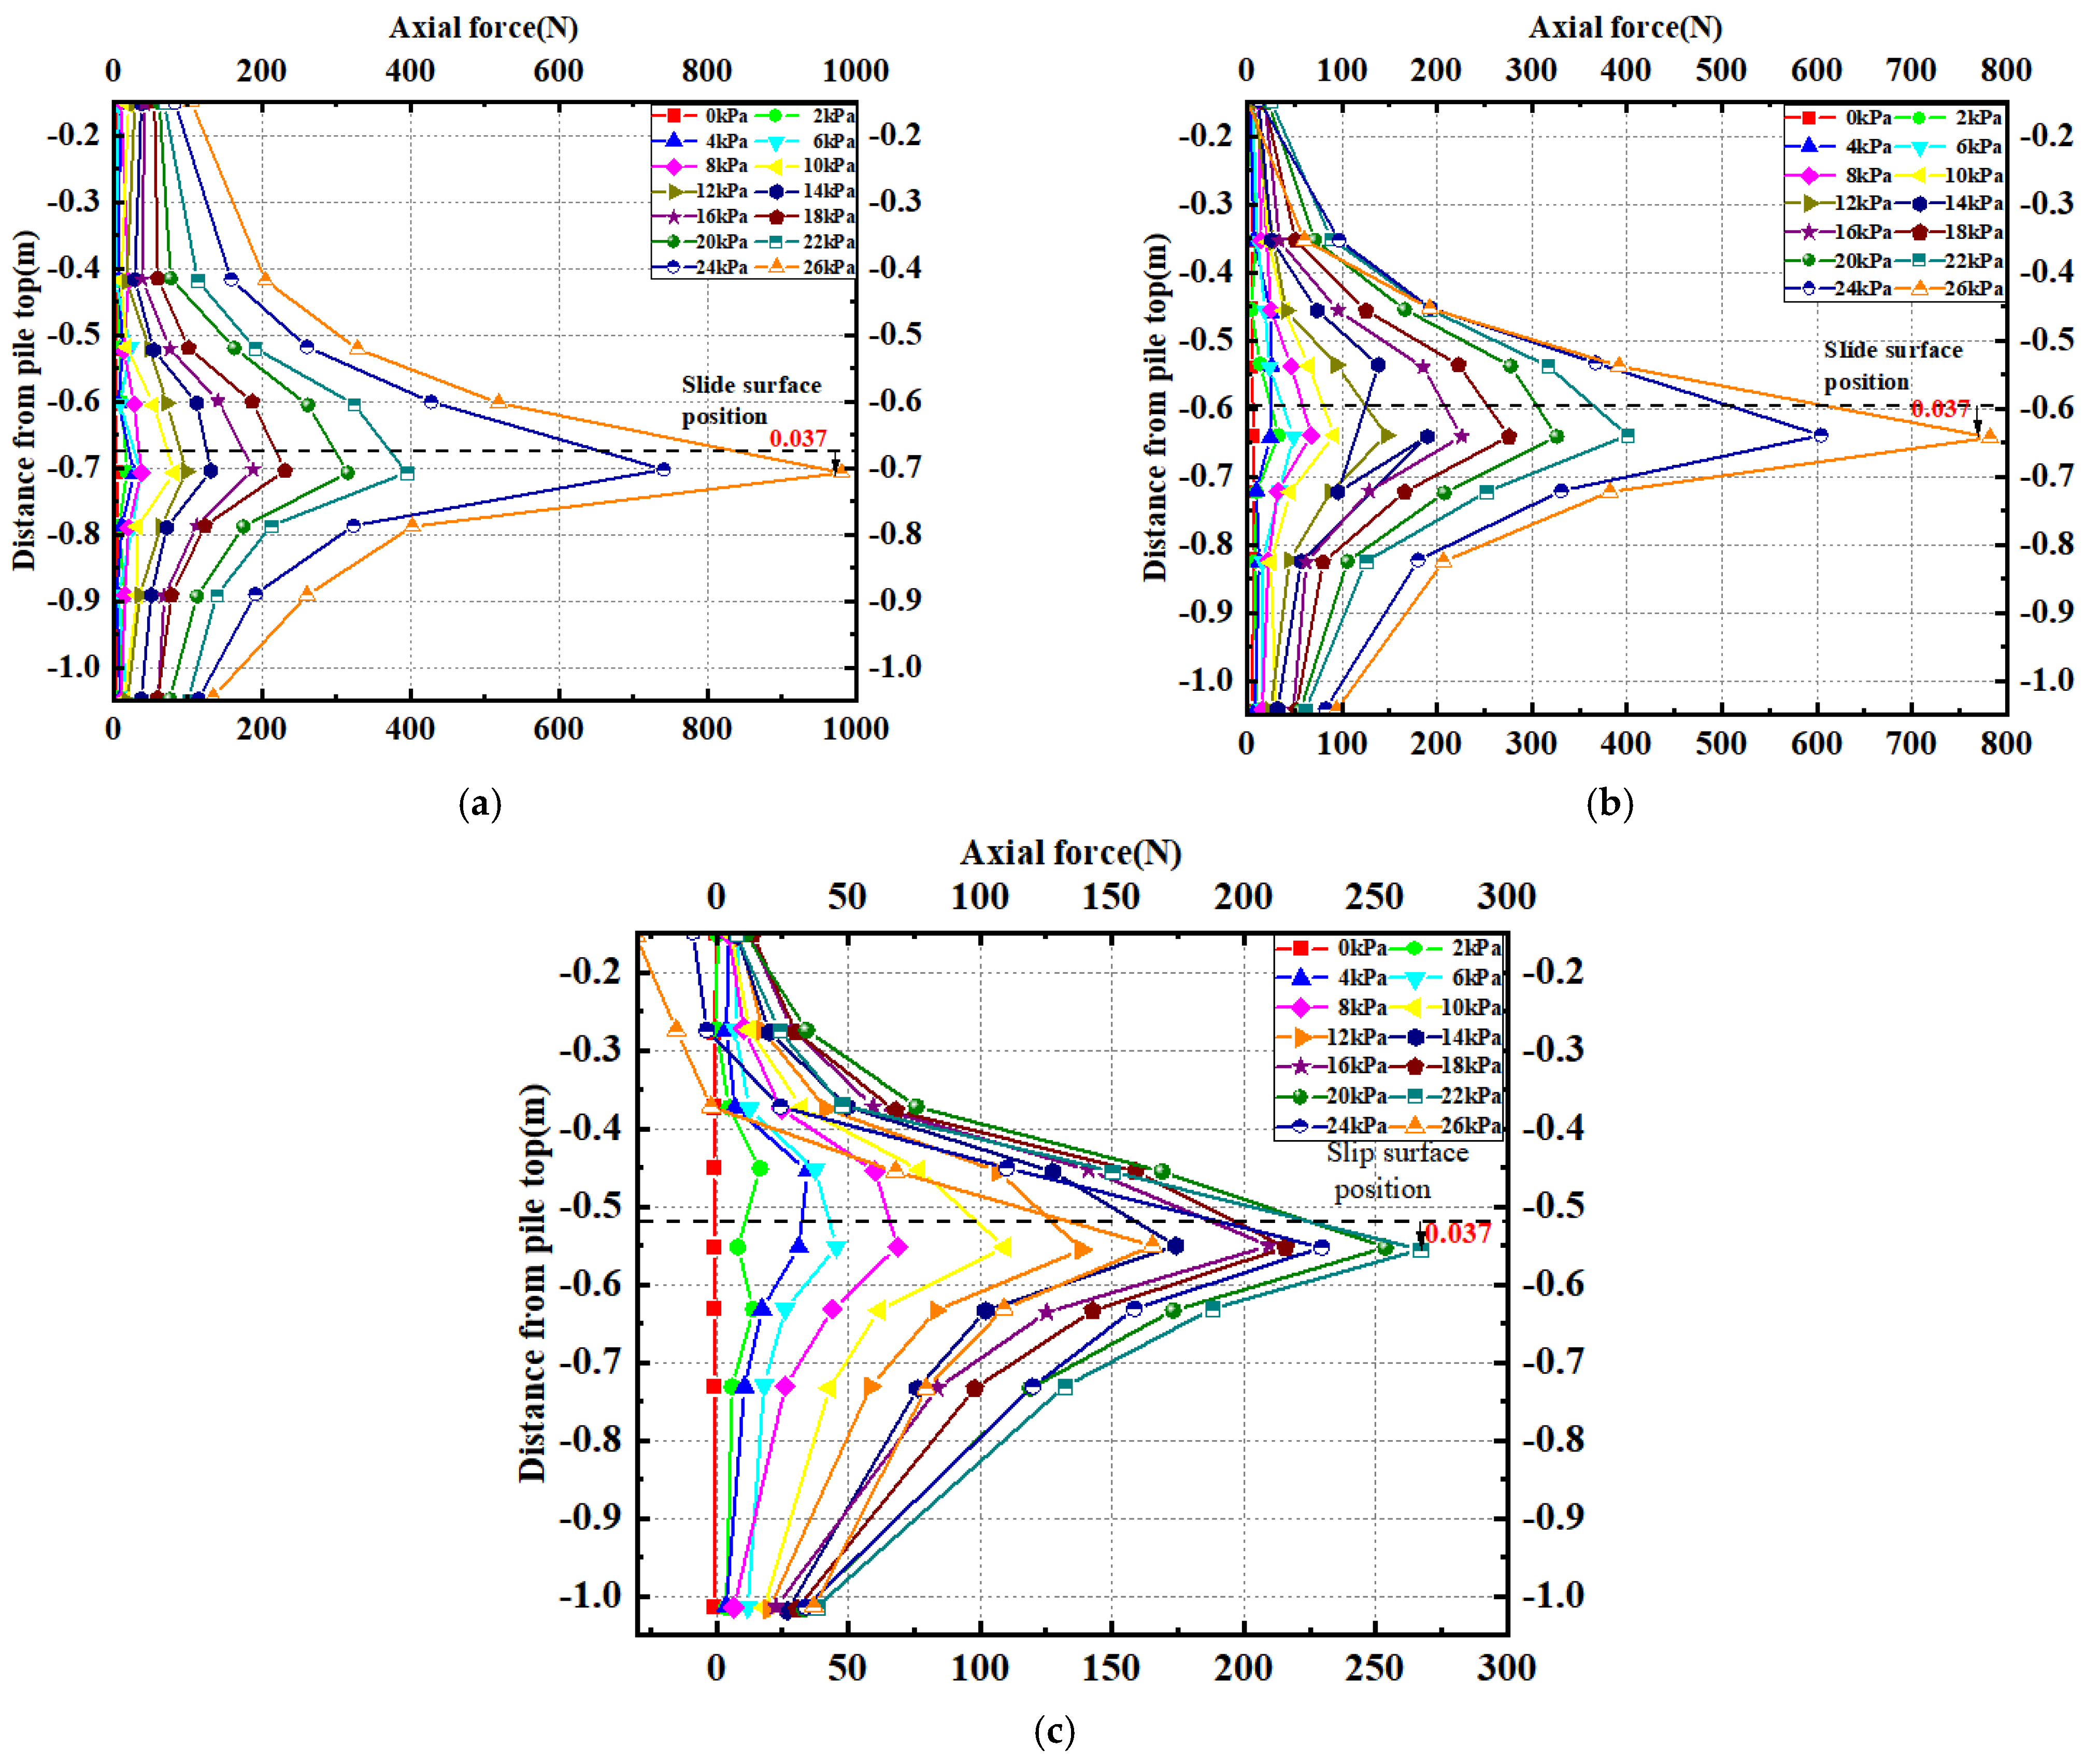
3.4. Analysis of Internal Force Data

As shown in Figure 11, the bending-moment distribution curves of each row of micropiles are presented (with the convention that the tension on the pile body facing the sliding side is positive). Figure 11a shows the bending-moment distribution curve of the #2 pile in the front row, which reveals that the bending moment of the micropile significantly increases after surpassing the critical failure load, and its value is much greater than the maximum bending moment at the critical load of 22 kPa. In order to avoid the influence of the latter two loading conditions on the analysis of the bending-moment distribution of the micropiles, the subsequent data processing removes the loading conditions of 24 kPa and 26 kPa temporarily and only analyzes the conditions before the critical failure load.
As observed from Figure 11b–d, the bending moment of each row of piles increases with the increase in load generally, which is consistent with the load-bearing characteristics of the micropiles discussed in the previous section. The relative magnitude of the bending moment of each row of piles is also closely related to the magnitude of the load it is subjected to, as shown by the fact that the back row of piles has the largest bending moment, followed by the middle row of piles, while the front row of piles has the smallest. The bending-moment distribution pattern of each row of piles is approximately the same, showing “S”-type distribution, and the maximum negative bending moment appears in the section where the pile body is loaded, while the maximum positive bending moment appears in the embedded section of the pile body. For example, the maximum negative bending-moment position of the #2 pile in the front row is about 0.15 m (about 4 times the pile diameter) away from the sliding surface, and the maximum positive bending moment is about 0.13 m (about 3.5 times the pile diameter) away from the sliding surface. The maximum negative bending-moment position of the #6 pile in the middle row is about 0.14 m (about 3.8 times the pile diameter) away from the sliding surface, and the maximum positive bending moment appears about 0.13 m (about 3.5 times the pile diameter) away from the sliding surface. The maximum negative bending-moment position of the #11 pile in the rear row is about 0.07 m (about 2 times the pile diameter) away from the sliding surface, and the maximum positive bending moment appears about 0.1 m (about 2.7 times the pile diameter) away from the sliding surface. It can be also found that the closer the pile is to the back edge of the landslide, the closer the position of the positive and negative bending moments on the pile will be to the sliding surface, indicating that the bending moment of the back row of piles is more concentrated and more prone to plastic damage under load.
Figure 12 shows the axial force distribution curves of each row of mini-piles. It can be seen that under the action of the load, the axial force of the mini-piles mainly exhibits compressive stress. The axial forces in each row of piles are roughly distributed in a “V” shape, and the maximum axial force appears near the sliding surface, which is about 0.037 m (about 1 times the diameter of the pile) below the sliding surface. The relative magnitudes of the axial forces of each row of mini-piles differ greatly from the bending-moment curve, showing that the axial force of the front row of mini-piles is greater than that of the middle row, which is greater than that of the rear row. For example, at a load of 22 kPa, the maximum axial force of the front row of mini-piles is about 394.6 N, the middle row is about 390.7 N, and the rear row is only 276.6 N. The reason for this phenomenon can be explained by the tension and compression of the mini-piles. Comparing (a), (b), and (c) in Figure 12, the #2 pile in the front row is under compression at all levels of load; when the load increases to 26 kPa, the #6 pile in the middle row is under local tension, located near the top of the pile, while the #11 pile in the rear row is under local tension near the top of the pile when the load increases to 24 kPa, and the maximum axial force also decreases as the load increases. Therefore, it can be seen that because the sliding surface line of the pile section is not horizontal, the landslide thrust acting on the pile body also tilts with the sliding surface, and the mini-pile is not a completely horizontally loaded pile. The landslide thrust has a vertical component, which makes each row of piles basically show a state of compression. However, due to the deformation of the landslide body, each row of piles does not deform completely in coordination, which makes the rear row of piles with excessive deformation tend to experience tension and to some extent offsets the compressive stress of the pile body, thus resulting in the phenomenon that the axial force decreases as the load increases. Therefore, it can be seen that since the sliding surface line of the pile section is not horizontal, the landslide thrust acting on the pile body also tilts with the sliding surface, so the miniature piles are not completely horizontal force piles. This makes the landslide thrust have a vertical component, which makes each row of piles basically present a compressed state. However, due to the deformation of the landslide body, the deformation of each row of piles is not coordinated completely, which makes the rear pile with excessive deformation prone to tension, and to a certain extent, offsets the compressive stress of the pile, resulting in the phenomenon that the axial force decreases with the increase in the load. Many projects combine micropiles and anchors [21,22], but ignore the anchoring effect of the deformation of the micropiles themselves. At the top of the pile, due to the presence of the connecting beam, the top of the pile has a reliable fulcrum, so the upper part of the pile shows a tensile state. This also reflects to some extent that when mini-piles are used for landslide control, they do not completely fail after bending and shearing, but continue to resist the further deformation of the landslide in the form of tension and compression.

4. Numerical Simulation Study of Static Forces

4.1. Models and Parameters

(1)
The establishment of the static load test model is described in this paragraph.
According to the dimensions of the prototype model, a FLAC3D computational model was built, as shown in Figure 13a. The mesh was primarily composed of hexahedral elements and supplemented by wedge elements, with a total of 313,252 nodes and 294,630 elements. The micropiles were simulated by using pile elements, and the connecting beams were simulated by using shell elements. As shown in Figure 13b, a rigid connection was established between the pile elements and shell elements.
The dimensions of this 3D test model are modeled at a 1:1 scale with the original geotechnical experimental model. The 3D modeling at this scale allows for intuitive acquisition and adjustment of dimensions and parameters, making both consistent and the numerical simulation results more accurate. Based on the simulated and experimental stress and displacement results, the parameters were calibrated and several comparisons and adjustments were made, making the established 3D model more reliable and consistent with the stress–strain behavior of the material. The final calibrated parameters are shown in Table 4.
(2)
The values of the simulation parameters are as follows.
The parameter values of the soil in the numerical simulation are based on the results of geotechnical tests. In addition, the cohesive force between the two layers of plastic film is assumed to be zero, and the internal friction angle is adjusted until the safety factor reaches 1.0, thus determining the parameter value of the sliding surface. The obtained parameter values are shown in Table 4.
The calculation parameters for structural elements are obtained based on the actual material parameters of the model, and the specific values are shown in Table 5.
(3)
Calculation criteria
The numerical simulations in this chapter mainly involve static numerical simulations, so only the self-weight of the model and the loading at the top of the slope are considered. During the calculations, normal displacement constraints are applied to the boundaries around the model, while the bottom is fully fixed. The initial stress equilibrium is obtained through the elastic method, followed by calculations using the Mohr–Coulomb constitutive model until convergence is achieved. The loading conditions of the model are designed to be the same as those in the experiment and will not be repeated here.
(4)
Measurement point arrangement
To correspond with the experiment, the layout of the measuring points in the numerical simulation is the same as that in the model test. However, in order to reduce errors caused by boundary effects in the numerical simulation, the #7 mini-pile was used as a representative of the middle row of piles to analyze, and the other test piles were positioned in the same way as in the experiment.

4.2. Displacement Data Analysis

In the numerical simulation study, the deformation of the pile body was further investigated. As shown in Figure 14, the load displacement curve was obtained by monitoring according to the static test. It can be seen from the figure that, similarly to the results of the model test, the horizontal displacement at the foot of the slope increases continuously with the increase in the load, and suddenly increases at 22 kPa sharply, and the displacement at the foot of the slope is about 50 mm after the loading calculation is completed. The displacement change law with the load is similar to the experimental results.
Further extraction of the deformation of the micropiles was conducted and is presented in Figure 15. It can be found that the deformation mode of the micropile body is mainly the bending deformation near the sliding surface. As the load increased, the bending deformation of the pile body near the sliding surface also increased. Overall, the three rows of piles showed similar deformation patterns, but there were slight differences. As shown in Figure 15a, the upper loaded section of the front-row piles basically maintained a coordinated deformation in a nearly vertical state until the load reached 18 kPa, but with further loading, the deformation at the top of the loaded section increased and the pile body tilted towards the sliding direction of the slope. As shown in Figure 15b, the deformation of the middle-row piles in the loaded section was basically coordinated and the pile body was generally not inclined. Observing the displacement curve of the rear-row piles shown in Figure 15c, it can be found that the deformation of the pile body in the loaded section was more complicated. When the load was small, the pile body remained basically vertical, but when the loading progressed, the displacement near the sliding surface gradually increased. Due to the constraint effect of the connecting beam at the top of the micropile, it cannot deform coordinately, and thus, the pile body in the loaded section tended to tilt towards the inside of the sliding slope.

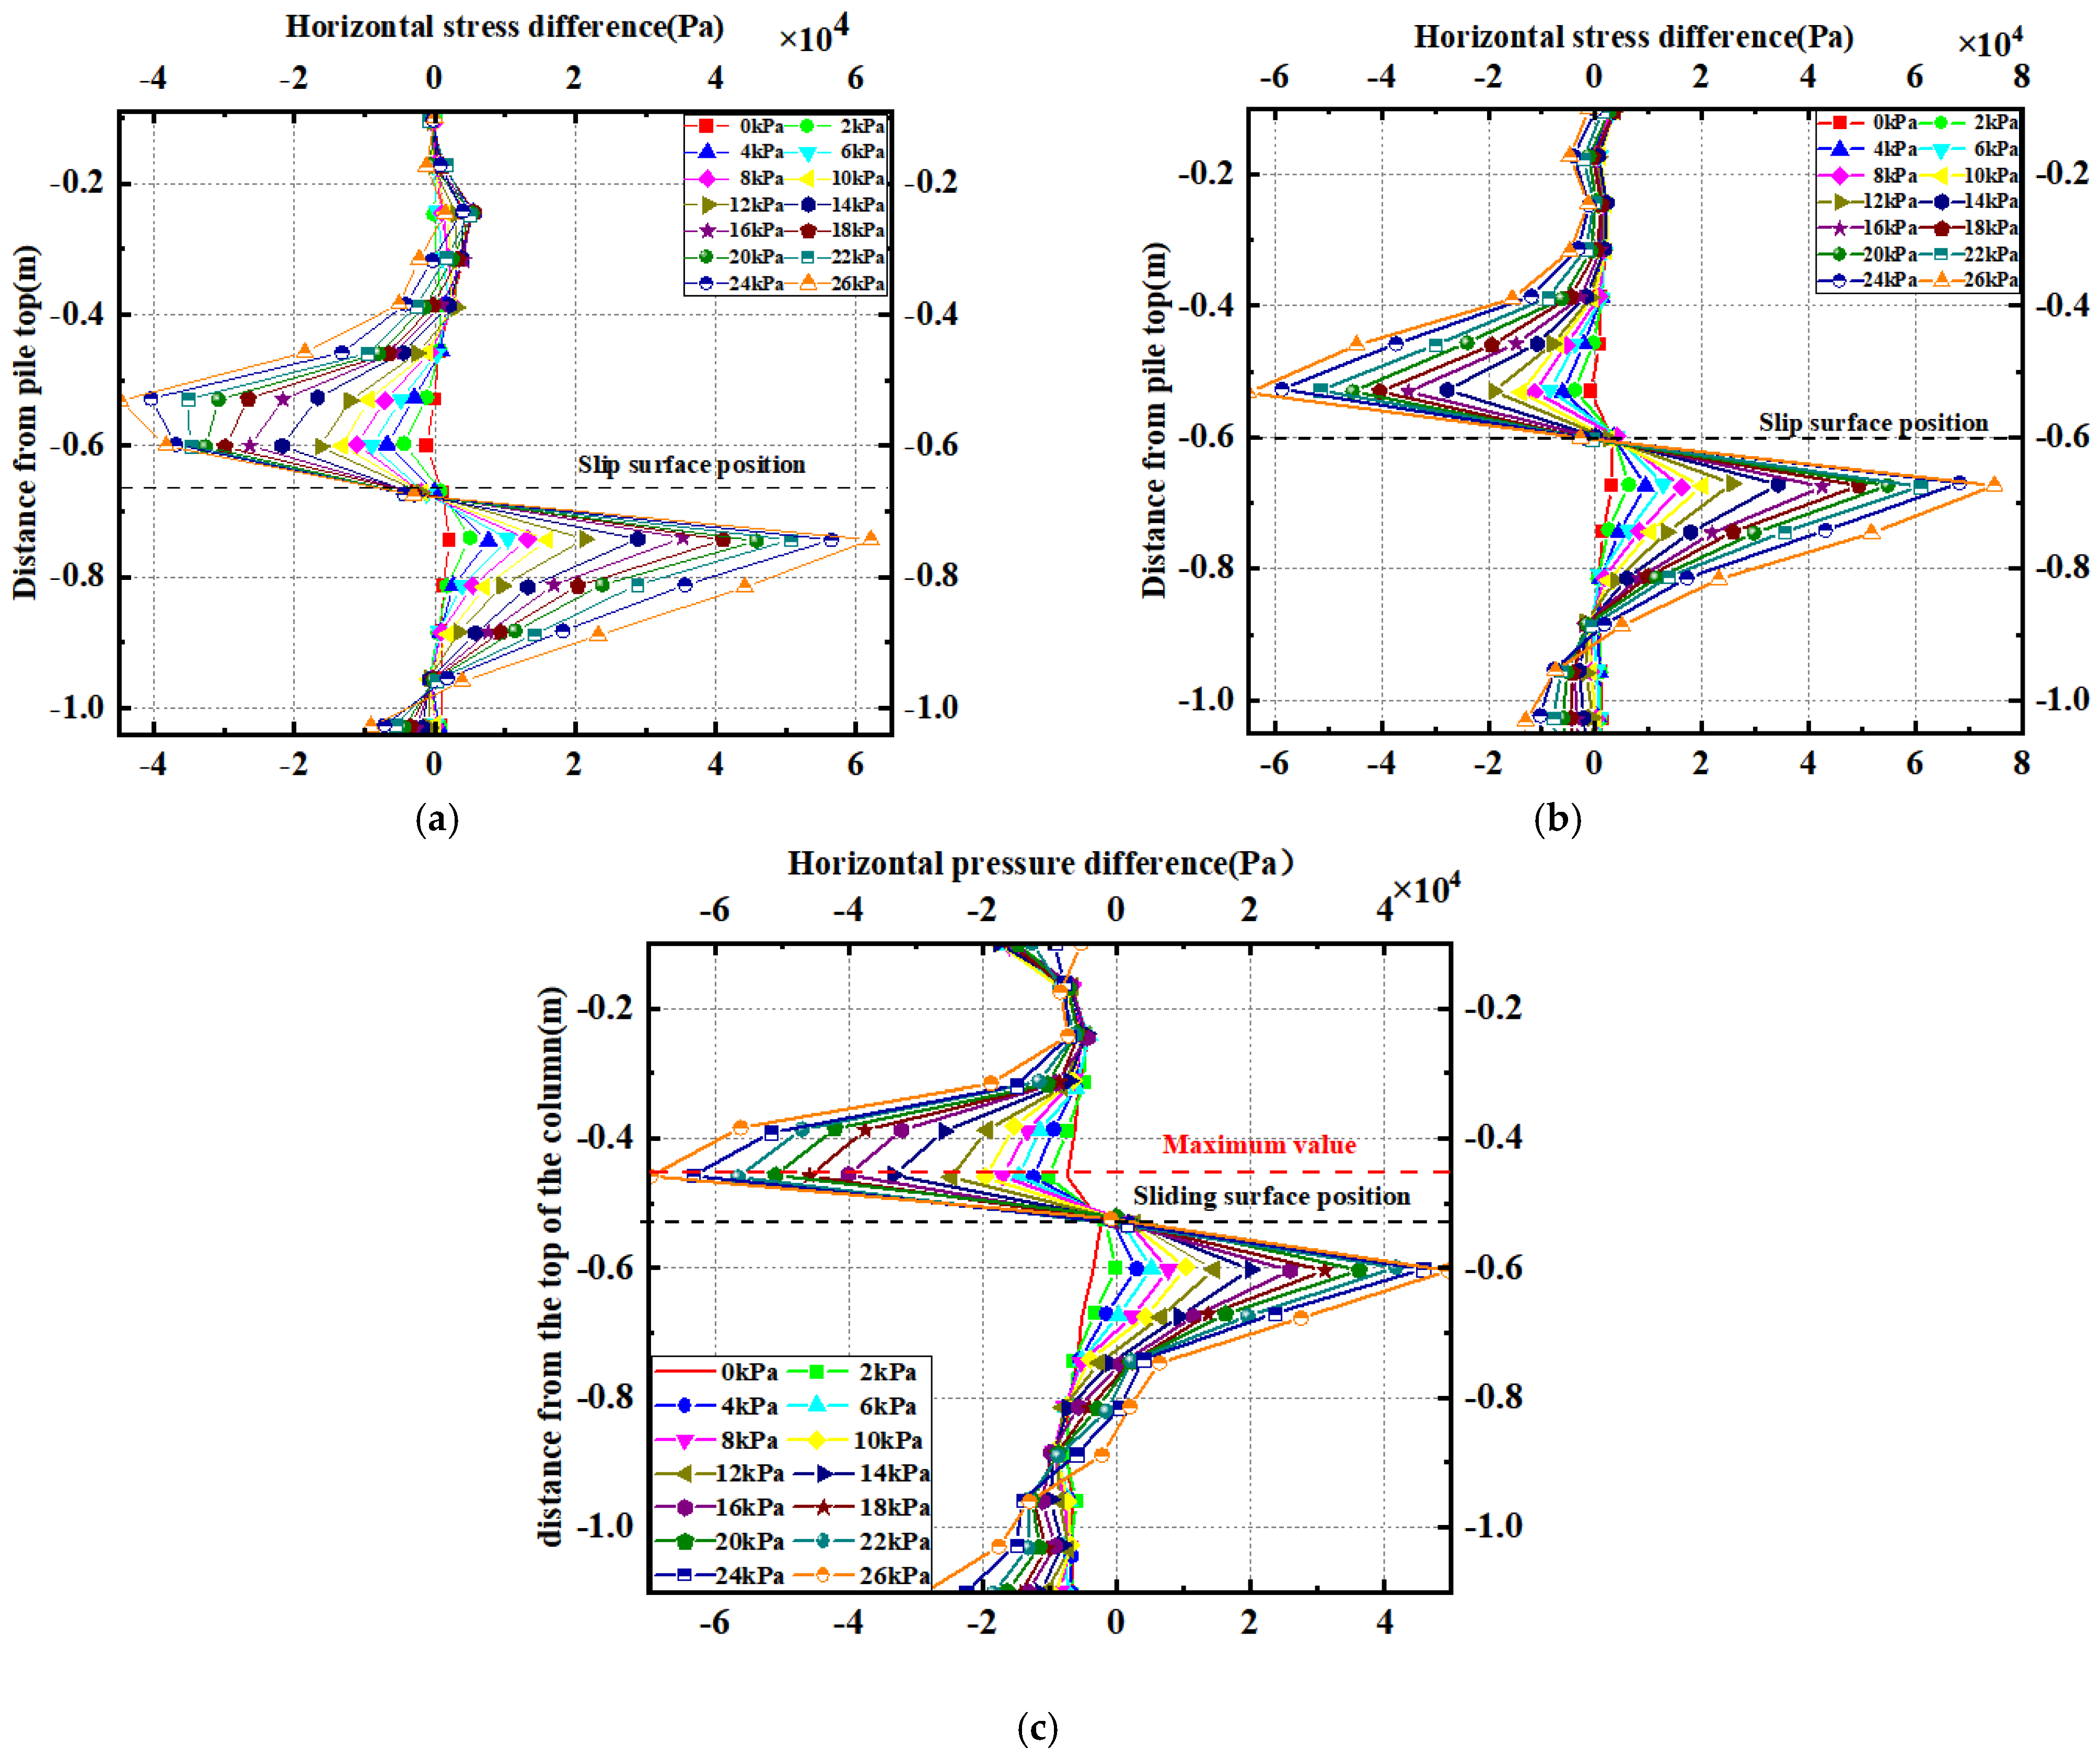
4.3. Earth Pressure Data Analysis

To further verify the load-sharing effect of the micropiles at different positions on the landslide, first, numerical simulation technology was used to extract the soil’s horizontal stress data before and after the pile, and then the difference treatment was carried out, and the plot was made according to the length of the pile body, as shown in Figure 16. It can be seen from the figure that the difference in horizontal stress between the front and back of the pile body was approximately triangular in distribution both above and below the sliding surface, and it increased with the increase in the load.
The proportion distribution of the horizontal stress difference near failure is also calculated for the data in Figure 16, and the results are shown in Table 6. As seen from the table, the proportion of landslide thrust shared in each row of micropiles is much the same in the numerical simulation, and the approximate ratio is back-row piles: middle-row piles: front-row piles = 0.38:0.37:0.25. This ratio is not much different from that of the model test.

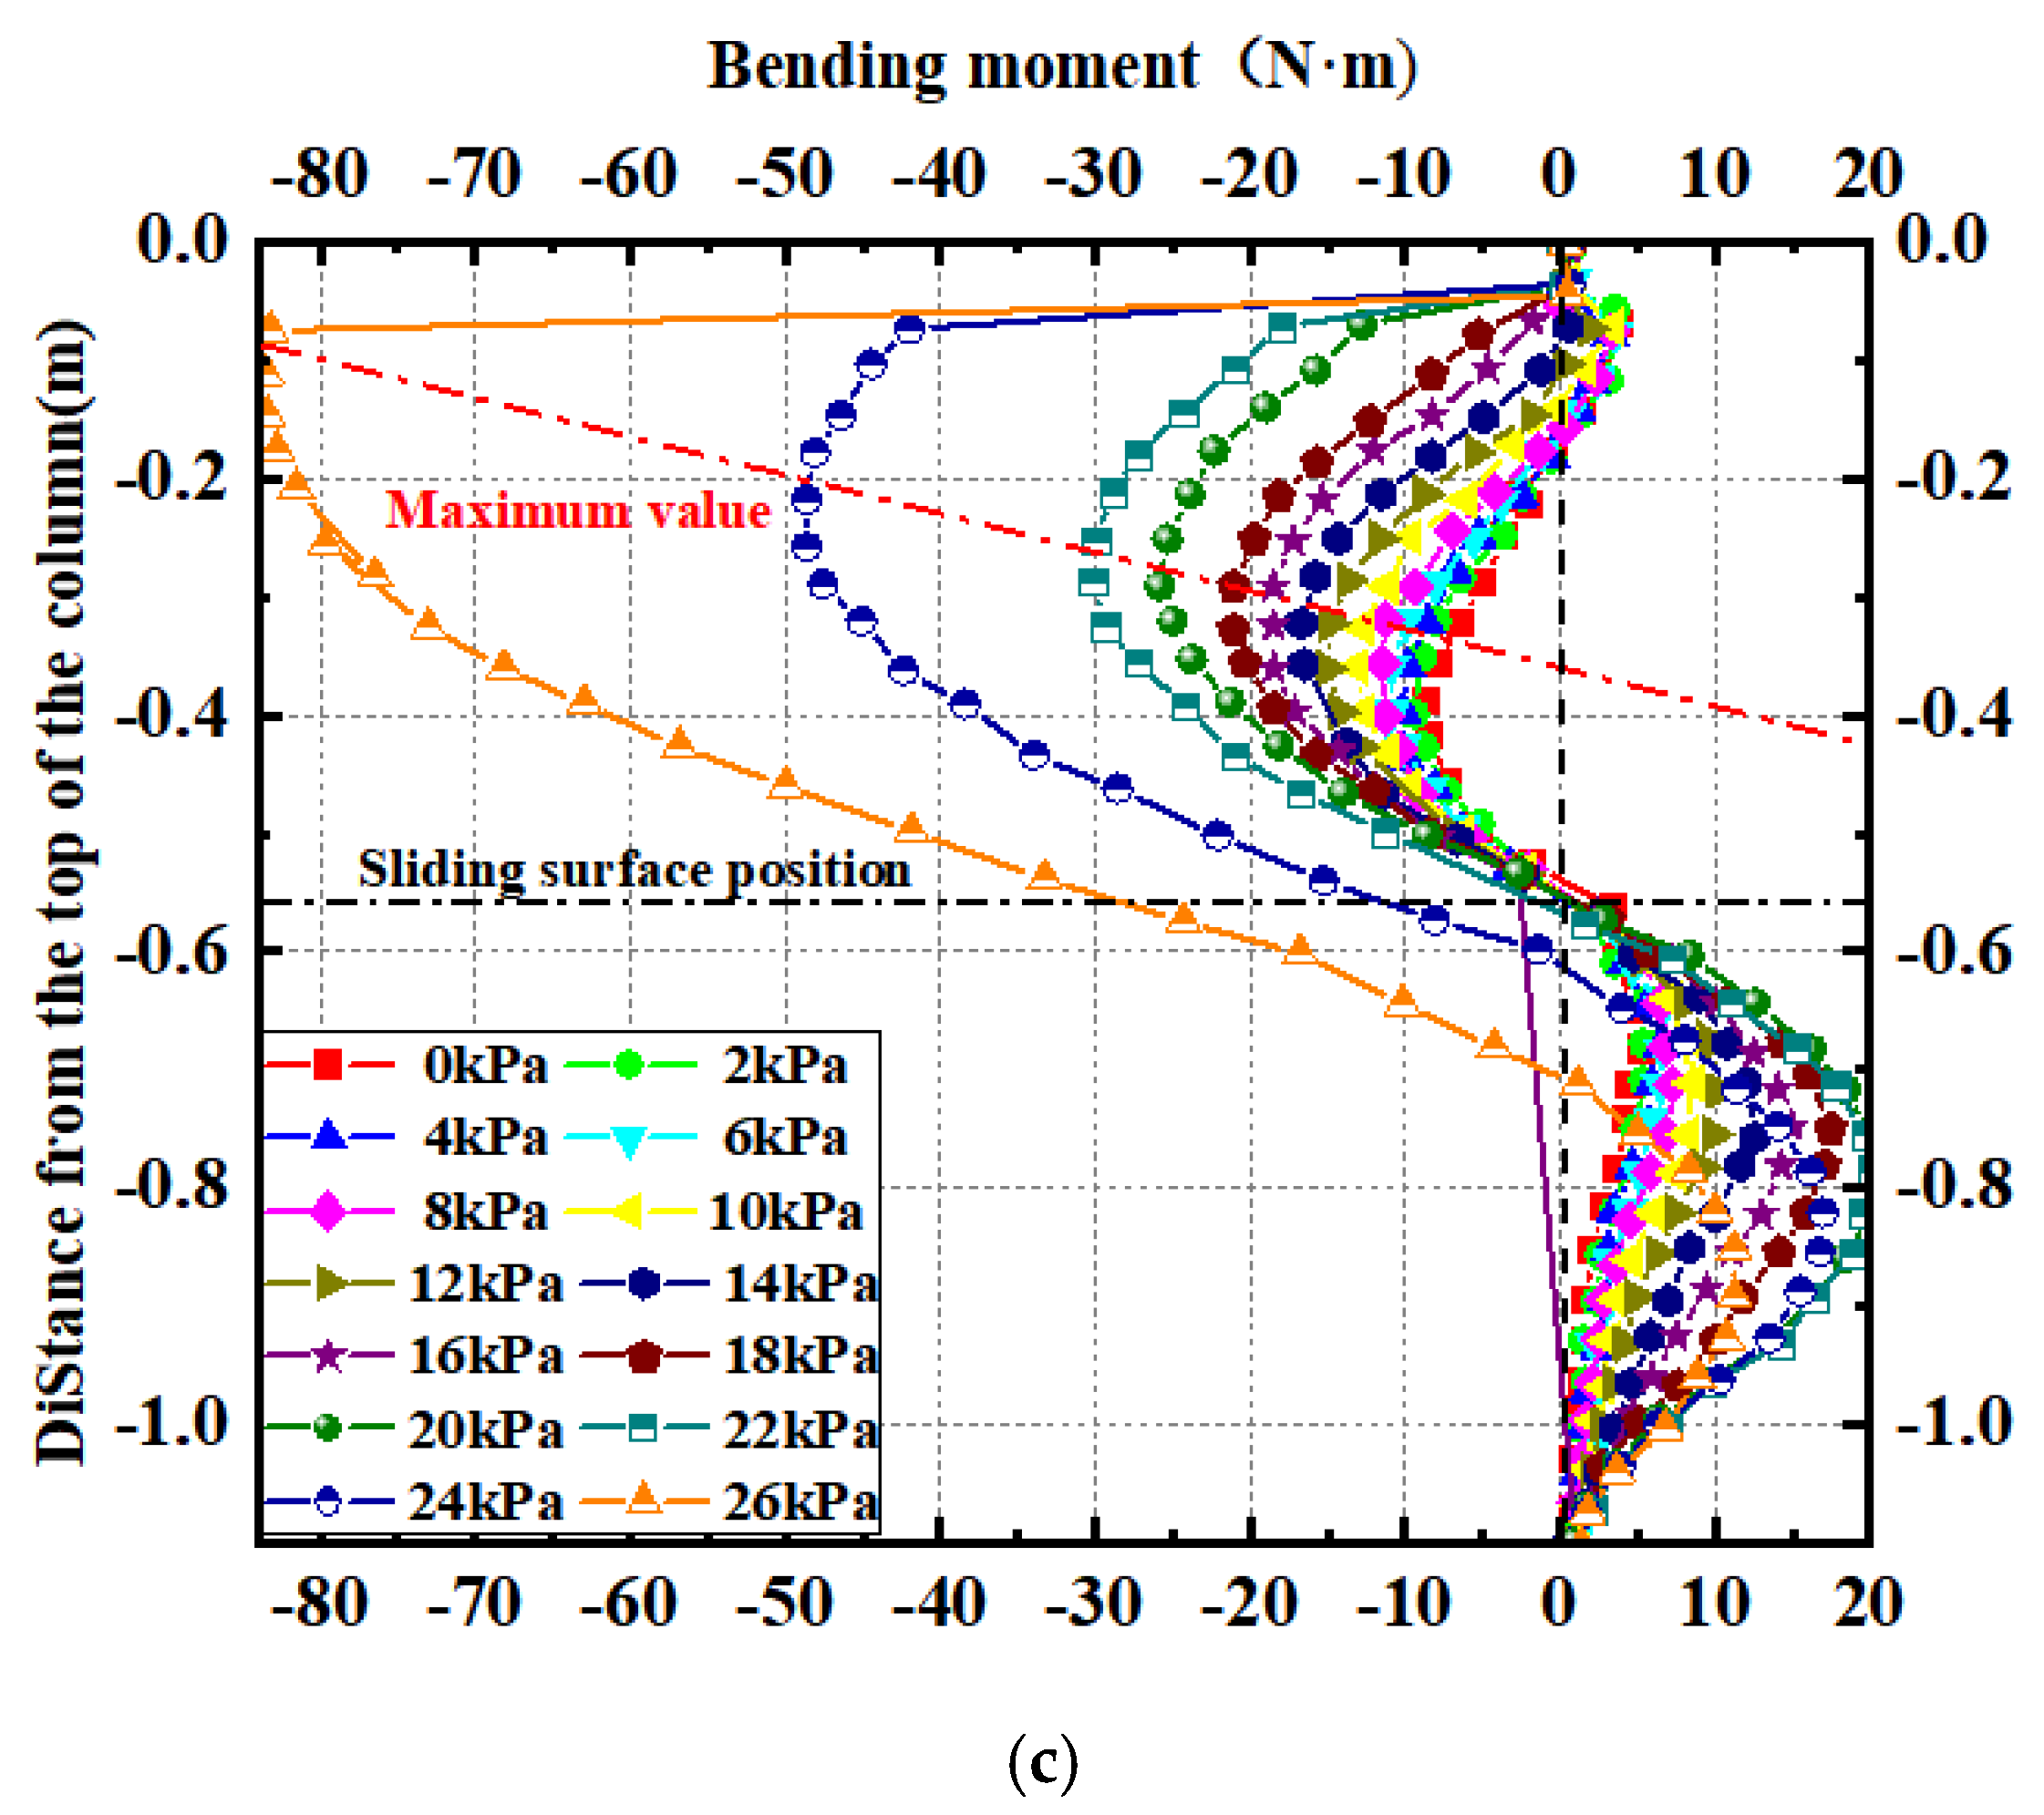
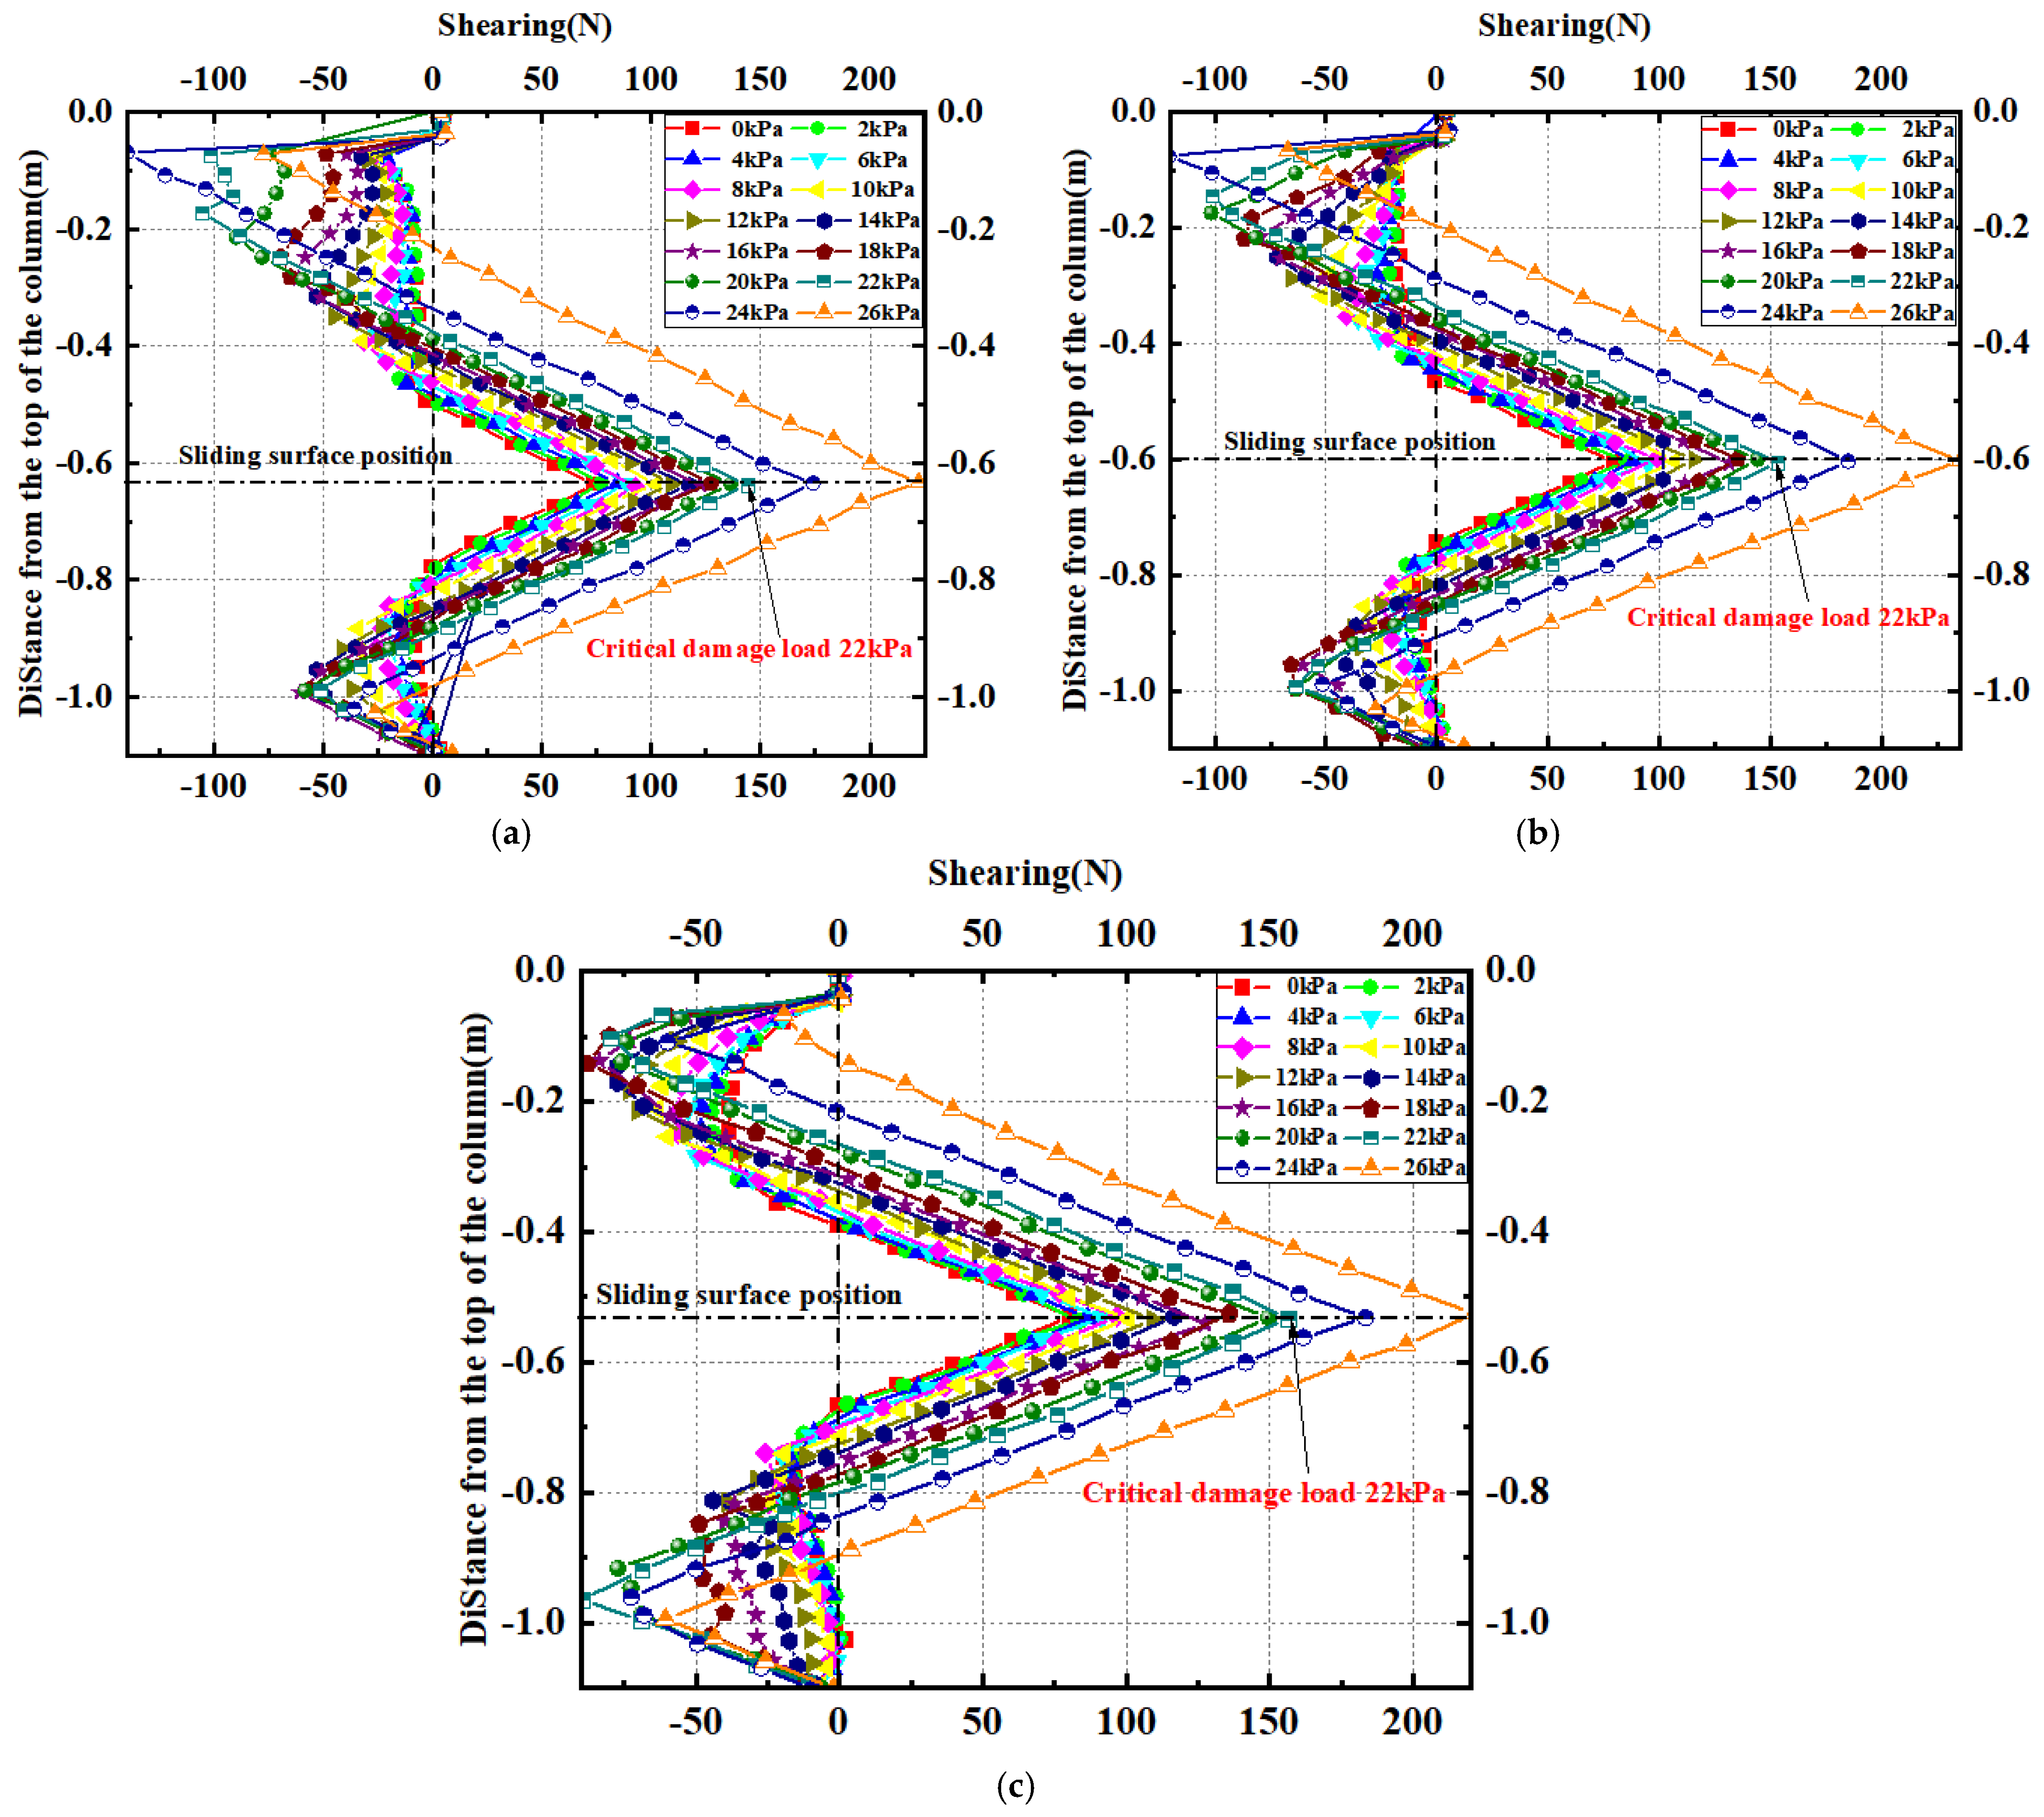
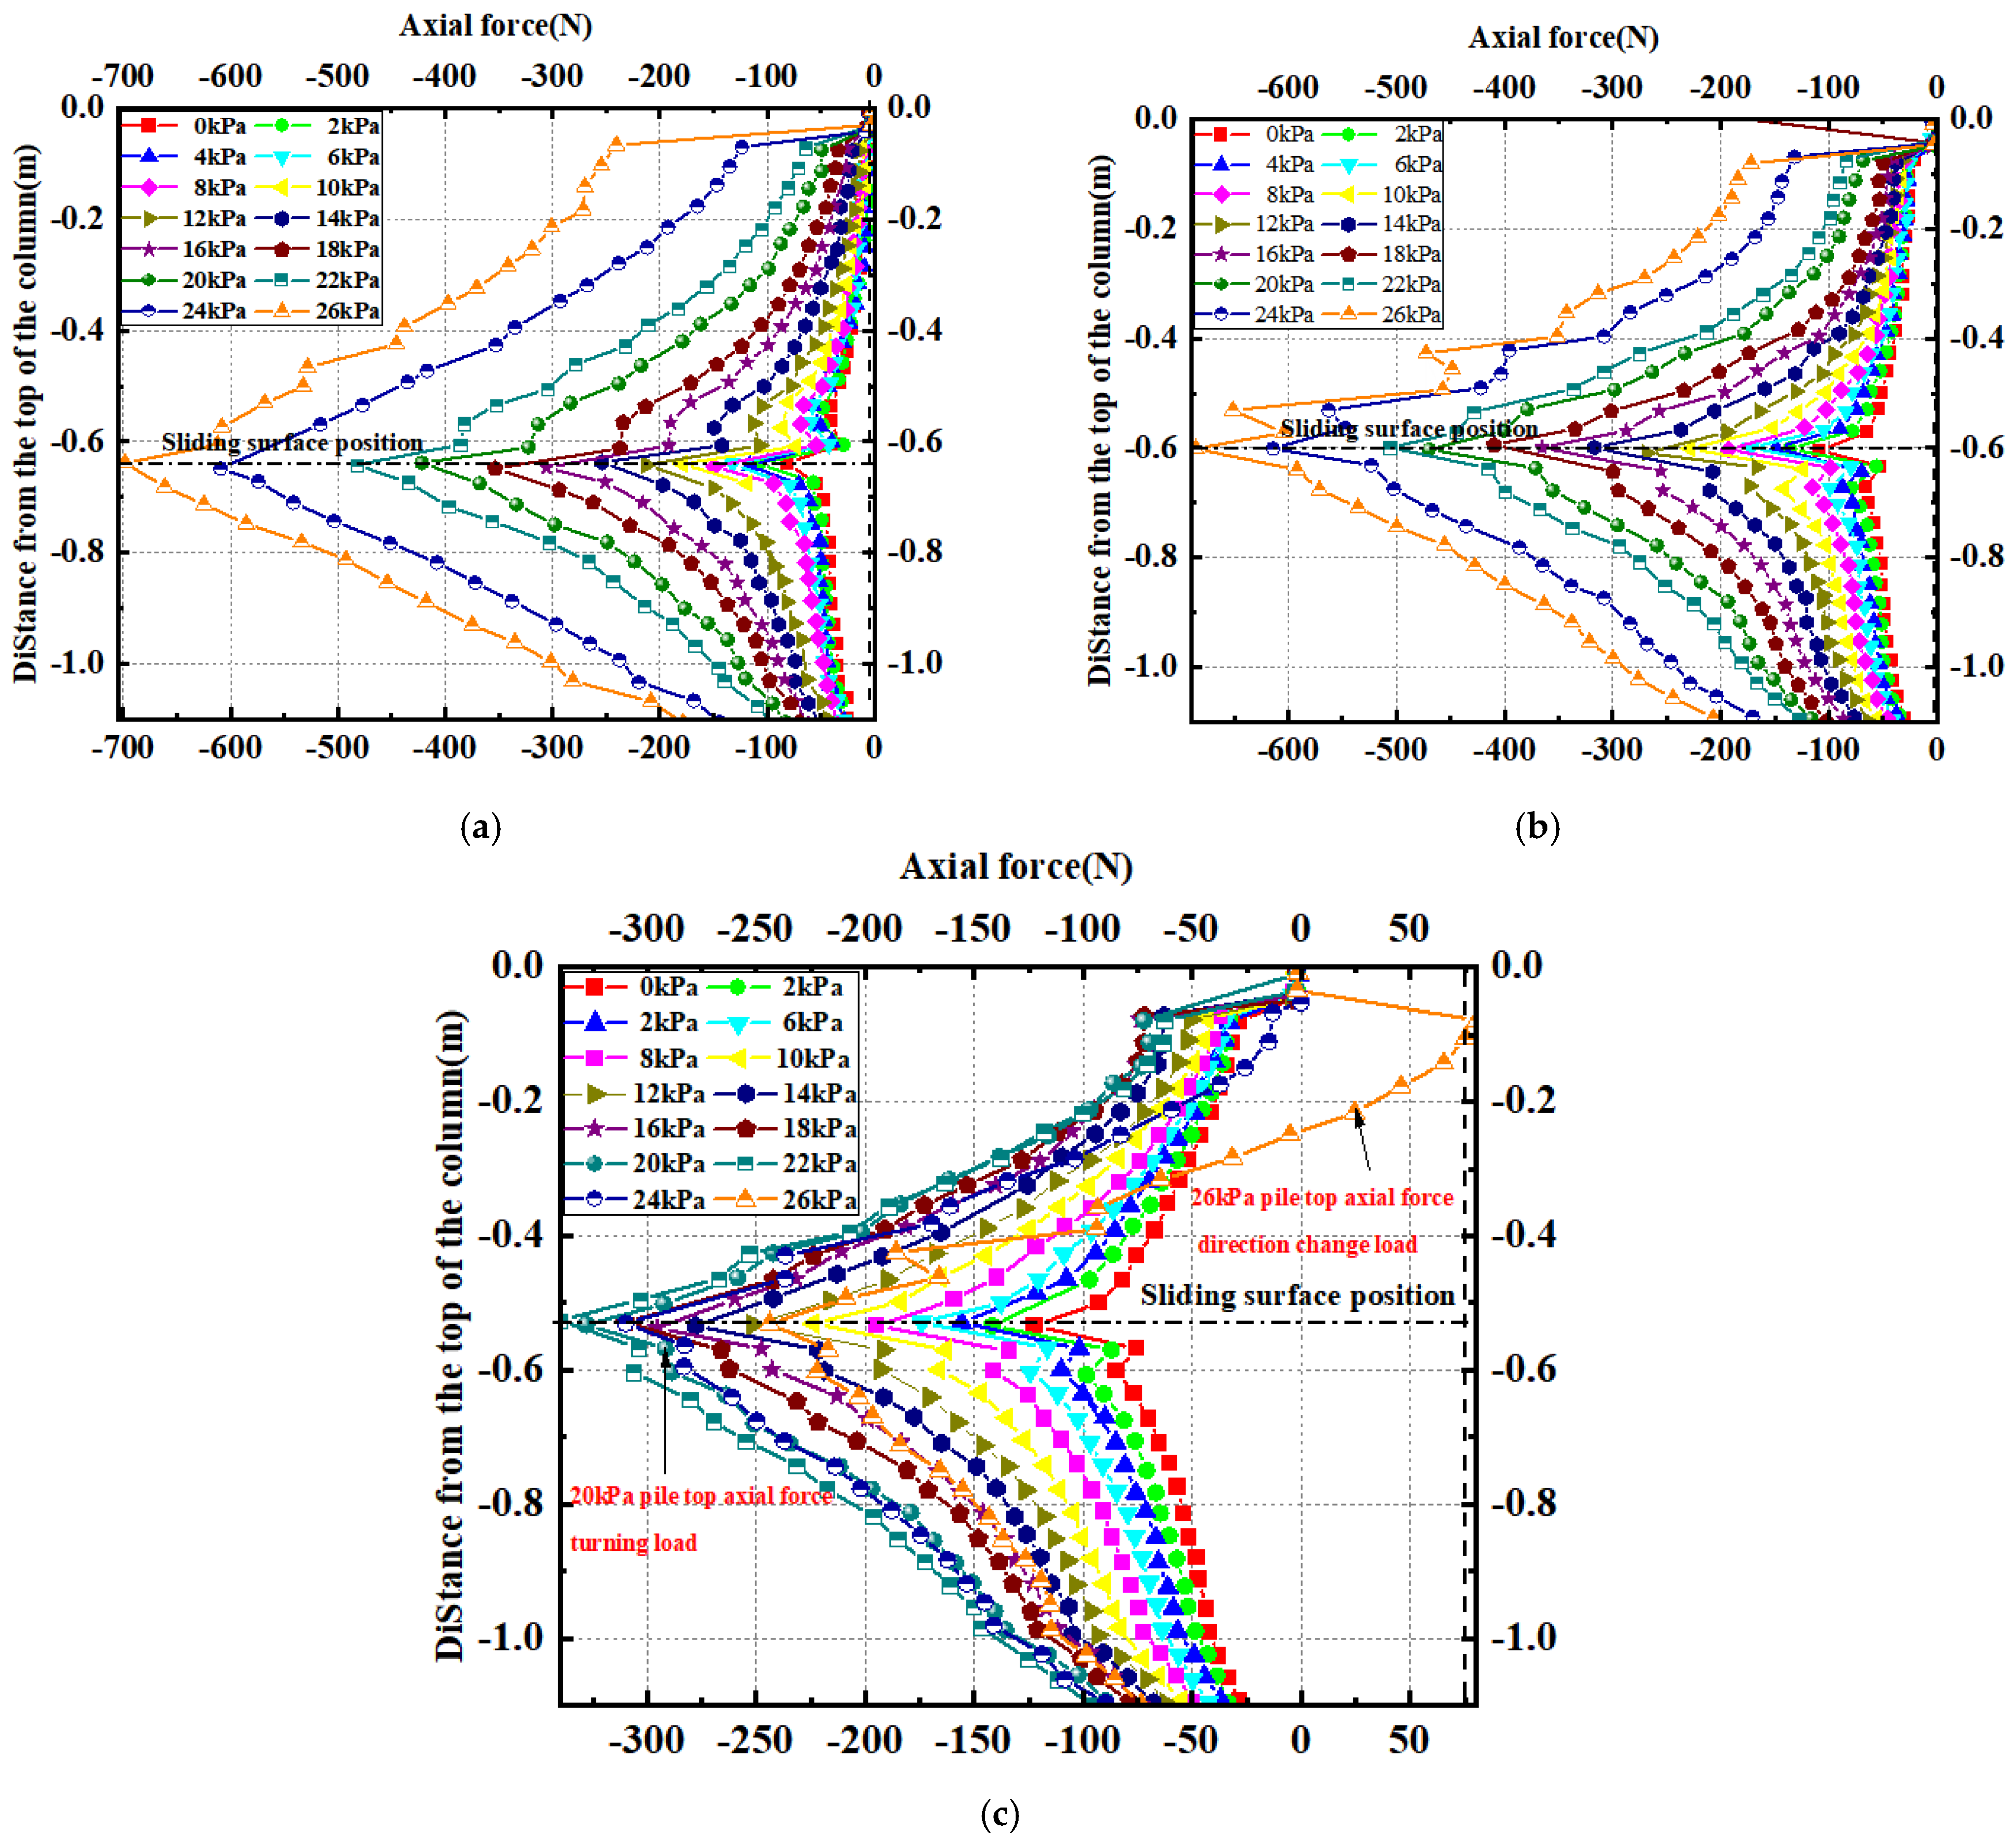
4.4. Analysis of Internal Force Data

The extracted bending-moment distribution curves of each row of mini-piles are shown in Figure 17. It is conventionally agreed that tension on the leading side and compression on the sliding side are positive. As can be seen, similar to the model test results, the bending moment of the pile body under each load level shows an S-shaped distribution. In terms of numerical values, the maximum bending moment of the rear-row piles is slightly larger than that of the middle-row piles and significantly greater than that of the front-row piles. This is consistent with the load-sharing situation of each row of piles mentioned in the previous section. As for the distribution of bending moments, the maximum negative bending moment of each row of mini-piles appears within the range of 0.15 m to 0.37 m above the sliding surface (approximately 4 to 10 times the diameter of the pile), and the position of the maximum negative bending moment gradually increased with the increase in load. The maximum positive bending moment appears within the range of 0.10 m to 0.28 m below the sliding surface (approximately 3 to 8 times the diameter of the pile), and its position gradually decreased with the increase in loads. It can be seen that when the load is within a certain range (≤16 kPa), the boundary between the positive and negative bending moments of the pile body is approximately at the sliding surface. As the load increases, the deformation of the sliding-bed soil near the sliding surface increases, causing the resistance provided by the embedded section of the pile body to decrease, and the boundary between positive and negative bending moments also moves downward.
The bending-moment distribution curves obtained from the numerical simulations are smoother and show more detailed characteristics than those from model tests. However, the differences between them are also obvious. Compared with the bending-moment curves measured in the experiments, the distribution range of the positive and negative bending moments in the simulation results is broader. It can be clearly observed that there is a concentrated bending moment at the connection between the top of the pile with the crossbeam due to the presence of the connecting beam. This phenomenon is particularly prominent when the load exceeds the failure load, indicating that the effect of the connecting beam at the top of the pile should not be underestimated.
The shear force distribution curves of each row of piles are shown in Figure 18. The shear force distribution pattern of each row of micropiles is basically the same. With the increase in load, the shear force of each row of micropiles gradually increases. Before reaching the critical failure load of 22 kPa, the maximum shear force of the rear row of piles is greater than that of the middle and front rows, and the maximum shear forces of the middle and front rows are close to each other. However, after the rear row of piles enters the failure stage, the increase in shear force of the front and middle rows exceeds that of the rear row, and their maximum shear forces are higher than that of the rear row in terms of numerical value. In addition, there are significant differences in the shear force magnitude at the connection between the pile top and the connecting beam of the micropiles in different rows. Specifically, the maximum shear force of the front row of micropiles is the largest, the middle row takes the second place, and the rear row is the least. The maximum shear force of each row of micropiles occurs at the sliding-surface position, and the range of shear force influence increases with the increase in load. Before reaching the critical failure load of 22 kPa, the shear force influence near the sliding surface is approximately within the range of 0.26 m above the sliding surface to 0.24 m below the sliding surface (approximately 6–7 times the pile diameter interval). Due to directly bearing the landslide thrust, the shear force influence range of the rear row of piles is slightly larger than that of the front and middle rows of piles.
The axial force distribution curve of the front-row micropiles is shown in Figure 19. Unlike the data obtained in the experiment, the default setting for the axial force in the FLAC3D software is negative for compression and positive for tension. As can be seen from the figure, under the action of the landslide thrust load, the micropiles exhibit mainly end bearing and friction. The peak of axial force occurs near the slip-surface position. There is a certain degree of sudden change in the axial force of the pile near the sliding surface, which is manifested as the axial force above the smooth surface increases with the increase in depth, and then slightly reduces, and then it increases rapidly to the maximum value. This indicates that the bending deformation of the pile body near the slip surface leads to a slight loss of axial force in this area. As the load increases, the maximum axial force of the pile body increases, and the end-bearing resistance at the pile bottom gradually increases with the load.
Similar to the experimental results, when the load is not too large, the variation in the axial force at this location for the front and middle rows of piles is relatively monotonic: increasing with the load. However, for the top of the rear-row pile, when the load is less than 20 kPa, the axial force at this location increases with the load. After exceeding this load, the axial force at this location gradually decreases with the load. When the load increases to 26 kPa, the axial force of the connection between the pile and the beam changes from negative to positive; the force at the top of the pile transforms from axial compressive stresses into axial tensile stresses, indicating that as the load increases, the deformation of the micropile group also increases, and the top of the rear micropile that directly bears the landslide thrust load enters a tensile state to constrain the further deformation of the micropiles.

5. Discussion

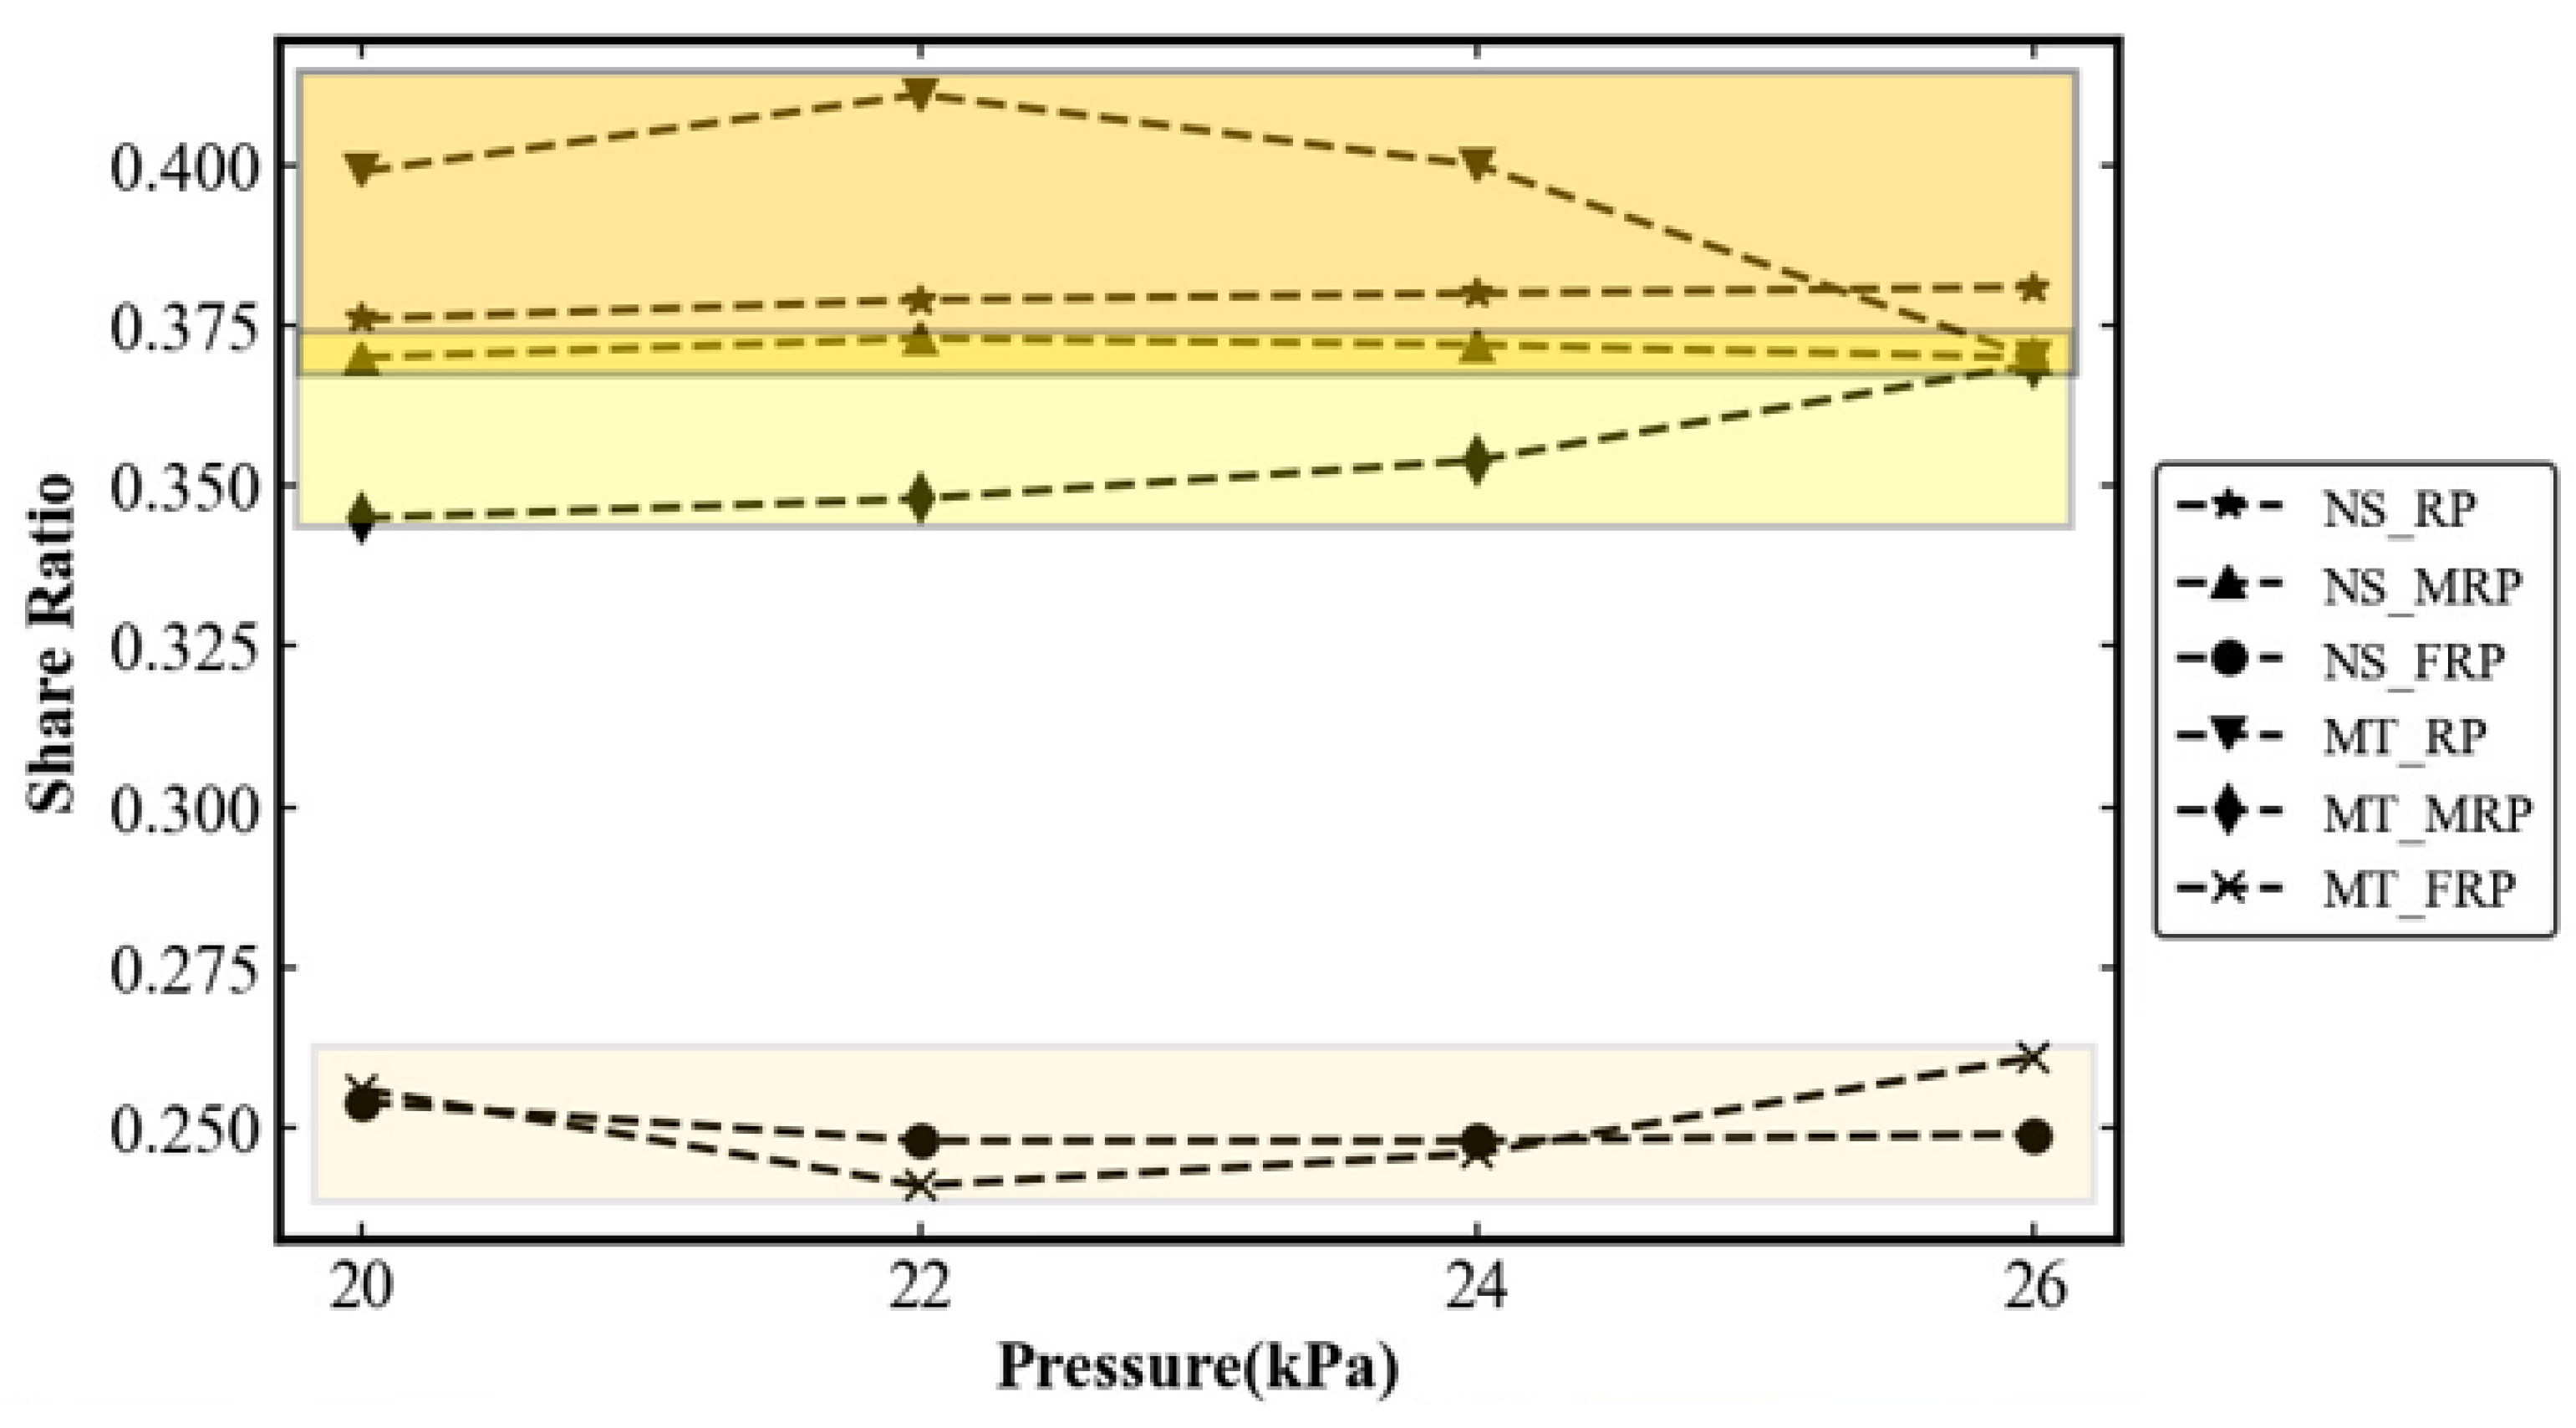
5.1. Obvious Sharing Effect of Landslide Thrusts

The comparison between Table 3 obtained from the model experiments and Table 6 obtained from the numerical simulation experiments shows that there is a significant sharing effect of the micropiles. In the model test, the sharing ratio is rear-row pile: middle-row pile: front-row pile = 0.411:0.348:0.241 when each row of mini-piles enters the yielding stage (about 22 kPa), while in the numerical simulation, the ratio is approximated as rear-row pile: middle-row pile: front-row pile = 0.38:0.37:0.25. Comparing the above data, it can be found from Figure 20 (NS denotes numerical simulation; MT denotes model experiment; FRP, MRP, and RP denote front, middle, and rear piles, respectively) that there is not much difference between the two and the sharing ratio is within a range of values. In the actual micropile application, the above sharing ratio can be referred to for a safer and more economical design. If the ratio is taken to calculate the assumed landslide thrust, the material of the front, middle, and rear rows of piles can be selected more safely or more economically.

5.2. Obvious Phase Characteristics of the Force Mechanism

Similar to the model test results, when the load is not too large, the axial force at the front and middle rows of piles is more monotonous—it increases with increasing load, while the axial force at the top of the rear row of piles increases with increasing load when the load is less than 20 kPa, and decreases with increasing load after exceeding this load. When the load increases to 26 kPa, the axial force at the connection between the pile top and the connecting beam changes from negative to positive, and the axial compressive stress at the pile top is transformed into axial tensile stress. It means that as the load increases, the deformation of the mini-pile group also increases, and the top of the mini-pile in the back row, which is directly subjected to the landslide thrust, enters the tensile state to restrain the further deformation of the mini-pile. It can be found that at the early stage of deformation, the mini-pile mainly resists the bending shear effect. After the deformation expands further and the mini-pile enters the bending shear damage state, the mini-pile can move from the bending shear resistance state to the tensile compression resistance state and continue to play the anchoring and anti-slip role (Figure 21).

6. Conclusions

In order to study the interaction between micropiles and soil landslides, static model tests were conducted and the following conclusions were obtained using FLAC3D numerical simulations.
The interaction between micropiles and soil landslides under static conditions presents a more obvious staged characteristic. In the initial deformation stage, micropiles mainly resist bending and shearing. When the deformation further expands and micropiles enter the bending and shear failure state, they can transition from anti-bending and anti-shearing status to anti-tensile and compressive status and continue to play an anchoring and anti-sliding role.
The results of the internal force analysis of the mini-piles under static conditions show that the maximum positive and negative bending moments of each row of mini-piles are distributed in the interval from two times the pile diameter to four times the pile diameter above and below the slip surface, and the closer to the back edge of the landslide, the larger and more concentrated the bending moments of the mini-piles will be.
Regardless of the static action, the deformation and failure mode of micropiles is bending and shear failure. The specific indication is that there is a bending deformation occurring above and below the sliding surface at a distance of about three times the pile diameter, which causes tension cracks behind the pile and compression cracks in front of the pile, with more severe plastic failure closer to the back edge of the landslide.
The micropiles located in the landslide body have a significant share effect on the landslide thrust. The sharing ratio measured in the static model test is approximately back-row pile: middle-row pile: front-row pile = 0.411:0.348:0.241, and the corresponding numerical simulation obtained that the sharing ratio is approximately back-row pile: middle-row pile: front-row pile = 0.38:0.37:0.25.
Based on the results of the model test and numerical simulation, and considering a more conservative scenario (i.e., maximizing the sharing ratio of the back-row pile), the recommended sharing ratio under static conditions for micropile design is back-row pile: middle-row pile: front-row pile = 0.411:0.348:0.241.

Author Contributions

Methodology, X.L. and R.X.; software, W.Y., H.C. and F.Z.; investigation, G.W., G.S. and R.X.; writing—original draft preparation, G.S. and J.D. All authors have read and agreed to the published version of the manuscript.

Funding

This work is financially supported by the Basic Research Program of Natural Sciences of Shaanxi Province (Grants No. 2022JM-280), China Jikan Research Institute of Engineering Investigations and Design, Co., Ltd. 2022 scientific research fund (Grants No. 11740903120220021), the University Student Innovation and Entrepreneurship training programs (Grants Nos. X202210710391, X202210710510), the China National Petroleum Corporation Changqing Oilfield Branch 2023 Annual Science and Technology Project (No. 2023DJ0701), and Chang’an University Professional Degree Research Production Teaching Integration Collaborative Education Project, “Theory of Geological Disaster Prevention and Control” (No. 300103132016). All support is gratefully acknowledged.

Institutional Review Board Statement

Not applicable.

Informed Consent Statement

Not applicable.

Data Availability Statement

All data used during the study appear in the submitted article.

Acknowledgments

The authors thank Chang’an University Geohazard Simulation Test Hall for providing the test site and technical support.

Conflicts of Interest

The authors declare no conflict of interest.

References

  1. Yongqiang, X. The “8.12” landslide in Shanyang County, Shaanxi Province. Chin. J. Geol. Hazards Prev. 2015, 3, 25. [Google Scholar]
  2. Lihua, W. “11–13” Zhejiang Lishui major landslide disaster relief log. China Disaster Reduct. 2015, 23, 52–53. [Google Scholar]
  3. Bruce, D.A.; Dimillio, A.F.; Juran, I. A Primer on Micro-piles. Civ. Eng. 1995, 12, 51–54. [Google Scholar]
  4. Macklin, P.R.; Berger, D.; Zietlow, W.; Herring, W.; Cullen, J. Case history: Micro-pile use for temporary excavation support. In Proceedings of the Sessions of the Geosupport Confenrence: Innovation and Cooperation in Geo, Orlando, FL, USA, 29–31 January 2004; Geotechnical Special Publication. ASCE: Reston, VA, USA, 2004. [Google Scholar]
  5. Zhang, S.J. The Introduction of Micro-Pile in Building Heightening and Transformation. Adv. Mater. Res. 2014, 3226, 941–944. [Google Scholar] [CrossRef]
  6. Lee, T.H.; Chul, I.J.; Kim, C. A Method for Reinforcing the Ground Adjacent to the Footing Using Micropiles. Mar. Georesour. Geotechnol. 2016, 34, 341–355. [Google Scholar] [CrossRef]
  7. Hu, T.F.; Wang, T.L. Numerical Investigation of the Performance of a New Anchored Micropile Structure Against Landslides. Soil Mech. Found. Eng. 2019, 56, 321–327. [Google Scholar] [CrossRef]
  8. McManus, K.J.; Charton, G.; Turner, J.P. Effect of Micro-piles on Seismic Shear Strain. ASCE Geo-Support 2004, 3, 1–12. [Google Scholar]
  9. Armour, T.; Groneck, P.; Keeley, J.; Sharma, S. Micropile Design and Construction Guidelines Implementation Manual Priority Technologies (PTP) Project; Publication NO. FHWA-SA97-070.2000; United States Federal Highway Administration: Washington, DC, USA, 2000.
  10. Shah, I.A.; Ali, K.; Farooqi, M.A. A Numerical Study on the Bearing Capacity of Fly-Ash Reinforced with Fine Micropiles. Int. J. Geosynth. Ground Eng. 2021, 7, 4. [Google Scholar] [CrossRef]
  11. Foundation Engineering Research Team, Structures Research Group, Public Works Research Institute. Design and Execution Manual for Seismic Retrofitting of Existing Pile Foundation with High Capacity Micropiles; Foundation Engineering Research Team, Structures Research Group, Public Works Research Institute: Tsukuba, Japan, 2002. [Google Scholar]
  12. Azzam, W.R.; Basha, A.M. Utilization of micro-piles for improving the sub-grade under the existing strip foundation: Experimental and numerical study. Innov. Infrastruct. Solut. 2018, 3, 44. [Google Scholar] [CrossRef]
  13. Cantoni, R.; Collotta, T.; Ghionna, V.N.; Moretti, P.C. A design method for reticulated micropiles structure in sliding slopes. Ground Eng. 1989, 22, 41–47. [Google Scholar]
  14. Sun, S.-W.; Hu, J.-B.; Zhu, B.-Z.; Yumao, X. Study on the formation mechanism and structural characteristics of soil arch of micro-pile reinforced slope. J. Railw. Eng. 2020, 37, 31–36. [Google Scholar] [CrossRef]
  15. Jun, T.; Feilong, L.; Ning, J. Application of micropile technology in existing building foundation strengthening and renovation project. Constr. Technol. 2022, 51, 79–82. [Google Scholar]
  16. Qiang, S.J.; Lei, Y.C.; Wu, D.D.; Zhang, Y.; Wang, D. Experimental study on centrifugal model of reinforced slope with miniature pile group frame structure. Railw. Constr. 2022, 62, 135–140. [Google Scholar] [CrossRef]
  17. He, S.; Lai, J.; Li, Y.; Wang, K.; Wang, L.; Zhang, W. Pile group response induced by adjacent shield tunnelling in clay: Scale model test and numerical simulation. Tunn. Undergr. Space Technol. 2021, 120, 104039. [Google Scholar] [CrossRef]
  18. Yan, J.; Liu, X.; Zhang, Z.; Jin, K.; Lu, X. Model Test of Micro-Pile Group Reinforcing High Steep Landslide. Appl. Sci. 2022, 12, 10017. [Google Scholar] [CrossRef]
  19. Liu, X.; Liu, Y.; Liu, K.; Su, Y. Experimental investigation on anti-sliding performance of grouted micro-pipe pile groups. Nat. Hazards 2022, 113, 1367–1384. [Google Scholar] [CrossRef]
  20. Li, C.; Tang, H.; Hu, X.; Wang, L. Numerical Modelling Study of the Load Sharing Law of Anti-sliding Piles based on the Soil Arching Effect for Erliban Landslide, China. KSCE J. Civ. Eng. 2013, 17, 1251–1262. [Google Scholar] [CrossRef]
  21. Dong, X.G.; Dong, J.H.; He, T.H.; Zheng, J.J. Analysis of combined anti-slip structure of anchor cable mini-pile based on landslide stability. J. Appl. Basic Eng. Sci. 2019, 27, 391–403. [Google Scholar] [CrossRef]
  22. Jiang, H. Stability analysis of combined miniature pile-anchor cable support for cis-layered rocky slopes. J. Railw. Sci. Eng. 2019, 16, 2184–2191. [Google Scholar] [CrossRef]
Figure 1. Landslide model plan.
Sustainability 15 10630 g001
Figure 2. Cross-sectional view of landslide model.
Sustainability 15 10630 g002
Figure 3. Model micropile structure. (a) Micropile cross-section. (b) Miniature pile façade.
Sustainability 15 10630 g003
Figure 4. Design drawing of the connecting beam. (a) Connecting beam plan. (b) Elevation of the connecting beam.
Sustainability 15 10630 g004
Figure 5. Full view of landslide model box. (a) Placement of miniature piles. (b) Arrangement of double-layer plastic film. (c) Fill Slip. (d) Installation of tie beam. (e) Connection of data test equipment. (f) Full view of landslide model box.
Sustainability 15 10630 g005
Figure 6. Landslide model monitoring design. (a) Monitor floor plans. (b) Inspection profile.
Sustainability 15 10630 g006
Figure 7. Micropile measurement point layout.
Sustainability 15 10630 g007
Figure 8. Schematic diagram of final deformation of static test (unit: mm). (a) Model deformation schematic. (b) Micropile deformation diagram.
Sustainability 15 10630 g008
Figure 9. Displacement meter test result recording.
Sustainability 15 10630 g009
Figure 10. Soil pressure distribution curve of each row of micropiles. (a) Front row—#2 pile front earth pressure. (b) Front row—#2 pile pile rear earth pressure. (c) Middle row—#6 pile front earth pressure. (d) Middle row—#6 pile post soil pressure. (e) Rear row—#11 pile front earth pressure. (f) Rear row—#11 pile post soil pressure.
Sustainability 15 10630 g010
Figure 11. Bending-moment distribution curve of each row of piles. (a) Front row—#2 pile bending-moment distribution curve (complete); (b) Front row—#2 pile bending-moment distribution curve; (c) Middle row—#6 pile bending-moment distribution curve; (d) Rear row—#11 pile bending-moment distribution curve.
Sustainability 15 10630 g011
Figure 12. Axial force distribution curve of each row of piles. (a) Front row—#2 pile axial force distribution curve. (b) Middle row—#6 pile axial force distribution curve. (c) Rear row—#11 pile shaft force distribution curve.
Sustainability 15 10630 g012
Figure 13. Numerical simulation calculation model. (a) Landslide model diagram. (b) Diagram of a miniature pile model.
Sustainability 15 10630 g013
Figure 14. Load—displacement curve.
Sustainability 15 10630 g014
Figure 15. Test pile displacement curves. (a) Front row—#2 pile displacement. (b) Middle row—#7 pile displacement. (c) Rear row—#11 pile displacement.
Sustainability 15 10630 g015
Figure 16. Horizontal stress difference of each row of test piles. (a) Front row—#2 pile horizontal stress difference. (b) Middle row—#7 pile horizontal stress difference. (c) Rear row—#11 pile horizontal stress difference.
Sustainability 15 10630 g016
Figure 17. Bending-moment curve of each row of test piles. (a) Front row—#2 pile bending moment. (b) Middle row—#7 pile bending moment. (c) Rear row—#11 pile bending moment.
Sustainability 15 10630 g017aSustainability 15 10630 g017b
Figure 18. Shear curve of each row of test piles. (a) Front row—#2 pile shear. (b) Middle row—#7 pile shear. (c) Rear row—#11 shear.
Sustainability 15 10630 g018
Figure 19. Axial force curves of the front test piles. (a) Front row—#2 pile shaft force. (b) Middle row—#7 pile axial force. (c) Rear row—#11 pile axial force.
Sustainability 15 10630 g019
Figure 20. The sharing effect of landslide thrusts.
Sustainability 15 10630 g020
Figure 21. The phase characteristics of the force mechanism.
Sustainability 15 10630 g021
Table 1. Main similarity relationships and similarity constants of the experiments.
Physical QuantitySimilar Ratio RepresentationDimensionSimilaritiesSimilarity FactorRemarks
Geometric dimensions L C L = L p / L m L C L 8Basic Quantities
Modulus of elasticity E C E = E p / E m E C E 3Basic Quantities
Density ρ C ρ = ρ p / ρ m ρ C ρ 0.75Basic Quantities
Load F C F = F p / F m E L 2 C F = C E C L 2 192
Stress σ C σ = σ p / σ m E C σ = C E 3
Strain ε C ε = ε p / ε m C ε = 1 1
Flexural stiffness EI C E I = E I p / E I m E L 4 C E I = C E C L 4 12,288
Poisson’s ratio μ C μ = μ p / μ m C μ = 1 1
Angle of internal friction φ C φ = φ p / φ m C φ = 1 1
Time T C T = T p / T m L E 0.5 ρ 0.5 C T = C L C E 0.5 C ρ 0.5 4
Vibration frequency f C f = f p / f m L 1 E 0.5 ρ 0.5 C f = C L 1 C E 0.5 C ρ 0.5 0.25
Speed v C v = v p / v m E 0.5 ρ 0.5 C v = C E 0.5 C ρ 0.5 2
Acceleration a C a = E a / E a L 1 E ρ 1 C a = C L 1 C E C ρ 1 0.5
Damping factor c C c = c p / c m L 2 E 0.5 ρ 0.5 C c = C E 0.5 C L 2 C ρ 0.5 96
Quality M C M = M p / M m L 3 ρ C M = C ρ C L 3 384
Stiffness K C K = K p / K m E L C K = C E C L 24
Table 2. Table of similar material parameters.
Material NameWeight Capacity
γ (kN·m−3)
Water Content
ρ (%)
Cohesion
c (kPa)
Angle of Internal Friction φ (°)Modulus of Elasticity E (kPa)
Model earth22.512.118.425.22.5 × 104
Table 3. Soil-pressure-sharing table after each row of micropiles.
Loading
Location
20 kPa22 kPa24 kPa26 kPa
Differential
Earth Pressure (kPa)
ProportionDifferential Earth Pressure (kPa)ProportionDifferential
Earth
Pressure
(kPa)
ProportionDifferential
Earth
Pressure
(kPa)
Proportion
Rear-row piles47.150.39955.550.41158.220.40059.040.370
Middle-row piles40.660.34547.050.34851.610.35458.840.369
Front-row piles30.240.25632.680.24135.850.24641.700.261
Total118.051135.271145.681159.581
Table 4. Model soil parameters.
Material ParametersWeight Capacity
γ (kN/m3)
Modulus of Elasticity E (MPa)Poisson’s Ratio μCohesion
c (kPa)
Angle of Internal Friction φ (°)Tensile Strength T (Pa)
Soil body19.030.00.312.030.00
Sliding surface---026.8-
Table 5. Calculation parameters of structural elements.
Structure TypeCross-Sectional Dimensions (m)Density (g/cm3)Modulus of Elasticity (E/GP)Poisson’s Ratio μPolar Moment of Inertia (m4)Y-Axis Moment of Inertia (m4)Z-Axis Moment of Inertia (m4)
Micropileφ 0.036120011.670.251.473 × 10−77.366 × 10−87.366 × 10−8
Connecting beam1.1 × 0.35 × 0.027000.450.5---
Table 6. List of horizontal stress differences after each row of micropiles.
Loading
Location
20 kPa22 kPa24 kPa26 kPa
Differential Earth
Pressure
(Pa)
ProportionDifferential Earth Pressure
(Pa)
ProportionDifferential
Earth Pressure
(Pa)
ProportionDifferential
Earth Pressure (Pa)
Proportion
Rear-row piles48,467.90.37654,409.80.37961,795.90.38068,939.90.381
Middle-row piles47,664.30.37053,603.40.37360,539.10.37266,922.70.370
Front-row piles32,774.20.25435,532.20.24840,488.80.24844,966.70.249
Total128,906.41143,545.41162,823.811,880,829.31
Disclaimer/Publisher’s Note: The statements, opinions and data contained in all publications are solely those of the individual author(s) and contributor(s) and not of MDPI and/or the editor(s). MDPI and/or the editor(s) disclaim responsibility for any injury to people or property resulting from any ideas, methods, instructions or products referred to in the content.

