Abstract
Since the inception of the greenways concept, transportation has been one of its inherent qualities. Nevertheless, journal articles from the past three decades reported negligible active transportation (AT) impact of many greenway investments worldwide. Simultaneously, an international empirical evidence base of greenways usage for AT has not yet been established. Therefore, this research aimed to identify and analyze the influences on greenways usage for AT via a systematic review of published peer-reviewed journal articles from 1991 until 2021. The review used protocols of the PRISMA Statement in reporting and meta-analysis. Via two levels of screening criteria, results identified 162 articles that focused on greenway users and 27 (out of 162) articles that had AT as a main part of their study. The review specified patterns in the characteristics, perceptions, and travel behaviors of active commuters via greenways, which differed from other user types. Differences in use were also affected by weather and temporal factors, greenways’ location and characteristics, and contextual factors. A discussion of the findings identified four study types of greenway usage, highlighted methodological concerns of systematic reviews in this field, characterized transportation-led greenways, proposed a conceptual framework that illustrates where and when greenways would be considered routes for daily commutes, and suggested future work directions. These results improve the understanding of greenways usage, thereby informing their planning, design, and management to maximize their potential.
1. Introduction
This article revises and significantly extends the work published in the proceedings of the 1st Conference on Future Challenges in Sustainable Urban Planning & Territorial Management [1]. Active transportation (AT) is a form of physical activity [2] that primarily refers to walking and bicycling for commuting purposes (e.g., transporting goods or traveling to destinations) [3]. Greenways are key components of AT and green infrastructure [4]; thus, their multifunctionality contributes to many sustainability and quality-of-life agendas [5,6,7,8,9,10,11] (see Figure 1). For example, between 2008 and 2014, property values of 1747 parcels within 152 m of a 13 km cultural trail in Indianapolis, Indiana, increased by 148%, translating to 1.013 billion USD [12]. These financial returns are substantial, considering the 63 million USD total cost. This cultural trail is an example documented by the Indiana University Public Policy Institute, linking investments in AT infrastructure to the quality of living enhancements and economic prosperity. Other studies worldwide also calculated the cost–benefit analysis of greenways [13,14,15,16]. Therefore, planning to increase the rate of AT (e.g., via greenways) extends beyond mobility, since it contributes to the health, wealth, and sustainability of cities.
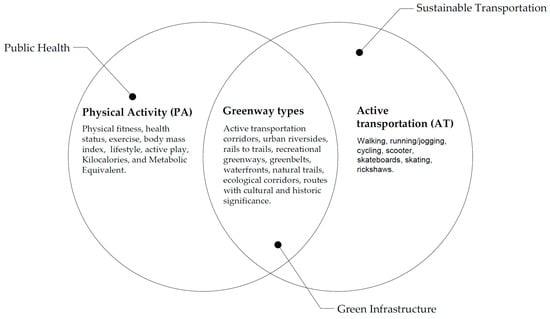
Figure 1.
Relationship between greenway types, physical activity, and active transportation.
While acknowledging the ecological, cultural, and recreational values of greenways, their transportation value is the focus of this research. Many scholars have asserted the transportation function of greenways in their definitions (see Table 1). Maximizing the numerous economic, public health, social, and environmental benefits of greenways is contingent upon increasing their usage [17]. In other words, high and multifunctional greenway usage contributes to realizing sustainable communities. The same principle can also be applied regarding the transportation usage of greenways. The more people rely on those mediums (i.e., greenways) to reach their daily destinations, the fewer cars on the streets, leading, thus, to healthier and more sustainable communities.

Table 1.
Original and contemporary definitions of greenways. The underlined text shows where the transportation function of greenways was emphasized.
Many scholars argue that the ‘by-product’ of movement (the series of spaces that an individual traverses to access a location), regardless of whether initially or frequently, is more important than both the origin or destination of a travel journey to encourage pedestrian movement and support land uses [24]. Therefore, as more people commute via greenways (changing the pattern of movement over time), the more likely it will influence the pattern of land uses, increasing greenways’ accessibility in the process. Hence, well-planned and designed greenways can be seen as a gateway to influencing the land-use patterns that support automobile-dependent lifestyles. In conclusion, planning to increase commuters via greenways encompass influencing people’s travel behaviors and enhancing the places they traverse.
To enable the transportation function of greenways, many scholars introduced several approaches to integrating them with sustainable urban mobility plans (SUMPs), including public transportation [4,25,26,27]. These integration opportunities stem from the overlapping agendas between greenways and SUMPs, such as enhancing livability and accessibility to live/work/play destinations. As Zawawi et al. (2020) discussed, overcoming automobile dependence via the adoption of SUMPs provides land reclamation opportunities at multiple levels due to reduced vehicle ownership, parking needs, and road capacity [4]. These reclaimed lands in the form of, for instance, greenways would transform the mono-functional, abandoned, and underperforming city infrastructure into sustainable landscapes for nature and people [4]. Simultaneously, retrofitted streets to include greenways, known as road contraction schemes [28], contribute to (re)building a city’s green infrastructure [8,29], serving as a foundational layer that structure and sustain urban redevelopment [30,31,32]. Examples of such a project type are the Comox-Helmcken Greenway in Vancouver, Canada [33,34,35], the neighborhood greenways of Portland, Oregon [36], and the transport greenways of Shenzhen, China [37]. In brief, as cities reclaim more of their valuable spaces that were once dedicated to the automobile infrastructure due to their increasing adoption of SUMPs, greenways are posited as a vehicle for advancing sustainability and quality of life agendas.
Nonetheless, if facilitating active travel is an expected function or an intrinsic quality of greenways, why did many studies report meager commuting trips via greenways [38,39,40,41,42,43,44,45,46,47,48,49,50,51,52]? Similarly, should all greenways function as active transportation corridors (ATCs)? If not, what is causing the variation in using greenways as ATCs? (See the summarized answer in Section 4.6). What are the characteristics of transportation-led greenways or ATCs? (See the answer in Section 5). When would greenways be used for commuting purposes? (See the summarized answer in Section 4.6). What are the study types and data collection methods used to examine or measure the transportation usage of greenways? (See the answer in Section 3.2 and Section 3.3). Which countries contribute most to the existing literature about using greenways as ATCs? (See the answer in Section 3.1). The answer to these questions contributes to the need for further research on the utilitarian usage of greenways [38]. Therefore, this research aimed to identify and analyze influences on using greenways as ATCs via a systematic review. Though a recent paper used a systematic review to identify and analyze the influences on the use of greenways [53], to the best of the authors’ knowledge, no review have focused on their usage as ATCs. Doing so enhances the understanding of active commuters’ perceptions, behaviors, and needs of greenways and how they differ from other user types. These results contribute to activating greenways’ function as facilitators of AT.
Theoretical Framework
Several behavioral change theories and models, such as Schneider’s (2013) “theory of routine mode choice decisions”, Alfonzo’s (2005) “Hierarchy of Walking Needs Within a Social-Ecological Framework”, and Saelens et al. (2003) “ecological model of neighborhood environment influence on walking and cycling”, explained that factors influencing people’s decision to walk or cycle are multidimensional [54,55,56,57,58,59,60]. It involves understanding complex interactions between personal (e.g., demographics and health), psychological (e.g., attitude and perceptions), behavioral (e.g., self-efficacy), situational (e.g., travel time and cost), temporal (e.g., time of the day), sociocultural (e.g., community norms), regional (e.g., climate and topography), built environmental (e.g., safety, accessibility, and comfort), and policy factors (e.g., incentives and programs). These behavioral change theories can be understood within a larger theoretical framework of urban social-ecological-technological systems (SETS), whereby urban form and function are the product of intersecting natural, human, and technological phenomena [61]. In undertaking a review of urban mobility via greenways, it was, therefore, necessary to include literature from a wide range of disciplinary perspectives to ensure all these dimensions are included.
As such, the theoretical framework guided the systematic review to enhance the understanding of where and when greenways influence one’s decision to travel actively for commuting purposes. Specifically, in addition to the systematic review results, behavioral change theories and models helped form connections between various factors and influenced the proposed conceptual framework (see Section “Proposed Conceptual Framework”). They also facilitated the identification of unexamined research areas that may inform the planning and management of greenways, including as ATCs. These contributions strengthen the foundation of knowledge about the AT function of greenways, enhance the accessibility of available evidence to decision makers, and identify knowledge gaps in this field.
2. Method: Systematic Review
To achieve the abovementioned goals, the authors conducted a systematic review using protocols of the Preferred Reporting Items for Systematic Review Recommendations (PRISMA Statement) [62]. The PRISMA checklist documents are provided in the Supplementary Materials (See Tables S1 and S2). Additionally, this review was not registered in PROSPERO because it did not measure health outcomes but behaviors (a review protocol was not prepared).
2.1. Identification of Studies
The identification of studies via databases about the usage and users of greenways from 1991 until June 2021 had two phases (see Figure 2). The search terms provided in Table 2 were used to identify the relevant articles in both phases. Moreover, studies were identified using Web of Science, Science Direct, and Scopus databases. Compared to Zawawi et al. (2022) [1], only journal articles were considered, since they typically comprise full methodological details and results that permit a fair assessment of study bias, as required in the PRISMA 2020 checklist [62]. In addition, unlike the previous study [1], the presented systematic review included articles (in its first phase) that examined the economic, social, ecological, health, and economic impact of greenway usage. Such a wide scope offers the opportunity to comprehensively reflect on the greenway usage literature. The last difference between the current and the previous systematic review [1] is the inclusion of articles that primarily collected data from secondary sources. One of the lessons learned from the previous attempt is that numerous journal articles in the greenway usage literature relied on crowdsource data, automated counters (data from secondary sources), and self-tracking applications, such as Codoon, Strava, MapMyFitness, and more. Despite the advantages of primary source data, they are unfeasible in many cases in such a field. Additionally, the use of these technological advancements broadens research possibilities and could enhance scientific objectivity. Thus, the systematic review was repeated, yielding different results compared to the first attempt.
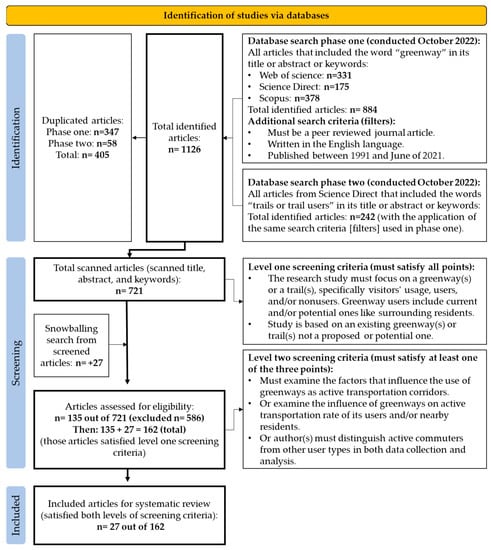
Figure 2.
Systematic literature review flow diagram.
Table 2.
Database search strategy.
The database search in phase one had several search criteria. The term ‘greenway’ must be part of an article’s title, abstract, or keywords. Furthermore, it must be a peer-reviewed journal article, written in English, and published between 1991 and June 2021 (added filters). These search terms resulted in 884 articles (a combined total of phase one).
Examining the reference list of recent literature reviews about greenways usage [20,22,53] revealed that the database search of phase one did not capture all relevant papers. These uncaptured articles mainly used trails as a synonym for greenways. Therefore, the second phase searched the Science Direct database using the term “trails or trail users” and the same search filters used in phase one to capture other relevant articles, adding 242 articles. Therefore, identified studies from both phases totaled 1126 articles.
Despite these efforts, a comparison between the identified journal articles and recent literature reviews about greenways usage [20,22,53] revealed that such a measure (i.e., phase two) did not capture all relevant articles. Therefore, the snowballing process added a total of 27 articles.
Before the screening process, EndNote X9 was used to find duplicates in identified literature of both phases automatically. Such a method did not capture all duplicates. Thus, manual examination of duplicates was applied as well. As shown in Figure 2, phase one had 347 duplicates. The addition of phase two articles resulted in 57 duplicates, amounting to 405 articles in total for both phases (excluding nearly 36%). Microsoft Excel (version 2305) was used to organize and analyze results.
2.2. Screening
Screening aimed to identify studies that had AT usage of greenways as a part of their data collection and analysis (see Figure 2). Therefore, two levels of screening criteria were used for articles that satisfied the search terms mentioned in Section 2.1. The first screening criteria level included articles that focused on usage and users of greenways. Additionally, the study must be based on an existing greenway, not a proposed or a potential one. Thus, studies that incorporated stakeholders’ preferences on a potential greenway development or plan were not included since it is outside the scope of this systematic review. The same applies to studies that aimed to analyze factors influencing AT usage because they are, in many cases, unfocused on greenways. To clarify, Li and Fan (2020) and Krizek et al. (2007) are two studies that examined the influences on cyclists’ travel route choices [63,64]. Only the latter was included, since it focused on the effect of an urban trail system on cyclists’ travel route choice. Thus, the latter study can be viewed as a subcategory of studies, similar to Li and Fan (2020), which aimed to examine influences on bicycle usage. With that in mind, the authors successfully retrieved all articles sought for screening via the University of Nottingham’s institutional access and library. The extensive first-level screening included 135 out of 721 articles (586 were excluded). With the addition of articles identified via the snowballing method (n = 27), the total became 162 articles.
These 162 articles were classified based on greenway type, country, region/city, contributing academic journals, and study types. Data registration and analysis was achieved via extensive reading of the included articles and tabulation of results via Microsoft Excel spreadsheet. Such an effort contributes to clarifying the state of existing literature about the usage and users of greenways internationally and improving access to available evidence to decision makers and future research. The greenway typology used to differentiate between these articles was influenced by Horte and Eisenman (2020) [20]. They provided a detailed description of five urban greenway types. However, what is not part of their typology is a multisetting greenway resulting from its scale, connecting rural to/from the urban context. Similar to those studied by [43,65], greenways of such type are difficult to classify solely based on their landscape context. In other instances, many scholars examined several greenway types in a study. Thus, the multitype greenway(s) was added as a category, amounting to five greenway types used for this study. They are waterfronts and riversides, rail-to-trails, natural trails, active travel corridors (including the freeway-to-greenway type), and multitype greenways. In short, as a result of the first screening criteria, all 162 articles were analyzed and categorized based on greenway type, location, contributing academic journals, and study types.
The second screening criteria level was applied to the 162 articles to ensure that an included one must satisfy at least one of three conditions. As shown in Figure 2, an included article must examine the factors that influence the use of greenways as ATCs, the influence of greenways on the AT rate of their users or nearby residents, or the collected data must distinguish commuters from other user types in both data collection and analysis. Thus, the second screening level required reading the aim(s), method(s), and result(s) of the 162 papers. Microsoft Excel spreadsheet was used for the tabulation of results. Only 27 out of 162 articles satisfied the second screening criteria and were included for a detailed analysis and synthesis to identify the influences on greenways usage as ATCs.
2.3. Analysis and Synthesis of the Included Articles
The review of the 27 articles identified greenway use forms and the factors influencing their usage. Forms of greenway usage were either reported by users (e.g., use purpose, frequency, and duration via a questionnaire) or calculated using measurement tools (e.g., pedestrian and cyclists’ volumes using automated counters). The detailed analysis of the included articles only considered results related to AT usage of greenways. In cases where the data or presented results of included phase two articles were missing or unclear, the leading author read supporting materials and secondary data sources for confirmation (e.g., American Community Survey and Puget Sound Regional Travel Study). In the few instances where such efforts were unsuccessful, the authors stated, “cannot tell”. Therefore, no processes for obtaining or confirming data were involved. The review’s analysis and synthesis process was conducted by the leading author but supervised by the co-authors.
Influencing factors were divided into socioeconomic and demographic influences, weather and temporal influences, environmental and accessibility influences, influences of greenway characteristics, and travel behavior and individual influences. Each variable category had multiple factors influencing the transportation function of greenways. The arrival of such an analysis framework resulted from synthesizing the identified greenway use forms and the factors influencing their usage as ATCs across the 27 articles. Simultaneously, the classification of influences (i.e., variable categories) was influenced by the literature review of Senes et al. [22].
The outcomes of the analysis process specified dependent variables (types or qualities of use) and independent ones (factors affecting their use) and their relationship for each of the 27 articles. However, the nature of influence, precisely the direction of correlation or effect size, was not specified in tables and diagrams (only text). Furthermore, presented results in tables and diagrams indicated what was found to be an ‘influencing’ variable because an independent variable (e.g., age) can be a factor that increases or decreases the likelihood of greenway usage. Thus, it depends on the study type (e.g., comparison between two greenways), variable measurement, statistical models, and covariates. For example, age groups are not similarly affected by the factors (e.g., motivation) influencing their greenway use [38,66]. Additionally, results varied according to differences in greenway types, locations, study objectives, time of year, and analytical methods, making it difficult to identify generalizable patterns. Therefore, the tables and diagrams presented in this review do not specify the nature of influence between the dependent and independent variables for the included 27 articles. In short, the presentation of results was synthesized narratively, not statistically combined, to enhance the communication and clarity of findings.
2.4. Risk of Bias and Certainty of Evidence Assessment
As shown in Table 3, all the included 27 articles utilized surveys (questionnaires and/or AT traffic counting) as a primary data collection method. Therefore, the risk of bias and certainty of evidence assessment of these studies used a tool adapted by Ravensbergen and El-Geneidy (2022) from the Effective Public Healthcare Panacea Project for survey-based research in urban planning [67]. Guidelines and evaluation criteria are provided in the article mentioned above. The leading author was the only assessor of the 27 articles; however, the assessment was supervised by the co-authors.
Table 3.
Research design, data collection method(s) and sources, and survey sample size of the included articles in phase two (n = 27).
The risk of bias assessment included eight categories (see Table 4). Rating in each category comprised strong, moderate, weak, not applicable, and cannot tell. In addition, a total or global rate was based on the number of weak ratings. If an article had no weak rating in all eight categories, it would receive a “strong” global score, if it had one weak rating, it would receive a “moderate” global rating, and if it had two or more weak ratings, it would receive a “weak” global rating. A limitation of such a tool is that it does not assess qualitative and non-survey methods, analysis, and results. Therefore, the risk of bias assessment for a few articles is incomprehensive and may not be suitable in a few other cases (n = 2).
Table 4.
Risk of bias assessment for the included 27 articles.
As for the certainty of evidence, the assessment used Prince et al. (2021) decision rules and interpretation of results [84]. However, the risk of bias assessment results was based on the version by Ravensbergen and El-Geneidy (2022), adapted from the Effective Public Healthcare Panacea Project. The evaluation approach of Prince et al. (2021) adapted the GRADE framework (Grading of Recommendations, Assessment, Development and Evaluations), which has five domains: risk of bias, inconsistency, indirectness, imprecision, and publication bias (i.e., reporting only significant or positive results) [85]. Specifically, the assessment considered the research design of articles indicating an outcome (benchmark 75%) as well as consistency of effect (heterogeneity of results), global representation of studies’ sample (i.e., external validity), number of studies and participants across all studies (benchmark 10,000), and publication bias. Since several studies primarily used pedestrian and bicycle counts as a data collection method, their external validity considered several factors. These were duration (continuous or short durations), temporal variety (i.e., different seasons, day of the week, and time of the day), location (i.e., different geographic parts of a region, land uses, and socioeconomic characteristics of a community), and technology (automated or manual) [86].
Evaluation of the certainty of the evidence outcome has four categories ranging from high to very low. These scores reflect the confidence in the true direction of association and the likelihood of future research to change the confidence of that effect. Prince et al. (2021) explained that scores are initially based on the research design [84]. Experimental and longitudinal designs begin with a high score (or when they represent >10% of studies), and cross-sectional designs begin with a low score (or when they represent ≥90% of studies). From there, the score could be downgraded based on the assessment criteria (scale from −1 to 0). For example, if more than ≥75% of studies had a moderate/weak global rating score for the risk of bias, it would lose 0.5 points (if ≥75% were weak, then −1). The sum of all domain scores determines the certainty of evidence, which was applied to all influencing factors to greenways usage as ATCs (e.g., gender, distance from home, and more).
3. Results
3.1. Geographical Location and Greenway Types of the Included Articles
As explained in Section 2.2, the first screening level identified 162 articles about the usage and users of greenways, which were all classified based on their trail type and location (Appendix A, Table A1). This list showed that 61.3% of the identified ‘greenway usage’ literature is US-based (the same applies to included phase two articles). The second highest number of studies originated from China (8% or 13 studies), showing significant disparities among countries. The biased outcome toward US-based journal articles could be ascribed to the origin of the term ‘greenway’ [87]. Another plausible explanation is the multiplicity of synonyms for the term greenway. A database search using such a term will never capture all relevant literature because, as identified by Hellmund and Smith (2006) [8], there are 30 synonyms for greenways designations [8]. Such a number would multiply when considering other languages and resources. As a result, database search using additional greenway synonyms (e.g., linear parks or parkways or rail-trails), languages, and publication outlets (e.g., books, reports, and dissertations) in identifying studies about the use of greenways as ATCs will certainly yield unidentified literature. These unidentified studies could add, substantiate, or contradict the offered inferences in this systematic review.
A review of the 162 articles identified patterns in contributing academic journals and greenway types. Results showed that 63 journals contribute to publishing greenway usage articles (see Appendix A, Table A2). Such a wide interest indicates the multidisciplinary nature of the greenway usage literature. Despite the wide variety and disciplines among these journals, there is a clear focus on topics related to landscape and urban planning, public health (especially physical activity), tourism, and transportation.
As for the studied greenway types, 31.5% were multitype greenways (see Figure 3). Those studies examined greenways that traverse through multiple settings or studied two or more types of greenways. Additionally, ATCs and rail trails are mostly US-based studies (see Appendix A, Table A1). Synthesis of 27 articles revealed that natural trails were not a greenway type examined by those studies. Such a finding affirms that the transport quality of greenways is likely in (sub)urban contexts.
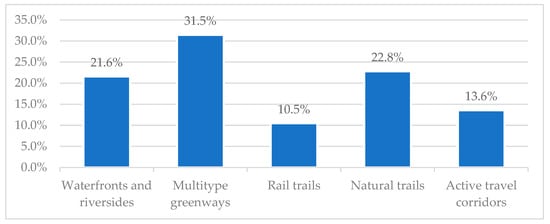
Figure 3.
Studied greenway types in the 162 journal articles (phase one).
3.2. Study Types of Greenway Usage
Synthesis of the included phase one articles identified four study types of greenway usage. Analyzing how greenways are used includes the type of use, volumes, frequency, duration, time of visit, intensity, companion preferences, traveled distance, perceptions, attitude perceptions, and more. Methods to measure greenway usage include questionnaires, observations, Global Positioning System (GPS), self-tracking applications, automated and manual counters, interviews, accelerometers, and more.
With that in mind, the first study type focuses on examining the factors influencing the use of greenways. These factors are numerous, ranging from individual to environmental factors (Section 4.1, Section 4.2, Section 4.3, Section 4.4 and Section 4.5 discusses them in detail). Furthermore, the greenway’s proximity, accessibility, design, and condition are also factors that could influence greenway usage (see Section 4.3 and Section 4.4). The second study type concentrates on the effect of greenways’ implementation or improvement or proximity on surrounding residents and business owners, including their attitude, physical activity, travel behavior (including route choice), social interactions, income, and financial benefits (e.g., travel and healthcare cost savings), and more.
The third study type examines greenway usage’s environmental, health, social, ecological, transportation, and economic impact. For instance, tourism (e.g., measuring trail demand) and users’ expenditures are frequently examined factors in studies about the economic impact of greenway usage [88,89,90]. The ecological impact of trail usage on wildlife, soils, and vegetation is another example of such a study type [91,92,93]. Even though the second and third types may sound similar, they are different. The former includes non-users and focuses on surrounding residents to the site of interest. However, the latter analyzes the impact of existing greenway usage (not users per se), which could be positive, negative, or neutral. The fourth study type voices stakeholders’ concerns and assesses their satisfaction level to improve existing greenway conditions by analyzing their perceptions and preferences. These four study types were common in the greenway usage literature.
3.3. Research Designs and Methods of Included Articles
Research design (experimental, cross-sectional, longitudinal, case study, and comparative), methods, examined variables, data types, study location, and greenway type all add to the complexity of greenway usage studies. Most of the 27 studies used quantitative research strategies. Furthermore, nearly 52% used cross-sectional research designs (see Table 3). Similar to the conclusions by Evenson et al. (2005) [39] and Wolff-Hughes et al. (2014) [47], these results suggest a need for more qualitative research to study, for instance, the influence of trail sitting and design on their usage and users’ perceptions. In addition, results show that comparative research designs were not used in the 27 articles. Considering the global standardization of open space planning and designs, cross-cultural or cross-national studies may, for example, assess the transportation performance of greenways that share similar characteristics. Such an evidence gap could be considered a future research direction that assesses the applicability of greenway planning and designs in contexts of varying nationalities or cultures.
3.4. Risk of Bias Assessment Results
Table 4 summarizes the risk of bias assessment for the included 27 articles. The global rating of all studies revealed that 40.7% were strong, 51.9% were moderate, and 7.4% were weak (see Figure 4). Examining the sample’s representation of the target population and randomization of the study design were the primary reasons for the global “moderate” ratings. Articles with a “weak” global rating, specifically for Sims-Gould et al. (2019) and Pettengill et al. (2012), did not control well for confounders in addition to the two factors mentioned above. However, since these studies were mostly qualitative, the adopted assessment criteria may not be suitable despite using questionnaires. In addition, some studies used a questionnaire and AT traffic counting (e.g., Cook et al., 2016). In such cases, the risk of bias assessment considered both methods, especially in the data collection methods category, since the former consists of self-reported data, and the latter consists of measured data. Cells with a “cannot tell” rating were cases that had incomplete or inaccessible information (e.g., secondary survey data sources). In other cases, specifically, Jestico et al. (2017), the sample’s representation (from crowdsourced data) of the targeted population is unknown.
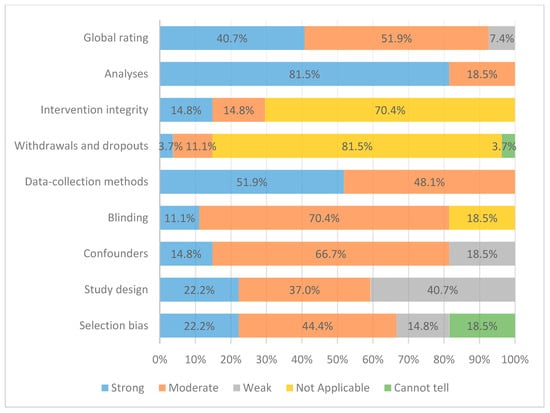
Figure 4.
A summary of the risk of bias assessment.
4. Influences on Greenways Usage as Active Transportation Corridors
In total, 9 categories and 51 variables were identified as influences on the transportation function of greenways based on the 27 articles. Figure 5 and Figure 6 show which variables were examined most, which were least examined, and which identified variables were statistically found influencing across the 27 articles (p-values ≤ 0.05 levels). They also identify which influences had a significant relationship, effect, or difference with a study’s dependent variables (e.g., use purpose). Despite the minor overlap between the 27 articles in the examined variables, no study parameters were replicated in different contexts, and none considered all variables (potential endogeneity problems). These differences reflect the variations in study goals, methods, data availability, location, greenway type, authors’ specialization, budgets, and more. Nonetheless, establishing standardized research protocols to examine the influences on greenways usage for transportation is needed for a more effective synthesis of effect measures. The certainty of evidence assessment for each influencing factor is also part of Figure 5 and Figure 6. Adding the research design, global rating for the risk of bias, and sample size to these figures facilitated the assessment process. While referencing Figure 5 and Figure 6, the narrative synthesis in Section 4.1, Section 4.2, Section 4.3, Section 4.4 and Section 4.5 identifies patterns, inconsistencies, gaps, and direction of association. Section 4.6 provides a summary of those findings as well as an interpretation of the certainty of evidence assessment results.
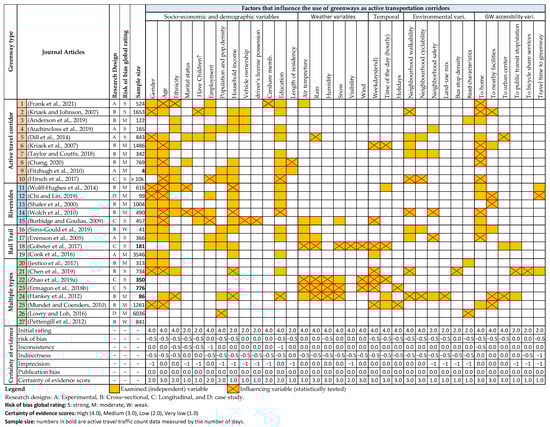
Figure 5.
Summary of the influences on greenways usage as ATCs (Part One) [11,34,38,39,43,46,47,52,63,65,66,68,69,70,71,72,73,74,75,76,77,78,79,80,81,82,83].
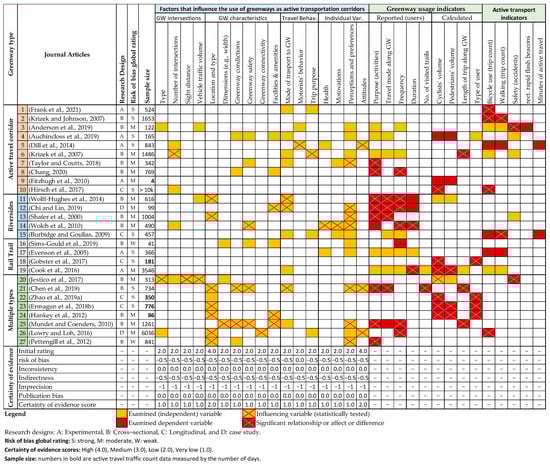
Figure 6.
Summary of the influences on greenways usage as ATCs (Part Two) [11,34,38,39,43,46,47,52,63,65,66,68,69,70,71,72,73,74,75,76,77,78,79,80,81,82,83].
4.1. Socioeconomic and Demographic Influences
Socioeconomic and demographic factors are the most examined variables compared to all other categories. By sheer number, gender, age, ethnicity, employment, income, and education are common factors examined by most of the 27 journal articles (see Figure 5). Nonetheless, few of them found those variables statistically significant factors in their influence on using greenways as ATCs. Analysis of their results revealed several patterns. Regarding gender, women are less likely to use greenways for transportation than men [38,47,68,71,73]. Women were also found to spend less time and travel shorter distances using active travel compared to men within Durham, North Carolina, post-greenway construction (in 2013 and 2014) [79].
The older the person (older than 40 in most cases), the less frequently they make utilitarian trips along greenways [34,47,63,73,76,77]. These results could be supported by Hirsch et al. (2017), who found that the percentage increase of workers aged 18–34 between 2000 and 2010 in Minneapolis, MN contributed significantly to the growth of bicycling for transportation [75]. The same could be applied to Hankey et al. (2012), who focused on Minneapolis, MN and residents over the age of 65 or under the age of 5. They found that a high percentage of those age groups did not affect pedestrian and bicycle traffic [82].
Ethnicity is a non-significant factor in most cases except for Frank et al. (2021) and Hankey et al. (2012). The former concluded that being white increased individuals’ likelihood of bicycling for transportation [34]. However, such a conclusion does not represent Vancouver’s demographics, since more than 75% of experimental and control groups were identified as white. The latter found that neighborhoods with high percentages of non-white residents reported higher bicycle traffic counts [82]. In conclusion, more research is needed to understand the influence of ethnicity on AT via greenways.
Except for Burbidge and Goulias (2009) and Hirsch et al. (2017), the remaining articles did not find employment status as an influencing factor in using greenways as ATCs. Employment was measured at both the individual and tract levels. At the individual level, Burbidge and Goulias (2009) found a significant correlation between employment and active travel post-greenway construction, suggesting that employed participants were more likely to be active commuters. At the tract level, Hirsch et al. (2017) found that the increase in professional employment contributed to the increased cycling for transportation, but not necessarily via greenways. The same positive correlation was found with population density [83]. In short, more research is needed to understand greenways’ relationship with population and employment densities and status.
On another note, studies suggested that individuals with a median household income level are more likely to be utilitarian users of greenways [38,46,47,82]. However, such a result contradict the results of Burbidge and Goulias (2009), which have not found household income to be a significant predictor [77]. Most studies did not find education to be an influencing factor, except for a few suggesting higher educational attainment results in higher levels of trail use [46,82] and bicycle commuting [75]. In short, utilitarian users of greenways are more likely to be educated young men (less than 40 years old) from a median household income.
Marital status and whether a household is with/without children influence the likelihood of using greenways as ATCs. Studies that considered these factors found that users who were never married are more likely to be utilitarian users of greenways [46,47]. However, Chang (2020) did not find marital status influenced AT [73]. In terms of children, the results are inconclusive. Furthermore, single-parent households with children are less likely to use greenways for commuting [46]. Nevertheless, one study found that the odds of active travel trips for those close to greenways increase in households with children [68]. Aside from having or not having children, the likelihood of using greenways as ATCs increases among those who have never married.
Carsharing membership increased after the construction of the Comox Greenway in downtown Vancouver [34]. This result supported their conclusion of an increase in AT trips, especially for those who live within 300 m of the Comox Greenway. The same was found in a longitudinal study in West Valley City, Utah, a suburban area within Salt Lake City. Furthermore, post-greenway implementation, participants who held a driver’s license and owned one and more vehicles were significantly more likely to walk for transportation [77].
The last two less commonly examined variables that Influence the use of greenways are social connectedness (qualitatively measured) and length of residency (see Figure 5). Most school students living near the Arbutus Greenway in Vancouver value its contribution to facilitating casual social encounters with friends and family while facilitating access to nearby destinations, especially food [66]. A study in Taichung, Taiwan, found a similar conclusion [73]. It also found that participants who had lived in the neighborhood longer were more likely to participate in AT. To conclude, greenways with accessible utilitarian opportunities can further increase the likelihood of social connectedness, which motivates their use as ATCs.
The remaining variables in the socioeconomic and demographic categories were less common and non-significant in their relationship or influence on using greenways as ATCs (see Figure 5). However, these variables were examined to characterize the study sample(s), support research findings, and facilitate future extension or comparisons of study outcomes. These variables are language, area of residence (street location), and property ownership. In short, not all the listed variables in Figure 5 were statistically tested to measure their influence on the propensity of using greenways as ATCs. Yet, they were important measures to contextualize and ground results.
4.2. Weather and Temporal Influences
Weather and time influence the use of greenways as ATCs (see Figure 5). Weather variables include air temperature, rain, humidity, snow, sky cover, visibility, and wind. All those variables influence the transportation function of greenways, except sky cover [78,80,81,82]. Interestingly, weather variables can increase and decrease the use of greenways. For example, with temperature, rising greenway use rates were recorded between 4 °C to 24 °C to a plateau at about 27 °C [78]. The same study found that anything below 4 °C and above 32 °C resulted in sharp drops in daily greenway use.
However, rain, humidity, wind, and snow negatively correlate with urban trail use [78,80,81,82]. Rain affects walking and cycling at an hourly rate rather than aggregate daily level [80]. Moreover, according to the same study, even though rain is not an insurmountable barrier to greenway use, it negatively affects concurrent and anticipated active travelers by an hour earlier. Furthermore, rainfall delay’s effect on active travel (e.g., trail surface) can last two to three hours, impacting weekday active travelers more severely than their weekend counterparts [80].
Depending on the geographical location, greenway type and location, trip purpose, day of the week, and mode of non-motorized transport, active travelers respond differently to temperature, rain, humidity, wind, and snow [81]. An example of geographical location’s effect is the drop in bicyclists’ demand on greenways by 179.8% in cold regions during the winter compared to the summer season [81]. Overall, regarding the impacts of weather variables, while consistent in severe conditions, several studies recorded variations in greenway use under ‘favorable conditions.’
As shown, weather variables cannot be disjointly discussed from temporal variables, which comprise time of the day (hourly), weekday (end), and national holidays (see Figure 5). Utilitarian trips via greenways are affected by all temporal factors. Specifically, several studies found that AT via greenways usually occurs during weekdays [38,43,77,80]. Moreover, those commuters are often more tolerant of weather impacts than weekend users whose trips are mostly recreational at an hourly level [38,80]. Additionally, if bicyclists make a trip in the afternoon and on the weekend, they are more likely to make a 40% longer trip to include a greenway on their route [63]. The same study explained that such travel behavior results from fewer time constraints. As for federal holidays, one study reported that pedestrians’ and bicyclists’ demands are low during those times, with variations depending on geographical location [81]. Moreover, holiday users’ frequency of trips (including the utilitarian ones) via greenways was among the lowest rates compared to other user profiles [43]. While considering the direct link between weather and temporal variables, the latter also impacts greenway use rate, including as ATCs, and travel behavior.
4.3. Contextual Influences
Depending on a study’s objectives, most scholars (in the 27 articles) incorporated many contextual variables to represent and explain causal effects found in their studies objectively. Due to typical time, money, and data constraints in scientific research, scholars usually select a few environmental measures as a baseline that facilitates the replication, extension, and comparison with similar studies, especially in other geographical locations. Therefore, due to the complexity and multiplicity of the environmental factors that influence the use of greenways, many authors, such as Wolch et al. (2010) [46], concluded their research by specifying the variables best predict an outcome (i.e., the likelihood of active commuting via urban trails).
Variables in this section are more or less similar to those found in walkability and cyclability indices (e.g., Global Walkability index, Clean Air Asia Walkability and Cyclability index, and the Copenhagenize index). Such a conclusion substantiates the considerable impact of contextual factors on the use of greenways, especially as ATCs. The 27 articles examined contextual variables that included residences’ proximity to nearby facilities, the number of jobs accessible by transit, intersection density, tract-level cycling infrastructure, and block lengths [38,63,65,66,68,75,82]. Other studies measured the proximity from home to utilitarian destinations, convenience (e.g., bicycle facilities at destination), and the safety of reaching the nearest greenway from participants’ home addresses [72,94]. Furthermore, Wolch et al. (2010) focused on the land-use mix, neighborhood vegetation cover, street connectivity, and accessibility barriers (i.e., railroads, rivers, and traffic) [46]. The measurement unit in all cases is different, ranging from physical measurements of neighborhood conditions to inquiring about residents’ perceptions, such as Evenson, Herring, and Huston (2005) [39]. Additionally, they all focused on the physical features of the surrounding neighborhoods, not urban design qualities, such as imageability, legibility, coherence, enclosure, transparency, and more. Since neighborhood walkability and cyclability variables were frequently examined among the 27 articles, the involvement of planning and design professionals/scholars was a common pattern.
While considering the observations mentioned above, the review of variables in this section was divided into three parts: environmental, accessibility, trail intersections, and vehicle traffic variables (see Figure 5).
The influence of the environmental variables on using greenways as ATCs was inconclusive in many cases. In many others, it was used to characterize the study area(s) objectively and function as supportive evidence. Several studies indicated that walkability and cyclability variables influence the use of greenways as ATCs [38,46,68,82,94]. Other scholars who focused on school students/adolescents did not predict the probability of using those urban trails for daily commutes [66,72]. In addition, scholars such as Dill et al. (2014) measured the length of bike lanes, the number of crosswalks, the percentage of streets with sidewalks, and slopes greater than 4% within a ¼ mile to objectively describe environmental conditions of participating households [71]. The same applies to variables such as road characteristics and topography (not trail slope), since they were used to describe and compare study area conditions.
Many scholars examined land use mix’s influence on greenways usage for transportation, since it is a proxy for a neighborhood’s walkability. For example, Wolch et al. (2010) found that land-use diversity and neighborhood vegetation cover is associated with an increased greenway use duration [46]. However, they concluded that it contradicted several other studies [23,95]. That said, Hankey et al. (2012) found that one unit increase in the land-use mix (The Entropy Index) increased bicycle traffic count by 85% [82]. Thus, the inconclusive results about the land use mix’s effect on greenways usage for AT warrant further investigation.
The same inconclusive outcome holds with the perception of neighborhood safety (i.e., crime). Several authors found it negatively correlated with trail use and duration [39,46,70]. In contrast, Taylor and Coutts (2018) did not find it a factor that predicted students’ likelihood of using greenways to go to school [72]. Moreover, Hankey et al. (2012) did not find that the average number of violent crimes per year in an area affects the pedestrian and bicycle traffic counts in Minneapolis, MN [82]. Therefore, there is no general agreement on the influence of neighborhood safety on greenways usage for commuting purposes, thus, warranting further research.
Based on the review of the 27 articles (see Figure 5), greenways’ distance from home is the most examined independent variable (aside from gender and age), assuming that most trips originate from a place of residence. Such an important measure changes how results are interpreted and later expanded or replicated in other geographical locations. On the one hand, several authors concluded that distance from home strongly influences the propensity to use urban trails as ATCs [46,63,66,72,94]. Additionally, proximity to a greenway increased the likelihood of active commuting [34,68,73]. Similarly, several studies found that the construction of greenways increased AT volumes and durations of surrounding neighborhoods [75,79]. Such a percentage increase, like in the case of Hirsch et al. (2017), coincided with the construction of cycling infrastructure, such as an off-road trail network [75]. On the other hand, several studies found that greenways’ distance from residents’ home addresses was a non-significant factor in neither using greenways as ATCs [47,77] nor increasing the AT rate post-construction [39,71,74]. Such mixed results confirm that greenway’s location, neighborhood walkability and cyclability, users’ perceptions, and attitudes are other factors that play a major role in using greenways as ATCs.
Greenways’ proximity to participants’ residences was not the only factor in measuring its physical accessibility. Several studies reported that greenway’s proximity and connectivity to utilitarian destinations, neighborhood retail, and many other urban facilities are significantly associated with their use as ATCs [11,66,68,76,82,83,94]. However, two studies found that the influence degree varies considerably between pedestrians and cyclists [68,82]. For example, proximity to water bodies significantly influenced pedestrian traffic volumes, unlike bicyclists [82]. That said, proximity to an urban center [71,82], public transit, and bicycle share services [38] were significantly associated with the increased utilitarian trips via greenways for pedestrians and bicyclists. While distance is the common denominator among all reviewed factors, few studies measured the influence of time spent reaching the nearest greenway from participants’ home addresses on its utilitarian functionality. One out of two studies found it a statistically significant factor in using greenways to access daily commutes [76]. Contrastingly, Hankey et al. (2012) did not find that the number of jobs accessible by public transit affects pedestrian and bicycle traffic counts [82]. In conclusion, several studies found that greenways’ proximity and connectivity to daily commutes, shops, public transit stops/stations, and bicycle share services significantly influenced the use of greenways as ATCs.
Despite the importance of greenways’ proximity to home and daily commutes, studies have shown that people are willing to endure a slight increase in trip distance to benefit from commuting via greenways. For example, Krizek et al. (2007) found a positive relationship between the traveled distance on trails and the calculated difference in traveled distance between participants’ chosen and shortest routes to the desired destination [63]. Furthermore, based on their study findings, there is an expected increase of 0.03% in the difference between the chosen and shortest route to the desired destination for every meter traveled along a greenway. Thus, if 1000 m was traveled along a greenway, there is an approximately 30% increase in taken trip distance compared to the shortest route to the desired destination. However, on average (1486 trips of all types but mainly recreation), this is a 67% increase over the shortest route distance (approximately 4.21 km) [63]. These average distances are 40% higher than Guttenplan and Patten’s (1995) 3 km conclusion [94]. Those differences could be attributed to the higher percentages of urban trail commuters in Guttenplan and Patten’s (1995) sample size. In addition, studies found statistically significant evidence that utilitarian users travel shorter distances (less than 3.21 km) on greenways than recreational users [38,43]. Thus, the travel distance margin of increase is expected to be higher with recreational users compared to their utilitarian counterparts. To conclude, the greenways system and its associated (or perceived) benefits can affect active travel behavior.
Another aspect of urban trails’ accessibility is their safety, partly discussed by the greenway’s intersections (between trail–trail and trail–road) and vehicle traffic variable categories (see Figure 6). One study found that the frequency of reported cyclist-related accidents is higher at trail–road intersections than at trail–trail counterparts [65]. The same study found that cycling incidents are significantly associated with cycling and vehicle traffic volumes and trail sight distance. In addition, installing a rectangular rapid flash beacon (RRFB) did not make these intersections safer, since it did not influence motorists’ behavior to stop upon activation by active travelers [69]. Despite these alarming findings, street connectivity, which partially includes intersection density, was positively associated with the propensity of trail use as ATCs [46,75]. Furthermore, while trip distance is positively associated with the number of intersections, one study found that cyclists are willing to tolerate a route with more intersections for the benefit of using a greenway to reach the desired destination [63]. In conclusion, intersections to and at greenways are both a safety concern and a desired attribute to improve urban trails’ accessibility; thus, its design and management elements are vital to mitigate its risks.
4.4. Influences of Greenway Characteristics and Conditions
Greenways’ location (i.e., urban or rural), dimensions (e.g., width), conditions (e.g., maintenance), safety (e.g., conflict among users), and provided amenities and facilities (e.g., toilets) are all factors that influence their use as ATCs [11,38,43,46,47,52,66,70,76,81,82,94]. As concluded in Section 4.3, greenways’ proximity and accessibility to residential areas and daily commutes are paramount to the success of their utilitarian function. Therefore, rural greenways (natural trails) and ones that are physically inaccessible from utilitarian opportunities are more likely to function as recreational and physical activity destinations [11,38,47,52,94]. Moreover, the geographical location was also found to cause significant variations between bicyclists’ and pedestrians’ volumes, as they respond differently to weather conditions [80,81]. The same applies to contextual factors. For example, Hankey et al. (2012) found that off-street trails had much larger bicycle traffic volumes than on-street facilities [82]. However, the same study also found that off-street trails did not affect pedestrian traffic volumes. Therefore, greenways’ location can considerably limit their usability as ATCs, and such influence may vary between pedestrians and cyclists.
While greenways’ dimensions can generally include several measurements, such as slope, most journal articles found its width to influence its utilitarian function. Furthermore, several journal articles found that greenways’ width is associated with participants’ perceived comfort and conflict among users [43,66]. Moreover, white line separators were ineffective at mitigating such conflict [66]. Therefore, Guttenplan and Patten (1995) recommended a minimum width of 3 m and an optimum width of 4.6 m [94].
Several articles examined greenways’ conditions, safety, facilities, and amenities by inquiring about users’ perceptions. Greenways’ conditions, mainly maintenance, were perceived as factors that affected users’ preference to access daily destinations via urban trails [38,43,70]. Issues raised as safety concerns also stemmed from poorly maintained greenways. For example, poor illumination in a greenway can partially result from unmaintained lighting fixtures and dense vegetation, which lowers the sense of safety [66]. Safety concerns also come from user conflicts and vehicle traffic, poorly designed crosswalks, congestion, social disorder (e.g., vandalism), and surface materials (e.g., suitability for commuter bikes). All these safety issues influenced greenway use as ATCs [11,38,43,46,66,70,94].
As for the facilities and amenities, the former can, in some cases, be seen as a barrier, since the type of facilities in an area can affect how and when it is used [76]. Moreover, the provision of facilities (e.g., toilets, bicycle lane, parking, access to showers and dressing rooms at workplaces and schools, and more) and amenities (e.g., maps, phone charging stations, cross-signals, signage, trees, Wi-Fi hotspots, and more) were all perceived as influencing factors to the use of greenways as ATCs [43,66,70,82,94]. In contrast, greenways’ aesthetic and natural quality (e.g., scenic views) did not influence their usage for transportation [73]. In short, users’ perception of the quantity and quality of greenways’ facilities and amenities and their sense of safety can affect the propensity of its usage for commuting purposes.
4.5. Travel Behavior and Individual Influences
Based on the 27 articles (see Figure 6), examinations of travel behaviors mostly focus on ATCs (one of the greenway types). An explanation of such a study pattern is the expected high transportation impact of such a greenway type.
As previously discussed, variations in active travel behavior due to the proximity of a greenway is a key dependent variable measured by several scholars (see Figure 6). However, the number and minutes of active commuter trips per day or week are not the only examined behaviors. Previous sections also discussed distance traveled compared to the shortest route distance to the desired destination as well as trip purpose, and motorists’ behavior.
Another predictor of using greenways as ATCs is the mode of transport used to reach the perceived nearest greenway from participants’ home addresses. Studies revealed that greenway arrivals via non-motorized modes of transport are more likely to use them as ATCs [38,47,76]. Aside from those measures, examinations of participants’ travel behavior are partially used to characterize a study sample and support research findings. In short, travel behavior is a key indicator of the influence of greenways and a predictor of urban trails’ usage as ATCs.
Intrinsic motivation to engage in active travel significantly predicted greenways’ usage as ATCs [46]. Additionally, incentives influence motivations, especially ones from schools and employers. For example, employers’ provision of shower facilities, bicycle parking, and more are associated with higher levels of commuters to work via greenways [94]. Since intrinsic motivations are a significant predictor of using greenways as ATCs, incentives from schools and employers could increase the rate of active commuters via urban trails.
The perception of users and non-users of greenways is the most examined factor in the individual variable category. The perception of greenways’ safety, comfort, accessibility, and more were all found as influencing factors in using greenways as ATCs [11,38,43,46,72,76]. Among all variables, perceived safety and distance from a greenway in a case study by Wolch et al. (2010) increased the likelihood of converting non-users to users by approximately 10% [46]. Studying the perception of non-users may contribute to increasing greenway usage, including as ATCs.
Several case studies reported that the perception of utilitarian users could considerably differ from other user types. For example, in examining greenway’s contribution to the quality of life, commuters’ perceptions significantly differed from other user types [11]. Furthermore, commuters valued greenways’ reduction of pollution, transportation costs, time spent to reach daily commutes, and providing alternatives to cars at a significantly higher level than other user groups. Another example is a study that found differences in the perception of greenway attractiveness and maintenance between recreational and utilitarian users. The former had a significantly low likelihood of agreeing that the Greater Cincinnati region trails were attractive and well-maintained [38]. In conclusion, even though not all 27 articles applied a stratified analysis of users’ perception based on greenway use purpose, those who analyzed their findings via such a method found noticeable differences among their user types, which asserts the variations of users’ priorities and needs.
Another form of examining individual variables was via greenway users’ attitudes, especially regarding active travel via urban trails. One study found that those with a positive attitude towards walking and bicycling were more likely to use greenways as ATCs [71]. Such findings can be linked to discussions about intrinsic motivation and health. For example, Wolch et al. (2010) found that healthy individuals are more likely to be commuters via greenways [46]. Residents’ attitudes were also linked to their accessibility to utilitarian destinations via greenways. Lowry and Loh (2016) explained in a case study of Seattle, Washington that cyclist types, in terms of their stress tolerance levels, are significantly affected by bicycle network type, characteristics, and connectivity, and thereby, accessibility to utilitarian destinations [83]. In short, attitudes towards active travel can predict the probability of using greenways as ATCs.
Simultaneously, several studies manifested the differences among user groups. Chen et al. (2019) found that recreational users were less likely to agree about commuting via greenways even if on-street connectivity with trails was enhanced [38]. A study of the Girona greenways in Spain also found significant differences between greenway user profiles. The calculated percentages showed significant proportion differences between commuters and other user profiles seeking restaurants/bars/cafes, accommodation, transport, and shops [43]. These differences affirm the varying needs of different greenway user groups, including active commuters.
4.6. Summary
Based on the review of the 27 articles, active commuters via greenways are more likely to be younger than 40 years old, educated, never married, and from the middle class. They also have intrinsic motivation and a positive attitude towards active travel, and incentives such as end-of-trip bicycle facilities could influence them.
Active commuters’ trips via greenways are usually made daily during weekdays, alone, and with less time spent on greenways, especially when compared to recreational uses. While both user types tolerate a slight increase in trip distance to benefit from greenway usage, active commuters’ travel distance margin of increase is less than recreational users.
As for the factors affecting the transportation function of greenways, their location, weather, width, safety, maintenance, and available facilities were major influences. The same applies to the walkability and cyclability of their surrounding neighborhoods (including safety, comfort, and accessibility). Furthermore, greenway’s proximity and connectivity to home addresses and other daily commutes (e.g., utilitarian and recreational facilities), specifically less than 400 m, significantly increased their usage as ATCs. Therefore, greenway arrivals via non-motorized modes of transport were more likely to use them for commuting purposes.
Evaluation of the certainty of evidence for 51 influences on greenways usage for AT, based on the included phase two articles, revealed that 14 (or 27.5%) scored medium, 9 (or 17.6%) scored low, and 28 (or 54.9%) scored very low. Influences that scored medium were age, air temperature, rain, humidity, snow, wind, weekday(end), time of the day, holidays, neighborhood walkability and cyclability, greenway’s distance from home, nearby facilities (e.g., commercial and educational destinations), and urban centers. Influences that scored low were gender, ethnicity, employment, carshare membership, education, visibility (clear and sunny conditions), greenway location and type, and attitude. The rest were very low (see Figure 5 and Figure 6). The synthesized narrative in Section 4.1, Section 4.2, Section 4.3, Section 4.4 and Section 4.5 identified patterns, inconsistencies, gaps, and direction of association.
Several factors affected the certainty of evidence assessment outcome. First, 59% of the included phase two articles adopted cross-sectional and case study designs, which limits those causal inferences. Second, 51.9% of the included articles had a moderate risk of bias global rating score, and 7.4% had a weak score. Third, the external validity of the included articles (indirectness), which was part of the risk of bias assessment (see Table 4). Fourth, the number of articles contributed to an outcome—many outcomes, such as bus stop density, visibility, distance to bicycle share services, and more, had one study evidencing their influence on greenways usage for AT. The certainty of evidence results stresses the need for more longitudinal and experimental studies, standardization of research protocols for examining greenway usage to enhance the validity of results, and further research on influences with low and very low scores.
5. Discussion
One of the major issues regarding identifying relevant literature was determining what is and is not a greenway in the urban context. As illustrated by Kullmann (2011), linear parks in cities can exist in several forms, and it usually involves a regeneration/restoration of underperforming and abandoned city infrastructure [96]. However, would all regeneration/restoration efforts automatically transform these streets and abandoned infrastructure into greenways? Due to the overlapping agendas and characteristics between urban greenways (i.e., ATCs) and other policies and design approaches, such as complete streets, identifying urban greenway(s) projects and literature may lead to subjective interpretations that prevent a clear exchange of ideas and evidence-based research.
In addition to the intrinsic qualities of greenways [5], several scholars and city plans highlighted unique characteristics of transportation-led greenways or ATCs [20,35,36,37,97]. Unlike complete streets, where all modes of transport are made comfortable, safe, convenient, and accessible for all ages and abilities [98], ATCs prioritize active commuters in many respects. Primarily, such prioritization is achieved via the creation of quiet and slow streets, implementation of traffic-calming measures, provision of pedestrian and bicycle facilities and amenities, street vegetation, wayfinding signages, and linkages to recreational and utilitarian destinations. The highest level of prioritization would be to prevent automobile access for the majority or the entire day (via pedestrianization).
Another notable difference is that ATCs are not only about narrowing or reducing automobile traffic speeds and lanes to adding or widening sidewalks and cycle routes. Therefore, we are offering the following definition: ATCs or transportation-led greenways are designed or reclaimed transport infrastructure (due to their abandonment or underperformance) within (sub)urban areas that prioritize safety, comfort, and accessibility for active commuters while performing several functions such as placemaking and ecological services. Despite ATCs’ multifunctionality, their high transportation impact (or value) differentiates them from other urban greenway types [37].
Proposed Conceptual Framework
A conceptual framework that synthesizes research findings and relates to existing behavioral change theories and conceptual frameworks was developed to enhance the understanding of the factors influencing people’s decision to walk or cycle for transportation via greenways (see Figure 7). Doing so also identified future research directions that may inform greenway planning and management, including as ATCs.
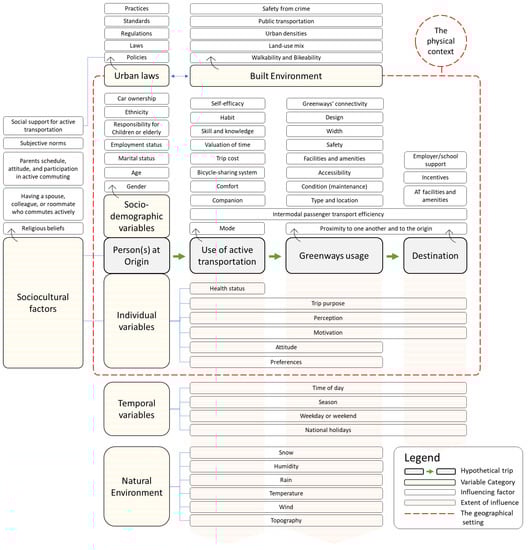
Figure 7.
A conceptual framework that illustrates the influences on greenways usage as active transportation corridors. It is a developed version of the one published by Zawawi et al. [1,27].
Before the use of greenways as ATCs, the systematic review results showed that an individual’s health status, perception, preferences, motivations, and attitude towards walking and bicycling for transportation are significant influencing factors to their use for such purposes [11,38,43,46,76,83]. However, concepts highlighted by the Social Cognitive Theory [57] were not considered in the most relevant literature (see Appendix A, Table A1). Concepts such as self-efficacy (confidence to perform the action and overcome barriers such as bicycling along traffic), behavioral capability (knowledge and skill to AT), and observational learning (behavioural acquisition via observing the activities and results of performing that behavior) can affect bicycling behavior [58]. Alfonzo’s (2005) social-ecological framework explained that feasibility factors such as age, weight, physical mobility, time available, trip cost, responsibility for children, elderly, or other commitments could also affect one’s decision to drive an automobile or walk [55]. Awareness and availability of AT modes (e.g., bicycle ownership) are positively related to bicycling [99]. Therefore, when considering walking or cycling for transportation as a behavior, individual factors can significantly influence that behavior.
Social support for AT, having a spouse or colleagues who actively travel, subjective norms for AT, and perceived support from an employer positively influence walking and cycling for transportation [58]. In the case of children, parents’ schedules, attitudes, and participation in AT as well as perceptions of neighborhood safety and security are among the factors influencing children’s active commuting to school [58,100]. Studies about the Sociocultural factors in SA revealed additional, yet crucial, dimensions that may affect AT, which include religious beliefs, perceptions of privacy, and social norms [27,101,102]. Alfonzo (2005) classified these sociocultural factors as moderators at the group level, which are part of an individual’s life cycle circumstances. Would the provision of greenways influence the attitudes of residents living in automobile-centric societies towards AT? In short, sociocultural factors are important considerations in understanding travel mode choice decisions.
Several theories and conceptual frameworks identified security, safety, accessibility, cost, comfort, and pleasurability of the built environment as influences on active commuting [54,55,56,58]. These influences overlap with several walkability and bikeability theories and conceptual frameworks that relate urban form and design qualities to walking and bicycling behavior. These include, but are not limited to, Jeff Speck’s General Theory of Walkability [103], Ewing and Handy’s (2009) conceptual framework [104], and Saelens et al.’s (2003) ecological model of neighborhood environment [60]. As evidenced in Section 4.3, urban greenways located within walkable neighborhoods influence their usage for commuting purposes. Thus, their integration into, for instance, transportation plans to improve intermodal passenger transport efficiency could maximize their potential as ATCs.
Reforming urban laws to build healthy, equitable, resilient, safe, and walkable environments is an essential form of change to enable AT via greenways. According to the UN-Habitat (2016), urban law is “the broad ranging collection of diverse policies, laws, decisions and practices that govern the management and development of the urban environment.” [105]. Urban management and development dimensions are important, because several scholars argued that projects such as the High Line in New York, US, the Promenade Plantée in Paris, France, and the Atlanta BeltLine in the US are drivers of gentrification and economic inequality (e.g., displacement of locals, small businesses, and industry) [106,107,108,109,110]. Therefore, urban laws are crucial to balance public and private interests when building a framework for implementing walkable and bikeable urban environments.
AT facilities (e.g., bicycle parking, shower/locker rooms), incentives, and support from workplaces/schools/municipal bodies influence active commuting to daily commutes [58,94]. Advocacy for AT through political support, social media engagement in communication about their benefits, educational programs, community events, and more can increase participation in active commuting [111]. The review of the 27 articles showed who typically commutes via greenways and where, when, and with whom. Therefore, future studies may focus on who is not commuting via greenways (omitted selection) and how to address the challenges associated with such groups or conditions. Non-users of greenways are one of many stakeholders who may directly or indirectly be affected by the design and regulations of such facilities. For these reasons, stakeholders’ participation in the research, planning, and management of greenways is vital.
The proposed framework in Figure 7 is based on existing travel behavior change theories, conceptual frameworks, and the systematic review results. As such, it enhances the understanding of individual and environmental domains. Specifically, how they integrate and interact, responding to a need stressed by several scholars [112]. Unlike leisure walking and bicycling, active commuting (to work, school, delivery of goods, meeting a friend, and more) has a defined destination. Therefore, the proposed conceptual framework is built around a hypothetical trip with a defined origin and destination. In that framework, a person’s (or persons’) walking or cycling for transportation via greenways to access a desired destination is the dependent variable, which is similar to the most relevant literature (see Appendix A, Table A1). The rest of the factors are moderators (e.g., outdoor temperature) and independent variables (e.g., gender). The red dotted line represents the context in which the origin, destination, and route connecting both exist. In short, the presented conceptual framework builds an understanding of the influences on a person(s)’ decision to incorporate greenways in their journey to daily commutes.
6. Conclusions
This research has evidenced that influences on the use of greenways as ATCs are multidimensional, transcending disciplinary boundaries. The two-level screening criteria in the systematic literature review identified 162 peer-reviewed journal articles that focused on greenways’ use and users in its first level. Each of the 162 articles was categorized based on their greenway type and location to facilitate access to available evidence for practitioners and academics in this field. The second screening criteria identified 27 articles that mainly had greenways usage for AT as a part of their study. Their review highlighted (I) the characteristics of active commuters via greenways, (II) the nature of their trips, and (III) the influences on the transportation function of greenways. These results emphasized the differences between active commuters via greenways and other user types regarding characteristics, perceptions, behaviors, and needs. Simultaneously, forming generalized patterns about commuters via greenways can be challenging due to the complexity and multidimensionality of the influencing factors.
A discussion of the results identified four study types of greenway usage, highlighted methodological issues in literature reviews about the use of greenways, described the characteristics of ATCs or transportation-led greenways, proposed a conceptual framework that illustrates the influences on greenways usage as ATCs, and offered directions for future research in this field. The identified greenway usage literature was biased towards US-based journal articles due to the greenway term’s origin, the multiplicity of synonyms, and the placed language and publication outlet limits in database search criteria. Furthermore, identifying urban greenway(s) projects and literature may result in subjective interpretations that inhibit clear communication of evidence-based research because ATCs and other policies and design approaches such as complete streets have overlapping aims and characteristics. Therefore, to distinguish ATCs, a definition was proposed (see Section 5). In addition to the suggested future research directions in Section 4 and Section 5, there is a need to (I) address the population gap in research about transportation usage of greenways (specifically, Middle East, Africa, and parts of Asia), (II) examine the transportation impact of greenways using longitudinal and experimental studies that have objective AT behavior and physical activity measures, and (III) develop standardized research protocols for examining greenway usage to enhance the validity of the results.
An enhanced understanding of the influences on greenways usage for transportation would increase their use, maximize their potential, and inform their planning, design, and management. Simultaneously, clarifying the state of existing literature about greenways’ usage as ATCs helped identify knowledge gaps in this area, strengthen its knowledge base, and improve the accessibility of available evidence to decision makers.
Supplementary Materials
The following supporting information can be downloaded at: https://www.mdpi.com/article/10.3390/su151310695/s1, Table S1: PRISMA 2020 checklist; Table S2: PRISMA 2020 abstract checklist.
Author Contributions
Conceptualization, A.A.Z.; methodology, A.A.Z.; formal analysis, A.A.Z.; data curation, A.A.Z.; writing—original draft preparation, A.A.Z.; writing—review and editing, A.A.Z.; visualization, A.A.Z.; supervision, N.P. and C.D.I.; project administration, A.A.Z. All authors have read and agreed to the published version of the manuscript.
Funding
This research received no external funding. However, the Editorial Office of the International Journal of Environmental Research and Public Health waived the open access article processing charge (APC). Therefore, the authors are thankful for the opportunity.
Institutional Review Board Statement
Not applicable.
Informed Consent Statement
Not applicable.
Data Availability Statement
Not applicable.
Acknowledgments
The first author is grateful for the full scholarship offered by Kind Abdulaziz University to fund his Ph.D. study at the Department of Architecture and Built Environment, University of Nottingham. Since this systematic review is a part of the first author’s Ph.D. research, King Abdulaziz University’s sponsorship made this work possible. In addition, the authors would also like to extend their gratitude to the anonymous peer reviewers and the journal’s editorial board for their valuable feedback that improved the manuscript.
Conflicts of Interest
The authors declare no conflict of interest.
Appendix A
Table A1.
Articles that focused on the usage and users of greenways internationally (satisfied level one screening criteria). Items in bold text are articles that had AT as a main part of their study (n = 27).
Table A1.
Articles that focused on the usage and users of greenways internationally (satisfied level one screening criteria). Items in bold text are articles that had AT as a main part of their study (n = 27).
| No. | Identified Articles (Phase One) | Ref. | Country | Region/City |
|---|---|---|---|---|
| 1 | (Coutts and Miles, 2017) | [113] | USA | Southern Michigan |
| 2 | (Coutts, 2009) | [114] | USA | Southern Michigan |
| 3 | (Chon and Shafer, 2009) | [115] | USA | Houston and Austin, Texas |
| 4 | (Price et al., 2012a) | [116] | USA | Greenville County, South Carolina |
| 5 | (Lee et al., 2019) | [117] | USA | Austin and Houston, Texas |
| 6 | (Liu et al., 2018) | [118] | China | Guangzhou |
| 7 | (Wolff-Hughes et al., 2014) | [47] | USA | Knoxville, TN |
| 8 | (Gobster and Westphal, 2004) | [119] | USA | Chicago |
| 9 | (Chi and Lin, 2019) | [76] | China | Guangzhou |
| 10 | (Zhao et al., 2021) | [120] | China | Shanghai |
| 11 | (Wolff and Fitzhugh, 2011) | [121] | USA | Knoxville, Tennessee |
| 12 | (Shafer et al., 2000) | [11] | USA | Houston and Austin, TX |
| 13 | (Coutts, 2008) | [122] | USA | Lansing and Battle Creek, MI |
| 14 * | (Mowen et al., 1998) | [123] | USA | near Damascus, Virginia |
| 15 | (Reynolds et al., 2007) | [124] | USA | Chicago, Dallas, and Los Angeles |
| 16 | (Spruijt-Metz et al., 2010) | [125] | USA | Chicago, Dallas, and Los Angeles |
| 17 * | (Gordon et al., 2004) | [126] | USA | Monongalia County, West Virginia |
| 18 * | (Wolch et al., 2010) | [46] | USA | Chicago, Dallas, and Los Angeles |
| 19 | (Moore et al., 2012) | [127] | USA | Raleigh, North Carolina |
| 20 * | (Burbidge and Goulias, 2009) | [77] | USA | Suburban area within Salt Lake City, Utah |
| 21 * | (Yabes et al., 1997) | [128] | USA | Phoenix metropolitan area, Arizona |
| 22 | (Asakawa et al., 2004) | [129] | Japan | Sapporo |
| 23 | (Banister et al., 1992) | [130] | UK | Leeds and Liverpool |
| 24 | (Cleland et al., 2014) | [131] | Northern Ireland | The Connswater area of East Belfast |
| 25 | (Dallat et al., 2014) | [14] | Northern Ireland | The Connswater area of East Belfast |
| 26 | (Lee and Shafer, 2002) | [132] | USA | Houston, Texas |
| 27 | (Lee et al., 2020) | [133] | Republic of Korea | Gwacheon |
| 28 | (Lindsey and Knaap, 1999) | [134] | USA | Indianapolis |
| 29 | (Pazin et al., 2016) | [135] | Brazil | Florianópolis |
| 30 | (Xie et al., 2021) | [136] | China | Wuhan |
| 31 | (Zhao et al., 2018) | [88] | China | Guangzhou |
| 32 | (West and Shores, 2011) | [137] | USA | Roanoke, Virgina |
| 33 | (Dorwart, 2015) | [138] | USA | Durham, North Carolina |
| 34 | (Burchfield et al., 2012) | [139] | USA | Knoxville, Tennessee |
| 35 | (West and Shores, 2015) | [140] | USA | Mecklenburg County, North Carolina |
| 36 | (Furuseth and Altman, 1991) | [141] | USA | Raleigh, North Carolina |
| 37 | (Bush, 2011) | [142] | USA | Cary, North Carolina |
| 38 | (Lindsey, 1999) | [41] | USA | Indianapolis, IN |
| 39 | (Mundet and Coenders, 2010) | [43] | Spain | Girona and many others |
| 40 | (Jestico et al., 2017) | [65] | Canada | Greater Victoria region |
| 41 | (Lindsey et al., 2008) | [23] | USA | Indianapolis, IN |
| 42 | (Zhao et al., 2019b) | [143] | China | Pearl River Delta |
| 43 | (Chen et al., 2017) | [144] | China | Shenzhen |
| 44 | (Liu et al., 2016a) | [145] | China | Shenzhen |
| 45 | (Lindsey et al., 2001) | [146] | USA | Indianapolis, IN |
| 46 | (Zhang et al., 2020a) | [147] | China | Maanshan |
| 47 | (Chen et al., 2019) | [38] | USA | Greater Cincinnati region |
| 48 * | (Larson et al., 2016) | [148] | USA | Atlanta, GA and San Antonio, TX |
| 49 | (Weber et al., 2017) | [149] | USA | Atlanta |
| 50 | (Palardy et al., 2018a) | [150] | USA | Atlanta |
| 51 | (Dilley et al., 2019) | [151] | USA | Winston-Salem, North Carolina |
| 52 | (Lindsey and Nguyen, 2004) | [42] | USA | Use of Greenway Trails in Indiana |
| 53 | (Keith et al., 2018) | [152] | USA | Atlanta, GA and San Antonio, TX |
| 54 | (Reichhart and Arnberger, 2010) | [153] | Austria | Vienna |
| 55 | (Deyo et al., 2014) | [154] | USA | Indian Country |
| 56 | (Schneider et al., 2021) | [155] | USA | Minnesota, Illinois, Texas, and Florida |
| 57 * | (Zhao et al., 2019a) | [80] | USA | Seattle |
| 58 * | (Wang et al., 2014) | [156] | USA | Minneapolis, Minnesota |
| 59 | (Lindsey et al., 2007) | [157] | USA | Indianapolis, Indiana |
| 60 | (P. Lindsey and Lindsey, 2004) | [158] | USA | Indianapolis, Indiana |
| 61 * | (Lindsey et al., 2006) | [95] | USA | Indianapolis, Indiana |
| 62 * | (Troped et al., 2009) | [45] | USA | West Lafayette, Indiana, and Columbia, South Carolina |
| 63 | (Hankey et al., 2012) | [82] | USA | Minneapolis, MN |
| 64 * | (Ermagun et al., 2018a) | [159] | USA | Several cities |
| 65 * | (Ermagun et al., 2018b) | [81] | USA | Several cities |
| 66 | (Gobster, 1995) | [40] | USA | Metropolitan Chicago |
| 67 | (Clark et al., 2014) | [160] | USA | Southern Nevada |
| 68 | (Götschi and Loh, 2017) | [161] | USA | Multiple locations |
| 69 | (He et al., 2021) | [162] | China | Wuhan |
| 70 | (Hess et al., 2020) | [48] | USA | Raleigh, NC |
| 71 | (Huh et al., 2015) | [49] | Republic of Korea | Gangnam-gu, Seoul |
| 72 | (Keith and Boley, 2019) | [163] | USA | Atlanta, Georgia |
| 73 | (Kelley et al., 2016) | [164] | Ireland | Multiple locations |
| 74 | (Kil et al., 2014) | [165] | USA | Florida (multiple locations) |
| 75 | (Kyle et al., 2004) | [166] | USA | Multiple locations |
| 76 | (Langford et al., 2015) | [167] | USA | Tennessee, Knoxville |
| 77 | (Librett et al., 2006) | [168] | USA | nationwide |
| 78 | (Liu et al., 2016b) | [169] | China | Shenzhen |
| 79 | (Lowry and Loh, 2016) | [83] | USA | Seattle, Washington |
| 80 | (Lumsdon et al., 2004) | [50] | UK | Multiple locations north of England |
| 81 | (Moudon et al., 2005) | [170] | USA | King County, Washington |
| 82 | (Pettengill et al., 2012) | [52] | USA | Vermont, New Hampshire, and Maine |
| 83 | (Wang et al., 2004) | [171] | USA | Nebraska |
| 84 | (Zhang et al., 2020b) | [172] | China | Multiple locations |
| 85 | (Ermagun and Lindsey, 2016) | [89] | USA | Central Ohio |
| 86 | (Wu et al., 2018) | [173] | USA | Wake County, central North Carolina |
| 87 * | (Price et al., 2012b) | [174] | USA | Spartanburg, South Carolina |
| 88 * | (Anna et al., 2012) | [175] | USA | South Carolina |
| 89 | (Harris et al., 2021b) | [176] | USA | Chicago |
| 90 | (Sims-Gould et al., 2019) | [66] | Canada | Vancouver |
| 91 * | (Troped et al., 2001) | [177] | USA | Arlington, MA |
| 92 * | (Merom et al., 2003) | [178] | Australia | Western Sydney |
| 93 * | (Evenson et al., 2005) | [39] | USA | Durham, North Carolina |
| 94 * | (Hughey et al., 2016) | [179] | USA | Greenville County, South Carolina |
| 95 * | (Maslow et al., 2012) | [180] | USA | Spartanburg, South Carolina |
| 96 * | (Gobster et al., 2017) | [78] | USA | Chicago |
| 97 | (Palardy et al., 2018b) | [181] | USA | Atlanta |
| 98 * | (Sim et al., 2020) | [182] | USA | New York City, Chicago, and Farmville |
| 99 * | (Abildso et al., 2007) | [183] | USA | Morgantown, VW |
| 100 * | (Betz et al., 2003) | [184] | USA | North-east Georgia |
| 101 | (Cook et al., 2016) | [79] | USA | Durham, North Carolina |
| 102 | (Reed et al., 2011) | [51] | USA | Spartanburg County, South Carolina |
| 103 | (Beiler et al., 2015) | [90] | USA | Union County, Pennsylvania |
| 104 | (Verlič et al., 2015) | [185] | Slovenia | Ljubljana |
| 105 | (Hughey et al., 2015) | [186] | USA | Greenville, SC |
| 106 * | (Mieno et al., 2016) | [187] | Japan | Hokkaido |
| 107 | (Greer et al., 2017) | [188] | USA | San Diego, California |
| 108 | (Sever and Verbič, 2018) | [189] | Croatia | Zagreb |
| 109 | (Sever et al., 2018) | [190] | Croatia | Zagreb |
| 110 | (Peterson et al., 2018) | [191] | USA | Interstate trail (New York to Maine) |
| 111 | (Senes et al., 2017) | [22] | Italy | Trentino-Alto Adige and Lombardy |
| 112 | (Arnberger et al., 2010) | [192] | Japan and Austria | Sapporo and Vienna |
| 113 | (Arnberger et al., 2018) | [193] | Germany | Freyung-Grafenau and Regen |
| 114 | (Arnberger and Haider, 2005) | [194] | Austria | Vienna |
| 115 | (Arnberger et al., 2017) | [195] | USA | St. Paul/Minneapolis, Minnesota |
| 116 | (Evju et al., 2021) | [196] | Norway | Bergen and Lillehammer |
| 117 | (Fisher et al., 2018) | [197] | USA | western Washington |
| 118 | (Jackson et al., 2003) | [198] | Canada | British Columbia |
| 119 | (Koemle and Morawetz, 2016) | [199] | Austria | Vienna |
| 120 | (Korpilo et al., 2018) | [200] | Finland | Helsinki |
| 121 | (Neumann and Mason, 2019) | [201] | Canada | British Columbia and Alberta |
| 122 | (Neuvonen et al., 2010) | [202] | Finland | Multiple locations |
| 123 | (Norman and Pickering, 2019) | [203] | Australia | South East Queensland |
| 124 | (Pettebone et al., 2013) | [204] | USA | California |
| 125 | (MacBride-Stewart, 2019) | [205] | New Zealand and UK | Multiple locations |
| 126 | (Manton et al., 2016) | [16] | International | Focus on Ireland (County Mayo) |
| 127 | (Martin et al., 2018) | [91] | USA | San Marcos, Texas |
| 128 | (Meijles et al., 2014) | [206] | Netherland | Provinces of Friesland and Drenthe |
| 129 | (Mirzaalian and Halpenny, 2021) | [207] | Canada | Alberta |
| 130 | (Monz and Kulmatiski, 2016) | [92] | USA | Multiple locations |
| 131 | (Pickering and Rossi, 2016) | [208] | Australia | south-eastern Queensland |
| 132 | (Rosa et al., 2020) | [209] | Australia | Perth |
| 133 | (Santos et al., 2016) | [210] | Portugal | Lisbon |
| 134 | (Sever and Verbič, 2019) | [211] | Croatia | Zagreb |
| 135 | (Sterl et al., 2008) | [93] | Austria | Vienna |
| 136 | (Janowsky and Becker, 2003) | [212] | Germany | Stuttgart |
| 137 | (Zajc and Berzelak, 2016) | [213] | Slovenia | Multiple locations |
| 138 | (Zhai et al., 2018) | [214] | China | Shanghai |
| 139 | (Christie et al., 2007) | [215] | Great Britain | Multiple locations |
| 140 | (Beeco et al., 2013) | [216] | USA | Clemson Experimental Forest, South Carolina |
| 141 | (Frank et al., 2021) | [34] | Canada | Vancouver |
| 142 | (Ngo et al., 2018) | [35] | Canada | Vancouver |
| 143 * | (Krizek and Johnson, 2007) | [68] | USA | Minneapolis and St. Paul |
| 144 | (Anderson et al., 2019) | [69] | USA | New Orleans, LA |
| 145 | (Akpinar, 2016) | [217] | Turkey | Aydın |
| 146 | (Auchincloss et al., 2019) | [70] | USA | Philadelphia, Pennsylvania |
| 147 | (Deenihan et al., 2013) | [218] | Ireland | Mayo, Ireland |
| 148 * | (Dill et al., 2014) | [71] | USA | Portland, Oregon |
| 149 | (Frank et al., 2019) | [33] | Canada | Vancouver |
| 150 * | (Krizek et al., 2007) | [63] | USA | Minneapolis, Minnesota |
| 151 | (Reed et al., 2004) | [219] | USA | Sumter, South Carolina |
| 152 | (Taylor and Coutts, 2018) | [72] | USA | Metro Los Angeles, California |
| 153 | (Beach et al., 2019) | [220] | USA | Maryville, TN and Alcoa, TN |
| 154 | (Chang, 2020) | [73] | Taiwan | Taichung |
| 155 | (Chang et al., 2020) | [221] | Taiwan | Taichung |
| 156 | (Korver-Glenn et al., 2017) | [222] | USA | Houston, Texas |
| 157 | (Liu and Chuang, 2018) | [223] | Taiwan | Taichung |
| 158 | (Fitzhugh et al., 2010) | [74] | USA | Knoxville TN |
| 159 | (Harris et al., 2018) | [224] | USA | Chicago |
| 160 | (Harris et al., 2020) | [225] | USA | Chicago |
| 161 | (Harris et al., 2021a) | [226] | USA | Chicago |
| 162 | (Hirsch et al., 2017) | [75] | USA | Minneapolis, Minnesota |
Note: Articles 1 to 34 are waterfronts and riversides, articles 35 to 87 are multitype greenways, articles 88 to 104 are rail-to-trails, articles 105 to 141 are natural trails, and articles 142 to 162 are active travel corridors. * Added journal articles from snowballing screened articles (n = 27).
Table A2.
The number of published articles (phase one) per journal (n = 162).
Table A2.
The number of published articles (phase one) per journal (n = 162).
| Journal Title | No. of Articles | Journal Title | No. of Articles |
|---|---|---|---|
| Landscape and Urban Planning | 23 | Journal of Park and Recreation Administration | 1 |
| Journal of Outdoor Recreation and Tourism | 11 | Environment and Planning A | 1 |
| Urban Forestry & Urban Greening | 10 | European Journal of Public Health | 1 |
| Journal of Physical Activity and Health | 8 | Journal of Aging and Physical Activity | 1 |
| Preventive Medicine | 8 | Journal of Sustainable Tourism | 1 |
| International Journal of Environmental Research and Public Health | 6 | Journal of Urban Design | 1 |
| Journal of Environmental Management | 6 | Professional Geographer | 1 |
| Transportation Research Record | 6 | Urban Studies | 1 |
| Transportation Research Part D: Transport and Environment | 5 | Ecosystem Services | 1 |
| Sustainability (Switzerland) | 4 | Journal of Regional Analysis and Policy | 1 |
| Journal for Nature Conservation | 4 | Frontiers in Psychology | 1 |
| Journal of Urban Planning and Development | 3 | International Review for Spatial Planning and Sustainable Development | 1 |
| Preventing Chronic Disease | 3 | Tourism Management | 1 |
| Journal of Urban Planning and Development | 3 | Data in Brief | 1 |
| American Journal of Preventive Medicine | 3 | Leisure Sciences | 1 |
| Journal of Leisure Research | 2 | Environment International | 1 |
| American Journal of Health Promotion | 2 | Urban Affairs Review | 1 |
| International Journal of Behavioral Nutrition and Physical Activity | 2 | American Journal of Health Behavior | 1 |
| Journal of the American Planning Association | 2 | Journal of Environmental Planning and Management | 1 |
| Health & Place | 2 | International Journal of Sustainable Transportation | 1 |
| Accident Analysis & Prevention | 2 | Journal of Forest Economics | 1 |
| Journal of Transport & Health | 2 | Applied Geography | 1 |
| Journal of Environmental Psychology | 2 | Transport Policy | 1 |
| Accident Analysis & Prevention | 2 | Transportation | 1 |
| Journal of Transport Geography | 2 | Cities & Health | 1 |
| Land Use Policy | 2 | Games for Health Journal | 1 |
| Environment and Behavior | 1 | Environmental Justice | 1 |
| Landscape Research | 1 | Forests | 1 |
| Journal of Community Health | 1 | Cities | 1 |
| Land | 1 | City and Community | 1 |
| Environment and Planning B: Planning and Design | 1 | Computers, Environment and Urban Systems | 1 |
| Tourism Planning and Development | 1 |
References
- Zawawi, A.A.; Porter, N.; Ives, C.D. What influences the use of greenways as active transportation corridors? In Proceedings of the 1st Conference on Future Challenges in Sustainable Urban Planning & Territorial Management, Cartagena, Spain, 17–19 January 2022. [Google Scholar]
- Sallis, J.F.; Frank, L.D.; Saelens, B.E.; Kraft, M.K. Active transportation and physical activity: Opportunities for collaboration on transportation and public health research. Transp. Res. Part A Policy Pract. 2004, 38, 249–268. [Google Scholar] [CrossRef]
- Petrokofsky, C.; Davis, A. Working Together to Promote Active Travel A briefing for Local Authorities; Public Health England: London, UK, 2016. [Google Scholar]
- Zawawi, A.A.; Porter, N.; Ives, C.D. Greenways and Sustainable Urban Mobility Systems. In Humanizing Cities through Car-Free City Development and Transformation; IGI Global: Hershey, PA, USA, 2020. [Google Scholar]
- Ahern, J. Greenways as a Planning Strategy. Landsc. Urban Plan. 1995, 33, 131–155. [Google Scholar] [CrossRef]
- EGWA Greenways. Asociación Europea de Vías Verdes. Available online: http://www.aevv-egwa.org/greenways/# (accessed on 15 January 2019).
- Fábos, J.G. Greenway planning in the United States: Its origins and recent case studies. Landsc. Urban Plan. 2004, 68, 321–342. [Google Scholar] [CrossRef]
- Hellmund, P.C.; Smith, D.S. Designing Greenways: Sustainable Landscape for Nature and People; Island PRess: Washington, DC, USA, 2006. [Google Scholar]
- Lindsey, G. Sustainability and urban greenways: Indicators in indianapolis. J. Am. Plan. Assoc. 2003, 69, 165–180. [Google Scholar] [CrossRef]
- Lindsey, G.; Qi, Y.; Gobster, P.H.; Sachdeva, S. The 606 at Three: Trends in Use of Chicago’s Elevated Rail-Trail. In Proceedings of the Fábos Conference on Landscape and Greenway Planning, Amherst, MA, USA, 28–30 March 2019; p. 37. [Google Scholar]
- Shafer, C.S.; Lee, B.K.; Turner, S. A tale of three greenway trails: User perceptions related to quality of life. Landsc. Urban Plan. 2000, 49, 163–178. [Google Scholar] [CrossRef]
- Majors, J.; Burow, S. Assessment of the Impact of the Indianapolis Cultural Trail: A Legacy of Gene and Marilyn Glick; Indiana University: Bloomington, IN, USA, 2015. [Google Scholar]
- Kang, C.D.; Cervero, R. From Elevated Freeway to Urban Greenway: Land Value Impacts of the CGC Project in Seoul, Korea. Urban Stud. 2009, 46, 2441–2794. [Google Scholar] [CrossRef]
- Dallat, M.A.T.; Soerjomataram, I.; Hunter, R.F.; Tully, M.A.; Cairns, K.J.; Kee, F. Urban greenways have the potential to increase physical activity levels cost-effectively. Eur. J. Public Health 2013, 24, 190–195. [Google Scholar] [CrossRef]
- Hunter, R.F.; Dallat, M.A.T.; Tully, M.A.; Heron, L.; O’Neill, C.; Kee, F. Social return on investment analysis of an urban greenway. Cities Health 2020, 6, 693–710. [Google Scholar] [CrossRef]
- Manton, R.; Hynes, S.; Clifford, E. Greenways as a tourism resource: A study of user spending and value. Tour. Plan. Dev. 2016, 13, 427–448. [Google Scholar] [CrossRef]
- Flink, C.A. The Greenway Imperative: Connecting Communities and Landscapes for a Sustainable Future; University of Florida Press: Gainesville, FL, USA, 2020; p. 328. [Google Scholar]
- Little, C.E. Greenways for America; Johns Hopkins University Press: Baltimore, MD, USA, 1990; p. 237. [Google Scholar]
- Searns, R.M. The evolution of greenways as an adaptive urban landscape form. Landsc. Urban Plan. 1995, 33, 65–80. [Google Scholar] [CrossRef]
- Horte, O.S.; Eisenman, T.S. Urban greenways: A systematic review and typology. Land 2020, 9, 40. [Google Scholar] [CrossRef]
- Turner, T. Greenway planning in Britain: Recent work and future plans. Landsc. Urban Plan. 2006, 76, 240–251. [Google Scholar] [CrossRef]
- Senes, G.; Rovelli, R.; Bertoni, D.; Arata, L.; Fumagalli, N.; Toccolini, A. Factors influencing greenways use: Definition of a method for estimation in the Italian context. J. Transp. Geogr. 2017, 65, 175–187. [Google Scholar] [CrossRef]
- Lindsey, G.; Wilson, J.; Yang, J.A.; Alexa, C. Urban greenways, trail characteristics and trail use: Implications for design. J. Urban Des. 2008, 13, 53–79. [Google Scholar] [CrossRef]
- Hillier, B. Cities as movement economies. Urban Des. Int. 1996, 1, 41–60. [Google Scholar] [CrossRef]
- Flink, C.A.; Searns, R.M. Greenways: A Guide to Planning, Design, and Development; The Conservation Fund: Arlington, VA, USA, 1993. [Google Scholar]
- Hendricks, S.; Catala, M. Methodology for Linking Greenways and Trails with Public Transportation in Florida; University of South Florida: Tampa, FL, USA, 2016; 165p. [Google Scholar]
- Zawawi, A.A.; Porter, N.; Ives, C.D. Greenways of Saudi Arabia: Activating their transportation potential. In Proceedings of the 7th Fábos Conference on Landscape and Greenway Planning, Budapest, Hungary, 30 June–3 July 2022. [Google Scholar]
- Cervero, R.; Guerra, E.; Al, S. Beyond Mobility; Island Press/Center for Resource Economics: Washington, DC, USA, 2017. [Google Scholar]
- Austin, G. Green Infrastructure for Landscape Planning: Integrating Human and Natural Systems; Routledge: New York, NY, USA, 2014. [Google Scholar]
- Benedict, M.A.; McMahon, J.D. Green Infrastructure: Smart Conservation for the 21st Century; The Conservation Fund: Arlington, VA, USA, 2002. [Google Scholar]
- Nijhuis, S.; Jauslin, D.; Hoeven, F.V.D. Flowscapes: Designing Infrastructure as Landscape; TU Delft: Delft, The Netherlands, 2015; p. 324. [Google Scholar]
- Waldheim, C. Landscape as Urbanism: A General Theory; Princeton University Press: Princeton, NJ, USA, 2016. [Google Scholar]
- Frank, L.D.; Hong, A.; Ngo, V.D. Causal evaluation of urban greenway retrofit: A longitudinal study on physical activity and sedentary behavior. Prev. Med. 2019, 123, 109–116. [Google Scholar] [CrossRef]
- Frank, L.D.; Hong, A.; Ngo, V.D. Build it and they will cycle: Causal evidence from the downtown Vancouver Comox Greenway. Transp. Policy 2021, 105, 1–11. [Google Scholar] [CrossRef]
- Ngo, V.D.; Frank, L.D.; Bigazzi, A.Y. Effects of new urban greenways on transportation energy use and greenhouse gas emissions: A longitudinal study from Vancouver, Canada. Transp. Res. Part D Transp. Environ. 2018, 62, 715–725. [Google Scholar] [CrossRef]
- Portland Bureau of Transportation. 2020 Neighborhood Greenways Status Report; Portland Bureau of Transportation: Portland, OR, USA, 2021. [Google Scholar]
- Liu, Z.; Lin, Y.; De Meulder, B.; Wang, S. Heterogeneous landscapes of urban greenways in Shenzhen: Traffic impact, corridor width and land use. Urban For. Urban Green. 2020, 55, 126785. [Google Scholar] [CrossRef]
- Chen, N.; Lindsey, G.; Wang, C.H. Patterns and correlates of urban trail use: Evidence from the Cincinnati metropolitan area. Transp. Res. Part D Transp. Environ. 2019, 67, 303–315. [Google Scholar] [CrossRef]
- Evenson, K.R.; Herring, A.H.; Huston, S.L. Evaluating change in physical activity with the building of a multi-use trail. Am. J. Prev. Med. 2005, 28, 177–185. [Google Scholar] [CrossRef]
- Gobster, P.H. Perception and use of a metropolitan recreation greenway system for. Landsc. Urban Plan. 1995, 33, 401–413. [Google Scholar] [CrossRef]
- Lindsey, G. Use of urban greenways: Insights from Indianapolis. Landsc. Urban Plan. 1999, 45, 145–157. [Google Scholar] [CrossRef]
- Lindsey, G.; Nguyen, D.B.L. Use of Greenway Trails in Indiana. J. Urban Plan. Dev. 2004, 130, 213–217. [Google Scholar] [CrossRef]
- Mundet, L.; Coenders, G. Greenways: A sustainable leisure experience concept for both communities and tourists. J. Sustain. Tour. 2010, 18, 657–674. [Google Scholar] [CrossRef]
- Troped, P.J.; Saunders, R.P.; Pate, R.R. Comparisons between rail-trail users and nonusers and men and women’s patterns of use in a suburban community. J. Phys. Act. Health 2005, 2, 169–180. [Google Scholar] [CrossRef]
- Troped, P.J.; Whitcomb, H.A.; Hutto, B.; Reed, J.A.; Hooker, S.P. Reliability of a brief intercept survey for trail use behaviors. J. Phys. Act. Health 2009, 6, 775–780. [Google Scholar] [CrossRef]
- Wolch, J.R.; Tatalovich, Z.; Spruijt-Metz, D.; Byrne, J.; Jerrett, M.; Chou, C.P.; Weaver, S.; Wang, L.; Fulton, W.; Reynolds, K. Proximity and perceived safety as determinants of urban trail use: Findings from a three-city study. Environ. Plan. A 2010, 42, 57–79. [Google Scholar] [CrossRef]
- Wolff-Hughes, D.L.; Fitzhugh, E.C.; Bassett, D.R.; Cherry, C.R. Greenway siting and design: Relationships with physical activity behaviors and user characteristics. J. Phys. Act. Health 2014, 11, 1105–1110. [Google Scholar] [CrossRef]
- Hess, G.R.; Loflin, A.M.; Selm, K.R. Research note: Shout-out survey for quantifying reasons for trail use. J. Outdoor Recreat. Tour. 2020, 29, 100234. [Google Scholar] [CrossRef]
- Huh, Y.S.; Hur, Y.A.; Yoon, S.Y.; Widawati, E.; Son, Y.H. Challenges and Tasks of Ecobridges in Seoul Based on the Ecobridge-use Behavior Survey In the Case of Ecobridges in Dongjak-gu and Gwanak-gu. Int. Rev. Spat. Plan. Sustain. Dev. 2015, 3, 39–55. [Google Scholar]
- Lumsdon, L.; Downward, P.; Cope, A. Monitoring of cycle tourism on long distance trails: The North Sea Cycle Route. J. Transp. Geogr. 2004, 12, 13–22. [Google Scholar] [CrossRef]
- Reed, J.A.; Hooker, S.P.; Muthukrishnan, S.; Hutto, B. User demographics and physical activity behaviors on a newly constructed urban rail/trail conversion. J. Phys. Act. Health 2011, 8, 534–542. [Google Scholar] [CrossRef] [PubMed]
- Pettengill, P.R.; Lee, B.H.Y.; Manning, R.E. Traveler Perspectives of Greenway Quality in Northern New England. Transp. Res. Rec. 2012, 2314, 31–40. [Google Scholar] [CrossRef]
- Paneerchelvam, P.T.; Maruthaveeran, S.; Maulan, S.; Shureen, S.F. The use and associated constraints of urban greenway from a socioecological perspective: A systematic review. Urban For. Urban Green. 2020, 47, 126508. [Google Scholar] [CrossRef]
- Schneider, R.J. Theory of routine mode choice decisions: An operational framework to increase sustainable transportation. Transp. Policy 2013, 25, 128–137. [Google Scholar] [CrossRef]
- Alfonzo, M.A. To Walk or Not to Walk? The Hierarchy of Walking Needs. Environ. Behav. 2005, 37, 808–836. [Google Scholar] [CrossRef]
- Sallis, J.F.; Cervero, R.B.; Ascher, W.; Henderson, K.A.; Kraft, M.K.; Kerr, J. An Ecological Approach to Creating Active Living Communities. Annu. Rev. Public Health 2006, 27, 297–322. [Google Scholar] [CrossRef]
- Bandura, A. Social foundations of thought and action: A Social Cognitive Theory; Prentice-Hall, Inc: Englewood Cliffs, NJ, USA, 1986. [Google Scholar]
- Bopp, M.; Sims, D.; Piatkowski, D. Bicycling for Transportation: An Evidence-Base for Communities; Elsevier: Amsterdam, The Netherlands, 2018. [Google Scholar]
- Götschi, T.; De Nazelle, A.; Brand, C.; Gerike, R. Towards a Comprehensive Conceptual Framework of Active Travel Behavior: A Review and Synthesis of Published Frameworks. Curr. Environ. Health Rep. 2017, 4, 286–295. [Google Scholar] [CrossRef]
- Saelens, B.E.; Sallis, J.F.; Frank, L.D. Environmental correlates of walking and cycling: Findings from the transportation, urban design, and planning literatures. Ann. Behav. Med. 2003, 25, 80–91. [Google Scholar] [CrossRef]
- McPhearson, T.; Cook, E.M.; Berbés-Blázquez, M.; Cheng, C.; Grimm, N.B.; Andersson, E.; Barbosa, O.; Chandler, D.G.; Chang, H.; Chester, M.V.; et al. A social-ecological-technological systems framework for urban ecosystem services. One Earth 2022, 5, 505–518. [Google Scholar] [CrossRef]
- Page, M.J.; McKenzie, J.E.; Bossuyt, P.M.; Boutron, I.; Hoffmann, T.C.; Mulrow, C.D.; Shamseer, L.; Tetzlaff, J.M.; Akl, E.A.; Brennan, S.E.; et al. The PRISMA 2020 statement: An updated guideline for reporting systematic reviews. BMJ 2021, 372, n71. [Google Scholar] [CrossRef]
- Krizek, K.J.; El-Geneidy, A.; Thompson, K. A detailed analysis of how an urban trail system affects cyclists’ travel. Transportation 2007, 34, 611–624. [Google Scholar] [CrossRef]
- Li, Z.J.; Fan, W. Bicycle Ridership Using Crowdsourced Data: Ordered Probit Model Approach. J. Transp. Eng. Part A-Syst. 2020, 146, 15. [Google Scholar]
- Jestico, B.; Nelson, T.A.; Potter, J.; Winters, M. Multiuse trail intersection safety analysis: A crowdsourced data perspective. Accid. Anal. Prev. 2017, 103, 65–71. [Google Scholar] [CrossRef] [PubMed]
- Sims-Gould, J.; Race, D.L.; Vasaya, N.; McKay, H.A. A new urban greenway in Vancouver, British Columbia: Adolescents’ perspectives, experiences and vision for the future. J. Transp. Health 2019, 15, 100620. [Google Scholar] [CrossRef]
- Ravensbergen, L.; El-Geneidy, A. Toward Evidence-Based Urban Planning. J. Am. Plan. Assoc. 2022, 89, 389–398. [Google Scholar] [CrossRef]
- Krizek, K.J.; Johnson, P.J. Proximity to trails and retail: Effects on urban cycling and walking. J. Am. Plan. Assoc. 2007, 72, 33–42. [Google Scholar] [CrossRef]
- Anderson, C.E.; Zimmerman, A.; Lewis, S.; Marmion, J.; Gustat, J. Patterns of cyclist and pedestrian street crossing behavior and safety on an urban greenway. Int. J. Environ. Res. Public Health 2019, 16, 201. [Google Scholar] [CrossRef]
- Auchincloss, A.H.; Michael, Y.L.; Kuder, J.F.; Shi, J.; Khan, S.; Ballester, L.S. Changes in physical activity after building a greenway in a disadvantaged urban community: A natural experiment. Prev. Med. Rep. 2019, 15, 100941. [Google Scholar] [CrossRef]
- Dill, J.; McNeil, N.; Broach, J.; Ma, L. Bicycle boulevards and changes in physical activity and active transportation: Findings from a natural experiment. Prev. Med. 2014, 69, S74–S78. [Google Scholar] [CrossRef]
- Taylor, C.; Coutts, C. Greenways as safe routes to school in a Latino community in East Los Angeles. Cities Health 2018, 3, 141–157. [Google Scholar] [CrossRef]
- Chang, P.-J. Effects of the built and social features of urban greenways on the outdoor activity of older adults. Landsc. Urban Plan. 2020, 204, 103929. [Google Scholar] [CrossRef]
- Fitzhugh, E.C.; Bassett, D.R.; Evans, M.F. Urban trails and physical activity: A natural experiment. Am. J. Prev. Med. 2010, 39, 259–262. [Google Scholar] [CrossRef] [PubMed]
- Hirsch, J.A.; Meyer, K.A.; Peterson, M.; Zhang, L.; Rodriguez, D.A.; Gordon-Larsen, P. Municipal investment in off-road trails and changes in bicycle commuting in Minneapolis, Minnesota over 10 years: A longitudinal repeated cross-sectional study. Int. J. Behav. Nutr. Phys. Act. 2017, 14, 21. [Google Scholar] [CrossRef]
- Chi, W.; Lin, G. The Use of Community Greenways: A Case Study on A Linear Greenway Space in High Dense Residential Areas, Guangzhou. Land 2019, 8, 188. [Google Scholar] [CrossRef]
- Burbidge, S.K.; Goulias, K.G. Evaluating the Impact of Neighborhood Trail Development on Active Travel Behavior and Overall Physical Activity of Suburban Residents. Transp. Res. Rec. 2009, 2135, 78–86. [Google Scholar] [CrossRef]
- Gobster, P.H.; Sachdeva, S.; Lindsey, G. Up on the 606: Understanding the use of a new elevated pedestrian and bicycle trail in Chicago, Illinois. Transp. Res. Rec. 2017, 2644, 83–91. [Google Scholar] [CrossRef]
- Cook, T.J.; O’Brien, S.W.; Jackson, K.N.; Findley, D.J.; Searcy, S.E. Behavioral Effects of Completing a Critical Link in the American Tobacco Trail. Transp. Res. Rec. 2016, 2598, 19–26. [Google Scholar] [CrossRef]
- Zhao, J.; Guo, C.; Zhang, R.; Guo, D.; Palmer, M. Impacts of weather on cycling and walking on twin trails in Seattle. Transp. Res. Part D Transp. Environ. 2019, 77, 573–588. [Google Scholar] [CrossRef]
- Ermagun, A.; Lindsey, G.; Loh, T.H. Urban trails and demand response to weather variations. Transp. Res. Part D Transp. Environ. 2018, 63, 404–420. [Google Scholar] [CrossRef]
- Hankey, S.; Lindsey, G.; Wang, X.; Borah, J.; Hoff, K.; Utecht, B.; Xu, Z. Estimating use of non-motorized infrastructure: Models of bicycle and pedestrian traffic in Minneapolis, MN. Landsc. Urban Plan. 2012, 107, 307–316. [Google Scholar] [CrossRef]
- Lowry, M.; Loh, T.H. Quantifying bicycle network connectivity. Prev. Med. 2017, 95, S134–S140. [Google Scholar] [CrossRef] [PubMed]
- Prince, S.A.; Lancione, S.; Lang, J.J.; Amankwah, N.; De Groh, M.; Garcia, A.J.; Merucci, K.; Geneau, R. Are people who use active modes of transportation more physically active? An overview of reviews across the life course. Transp. Rev. 2022, 42, 645–671. [Google Scholar] [CrossRef]
- Guyatt, G.; Oxman, A.D.; Akl, E.A.; Kunz, R.; Vist, G.; Brozek, J.; Norris, S.; Falck-Ytter, Y.; Glasziou, P.; Debeer, H. GRADE guidelines: 1. Introduction—GRADE evidence profiles and summary of findings tables. J. Clin. Epidemiol. 2011, 64, 383–394. [Google Scholar] [CrossRef]
- Nordback, K.; Kothuri, S.; Petritsch, T.; McLeod, P.; Rose, E.; Twaddell, H. Exploring Pedestrian Counting Procedures: A Review and Compilation of Existing Procedures, Good Practices, and Recommendations; ICF International: Fairfax, VA, USA, 2016. [Google Scholar]
- Fabos, J.G. Introduction and overview: The greenway movement, uses and potentials of greenways. Landsc. Urban Plan. 1995, 33, 1–13. [Google Scholar] [CrossRef]
- Zhao, F.; Nie, R.; Zhang, J. Greenway implementation influence on agricultural heritage sites (AHS): The case of Liantang village of Zengcheng District, Guangzhou City, China. Sustainability 2018, 10, 434. [Google Scholar] [CrossRef]
- Ermagun, A.; Lindsey, G. Differences in Spending by Local Trail Users Two-Part Model of Expenditures. Transp. Res. Rec. 2016, 2598, 58–66. [Google Scholar] [CrossRef]
- Oswald Beiler, M.; Burkhart, K.; Nicholson, M. Evaluating the Impact of Rail-Trails: A Methodology for Assessing Travel Demand and Economic Impacts. Int. J. Sustain. Transp. 2015, 9, 509–519. [Google Scholar] [CrossRef]
- Martin, R.H.; Butler, D.R.; Klier, J. The influence of tire size on bicycle impacts to soil and vegetation. J. Outdoor Recreat. Tour. 2018, 24, 52–58. [Google Scholar] [CrossRef]
- Monz, C.; Kulmatiski, A. The emergence of “fat bikes” in the USA: Trends, potential consequences and management implications. J. Outdoor Recreat. Tour. 2016, 15, 20–25. [Google Scholar] [CrossRef]
- Sterl, P.; Brandenburg, C.; Arnberger, A. Visitors’ awareness and assessment of recreational disturbance of wildlife in the Donau-Auen National Park. J. Nat. Conserv. 2008, 16, 135–145. [Google Scholar] [CrossRef]
- Guttenplan, M.; Patten, R. Off-Road but on Track: Using Bicycle and Pedestrian Trails for Transportation; Transportation Research Board: Washington, DC, USA, 1995; pp. 7–11. [Google Scholar]
- Lindsey, G.; Han, Y.; Wilson, J.; Yang, J. Neighborhood Correlates of Urban Trail Use. J. Phys. Act. Health 2006, 3, 139–157. [Google Scholar] [CrossRef] [PubMed]
- Kullmann, K. Thin parks/thick edges: Towards a linear park typology for (post)infrastructural sites. J. Landsc. Archit. 2011, 6, 70–81. [Google Scholar] [CrossRef]
- City of Minneapolis Street Design Guide. Available online: https://sdg.minneapolismn.gov/street-types/parkway (accessed on 15 August 2021).
- Smart Growth America. Elements of a Complete Streets Policy; Federal Highway Administration: Washington, DC, USA, 2018. [Google Scholar]
- Handy, S.L.; Xing, Y.; Buehler, T.J. Factors associated with bicycle ownership and use: A study of six small U.S. cities. Transportation 2010, 37, 967–985. [Google Scholar] [CrossRef]
- Panter, J.R.; Jones, A.P.; van Sluijs, E.M.F. Environmental determinants of active travel in youth: A review and framework for future research. Int. J. Behav. Nutr. Phys. Act. Vol. 2008, 5, 34. [Google Scholar] [CrossRef]
- Almahmood, M.; Scharnhorst, E.; Carstensen, T.A.; Jørgensen, G.; Schulze, O. Mapping the gendered city: Investigating the socio-cultural influence on the practice of walking and the meaning of walkscapes among young Saudi adults in Riyadh. J. Urban Des. 2017, 22, 229–248. [Google Scholar] [CrossRef]
- Maghrabi, A.A. The Provision and Use of Urban Public Spaces for Female Physical Activity in Saudi Arabia; University of Salford: Salford, UK, 2019. [Google Scholar]
- Speck, J. Walkable City: How Downtown Can Save America, One Step at a Time; North Point Press: New York, NY, USA, 2012; p. 312. [Google Scholar]
- Ewing, R.; Handy, S. Measuring the Unmeasurable: Urban Design Qualities Related to Walkability. J. Urban Des. 2009, 14, 65–84. [Google Scholar] [CrossRef]
- UN-Habitat. Rules of the Game: Urban Legislation; UN-Habitat: Nairobi, Kenya, 2016; p. 40. [Google Scholar]
- Birge-Liberman, P. The Urban Sustainability Fix and The Rise of The Conservancy Park. In Deconstructing the High Line: Postindustrial Urbanism and the Rise of the Elevated Park; Rutgers University Press: New Brunswick, NJ, USA, 2017; pp. 125–140. [Google Scholar]
- Heathcott, J. The Promenade Plantée:Politics, Planning, and Urban Design in Postindustrial Paris. J. Plan. Educ. Res. 2013, 33, 280–291. [Google Scholar] [CrossRef]
- Larson, S. AA High Line for Queens: Celebrating diversity or displacing it? In Deconstructing the High Line: Postindustrial Urbanism and the Rise of the Elevated Park; Rutgers University Press: New Brunswick, NJ, USA, 2017; pp. 169–184. [Google Scholar]
- Loughran, K. Parks for profit: Public Space and Inequality in New York City. In Deconstructing the High Line: Postindustrial Urbanism and the Rise of the Elevated Park; Rutgers University Press: New Brunswick, NJ, USA, 2017; pp. 61–72. [Google Scholar]
- Roy, P. Collaborative planning—A neoliberal strategy? A study of the Atlanta BeltLine. Cities 2014, 43, 59–68. [Google Scholar] [CrossRef]
- Richards, R.; Murdoch, L.; Reeder, A.I.; Rosenby, M. Advocacy for active transport: Advocate and city council perspectives. Int. J. Behav. Nutr. Phys. Act. 2010, 7, 5. [Google Scholar] [CrossRef] [PubMed]
- Panter, J.R.; Jones, A. Attitudes and the environment as determinants of active travel in adults: What do and don’t we know? J Phys Act Health 2010, 7, 551–561. [Google Scholar] [CrossRef] [PubMed]
- Coutts, C.; Miles, R. Greenways as Green Magnets:The Relationship between the Race of Greenway Users and Race in Proximal Neighborhoods. J. Leis. Res. 2017, 43, 317–333. [Google Scholar] [CrossRef]
- Coutts, C. Multiple Case Studies of the Influence of Land-Use Type on the Distribution of Uses along Urban River Greenways. J. Urban Plan. Dev. 2009, 135, 31–38. [Google Scholar] [CrossRef]
- Chon, J.; Shafer, C.S. Aesthetic responses to urban greenway trail environments. Landsc. Res. 2009, 34, 83–104. [Google Scholar] [CrossRef]
- Price, A.E.; Reed, J.A.; Muthukrishnan, S. Trail user demographics, physical activity behaviors, and perceptions of a newly constructed greenway trail. J. Community Health 2012, 37, 949–956. [Google Scholar] [CrossRef]
- Lee, J.; Lee, H.S.; Jeong, D.; Shafer, C.S.; Chon, J. The relationship between user perception and preference of greenway trail characteristics in urban areas. Sustainability 2019, 11, 4438. [Google Scholar] [CrossRef]
- Liu, X.; Zhu, Z.; Jin, L.; Wang, L.; Huang, C. Measuring patterns and mechanism of greenway use – A case from Guangzhou, China. Urban For. Urban Green. 2018, 34, 55–63. [Google Scholar] [CrossRef]
- Gobster, P.H.; Westphal, L.M. The human dimensions of urban greenways: Planning for recreation and related experiences. Landsc. Urban Plan. 2004, 68, 147–165. [Google Scholar] [CrossRef]
- Zhao, Z.; Gan, H.; Qian, X.; Leng, J.; Wang, Y.; Wu, P. Riverside greenway in urban environment: Residents’ perception and use of greenways along the Huangpu river in Shanghai, China. Int. J. Environ. Res. Public Health 2021, 18, 1120. [Google Scholar] [CrossRef]
- Wolff, D.; Fitzhugh, E.C. The Relationships between Weather-Related Factors and Daily Outdoor Physical Activity Counts on an Urban Greenway. Int. J. Environ. Res. Public Health 2011, 8, 579–589. [Google Scholar] [CrossRef] [PubMed]
- Coutts, C. Greenway accessibility and physical-activity behavior. Environ. Plan. B Plan. Des. 2008, 35, 552–563. [Google Scholar] [CrossRef]
- Mowen, A.J.; Graefe, A.R.; Williams, D.R. An Assessment of Activity and Trail Type as Indicators of Trail User Diversity. J. Park Recreat. Adm. 1998, 16, 80–96. [Google Scholar]
- Reynolds, K.D.; Wolch, J.; Byrne, J.; Chou, C.P.; Feng, G.; Weaver, S.; Jerrett, M. Trail characteristics as correlates of urban trail use. Am. J. Health Promot. 2007, 21, 335–345. [Google Scholar] [CrossRef]
- Spruijt-Metz, D.; Wolch, J.; Jerrett, M.; Byrne, J.; Hsieh, S.; Myles, R.; Xie, B.; Wang, L.; Chou, C.P.; Reynolds, K.D. Development, reliability, and validity of an urban trail use survey. Am. J. Health Promot. 2010, 25, 2–11. [Google Scholar] [CrossRef]
- Gordon, P.M.; Zizzi, S.J.; Pauline, J. Use of a community trail among new and habitual exercisers: A preliminary assessment. Prev. Chronic Dis. 2004, 1, A11. [Google Scholar]
- Moore, R.L.; Leung, Y.-F.; Matisoff, C.; Dorwart, C.; Parker, A. Understanding users’ perceptions of trail resource impacts and how they affect experiences: An integrated approach. Landsc. Urban Plan. 2012, 107, 343–350. [Google Scholar] [CrossRef]
- Yabes, R.; Shetter, K.; Schneeman, J. Urban waterways: Changing historical uses and users in a southwestern desert city. Landsc. Urban Plan. 1997, 39, 167–185. [Google Scholar] [CrossRef]
- Asakawa, S.; Yoshida, K.; Yabe, K. Perceptions of urban stream corridors within the greenway system of Sapporo, Japan. Landsc. Urban Plan. 2004, 68, 167–182. [Google Scholar] [CrossRef]
- Banister, C.; Groome, D.; Pawson, G. The shared use debate: A discussion on the joint use of canal towing paths by walkers, anglers and cyclists. J. Environ. Manag. 1992, 34, 149–158. [Google Scholar] [CrossRef]
- Cleland, C.L.; Hunter, R.F.; Tully, M.A.; Scott, D.; Kee, F.; Donnelly, M.; Prior, L.; Cupples, M.E. Identifying solutions to increase participation in physical activity interventions within a socio-economically disadvantaged community: A qualitative study. Int. J. Behav. Nutr. Phys. Act. 2014, 11, 68. [Google Scholar] [CrossRef] [PubMed]
- Lee, B.; Shafer, C.S. The dynamic nature of leisure experience: An application of affect control theory. J. Leis. Res. 2002, 34, 290–310. [Google Scholar] [CrossRef]
- Lee, J.; Kweon, B.S.; Ellis, C.D.; Lee, S.W. Assessing the social value of ecosystem services for resilient riparian greenway planning and management in an urban community. Int. J. Environ. Res. Public Health 2020, 17, 3261. [Google Scholar] [CrossRef] [PubMed]
- Lindsey, G.; Knaap, G. Willingness to pay for urban greenway projects. J. Am. Plann. Assoc. 1999, 65, 297–313. [Google Scholar] [CrossRef]
- Pazin, J.; Garcia, L.M.T.; Florindo, A.A.; Peres, M.A.; de Azevedo Guimarães, A.C.; Borgatto, A.F.; da Silva Duarte, M.d.F. Effects of a new walking and cycling route on leisure-time physical activity of Brazilian adults: A longitudinal quasi-experiment. Health Place 2016, 39, 18–25. [Google Scholar] [CrossRef]
- Xie, B.; Lu, Y.; Wu, L.; An, Z. Dose-response effect of a large-scale greenway intervention on physical activities: The first natural experimental study in China. Health Place 2021, 67, 102502. [Google Scholar] [CrossRef]
- West, S.T.; Shores, K.A. The Impacts of Building a Greenway on Proximate Residents’ Physical Activity. J. Phys. Act. Health 2011, 8, 1092–1097. [Google Scholar] [CrossRef]
- Dorwart, C.E. Views from the path: Evaluating physical activity use patterns and design preferences of older adults on the bolin creek greenway trail. J. Aging Phys. Act. 2015, 23, 513–523. [Google Scholar] [CrossRef]
- Burchfield, R.A.; Fitzhugh, E.C.; Bassett, D.R. The association of trail use with weather-related factors on an urban greenway. J. Phys. Act. Health 2012, 9, 188–197. [Google Scholar] [CrossRef]
- West, S.T.; Shores, K.A. Does building a greenway promote physical activity among proximate residents? J. Phys. Act. Health 2015, 12, 52–57. [Google Scholar] [CrossRef]
- Furuseth, O.J.; Altman, R.E. Who’s on the greenway: Socioeconomic, demographic, and locational characteristics of greenway users. Environ. Manag. 1991, 15, 329–336. [Google Scholar] [CrossRef]
- Bush, R. Exploring your own backyard: Measurement of greenway use in cary, North Carolina. Transp. Res. Rec. 2011, 2264, 92–100. [Google Scholar] [CrossRef]
- Zhao, N.; Liu, Z.; Lin, Y.; De Meulder, B. User, public, and professional perceptions of the greenways in the Pearl River Delta, China. Sustainability 2019, 11, 7211. [Google Scholar] [CrossRef]
- Chen, Y.; Gu, W.; Liu, T.; Yuan, L.; Zeng, M. Increasing the use of urban greenways in developing countries: A case study on Wutong greenway in Shenzhen, China. Int. J. Environ. Res. Public Health 2017, 14, 554. [Google Scholar] [CrossRef] [PubMed]
- Liu, K.; Siu, K.W.M.; Gong, X.Y.; Gao, Y.; Lu, D. Where do networks really work? The effects of the Shenzhen greenway network on supporting physical activities. Landsc. Urban Plan. 2016, 152, 49–58. [Google Scholar] [CrossRef]
- Lindsey, G.; Maraj, M.; Kuan, S.C. Access, Equity, and Urban Greenways: An Exploratory Investigation. Prof. Geogr. 2001, 53, 332–346. [Google Scholar] [CrossRef]
- Zhang, F.; Chung, C.K.L.; Yin, Z. Green infrastructure for China’s new urbanisation: A case study of greenway development in Maanshan. Urban Stud. 2020, 57, 508–524. [Google Scholar] [CrossRef]
- Larson, L.R.; Keith, S.J.; Fernandez, M.; Hallo, J.C.; Shafer, C.S.; Jennings, V. Ecosystem services and urban greenways: What’s the public’s perspective? Ecosyst. Serv. 2016, 22, 111–116. [Google Scholar] [CrossRef]
- Weber, S.; Bynum Boley, B.; Palardy, N.; Gaither, C.J. The impact of urban greenways on residential concerns: Findings from the Atlanta BeltLine Trail. Landsc. Urban Plan. 2017, 167, 147–156. [Google Scholar] [CrossRef]
- Palardy, N.P.; Bynum Boley, B.; Gaither, C.J. Residents and urban greenways: Modeling support for the Atlanta BeltLine. Landsc. Urban Plan. 2017, 169, 250–259. [Google Scholar] [CrossRef]
- Dilley, J.R.; Moore, J.B.; Summers, P.; Price, A.A.; Burczyk, M.; Byrd, L.; Sisson, P.J.; Bertoni, A.G. A Citizen Science Approach to Determine Physical Activity Patterns and Demographics of Greenway Users in Winston-Salem, North Carolina. Int. J. Environ. Res. Public Health Artic. 2019, 16, 3150. [Google Scholar] [CrossRef] [PubMed]
- Keith, S.J.; Larson, L.R.; Shafer, C.S.; Hallo, J.C.; Fernandez, M. Greenway use and preferences in diverse urban communities: Implications for trail design and management. Landsc. Urban Plan. 2018, 172, 47–59. [Google Scholar] [CrossRef]
- Reichhart, T.; Arnberger, A. Exploring the influence of speed, social, managerial and physical factors on shared trail preferences using a 3D computer animated choice experiment. Landsc. Urban Plan. 2010, 96, 1–11. [Google Scholar] [CrossRef]
- Deyo, N.; Bohdan, M.; Burke, R.; Kelley, A.; Van Der Werff, B.; Blackmer, E.D.; Grese, R.E.; Reo, N.J. Trails on tribal lands in the United States. Landsc. Urban Plan. 2014, 125, 130–139. [Google Scholar] [CrossRef]
- Schneider, I.E.; Budruk, M.; Shinew, K.; Wynveen, C.J.; Stein, T.; Vanderwoude, D.; Hendricks, W.W.; Gibson, H. COVID-19 compliance among urban trail users: Behavioral insights and environmental implications. J. Outdoor Recreat. Tour. 2021, 41, 100396. [Google Scholar] [CrossRef]
- Wang, X.; Lindsey, G.; Hankey, S.; Hoff, K. Estimating Mixed-Mode Urban Trail Traffic Using Negative Binomial Regression Models. J. Urban Plan. Dev. 2014, 140, 04013006. [Google Scholar] [CrossRef]
- Lindsey, G.; Wilson, J.; Rubchinskaya, E.; Yang, J.; Han, Y. Estimating urban trail traffic: Methods for existing and proposed trails. Landsc. Urban Plan. 2007, 81, 299–315. [Google Scholar] [CrossRef]
- Lindsey, P.; Lindsey, G. Using pedestrian count models to estimate urban trail traffic. J. Reg. Anal. Policy 2004, 34, 1–18. [Google Scholar]
- Ermagun, A.; Lindsey, G.; Loh, T. Bicycle, pedestrian, and mixed-mode trail traffic: A performance assessment of demand models. Landsc. Urban Plan. 2018, 177, 92–102. [Google Scholar] [CrossRef]
- Clark, S.; Bungum, T.; Shan, G.; Meacham, M.; Coker, L. The effect of a trail use intervention on urban trail use in Southern Nevada. Prev. Med. 2014, 67, S17–S20. [Google Scholar] [CrossRef]
- Götschi, T.; Hadden Loh, T. Advancing project-scale health impact modeling for active transportation: A user survey and health impact calculation of 14 US trails. J. Transp. Health 2017, 4, 334–347. [Google Scholar] [CrossRef]
- He, H.; Li, J.; Lin, X.; Yu, Y. Greenway Cyclists’ Visual Perception and Landscape Imagery Assessment. Front. Psychol. 2021, 12, 541469. [Google Scholar] [CrossRef]
- Keith, S.J.; Boley, B.B. Importance-performance analysis of local resident greenway users: Findings from Three Atlanta BeltLine Neighborhoods. Urban For. Urban Green. 2019, 44, 126426. [Google Scholar] [CrossRef]
- Kelley, H.; van Rensburg, T.M.; Jeserich, N. Determinants of demand for recreational walking trails in Ireland. Tour. Manag. 2016, 52, 173–186. [Google Scholar] [CrossRef]
- Kil, N.; Stein, T.V.; Holland, S.M. Influences of wildland–urban interface and wildland hiking areas on experiential recreation outcomes and environmental setting preferences. Landsc. Urban Plan. 2014, 127, 1–12. [Google Scholar] [CrossRef]
- Kyle, G.; Graefe, A.; Manning, R.; Bacon, J. Effects of place attachment on users’ perceptions of social and environmental conditions in a natural setting. J. Environ. Psychol. 2004, 24, 213–225. [Google Scholar] [CrossRef]
- Langford, B.C.; Chen, J.; Cherry, C.R. Risky riding: Naturalistic methods comparing safety behavior from conventional bicycle riders and electric bike riders. Accid. Anal. Prev. 2015, 82, 220–226. [Google Scholar] [CrossRef] [PubMed]
- Librett, J.J.; Yore, M.M.; Schmid, T.L. Characteristics of Physical Activity Levels Among Trail Users in a U.S. National Sample. Am. J. Prev. Med. 2006, 31, 399–405. [Google Scholar] [CrossRef] [PubMed]
- Liu, K.; Siu, K.W.M.; Gong, Y.X.; Gao, Y.; Lu, D. Data on the distribution of physical activities in the Shenzhen greenway network with volunteered geographic information. Data Brief 2016, 8, 14–20. [Google Scholar] [CrossRef]
- Moudon, A.V.; Lee, C.; Cheadle, A.D.; Collier, C.W.; Johnson, D.; Schmid, T.L.; Weather, R.D. Cycling and the built environment, a US perspective. Transp. Res. Part D Transp. Environ. 2005, 10, 245–261. [Google Scholar] [CrossRef]
- Wang, G.; Macera, C.A.; Scudder-Soucie, B.; Schmid, T.; Pratt, M.; Buchner, D. Cost effectiveness of a bicycle/pedestrian trail development in health promotion. Prev. Med. 2004, 38, 237–242. [Google Scholar] [CrossRef]
- Zhang, S.Q.; Stewart, W.P.; Chan, E.S.W. Place-Making upon Return Home: Influence of Greenway Experiences. Leis. Sci. 2020, 25, 46–70. [Google Scholar] [CrossRef]
- Wu, J.; Rappazzo, K.M.; Simpson, R.J.; Joodi, G.; Pursell, I.W.; Mounsey, J.P.; Cascio, W.E.; Jackson, L.E. Exploring links between greenspace and sudden unexpected death: A spatial analysis. Environ. Int. 2018, 113, 114–121. [Google Scholar] [CrossRef] [PubMed]
- Price, A.E.; Reed, J.A.; Long, S.; Maslow, A.L.; Hooker, S.P. The association of natural elements with physical activity intensity during trail use by older adults. J. Phys. Act. Health 2012, 9, 718–723. [Google Scholar] [CrossRef] [PubMed]
- Anna, A.E.; Reed, J.A.; Hooker, S.P. The association of natural elements and trail use by adults. Prev. Chronic Dis. 2012, 9, E06. [Google Scholar]
- Harris, B.; Schmalz, D.; Larson, L.; Fernandez, M. Fear of the Unknown: Examining Neighborhood Stigma’s Effect on Urban Greenway Use and Surrounding Communities. Urban Aff. Rev. 2021, 57, 1015–1048. [Google Scholar] [CrossRef]
- Troped, P.J.; Saunders, R.P.; Pate, R.R.; Reininger, B.; Ureda, J.R.; Thompson, S.J. Associations between self-reported and objective physical environmental factors and use of a community rail-trail. Prev. Med. 2001, 32, 191–200. [Google Scholar] [CrossRef]
- Merom, D.; Bauman, A.; Vita, P.; Close, G. An environmental intervention to promote walking and cycling—The impact of a newly constructed Rail Trail in Western Sydney. Prev. Med. 2003, 36, 235–242. [Google Scholar] [CrossRef]
- Hughey, S.M. Pathways to Health: Association Between Trail Use, Weight Status, and Self-Rated Health Among Adults in Greenville County, South Carolina, 2014. Prev. Chronic Dis. 2016, 13, 160197. [Google Scholar] [CrossRef]
- Maslow, A.L.; Reed, J.A.; Price, A.E.; Hooker, S.P. Associations between sociodemographic characteristics and perceptions of the built environment with the frequency, type, and duration of physical activity among trail users. Prev. Chronic Dis. 2012, 9, E53. [Google Scholar] [CrossRef]
- Palardy, N.P.; Bynum Boley, B.; Gaither, C.J. Resident support for urban greenways across diverse neighborhoods: Comparing two Atlanta BeltLine segments. Landsc. Urban Plan. 2018, 180, 223–233. [Google Scholar] [CrossRef]
- Sim, J.; Bohannon, C.L.; Miller, P. What park visitors survey tells us: Comparing three elevated parks-the high line, 606, and high bridge. Sustainability 2020, 12, 121. [Google Scholar] [CrossRef]
- Abildso, C.G.; Zizzi, S.; Abildso, L.C.; Steele, J.C.; Gordon, P.M. Built environment and psychosocial factors associated with trail proximity and use. Am. J. Health Behav. 2007, 31, 374–383. [Google Scholar] [CrossRef] [PubMed]
- Betz, C.J.; Bergstrom, J.C.; Bowker, J.M. A Contingent Trip Model for Estimating Rail-trail Demand. J. Environ. Plan. Manag. 2003, 46, 79–96. [Google Scholar] [CrossRef]
- Verlič, A.; Arnberger, A.; Japelj, A.; Simončič, P.; Pirnat, J. Perceptions of recreational trail impacts on an urban forest walk: A controlled field experiment. Urban For. Urban Green. 2015, 14, 89–98. [Google Scholar] [CrossRef]
- Hughey, S.M.; Reed, J.A.; Kaczynski, A.T. Demographic differences in reported reasons for non-use of a prominent community trail. J. Outdoor Recreat. Tour. 2015, 10, 78–83. [Google Scholar] [CrossRef]
- Mieno, T.; Shoji, Y.; Aikoh, T.; Arnberger, A.; Eder, R. Heterogeneous preferences for social trail use in the urban forest: A latent class model. Urban For. Urban Green. 2016, 19, 20–28. [Google Scholar] [CrossRef]
- Greer, K.; Day, K.; McCutcheon, S. Efficacy and perception of trail use enforcement in an urban natural reserve in San Diego, California. J. Outdoor Recreat. Tour. 2017, 18, 56–64. [Google Scholar] [CrossRef]
- Sever, I.; Verbič, M. Providing information to respondents in complex choice studies: A survey on recreational trail preferences in an urban nature park. Landsc. Urban Plan. 2018, 169, 160–177. [Google Scholar] [CrossRef]
- Sever, I.; Verbič, M.; Marušić, Z. Measuring trail users’ perception of crowding in a peri-urban nature park: A best-worst scaling experiment. Urban For. Urban Green. 2018, 35, 202–210. [Google Scholar] [CrossRef]
- Peterson, B.A.; Brownlee, M.T.J.; Marion, J.L. Mapping the relationships between trail conditions and experiential elements of long-distance hiking. Landsc. Urban Plan. 2018, 180, 60–75. [Google Scholar] [CrossRef]
- Arnberger, A.; Aikoh, T.; Eder, R.; Shoji, Y.; Mieno, T. How many people should be in the urban forest? A comparison of trail preferences of Vienna and Sapporo forest visitor segments. Urban For. Urban Green. 2010, 9, 215–225. [Google Scholar] [CrossRef]
- Arnberger, A.; Eder, R.; Allex, B.; Preisel, H.; Ebenberger, M.; Husslein, M. Trade-offs between wind energy, recreational, and bark-beetle impacts on visual preferences of national park visitors. Land Use Policy 2018, 76, 166–177. [Google Scholar] [CrossRef]
- Arnberger, A.; Haider, W. Social effects on crowding preferences of urban forest visitors. Urban For. Urban Green. 2005, 3, 125–136. [Google Scholar] [CrossRef]
- Arnberger, A.; Schneider, I.E.; Ebenberger, M.; Eder, R.; Venette, R.C.; Snyder, S.A.; Gobster, P.H.; Choi, A.; Cottrell, S. Emerald ash borer impacts on visual preferences for urban forest recreation settings. Urban For. Urban Green. 2017, 27, 235–245. [Google Scholar] [CrossRef]
- Evju, M.; Hagen, D.; Jokerud, M.; Olsen, S.L.; Selvaag, S.K.; Vistad, O.I. Effects of mountain biking versus hiking on trails under different environmental conditions. J. Environ. Manag. 2021, 278, 111554. [Google Scholar] [CrossRef]
- Fisher, D.M.; Wood, S.A.; White, E.M.; Blahna, D.J.; Lange, S.; Weinberg, A.; Tomco, M.; Lia, E. Recreational use in dispersed public lands measured using social media data and on-site counts. J. Environ. Manag. 2018, 222, 465–474. [Google Scholar] [CrossRef]
- Jackson, S.A.; Haider, W.; Elliot, T. Resolving inter-group conflict in winter recreation: Chilkoot Trail National Historic Site, British Columbia. J. Nat. Conserv. 2003, 11, 317–323. [Google Scholar] [CrossRef]
- Koemle, D.B.A.; Morawetz, U.B. Improving mountain bike trails in Austria: An assessment of trail preferences and benefits from trail features using choice experiments. J. Outdoor Recreat. Tour. 2016, 15, 55–65. [Google Scholar] [CrossRef]
- Korpilo, S.; Virtanen, T.; Saukkonen, T.; Lehvävirta, S. More than A to B: Understanding and managing visitor spatial behaviour in urban forests using public participation GIS. J. Environ. Manag. 2018, 207, 124–133. [Google Scholar] [CrossRef]
- Neumann, P.; Mason, C.W. Managing land use conflict among recreational trail users: A sustainability study of cross-country skiers and fat bikers. J. Outdoor Recreat. Tour. 2019, 28, 100220. [Google Scholar] [CrossRef]
- Neuvonen, M.; Pouta, E.; Puustinen, J.; Sievänen, T. Visits to national parks: Effects of park characteristics and spatial demand. J. Nat. Conserv. 2010, 18, 224–229. [Google Scholar] [CrossRef]
- Norman, P.; Pickering, C.M. Factors influencing park popularity for mountain bikers, walkers and runners as indicated by social media route data. J. Environ. Manag. 2019, 249, 109413. [Google Scholar] [CrossRef] [PubMed]
- Pettebone, D.; Meldrum, B.; Leslie, C.; Lawson, S.R.; Newman, P.; Reigner, N.; Gibson, A. A visitor use monitoring approach on the Half Dome cables to reduce crowding and inform park planning decisions in Yosemite National Park. Landsc. Urban Plan. 2013, 118, 1–9. [Google Scholar] [CrossRef]
- MacBride-Stewart, S. Discourses of wellbeing and environmental impact of trail runners in protected areas in New Zealand and the United Kingdom. Geoforum 2019, 107, 134–142. [Google Scholar] [CrossRef]
- Meijles, E.W.; de Bakker, M.; Groote, P.D.; Barske, R. Analysing hiker movement patterns using GPS data: Implications for park management. Comput. Environ. Urban Syst. 2014, 47, 44–57. [Google Scholar] [CrossRef]
- Mirzaalian, F.; Halpenny, E. Exploring destination loyalty: Application of social media analytics in a nature-based tourism setting. J. Destin. Mark. Manag. 2021, 20, 100598. [Google Scholar] [CrossRef]
- Pickering, C.M.; Rossi, S. Mountain biking in peri-urban parks: Social factors influencing perceptions of conflicts in three popular National Parks in Australia. J. Outdoor Recreat. Tour. 2016, 15, 71–81. [Google Scholar] [CrossRef]
- Rosa, J.C.S.; Geneletti, D.; Morrison-Saunders, A.; Sánchez, L.E.; Hughes, M. To what extent can mine rehabilitation restore recreational use of forest land? Learning from 50 years of practice in southwest Australia. Land Use Policy 2020, 90, 104290. [Google Scholar] [CrossRef]
- Santos, T.; Nogueira Mendes, R.; Vasco, A. Recreational activities in urban parks: Spatial interactions among users. J. Outdoor Recreat. Tour. 2016, 15, 1–9. [Google Scholar] [CrossRef]
- Sever, I.; Verbič, M. Assessing recreational values of a peri-urban nature park by synthesizing perceptions and preferences of trail users. J. Environ. Psychol. 2019, 63, 101–108. [Google Scholar] [CrossRef]
- Janowsky, D.V.; Becker, G. Characteristics and needs of different user groups in the urban forest of Stuttgart. J. Nat. Conserv. 2003, 11, 251–259. [Google Scholar] [CrossRef]
- Zajc, P.; Berzelak, N. Riding styles and characteristics of rides among Slovenian mountain bikers and management challenges. J. Outdoor Recreat. Tour. 2016, 15, 10–19. [Google Scholar] [CrossRef]
- Zhai, Y.; Korça Baran, P.; Wu, C. Can trail spatial attributes predict trail use level in urban forest park? An examination integrating GPS data and space syntax theory. Urban For. Urban Green. 2018, 29, 171–182. [Google Scholar] [CrossRef]
- Christie, M.; Hanley, N.; Hynes, S. Valuing enhancements to forest recreation using choice experiment and contingent behaviour methods. J. For. Econ. 2007, 13, 75–102. [Google Scholar] [CrossRef]
- Beeco, J.A.; Hallo, J.C.; English, W.R.; Giumetti, G.W. The importance of spatial nested data in understanding the relationship between visitor use and landscape impacts. Appl. Geogr. 2013, 45, 147–157. [Google Scholar] [CrossRef]
- Akpinar, A. Factors influencing the use of urban greenways: A case study of Aydın, Turkey. Urban For. Urban Green. 2016, 16, 123–131. [Google Scholar] [CrossRef]
- Deenihan, G.; Caulfield, B.; O’Dwyer, D. Measuring the success of the Great Western Greenway in Ireland. Tour. Manag. Perspect. 2013, 7, 73–82. [Google Scholar] [CrossRef]
- Reed, J.A.; Ainsworth, B.E.; Wilson, D.K.; Mixon, G.; Cook, A. Awareness and use of community walking trails. Prev. Med. 2004, 39, 903–908. [Google Scholar] [CrossRef]
- Beach, C.; Billstrom, G.; Steeves, E.T.A.; Flynn, J.I.; Steeves, J.A. The Physical Activity Patterns of Greenway Users Playing Pokemon Go: A Natural Experiment. Games Health J. 2019, 8, 7–14. [Google Scholar] [CrossRef]
- Chang, P.-J.; Tsou, C.-W.; Li, Y.-S. Urban-greenway factors’ influence on older adults’ psychological well-being: A case study of Taichung, Taiwan. Urban For. Urban Green. 2020, 49, 126606. [Google Scholar] [CrossRef]
- Korver-Glenn, E.; Jain, M.; Thompson, J.; Steinberg, A.; Herkes, D.; Kramer, T. Environmental Equality in Neighborhood Amenities and Planning: A Houston, Texas, Case Study. Environ. Justice 2017, 10, 193–200. [Google Scholar] [CrossRef]
- Liu, W.Y.; Chuang, C. Preferences of tourists for the service quality of taichung calligraphy greenway in Taiwan. Forests 2018, 9, 462. [Google Scholar] [CrossRef]
- Harris, B.; Larson, L.; Ogletree, S. Different Views From The 606: Examining the Impacts of an Urban Greenway on Crime in Chicago. Environ. Behav. 2018, 50, 56–85. [Google Scholar] [CrossRef]
- Harris, B.; Rigolon, A.; Fernandez, M. “To them, we’re just kids from the hood”: Citizen-based policing of youth of color, “white space,” and environmental gentrification. Cities 2020, 107, 102885. [Google Scholar] [CrossRef]
- Harris, B.; Schmalz, D.; Larson, L.; Fernandez, M.; Griffin, S. Contested Spaces: Intimate Segregation and Environmental Gentrification on Chicago’s 606 Trail. City Commun. 2021, 19, 933–962. [Google Scholar] [CrossRef]


Disclaimer/Publisher’s Note: The statements, opinions and data contained in all publications are solely those of the individual author(s) and contributor(s) and not of MDPI and/or the editor(s). MDPI and/or the editor(s) disclaim responsibility for any injury to people or property resulting from any ideas, methods, instructions or products referred to in the content. |
© 2023 by the authors. Licensee MDPI, Basel, Switzerland. This article is an open access article distributed under the terms and conditions of the Creative Commons Attribution (CC BY) license (https://creativecommons.org/licenses/by/4.0/).