Article

Practical Approach for Defining the Sustainable Yield of Wells in Low-Permeability Fractured Rocks

1
Department of Ecological and Biological Science, Tuscia University, 01100 Viterbo, Italy
2
Department of Geology, Hawassa University, Hawassa P.O. Box 05, Ethiopia
3
Kataclima Srl Società Benefit, 01019 Vetralla, Italy
*
Author to whom correspondence should be addressed.
Sustainability 2023, 15(13), 10706; https://doi.org/10.3390/su151310706
Submission received: 7 June 2023 / Revised: 1 July 2023 / Accepted: 4 July 2023 / Published: 7 July 2023
(This article belongs to the Section Environmental Sustainability and Applications)

Abstract

:
Groundwater sustainability is still an open question. Theoretical and practical approaches to the definition of groundwater sustainability were mainly developed on large scales, while few studies are available for its definition at a single well scale, especially in fractured aquifers. This study examines how much the sustainable yield of a well in fractured aquifers depends on the trend of drawdown over time. For this aim, pumping tests conducted in fractured rocks were considered and analytical models were applied to examine the long-term response of groundwater levels in some wells. To define the operational pumping flow of a well in these aquifers, results show that long constant flow rate pumping tests are preferred to step-drawdown tests. The late drawdown–time curve and residual drawdown segment-curves during the recovery, approximated by power, exponential or polynomial equations, represent the first step to extrapolating the long-term drawdown in the well. This prediction combined with the assessment of a drawdown limit in the well (as a function of the saturated thickness of the aquifer) are essential to plan the first operation of the well (flow rate and time of pumping). Subsequently, through the monitoring of this first operation step, the following operation phases can be updated and improved.

1. Introduction

Groundwater sustainability is a crucial issue nowadays. A concise and effective definition of this concept was given by Alley et al. [1] as the development and use of groundwater resources to meet current and future beneficial uses without causing unacceptable environmental, economic or social consequences. Since the 1950s, the matter has been introduced in hydrogeological literature. In the last thirty years the approach to groundwater sustainability has been largely refined, identifying the connections of groundwater resources with surface waters and ecosystems (see Elshall et al. [2] for an updated review on the topic and available literature).
Most definitions of groundwater sustainability have been developed mainly at the groundwater basin or aquifer scales. On the other hand, when the task is to define the sustainable pumping flow from a single well considering its long-term impact on groundwater, few studies are available, especially regarding fractured aquifers. Concerning these types of aquifers, the “reliable yield of a well” [3] and the “sustainable yield of a well” [4] are the concepts found in the scientific literature. In general, these concepts refer to the productivity of the well that allows it to contain its negative impact on the groundwater resources ensuring its long-time operation.
The “reliable yield of a well” depends on deployable output, which considers the supply constraints (license, water quality, environment, etc.) and potential yield, which is a function of only the characteristics of the well and the aquifer. The potential yield can be determined from the intersection of the drought curve (i.e., the deepest pumping and non-pumping water levels during the worst drought condition) with the deepest advisable pumping water level (i.e., the level below which undesirable effects such as dewatering or sand pumping may occur). In the case of a new well, with no operational records, an analytical approach can be used to determine the potential yield and then the reliable yield. This method consists of the calculation of short-term drawdown, derived from pumping tests (for example, step-test data), extrapolation of longer-term pumping drawdown trend (for example, 200 days) and its conversion, taking into account the drought water level [3,5].
The “sustainable yield of a well” is defined as the discharge rate that will not cause the water level in the well to drop below a prescribed limit, connected with the nature and thickness of the aquifer and the depth of the well. Basically, the sustainable yield can be determined from both the drawdown of the well, corresponding to the prescribed limit, and the time within which the drawdown shall not exceed this limit. So, it is necessary to have data on the drawdown over a long period, which is generally extrapolated on the basis of pumping tests [4].
Other studies on fractured aquifers show that drawdown extrapolated from pumping tests, when interpreted considering the operational data of the well during seasonal variations, forms the basis for predicting the well yield according to the definition of reliable yield or sustainable yield of a well [6]. Pumping at constant drawdown was also tested to determine a variable sustainable yield, which is useful in specific cases such as when it is necessary to maintain a constant quality over time of water extracted from the well [7,8].
Whether reference is made to the reliable yield of a well (as defined by Misstear and Beeson [3]) or to the sustainable yield of a well (as defined by Van Tonder et al. [4]), it is important to acquire the drawdown trend over time both in the well and in the aquifer to determine the operative flow of the well.
Based on the above considerations, although the strong heterogeneity of fractured aquifers complicates the interpretation of the results of the pumping tests, these remain the master method of investigating the response of the aquifer to pumping. The purpose of this study is to examine how much the sustainable yield of a well in fractured aquifers depends on the trend of drawdown over time. For this aim, some pumping tests conducted in low-permeability fractured rocks were considered and analytical models were applied to assess the long-term response of the groundwater level in the well.

2. Materials and Methods

The dependence of the sustainable yield of a well on the drawdown trend over time has been examined with reference to two experimental sites consisting of fractured rocks, which are commonly considered low-productive in groundwater.

2.1. Climatic and Geological Framework of the Test Sites

The two test sites are located at altitudes from 900 to 1100 m asl in western Turkey in an area characterized by a Mediterranean climate with dry, hot summer and cool, wet winter. The average yearly rainfall is 724 mm, of which most occurs in the winter months; the average yearly air temperature is 14 °C [9]. A rectangular drainage pattern typifies the area including ephemeral and perennial streams.
The geology of the area is characterized by a thick cover of volcanic rocks of Early to Middle Miocene in age. These rocks are mainly represented by andesitic and rhyodacitic lavas, consisting of plagioclase, sanidine, biotite, hornblende and pyroxene phenocrysts in trachytic matrix. Pyroclastic flow and fall deposits are recognized in the upper part of the volcanic succession. Volcanic rocks overlay the metamorphic basement of Paleozoic to Triassic age, including phyllites, schists and recrystallized limestones. Plutonic rocks constituted by granodiorite and granites were emplaced into the metamorphic rocks during the Late Oligocene–Early Miocene period [10,11,12]. The tectonic style is governed by several compressional and extensional deformational phases, Cenozoic extensional tectonics are still effective in the region. Folds around E-W-trending axes are recognized mostly in the Lower-Middle Miocene succession. Faults are the most dominant structures and can be distinguished in three groups: E-W-trending faults, NE-SW-trending faults and NNW-SSE-trending faults. They are the consequences of different tectonic phases which deeply affected the region from Early Miocene to Pliocene [12,13].
Concerning this area, few regional hydrogeological studies are available, volcanic rocks are classified as local or discontinuous productive aquifers, while metamorphic and intrusive rocks are considered very low yield in groundwater [14]. Besides this overall classification, in the few cases of wells tested in this hydrogeological environment, it appears that they can provide water for the local, small communities [15].

2.2. Hydrogeological Investigations

At the experimental sites, hydrogeological investigations have been carried out, including surveys of surface geology, analysis of drilling logging data and pumping tests.
The outcropping geological units have been mapped together with the lineaments obtained from the analysis of drainage pattern and aerial photos. The geology of the subsoil has been reconstructed by means of surface surveys and drilling data. The latter concerns 11 boreholes drilled by continuous core recovery that allowed the definition of the stratigraphy of the subsurface and the Rock Quality Designation (RQD) of the rocks. Further information on stratigraphy was obtained during the drilling of the wells subsequently used for pumping tests.
Pumping tests have been performed on six wells with a depth ranging between 95 and 267 m and screened in the fissured layers of the aquifer formations. Each test conducted at a constant flow rate lasted from a minimum of 11 h to a maximum of 115 h. Drawdown was measured in the pumping well and in observation wells. Pressure transducers combined with data loggers have been used for the continuous monitoring of water levels (generally with a measuring interval of one minute); in addition, periodic manual measurements have been conducted. The flow rate during the test has been monitored with an in-line flow meter and calibrated container, resulting in pumping rate variations within ±10%, generally.
The available meteorological and river flow data were acquired for an initial assessment of the recharge of the aquifer. Specifically, the average annual values of precipitation and air temperature for the period of 1991–2020 of the Balikesir District and the average values of flow rate of the Orhaneli Cayi River (1978–1985) have been considered [9]. These are the only available data for a basin with geological units and morphology comparable with the site tests under examination.

2.3. Processing Methods

The borehole logs and the surface surveys allowed the reconstruction of the geological and hydrogeological structure of the two test sites.
The water level data acquired during the pumping tests have been pre-processed to reduce the noise due to the high frequency of measurements, pump instability and barometric pressure fluctuations. First, the drawdown data versus time have been analyzed through semi-log plots; the smoothed time series’ have then been represented on bi-log plots together with the first derivative of the drawdown, determined through the Spline function [16].
The trends of the drawdown and its derivative on bi-log plots have been compared with theoretical curves identifying the flow regime through the flow dimension n [17,18,19,20]. This qualitative diagnosis allowed us to select the most consistent conceptual models for the measured data. Among the selected conceptual models, the most appropriate one has been identified considering the geological and hydrogeological settings of the test site, especially considering a non-unicity of the drawdown and derivative signals results. Subsequently, the aquifer parameters have been determined automatically by commercial software (Aquifer Test Pro 10.0, [21]) and manually by analytical techniques [22,23] using the best fit of drawdown and the model’s type curves. Based on the different data resulting from the pumping tests, the most critical cases for the long-term well productivity have been selected. Then, starting from the interpretative model of the pumping test, the long-term drawdown trend has been hypothesized, and by coupling it with the characteristics of the well, different pumping scenarios have been simulated using both analytic methods and MLU software [24,25]. Specifically, the drawdown–time data measured in the pumping well and, where available, the recovery data were interpolated by power, exponential or polynomial equations, verifying the discrepancy between the measured and interpolated data. These calculations were conducted by using Excel spreadsheets. The obtained analytical equations were then used to simulate the drawdown–time and residual drawdown–time trends in the well by varying the pumping flow rates. The analytical equations were additionally checked through MLU software. In particular, hydrogeological parameters determined by MLU software, using the measured drawdown and residual drawdown data, were then adopted to generate the drawdown and residual drawdown trends in the pumping well under different flow rate conditions and compared with those obtained from the analytical model.

3. Results

3.1. Geology and Hydrogeology of the Test Sites

The obtained geological and hydrogeological characteristics of the two test sites are schematically represented in Figure 1.
The first test site (hereinafter referred to as AND test site) concerned the Lower-Middle Miocene volcanic association (Figure 1a,b). The subsoil, investigated by means of nine wells and seven boreholes up to 400 m deep, consists of porphyry andesites interbedded with levels of brecciated andesites, quartz veins and hypabyssal intrusions, below a thin thickness of residual and eluvial soils (<10 m). The andesitic rocks are highly fractured up to 150–200 m of depth, where continuous variations of RQD values from 0 to 70% have been found. At higher depths, RQD values below 50% are significantly less frequent. A continuous, highly fractured horizon of andesitic rocks 60–90 m thick has been identified through RQD logs at a depth ranging between 100 and 200 m. This horizon represents the aquifer formation intercepted by the wells, during the drilling of which water level slightly rises inside the wells. Groundwater level roughly follows the topography with a hydraulic gradient of 5–10%.
In the second test site (hereinafter referred to as MET test site) the Triassic metamorphic basement widely outcrops (Figure 1c,d). The subsoil, investigated by means of seven wells and four boreholes, is up to 200 m deep, consists of metapelites and metabasites with frequent intrusions of Early Miocene granodiorites and granites forming cone sheets and dikes. Metamorphic rocks and granitoid intrusions are characterized by very heterogeneous RQD values ranging from 0 to 60% in the first 150–180 m, then at deeper levels the RQD values are generally and homogeneously higher than 50%. The most superficial and fractured horizon of the metamorphic basement constitutes the aquifer formation intercepted by the wells for a saturated thickness of 50–60 m. From the reconstructions of the potentiometric surface, even in this case a general replica of the topography results, with a hydraulic gradient of 5–22%.
Water level monitoring data for tested wells are also available for the period of 2018–2020. Seasonal fluctuations in the water level between 1.7 and 3.0 m have been recorded for the six tested wells, with an average variation value of 2.4 m.
Based on the meteorological data, the average annual precipitation (724 mm) and the average annual actual evapotranspiration (549 mm) (using the Turc formula [26]) have been determined for the timelapse of 1991–2020. From the analysis of the average flow rate and the minimum flow rate measured in the gauging station of the Orhaneli Cayi River (1978–1985), the average annual runoff has been obtained (119 mm), considering the basin area. An estimate of the average, annual recharge of the aquifer of 56 mm has therefore been derived from the difference between precipitation, actual evapotranspiration and runoff.

3.2. Pumping Tests

Two pumping tests were carried out at the AND test site (W1 and W2) and four at the MET test site (W3–W6) (Figure 1).
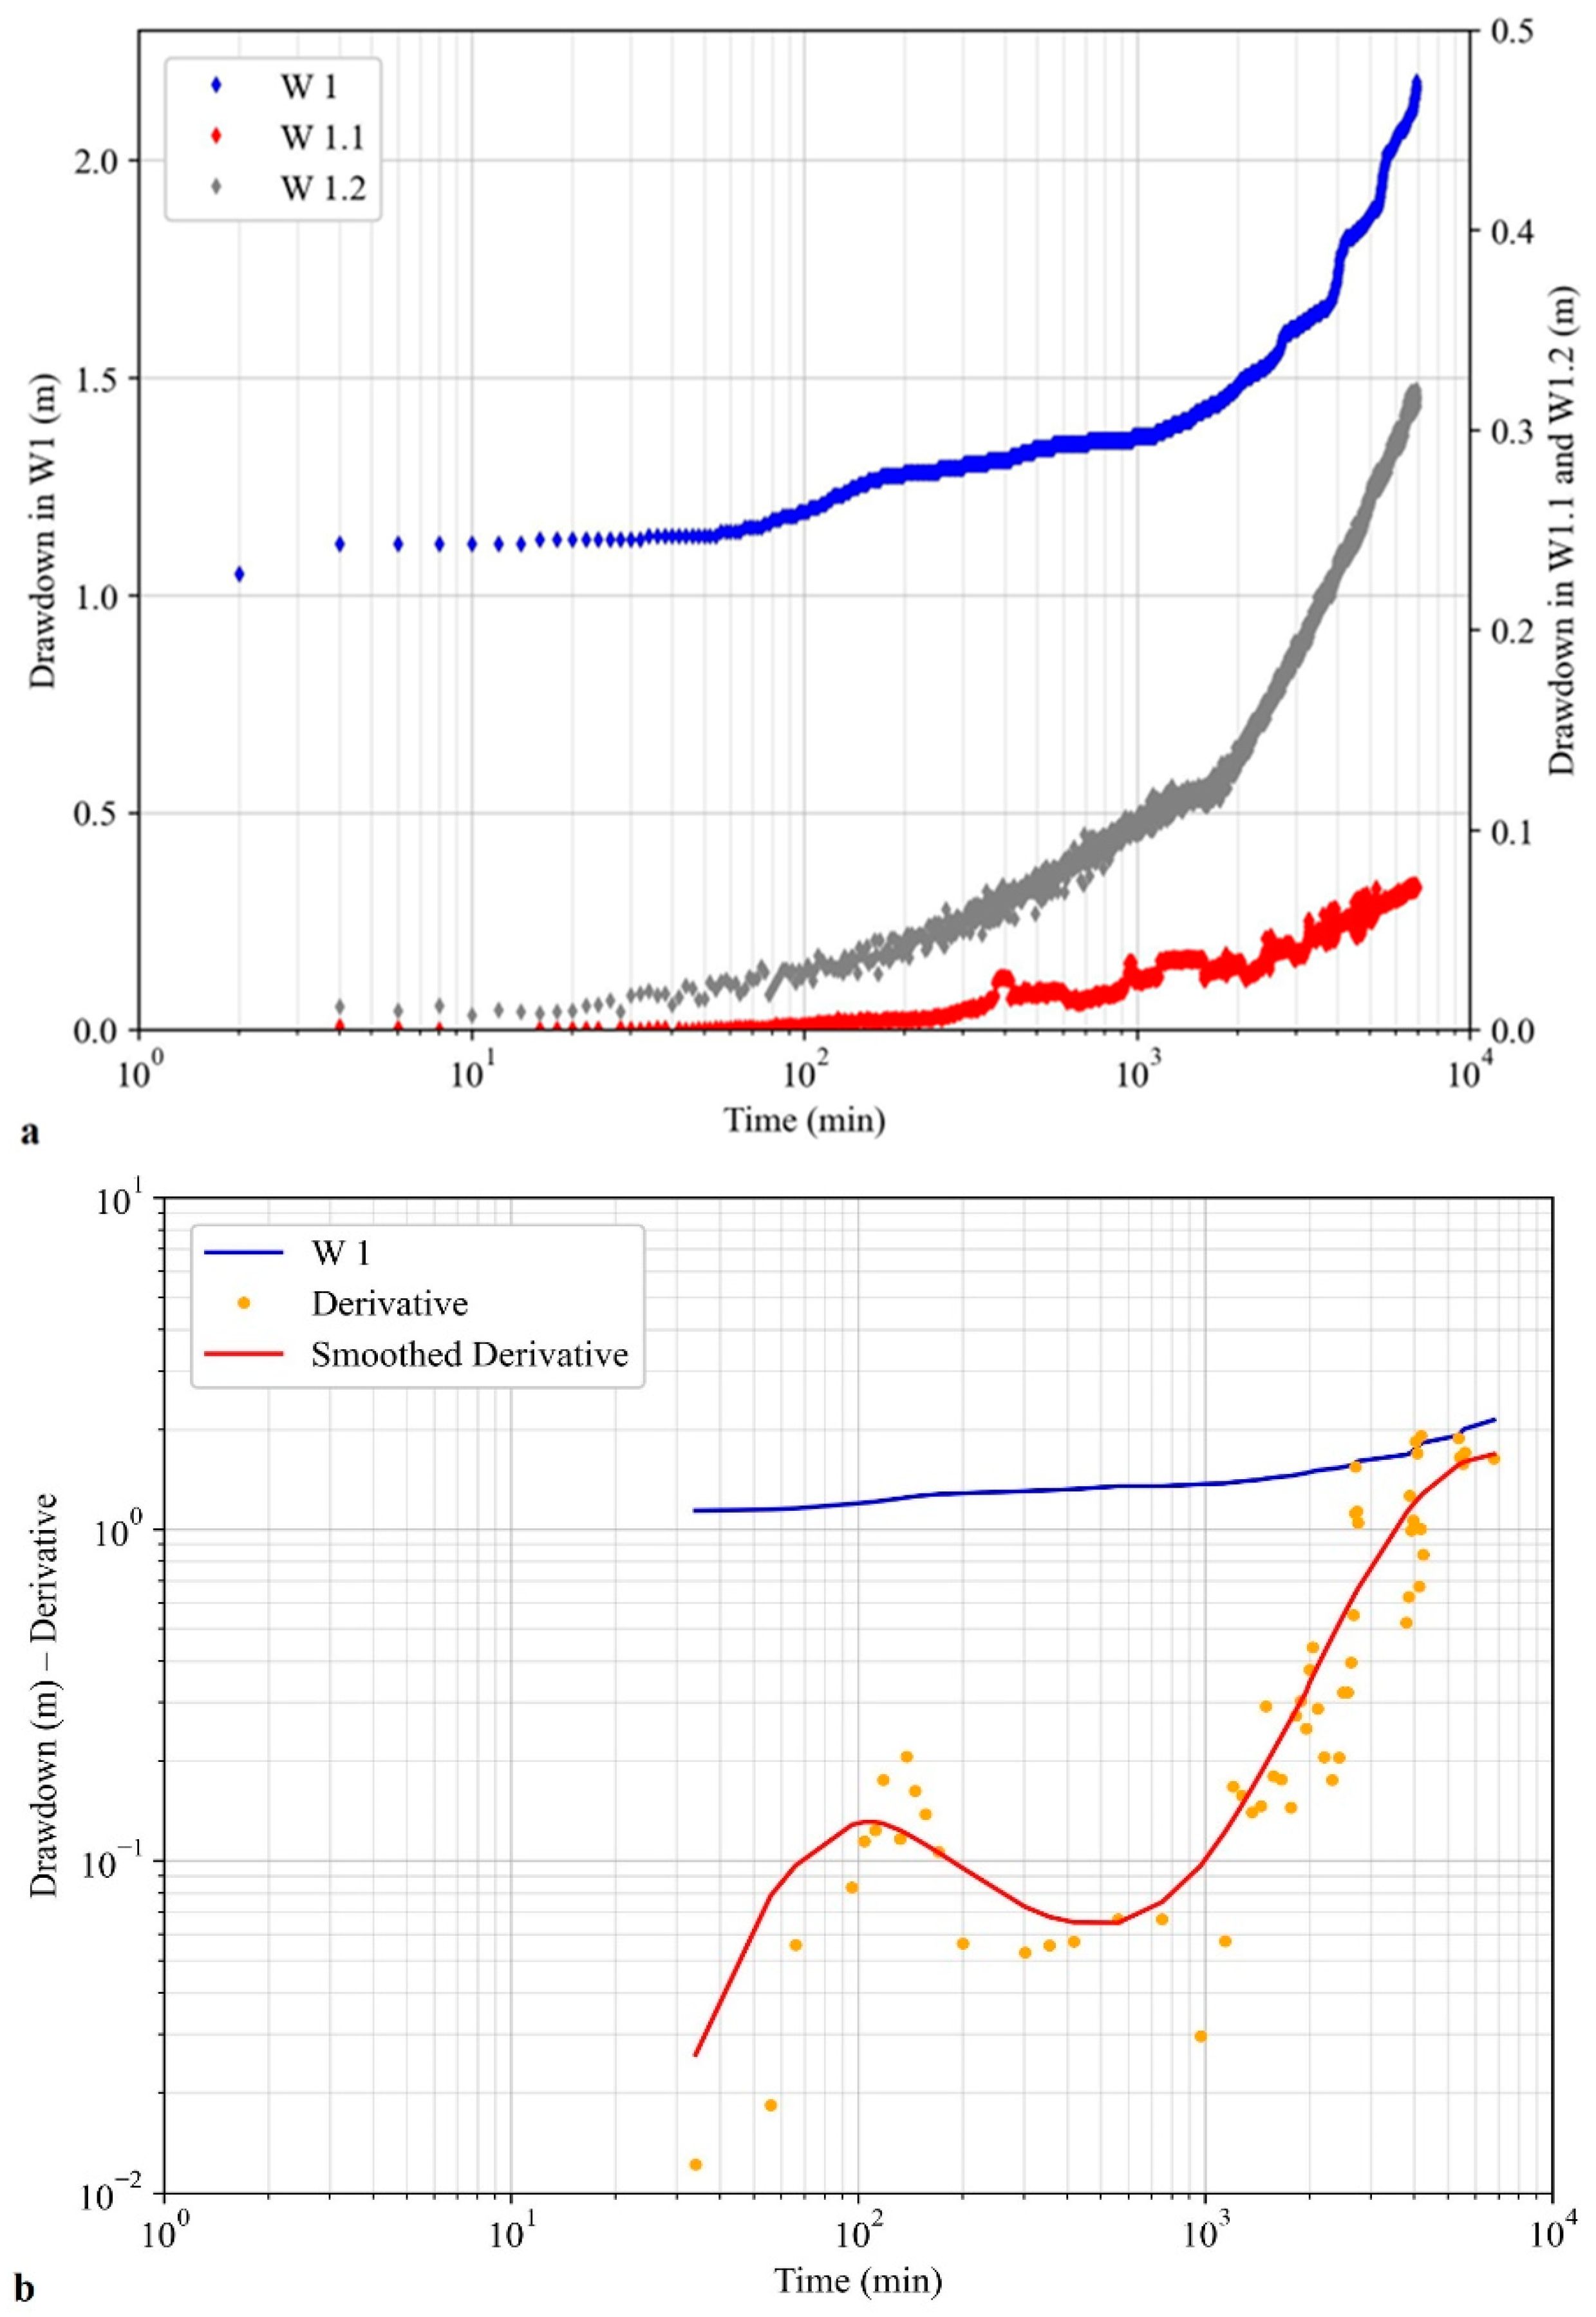
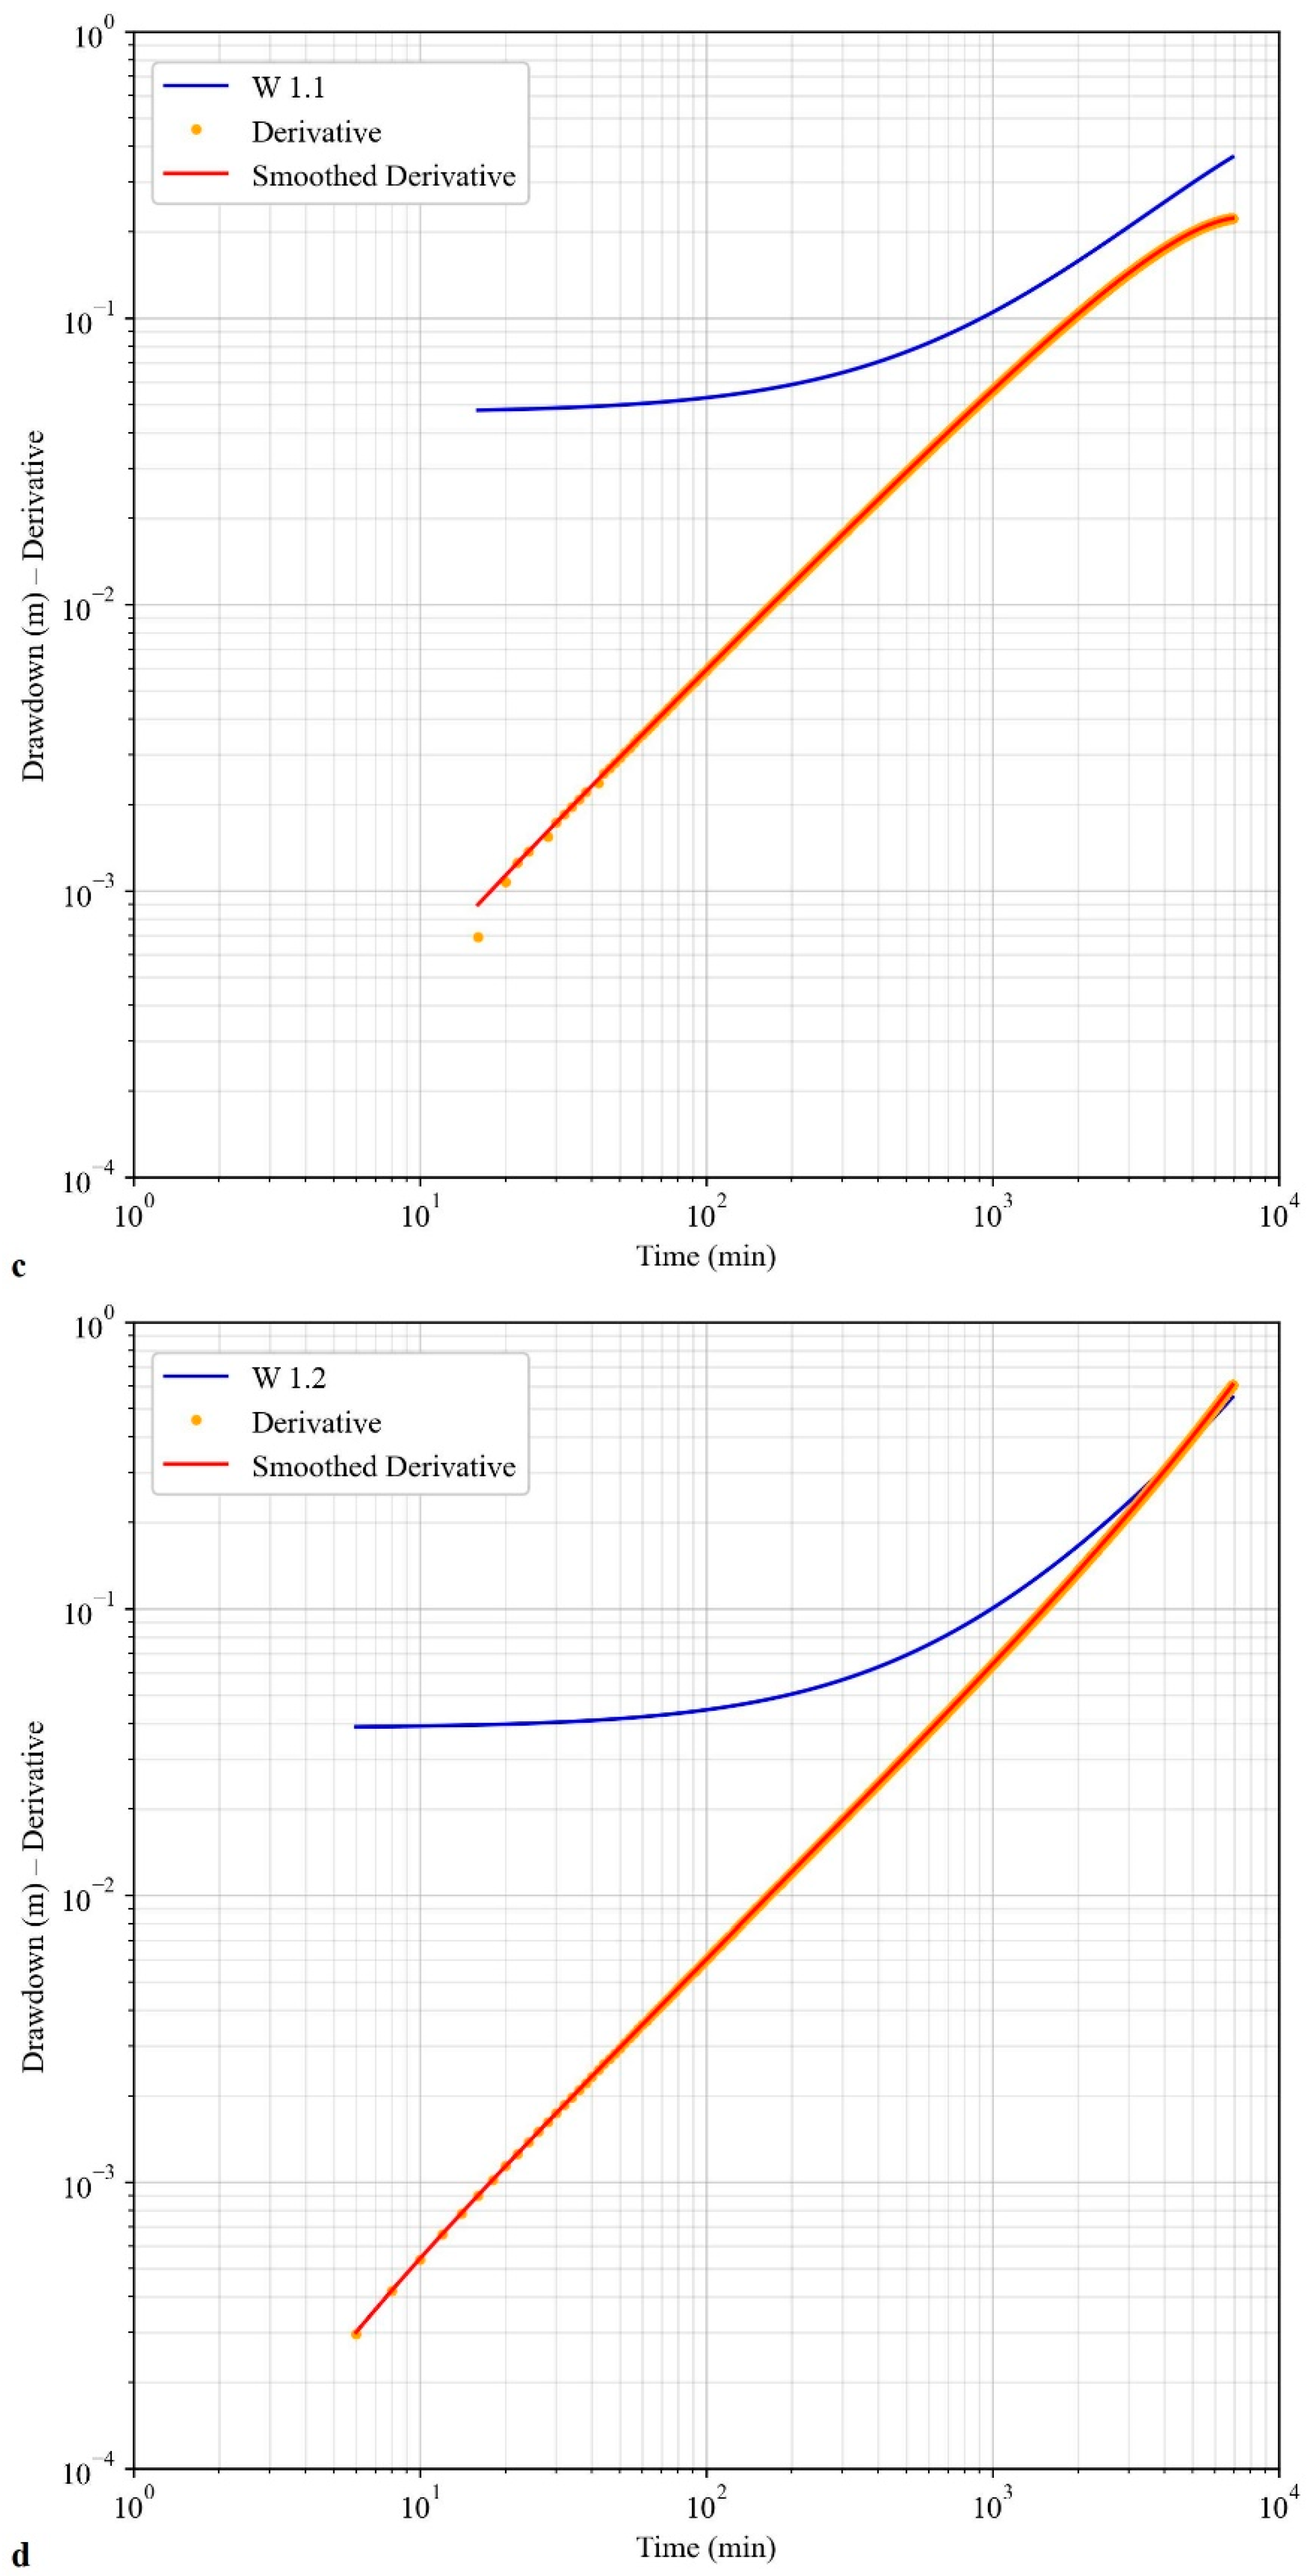
The W1 test (AND), conducted at a constant flow rate of 3.6 L/s for approximately 6900 min, included the observation of drawdown in the well itself and in two observation wells located at 107 m (W1.1) and 91 m (W1.2) (Figure 1a). The semi-log plot of drawdown–time shows a similar trend for the three observation points (Figure 2a). A significant change in the drawdown–time trend is noticed after about 1500 min, when an increase in the curve slope occurs. This late time drawdown trend shows a unit positive slope on the derivative-drawdown bi-log plot for the monitored points (Figure 2c,d), representative of a no-flow boundary. The derivative trend of the pumping well is more articulated and disturbed (Figure 2b), showing a sequential variation of flow dimensions from n < 2 in the early time, due to the wellbore storage effect, to n = 2 in the intermediate time, due to the radial flow, and then to n < 2 in the late time.
Smoothing the drawdown–time trend in the range of 100–1500 min, transmissivity (T) and storativity (S) values were obtained by the Cooper–Jacob method [27] (Table 1), for which a general adaptation of the measured data is obtained.
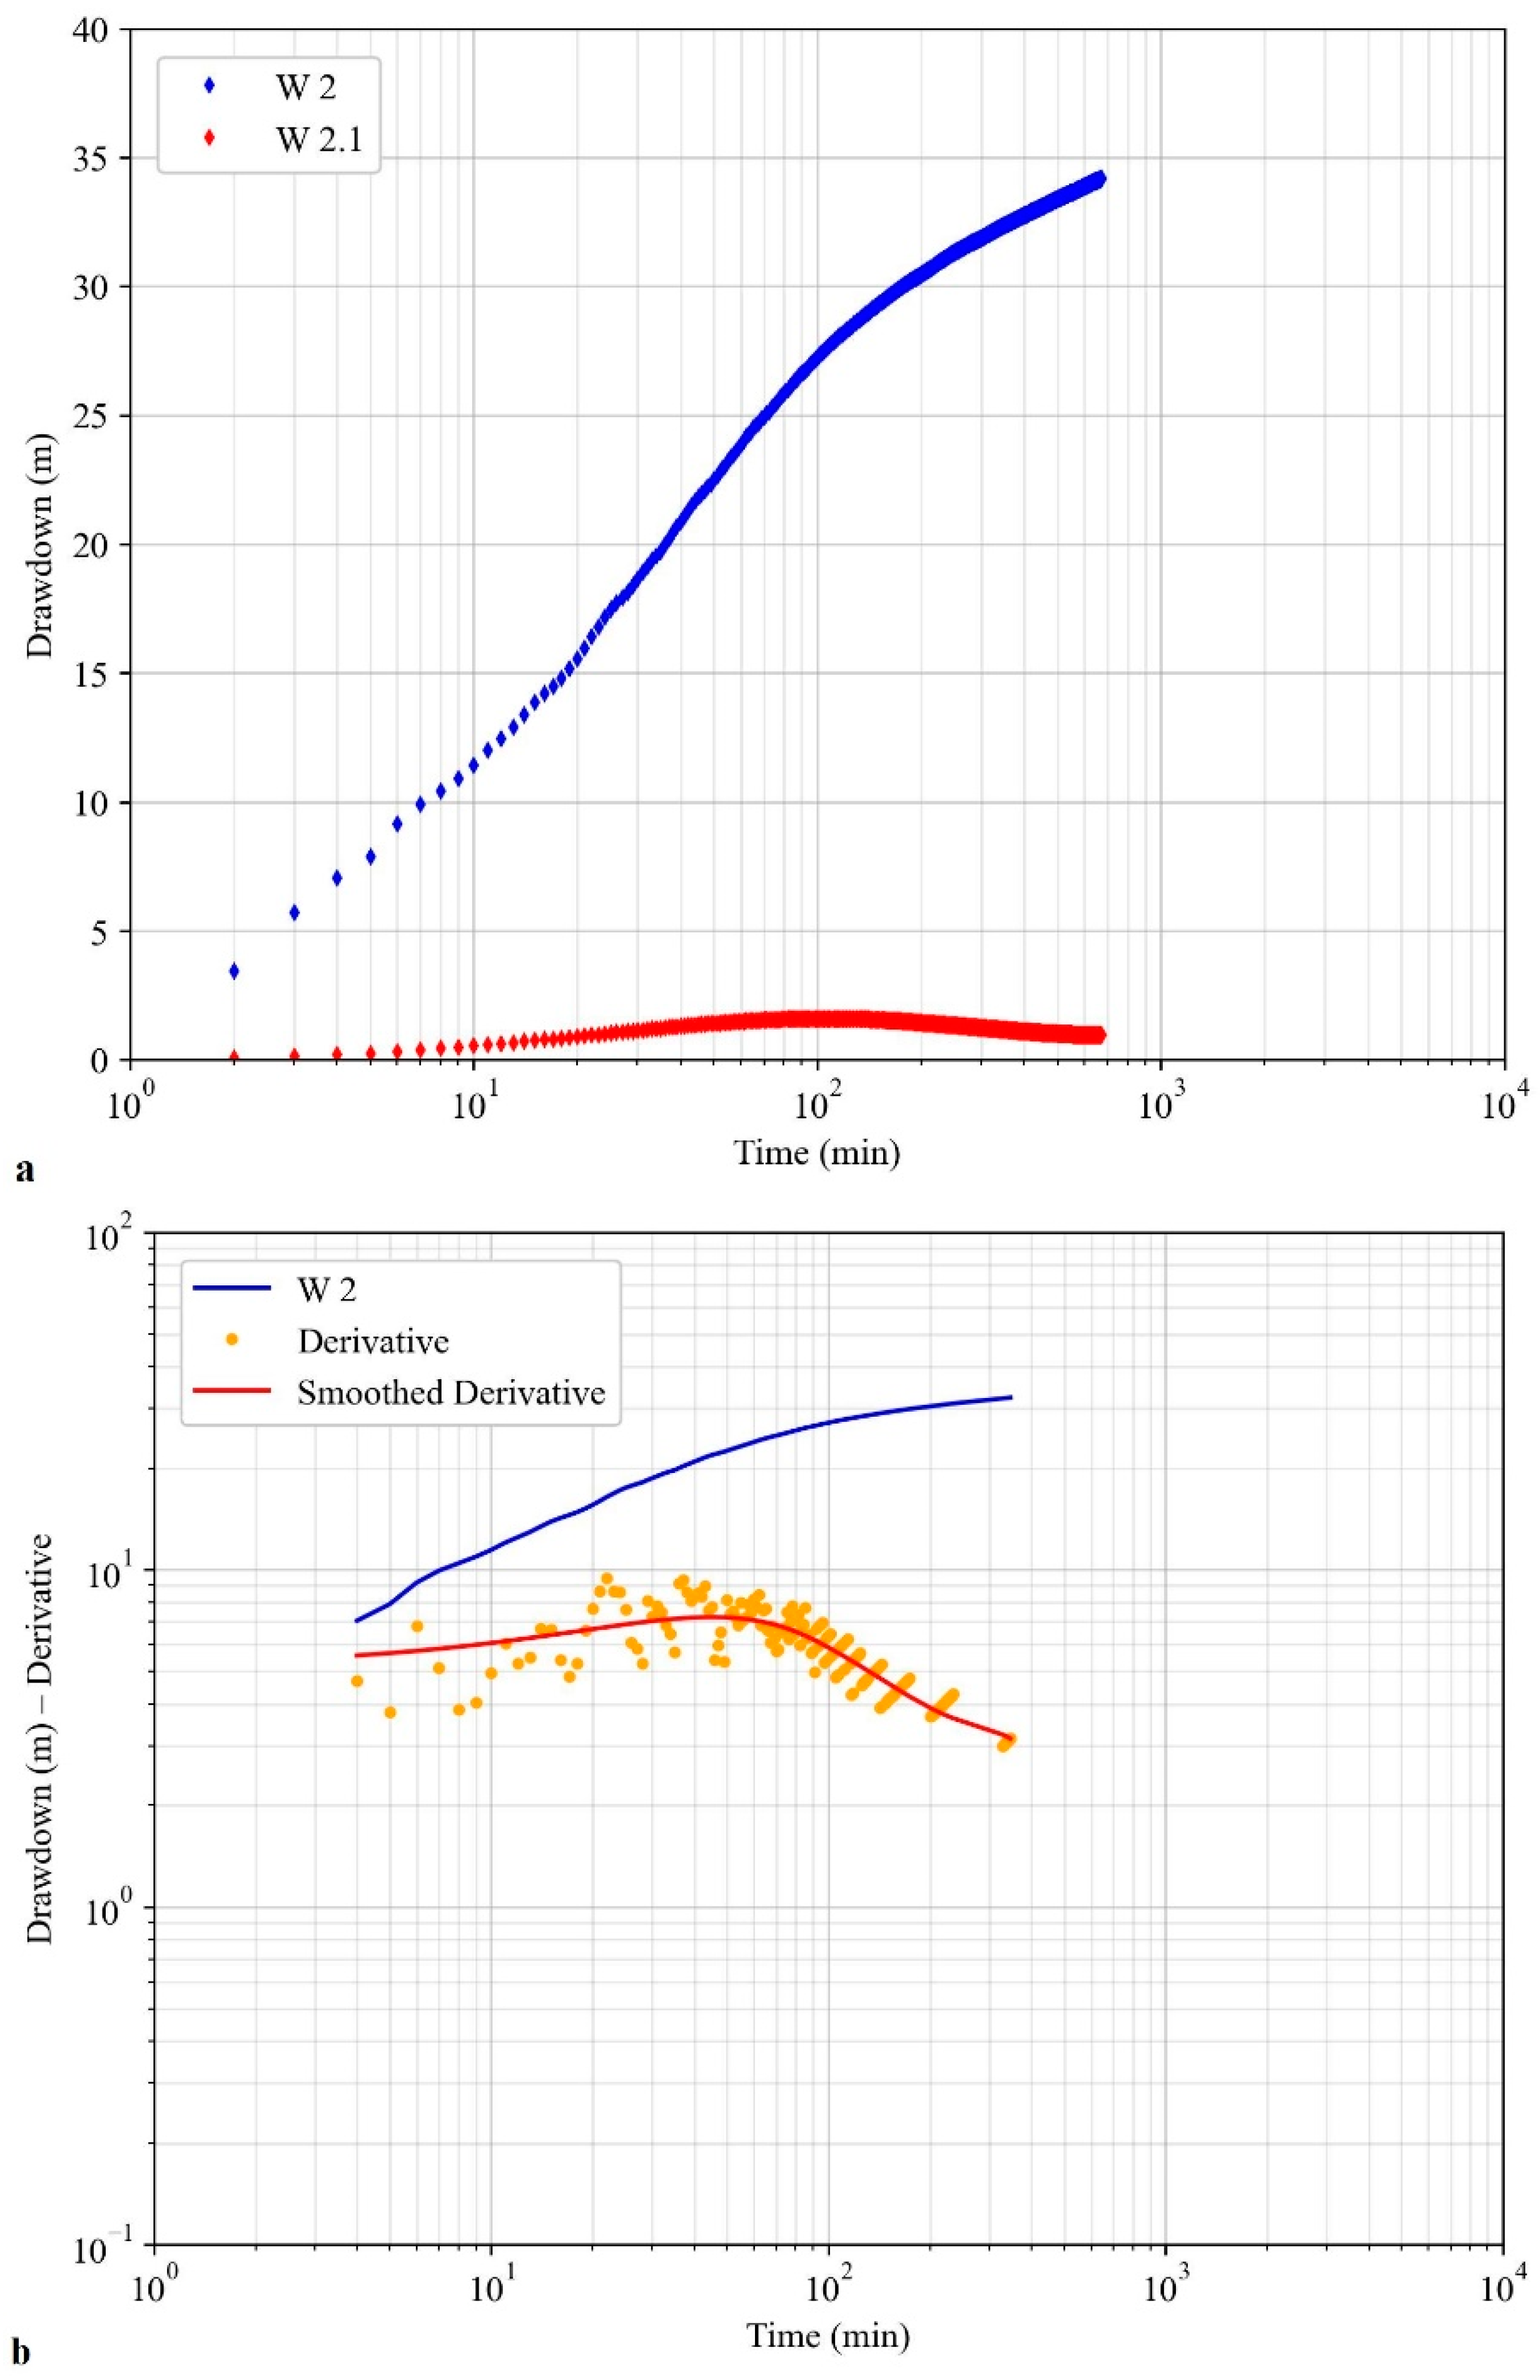
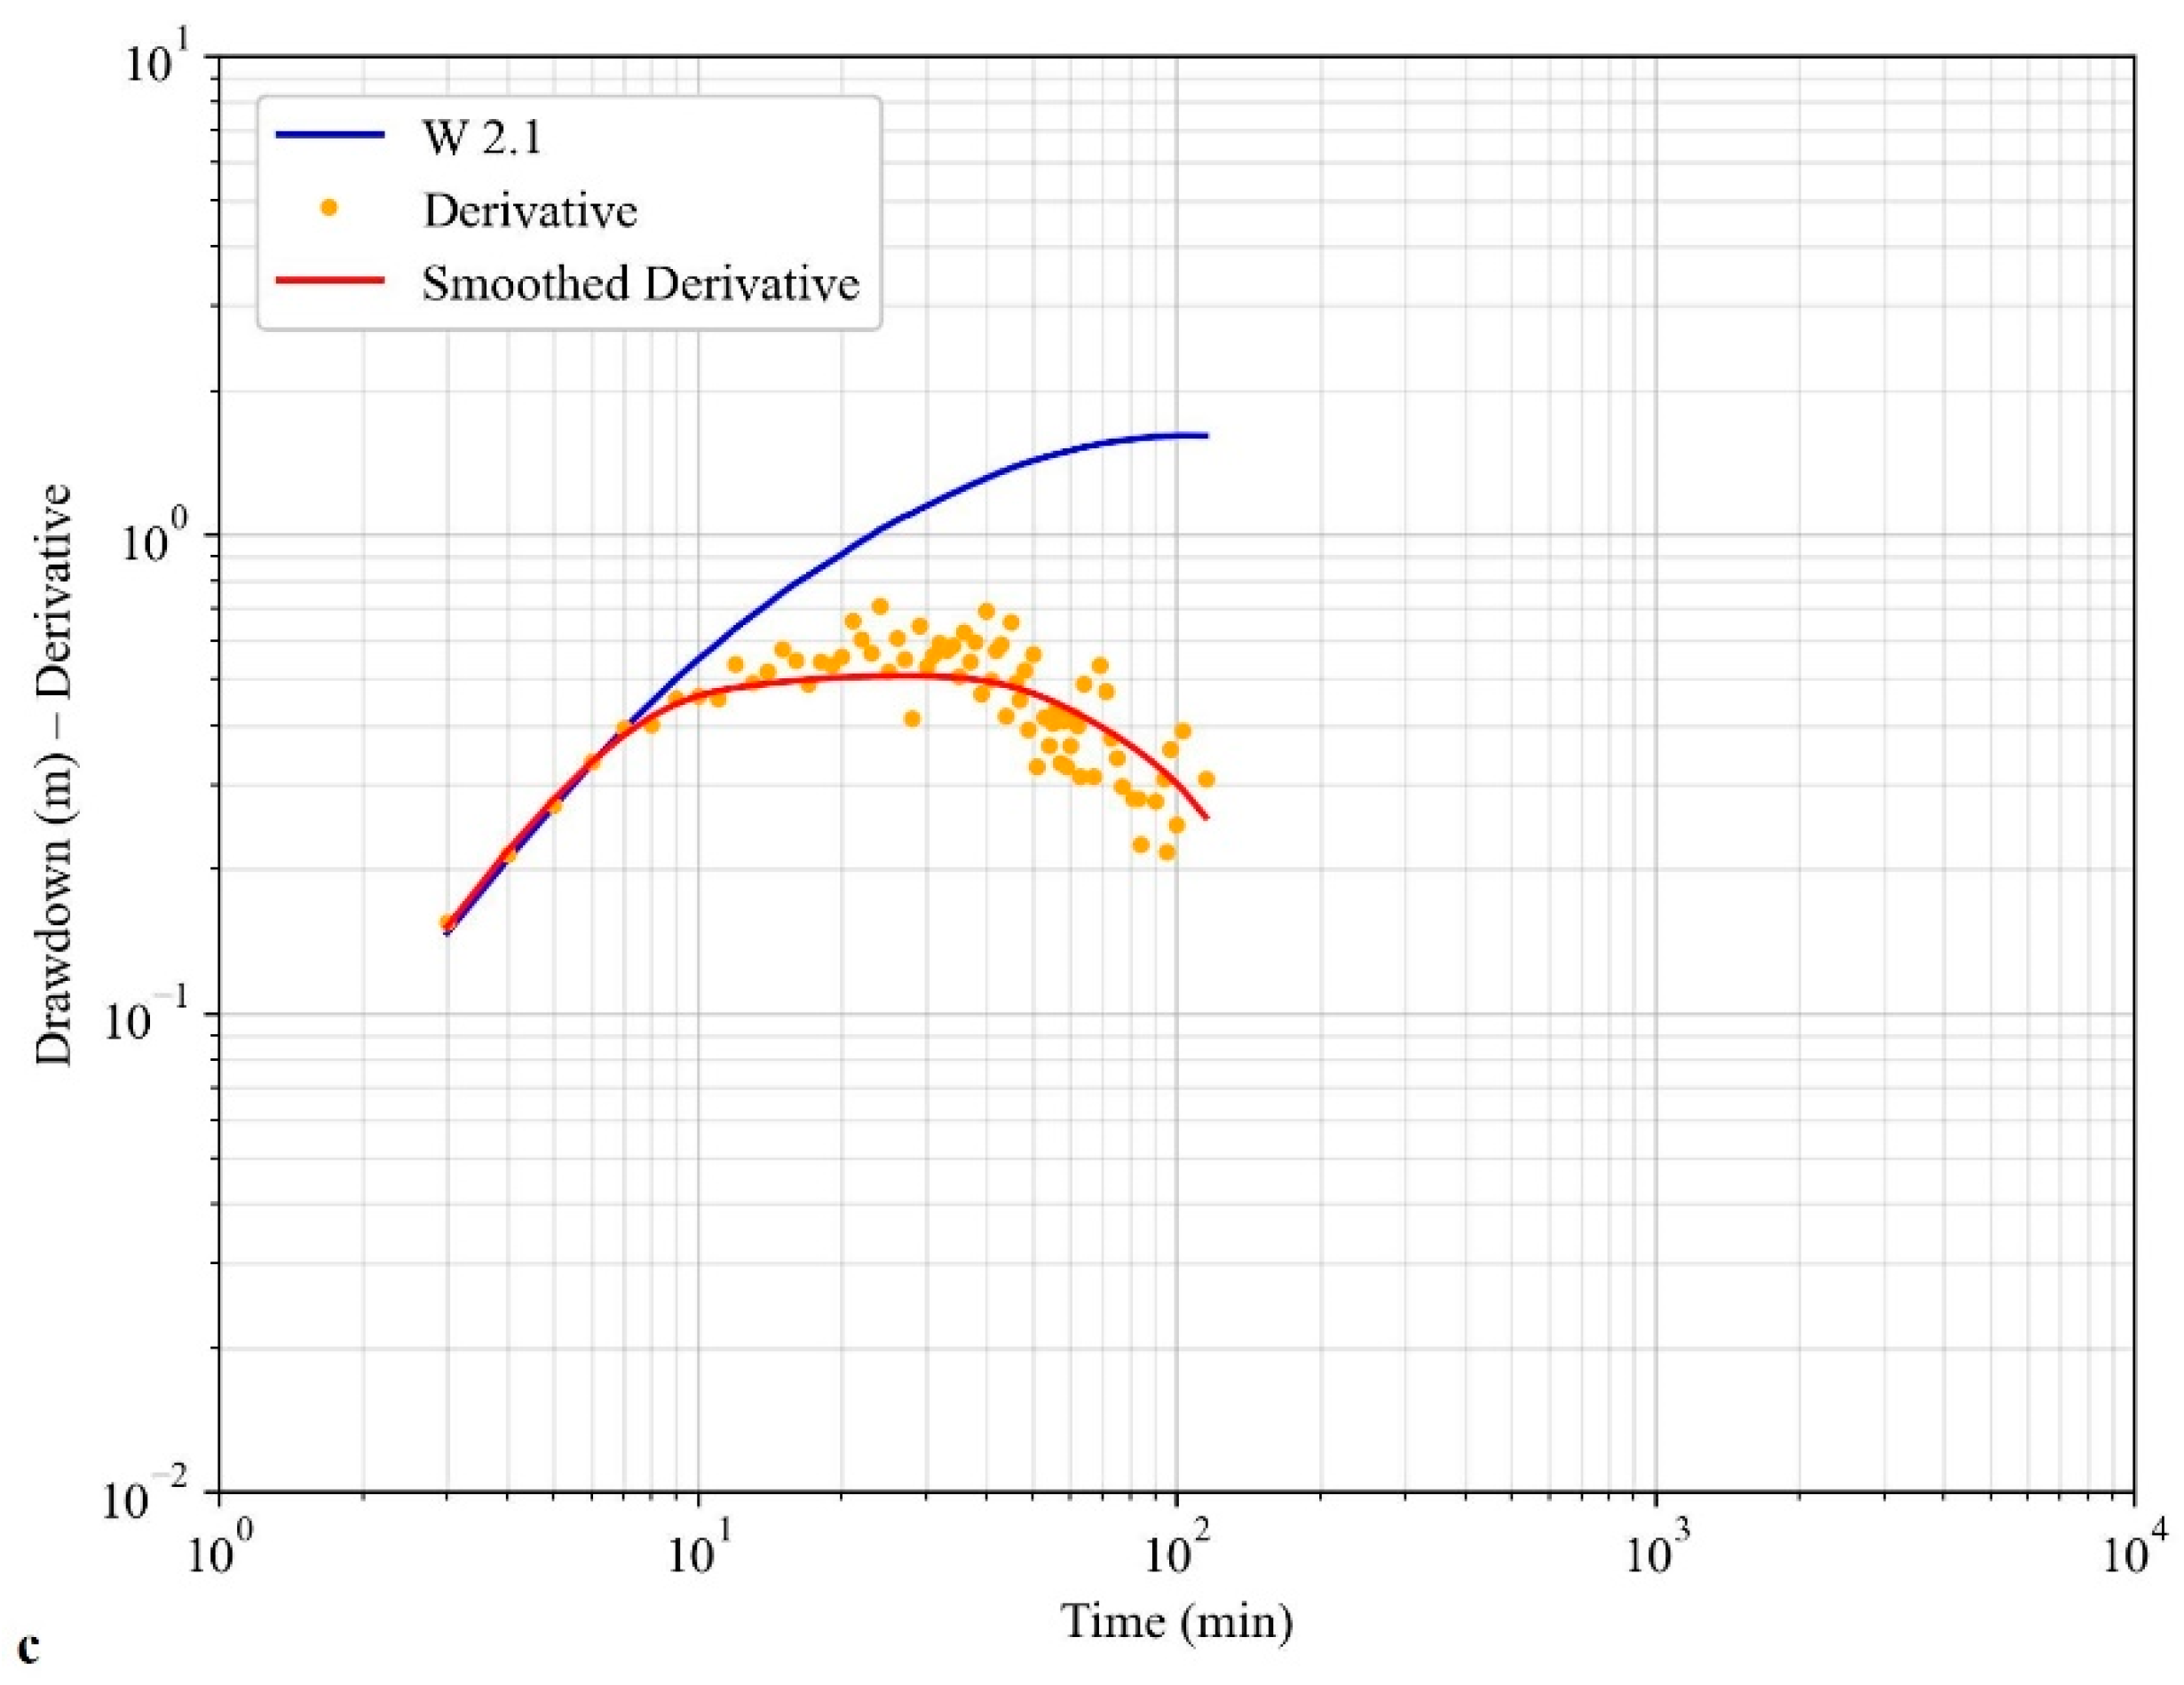
The W2 test (AND), conducted at a constant flow rate of 3.9 L/s for 670 min, included drawdown measurements in the pumping well (also during the recovery) and in an observation well located at 18 m (W2.1) (Figure 1a). The semi-log plot of drawdown–time for the pumping well shows a decrease in the curve slope in the late time with a significant drawdown at the end of the test (with an emptying of about 35% of the saturated aquifer intercepted by the well), while reduced drawdown has been recorded in the nearby observation well which shows a trend tending to the steady-state regime (Figure 3a). The derivativedrawdown plot of the pumping and observation wells is comparable with the leaky aquifer or constant head boundary models (sequence of flow dimension: n = 2—n > 2) (Figure 3b,c). From the comparison of the semi-log plot of the drawdown and the bi-log plot of the derivative a clear tendency to a steady-state regime is highlighted, differently from W1 test, although the two tests involve the same aquifer formations at 1 km-scale. The analysis of the residual drawdown measured in the pumping well during the recovery (96% in 496 min) shows a trend that deviates little from the Theis model [28].
The drawdown measured in the wells fits with good approximation with different interpretative models [27,28,29]. The values of T and S are very similar by applying the various methods (differing less than 15%); the average values of T and S reported in Table 1 are smaller by one order of magnitude than those of the W1 test.
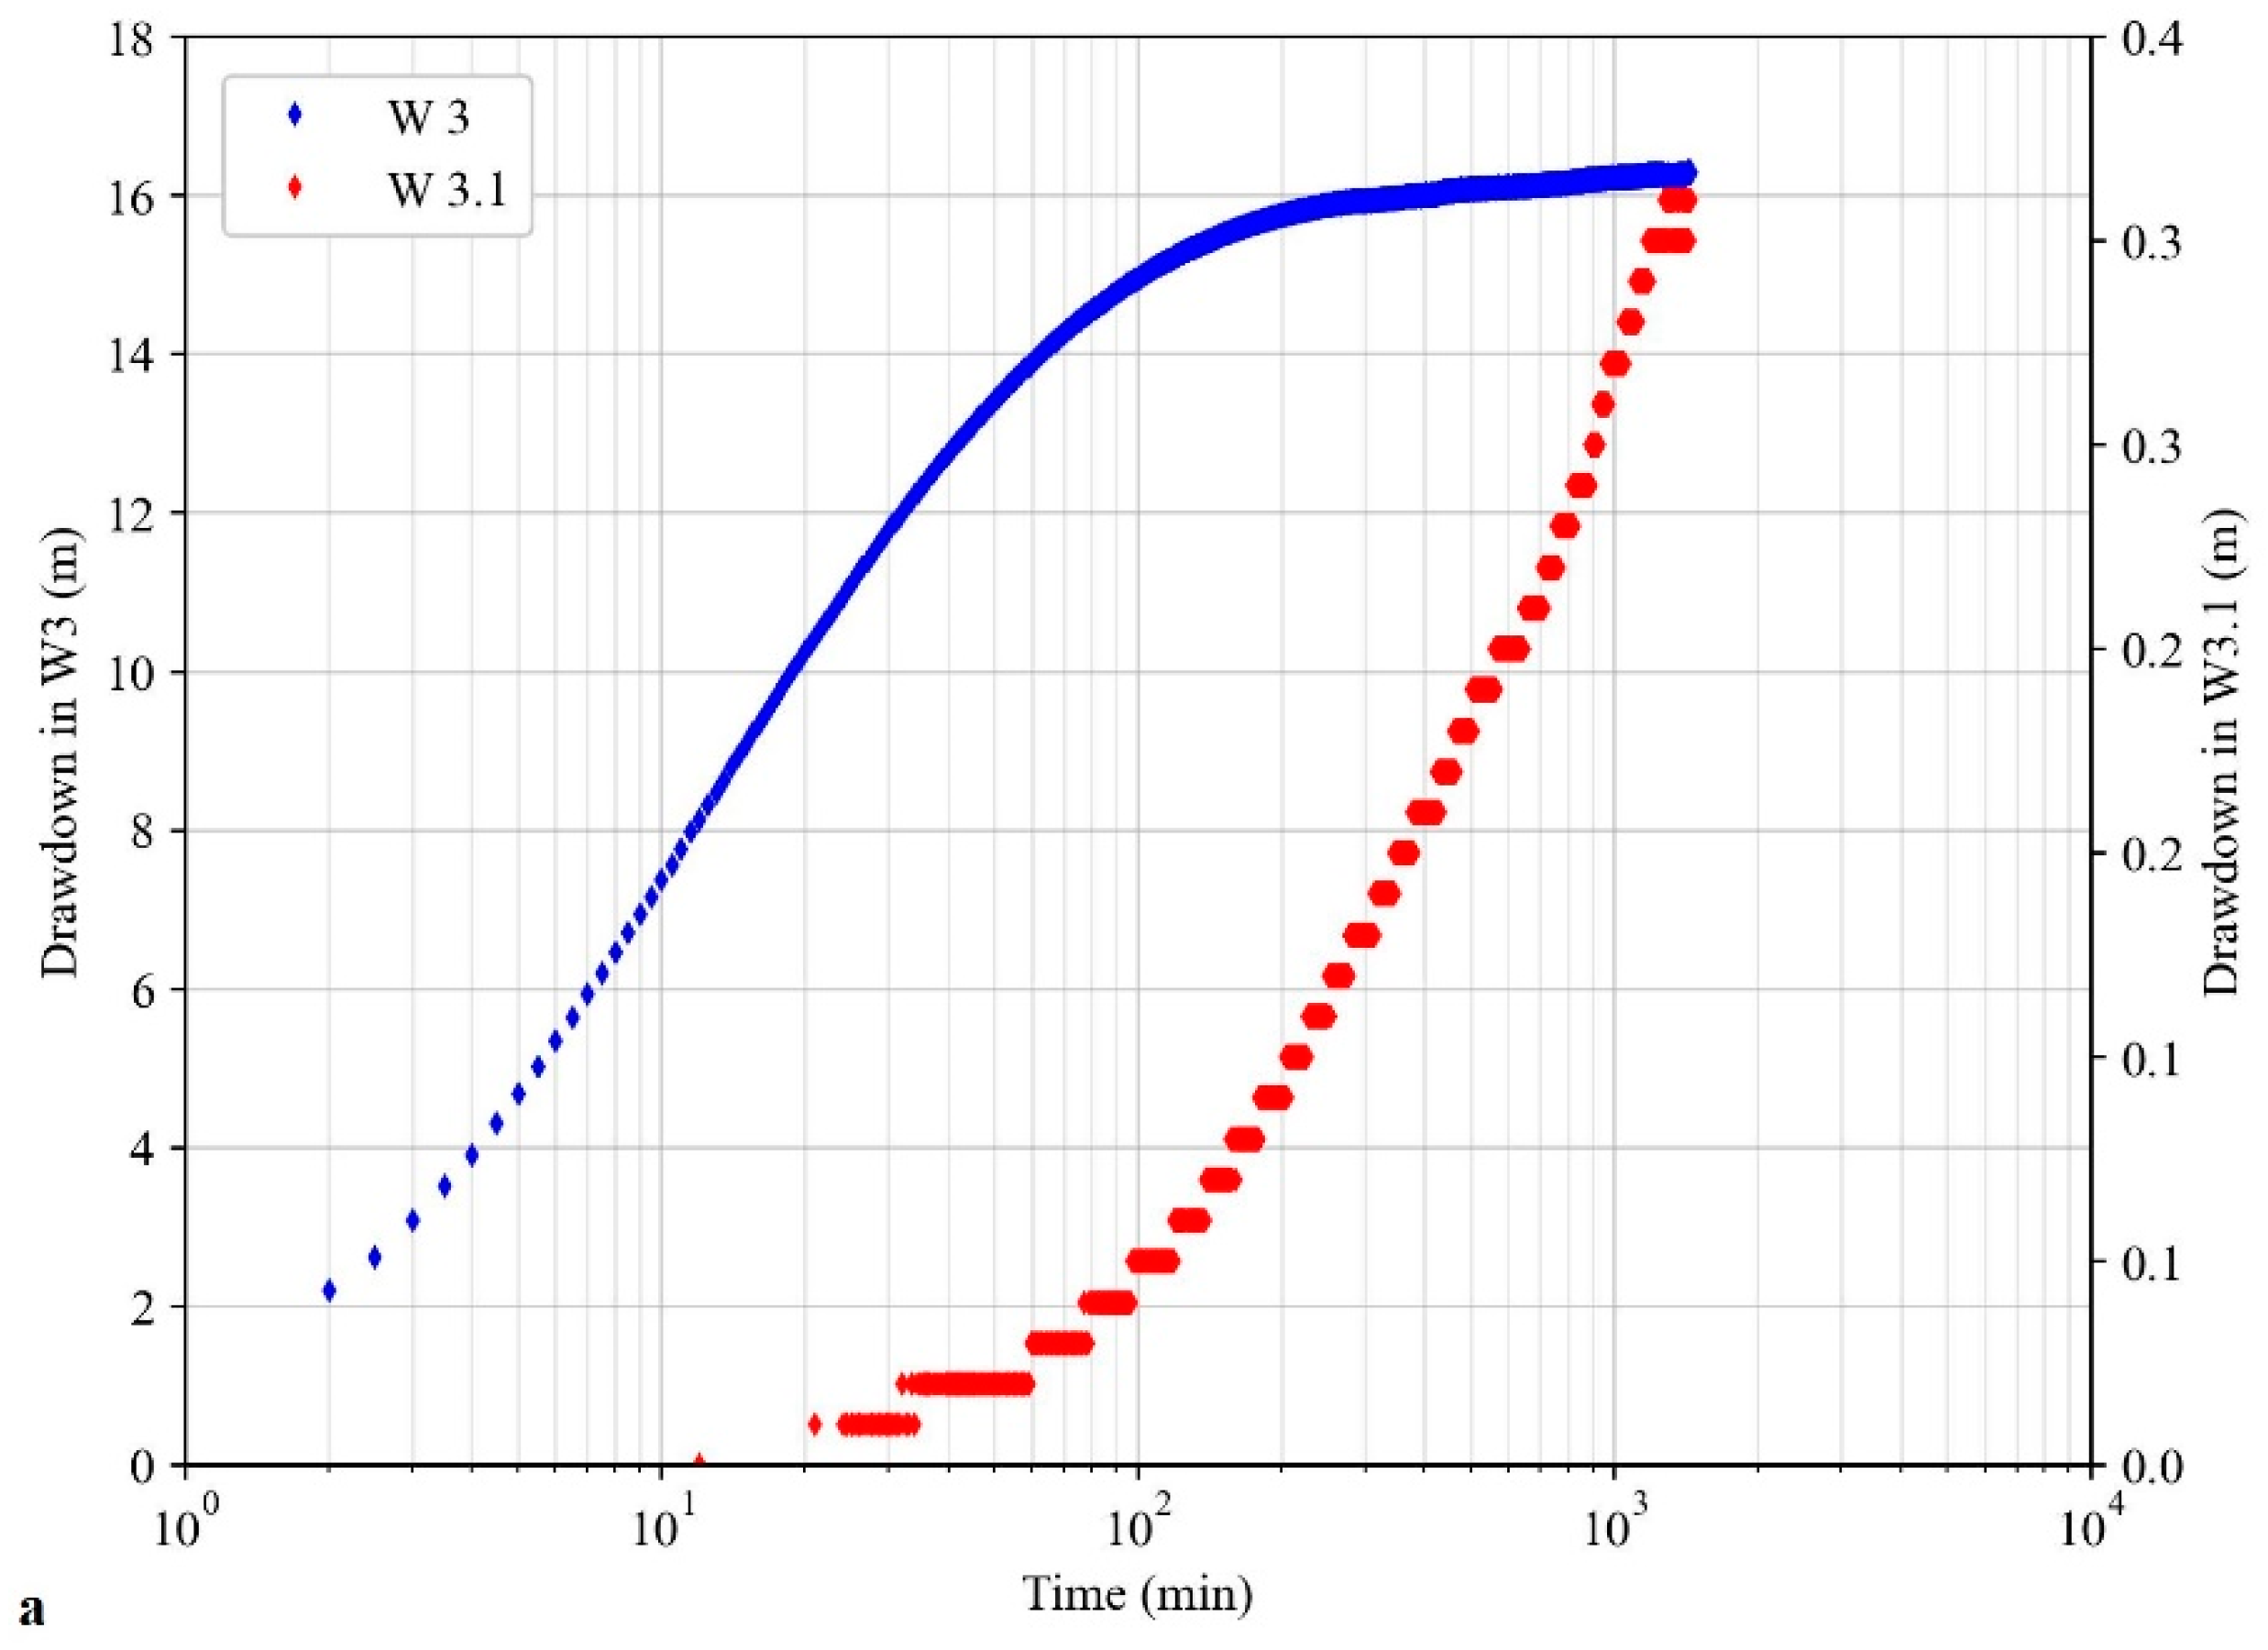
The W3 test (MET), conducted at a constant flow rate of 7.0 L/s for 1440 min, included drawdown measurements in the pumping well (also during the recovery, not shown in the graphs) and in an observation well located at 104 m (W3.1). Sporadic measurements were also carried out in another observation well (W4) 167 m away from the pumping well (not shown in Figure 4), along the same direction W3–W3.1 (Figure 1c).
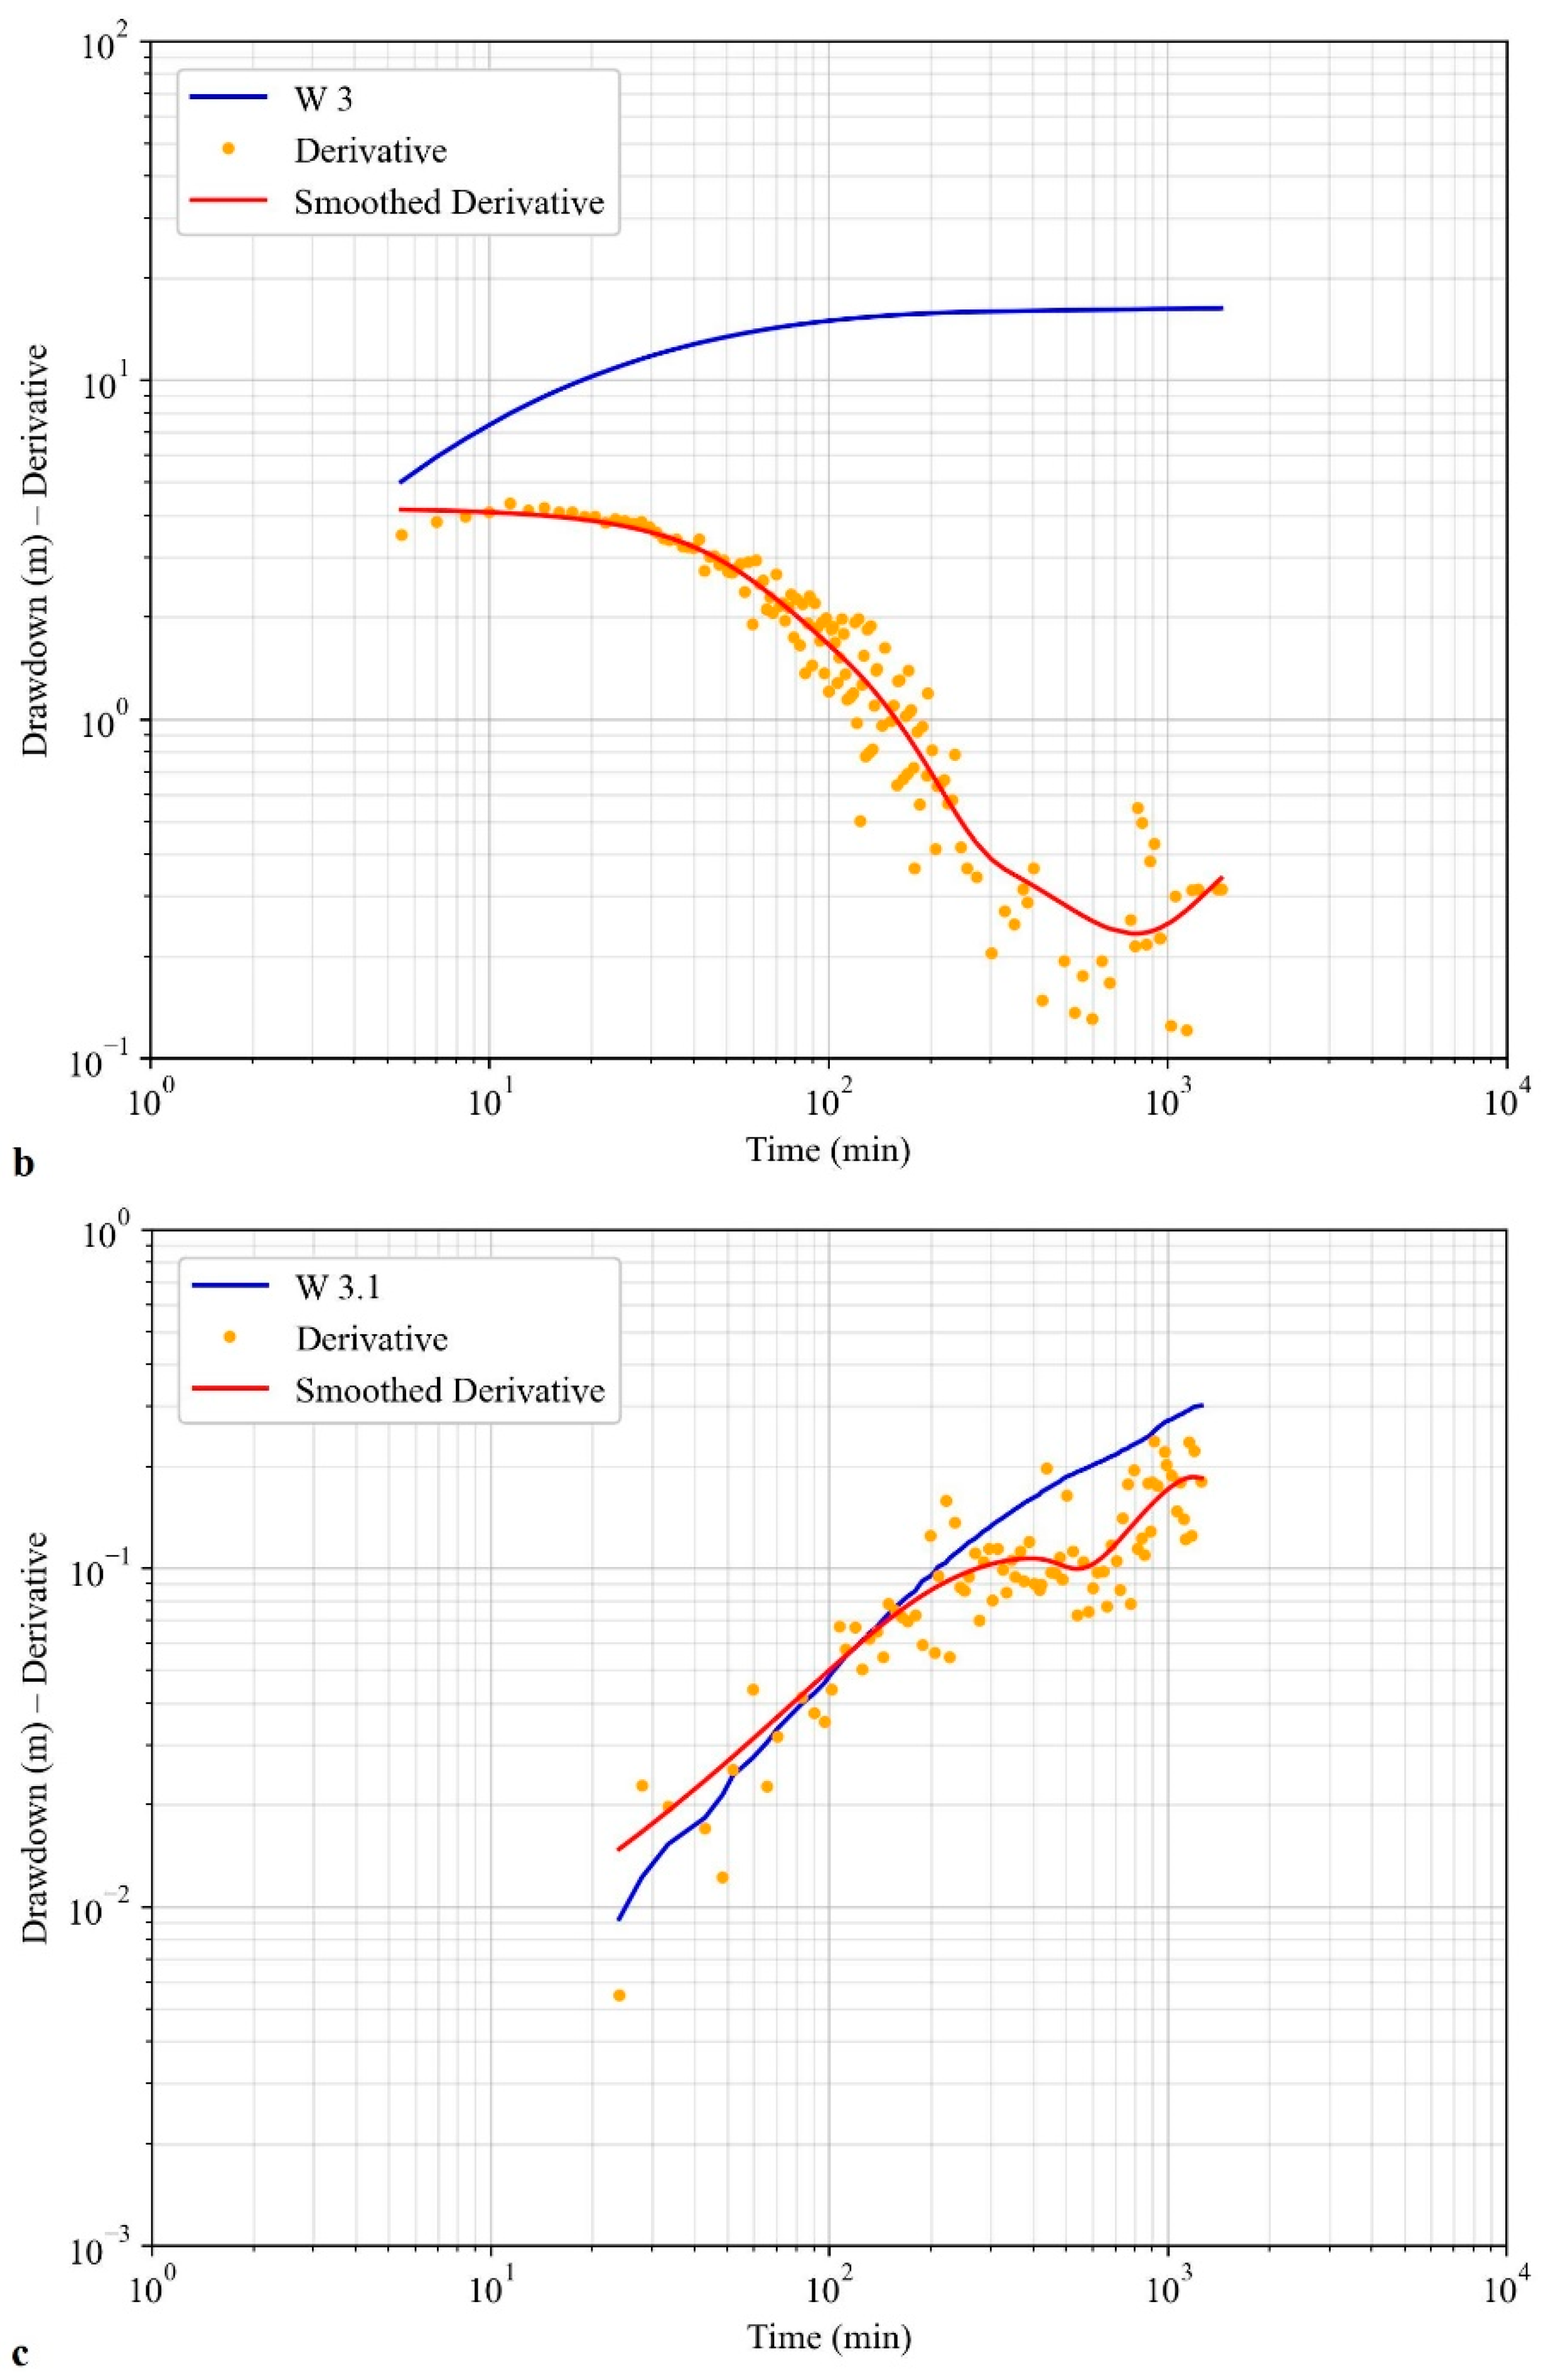
The semi-log plot of drawdown–time for the pumping well fits with the Hantush model [30] (Figure 4a) with a significant drawdown recorded at the end of the test (with an emptying of about 33% of the saturated aquifer intercepted by the well). The derivative plot of the pumping well is very clear with a flow dimension sequence n = 2 and n > 2 attributable to a constant head boundary (Figure 4b); the recovery (98% of residual drawdown in 170 min) is consistent with this model. Applying the Hantush model to drawdown and residual drawdown, results in comparable values of T (Table 1).
The drawdown and the derivative in W3.1 show a different trend compared to the pumping well (Figure 4a–c). Excluding the first 200 min, when the low measured drawdown is influenced by the distance observation-pumping well and wellbore storage effects (n = 0), the subsequent trend seems to follow a sequence n = 2 and then n = 0, attributable to a no-flow boundary in the late time. It is worth highlighting the wide propagation of the cone of depression as supported by the drawdown of 0.14 m, measured at the end of the test in W4 located 164 m from the pumping well. As in other cases, the T value obtained by the analysis of the observation well drawdown data is an order of magnitude higher than the one obtained by using the pumping well data (Table 1). Values of T and S calculated by analyzing W3.1 drawdown data (Table 1) are consistent with that obtained by applying the distance-drawdown method (T = 1.9 × 10⁻³ m2/s and S = 3.6 × 10⁻³) using the data measured in the two observation wells W3.1 and W4 at 600 min (i.e., the time at which the flow regime is still radial).
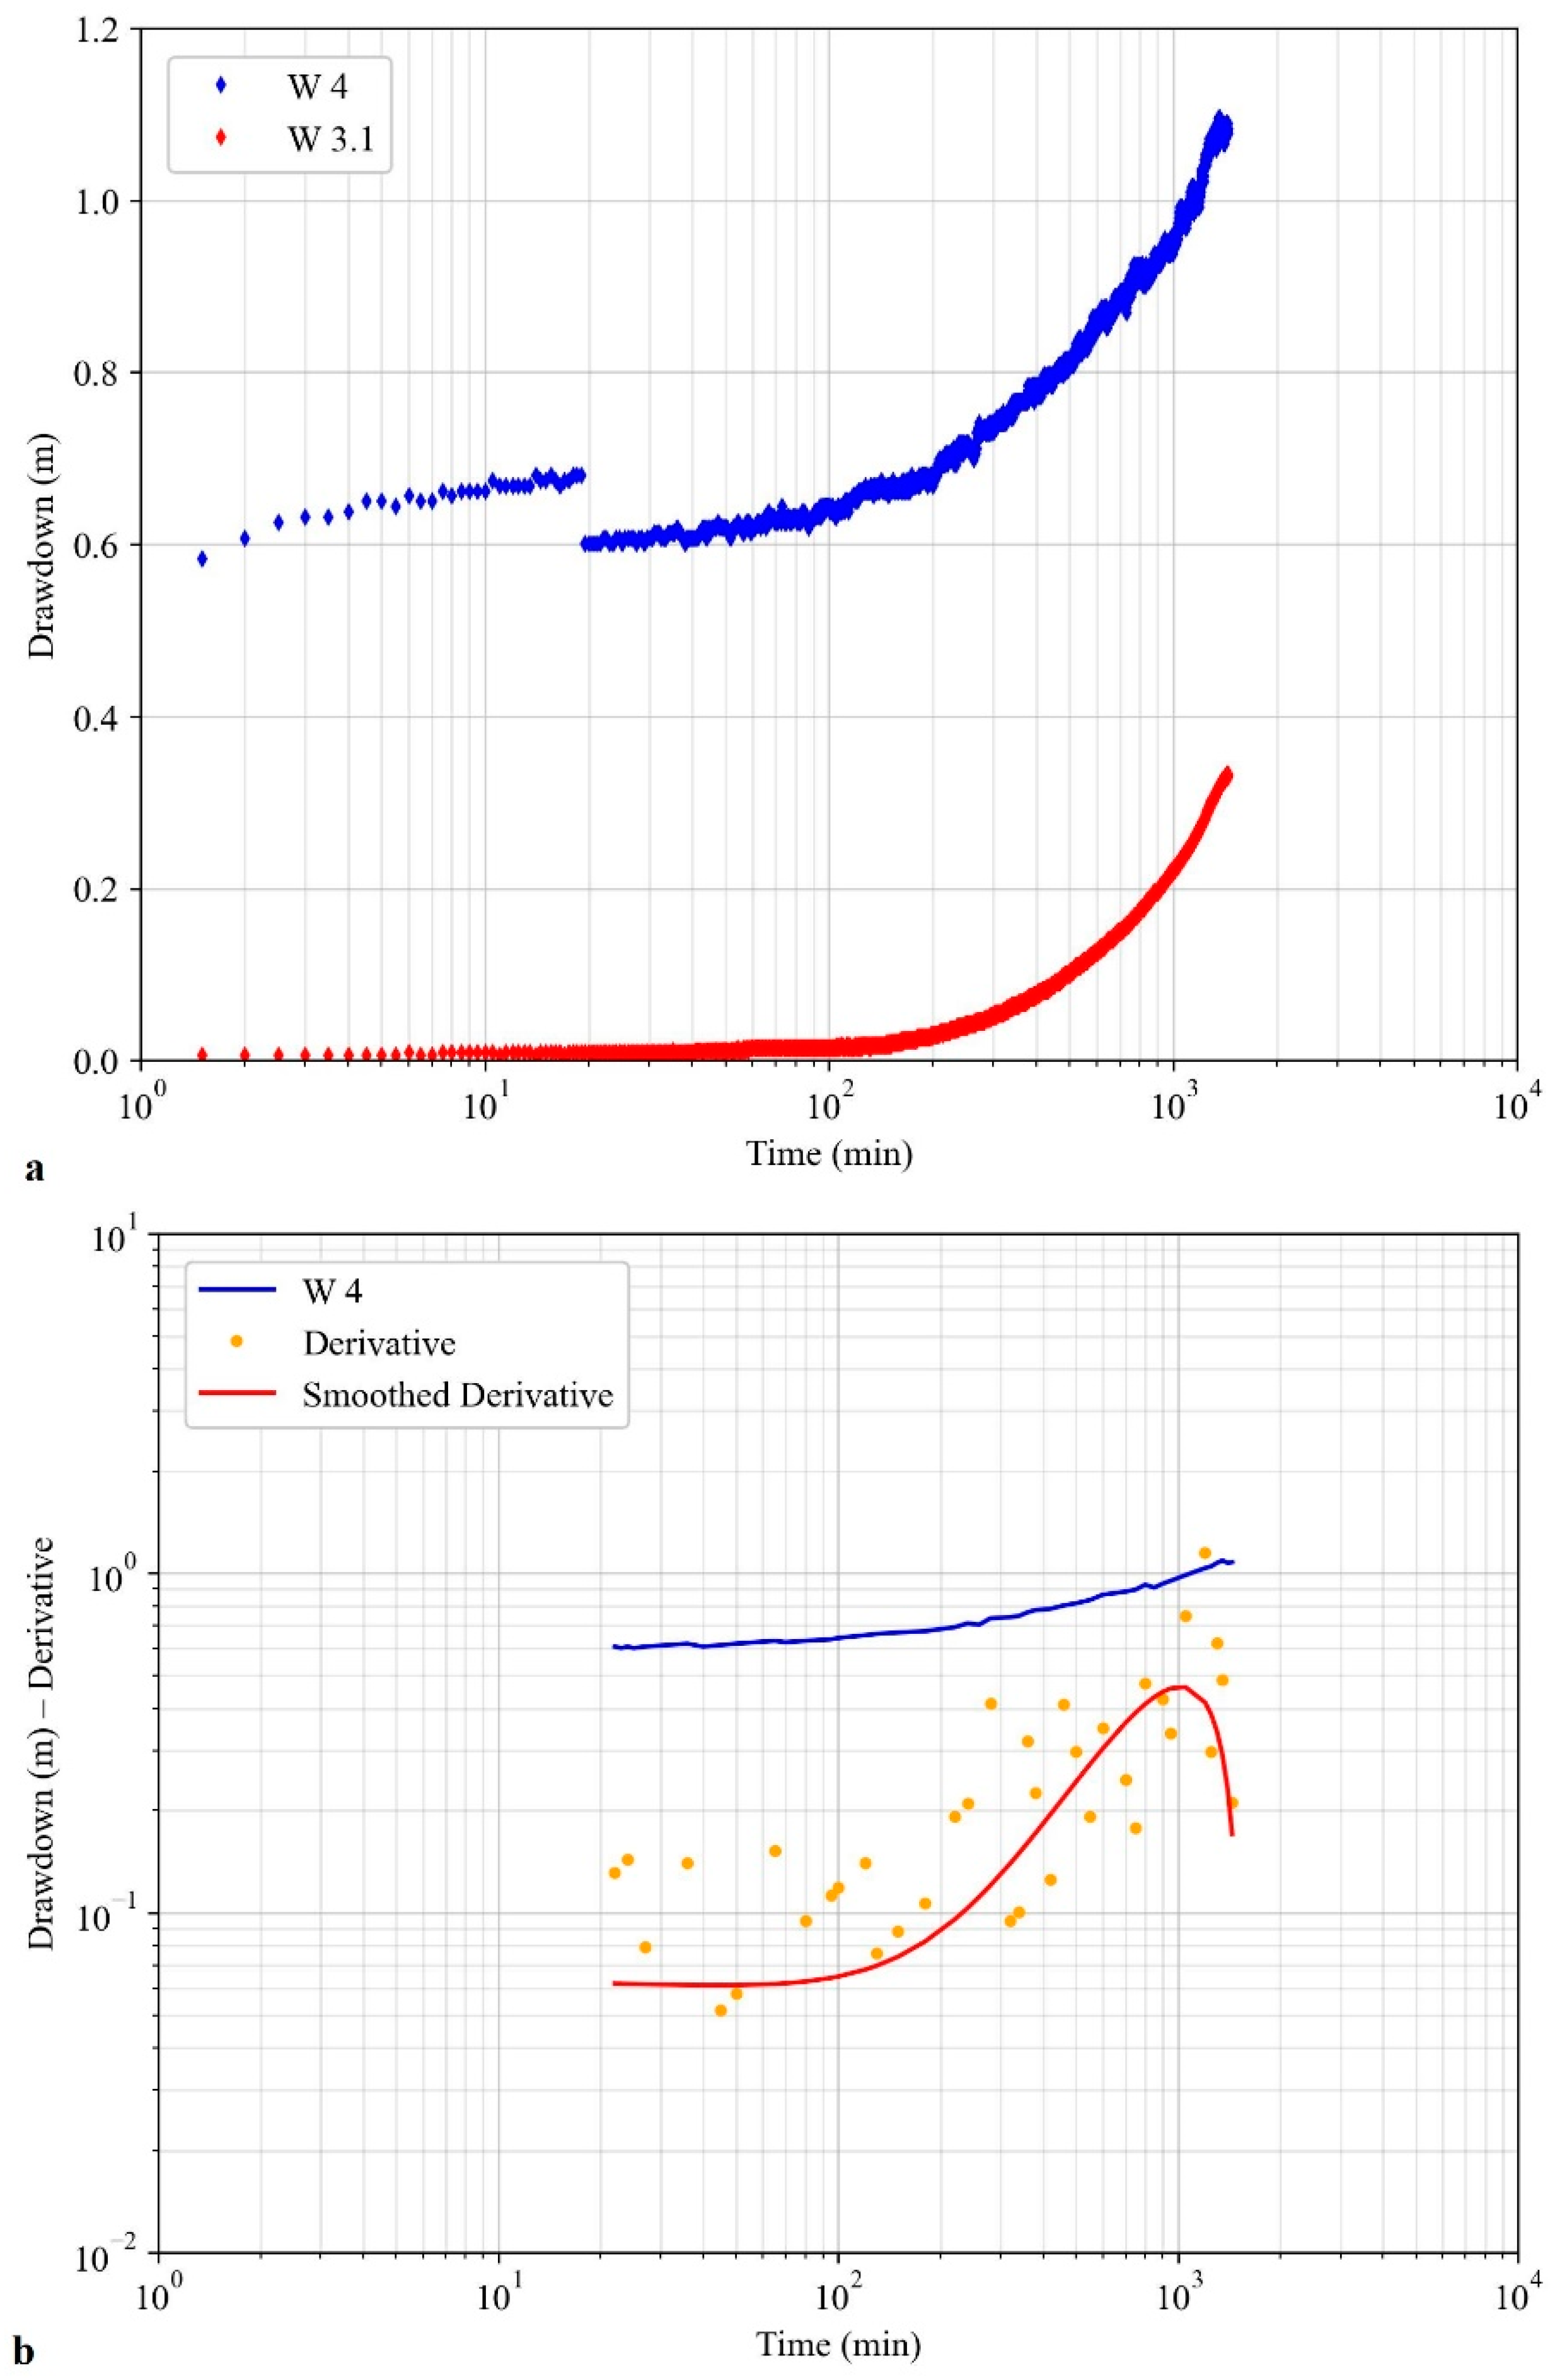
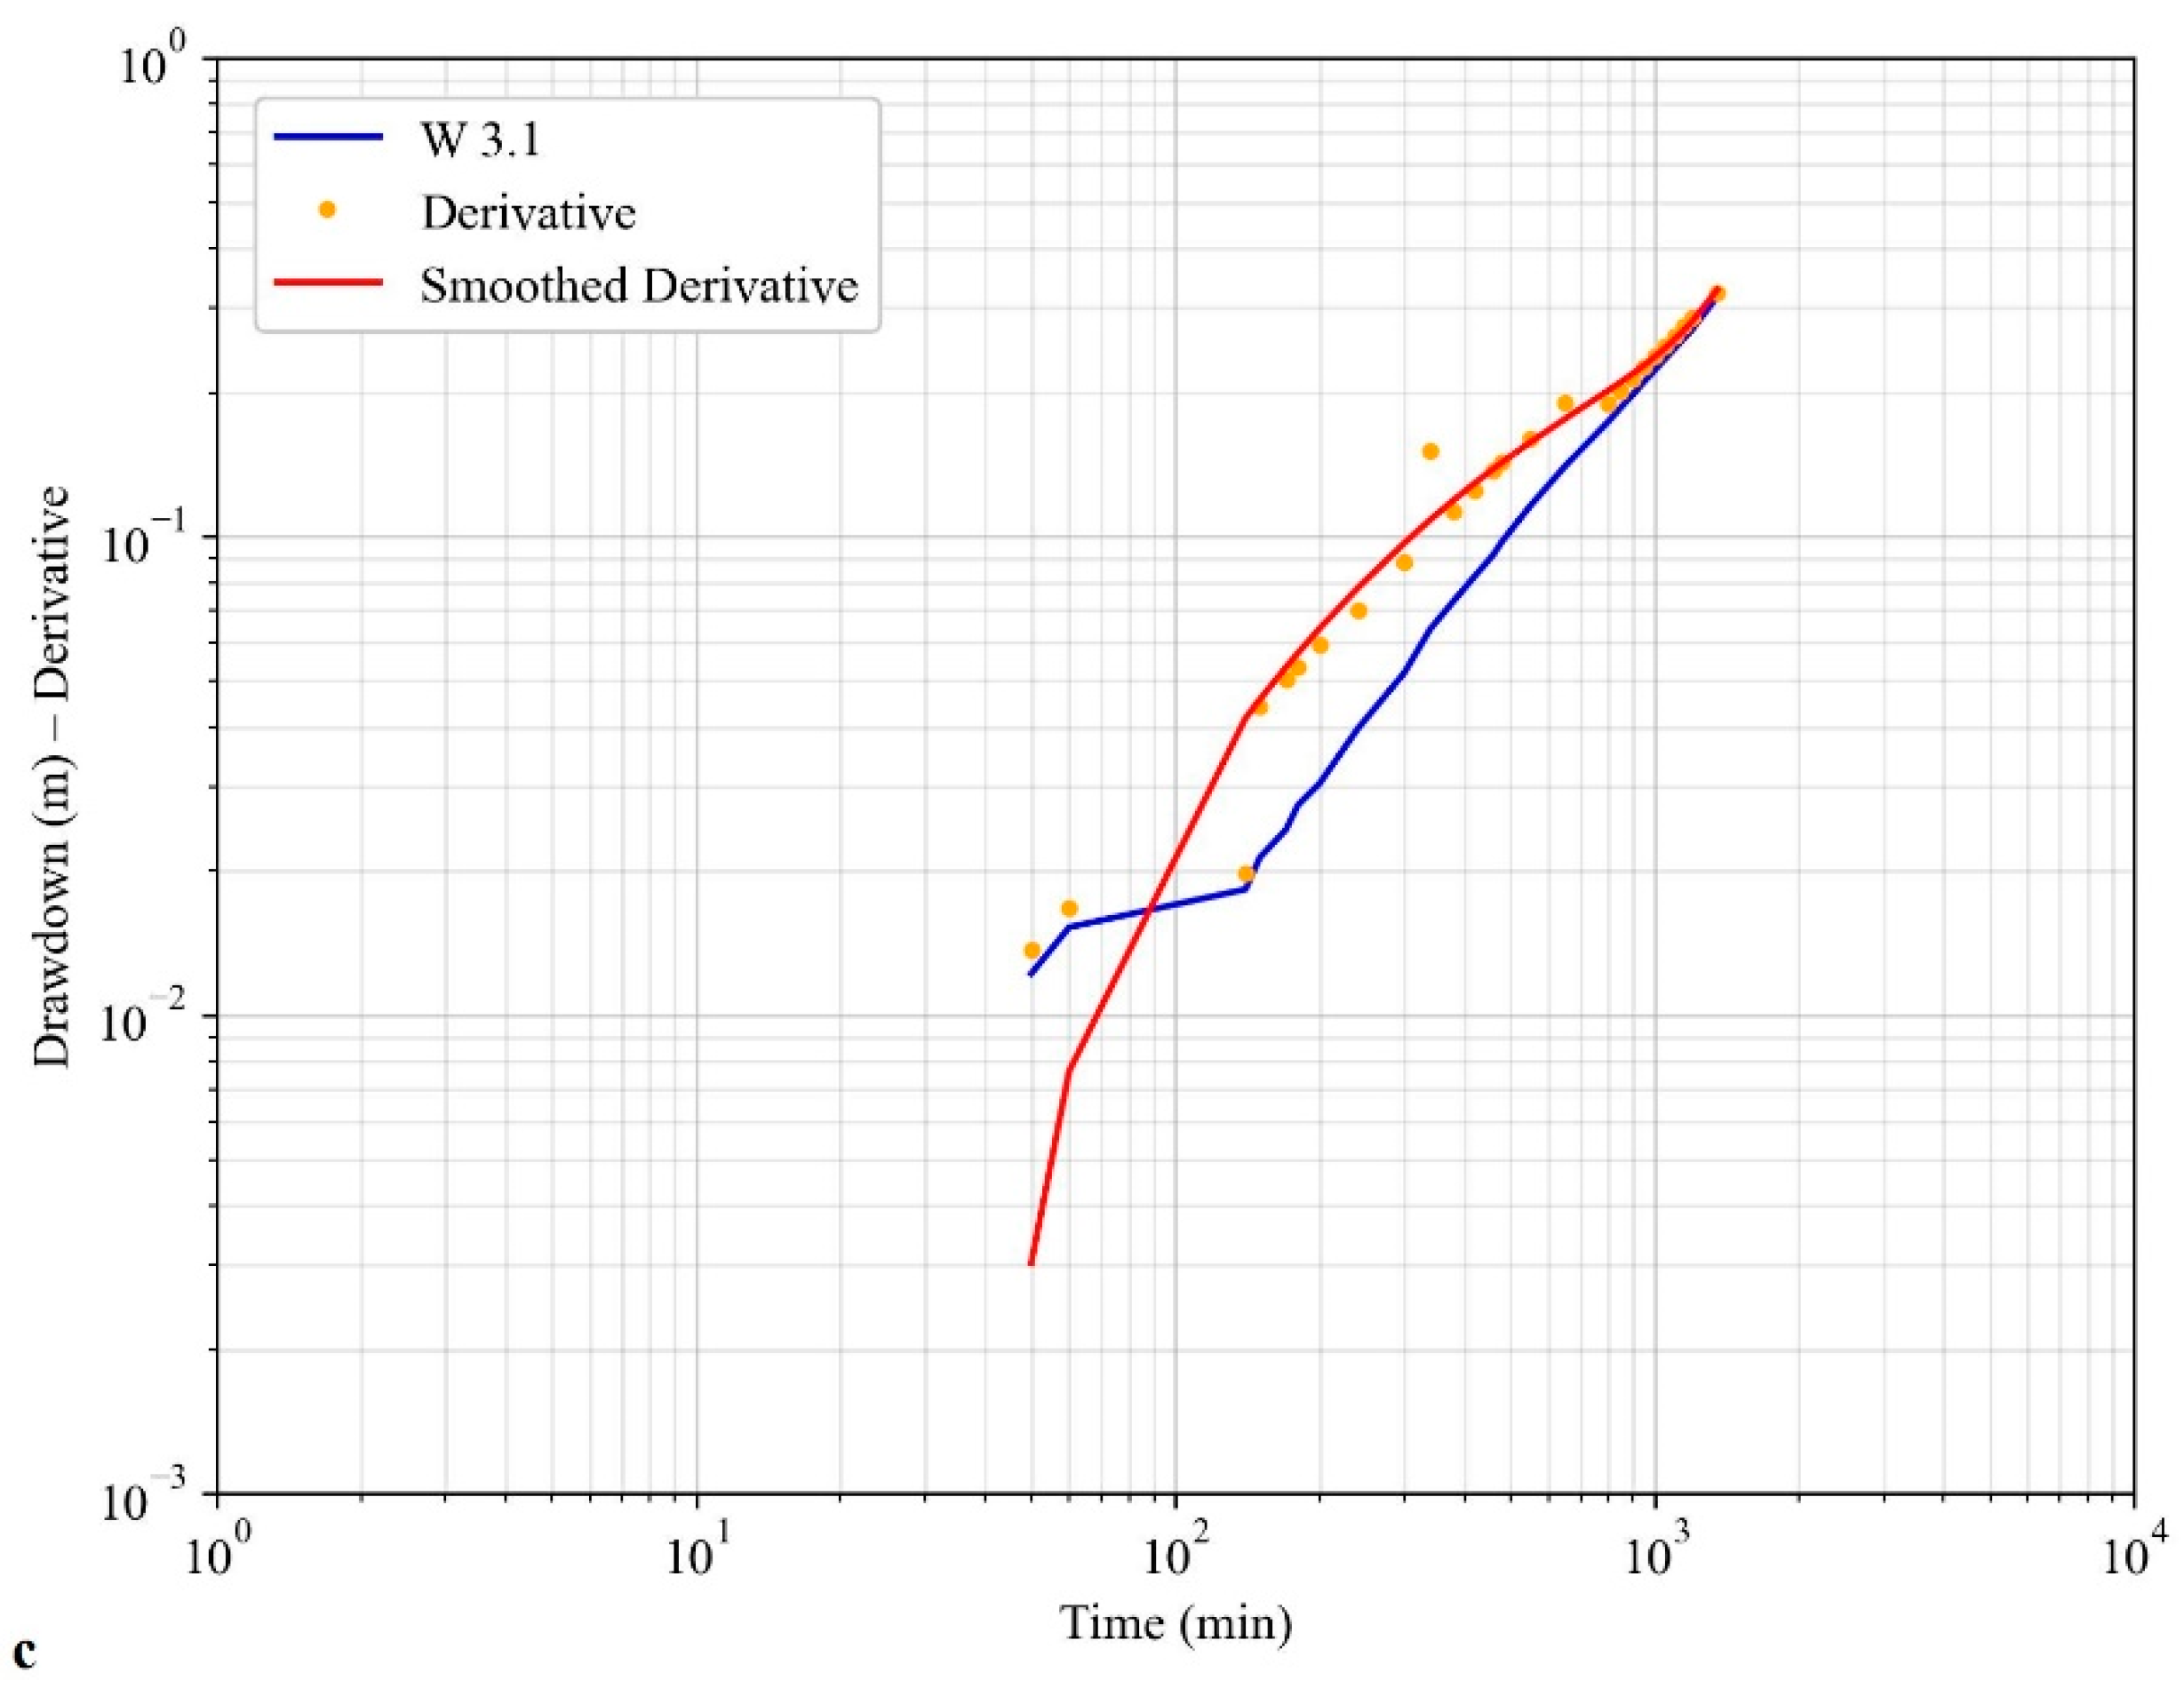
The W4 test (MET) was conducted at a constant flow rate of 15.0 L/s for 1441 min. The test included drawdown measurements, both in the pumping well and in the observation well W3.1 located at 60 m (Figure 1c). The semi-log plot of drawdown–time shows a homogeneous trend for the pumping (except for the first ten minutes, due to a malfunction of the pressure transducer) and observation wells with a simultaneous increase in the curve slope after about 200 min (Figure 5a). The derivative in the bi-log plots for both observation points (after an early radial flow observed only for the pumping well; Figure 5b) shows a flow rate with n < 2, that can be related to the effect of a no-flow boundary (Figure 5b,c). A similar trend has been observed in the observation well W3.1, after 200 min, during the test performed in well W3 (Figure 4c).
The drawdown measured in the wells (W4 and W3.1) fits with good approximation with different interpretative models (double porosity [31,32] and Moench models [29]). The aquifer parameters determined for the radial flow section of the drawdown–time curve show high values of T and S (Table 1).
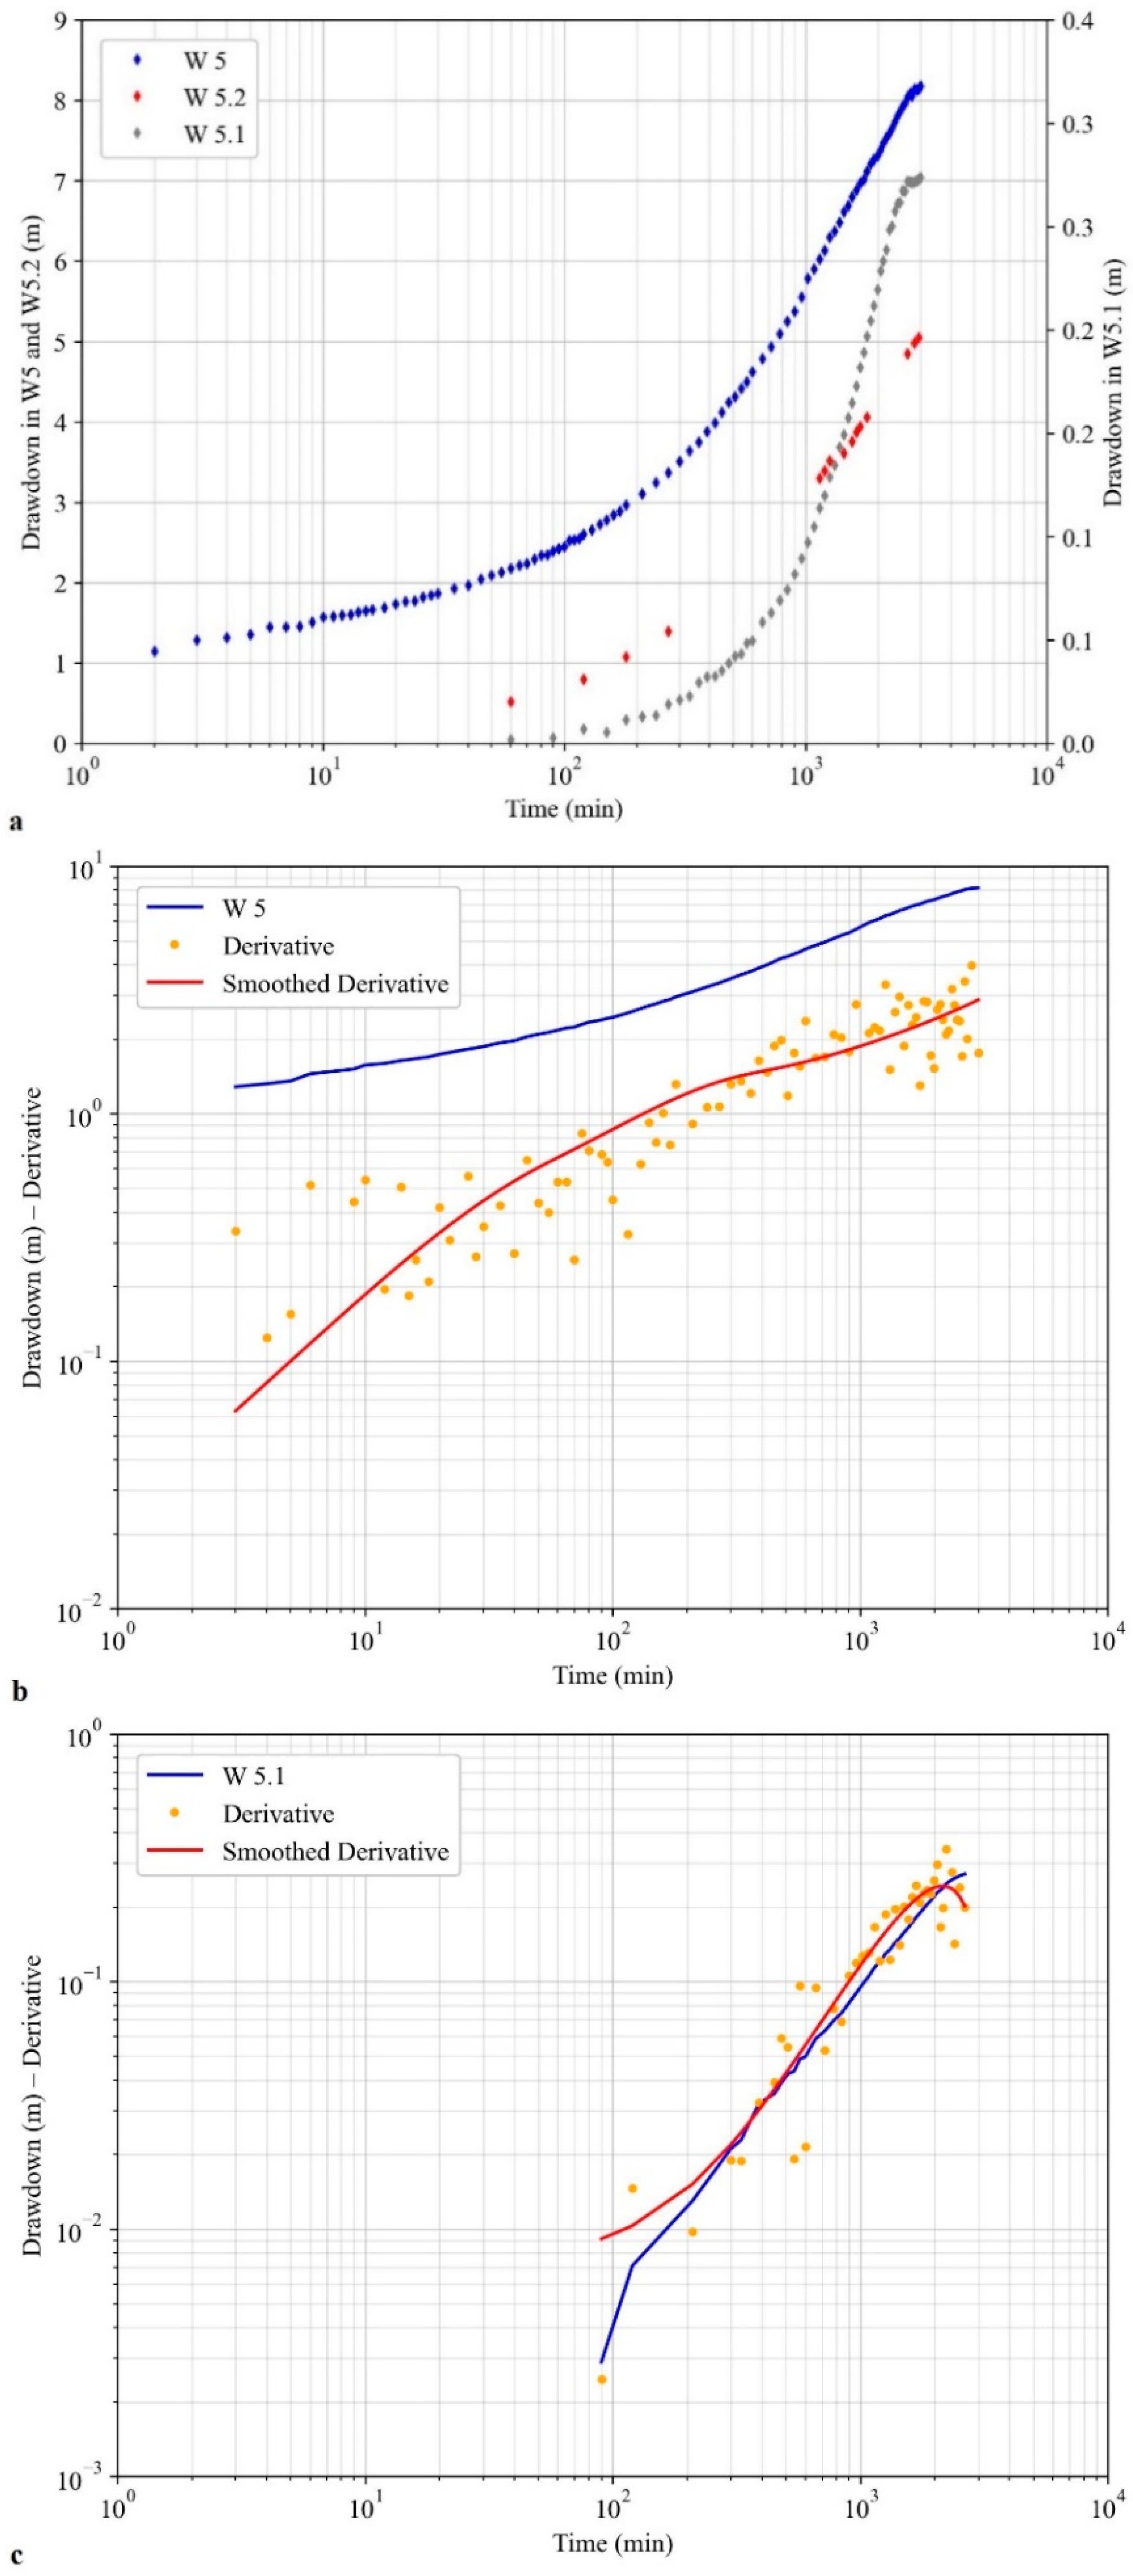
The W5 test (MET), conducted at a constant flow rate of 11.5 L/s for 3000 min, included drawdown measurements in the pumping well (also during the recovery, not shown in the graphs) and in an observation well W5.1 located at 110 m. Drawdown was also measured less frequently in another observation well (W5.2) located 116 m from the pumping well. In addition, water levels in three other wells were measured before pumping and at the end of the test (Figure 6a). The potentiometric surface, reconstructed using the water level data before pumping, shows a flow oriented from N to S with a high hydraulic gradient (from 5 to 22%).
The semi-log plot of drawdown–time shows that for the pumping well and the W5.1 observation well a similar trend up to approximately 2000 min with an increase in the slope after the first hundred minutes is observed (Figure 7a). The drawdown curve of the observation well W5.2 also shows a similar trend in the early time, even if the measured data are less frequent (Figure 7a). In the latter case, the drawdown is higher than that of W5.1, despite the fact that the distance from the pumping well is comparable (Figure 6a).
For the pumping well W5, the derivative shows a variable slope (Figure 7b) that can be related to the effect of the wellbore storage in the early time followed by a linear flow in the last part of the test (n = 1). For the observation well, W5.1, the derivative shows a general trend (n = 0) attributable to a no-flow boundary (Figure 7c). The residual drawdown measured in the pumping well shows a recovery of 75% after about 2600 min.
Excluding the part of the curve affected by wellbore storage, the drawdown measured in the pumping well fits with good approximation with different interpretative models [27,28,29,31,32] giving slightly different transmissivity values (the average value reported in Table 1 differs by 6% compared to those calculated through the aforementioned methods). Comparable T values are also obtained by using the recovery data (Table 1). The best fit model for the drawdown measured in the observation well W5.1 is the Moench model, which gives a T value of an order of magnitude higher than that calculated for the pumping well, as well as a high S value. Using the few data available for the observation well W5.2, a T value comparable to the one determined for the pumping well is obtained, while an S value of an order of magnitude lower than that determined for the W5.1 is found (Table 1). The variability of parameter values determined through the different datasets is reflected in the drawdown difference measured at the end of the test in the five observation wells as shown in Figure 6b.
By applying the distance-drawdown method to the W5.1 and W5.3 observation wells, characterized by the lowest drawdowns at the end of the test (Figure 6b), values of T and S of 4.9 × 10⁻³ m2/s and 1.1 × 10⁻², respectively, are obtained using the drawdowns measured at 3000 min. These values are comparable with those determined by the drawdown in the observation well W5.1. By applying the distance-drawdown method to the W5.2, W5.4 and W6 observation wells, characterized by the higher drawdowns at the end of the test (Figure 6b), values for T and S of 3.6 × 10⁻⁴ m2/s and 2.0 × 10⁻⁴, respectively, are obtained by using the data measured at the end of the test. In this case the T value is comparable with those determined by the drawdown in the pumping well, W5, and observation well, W5.2.
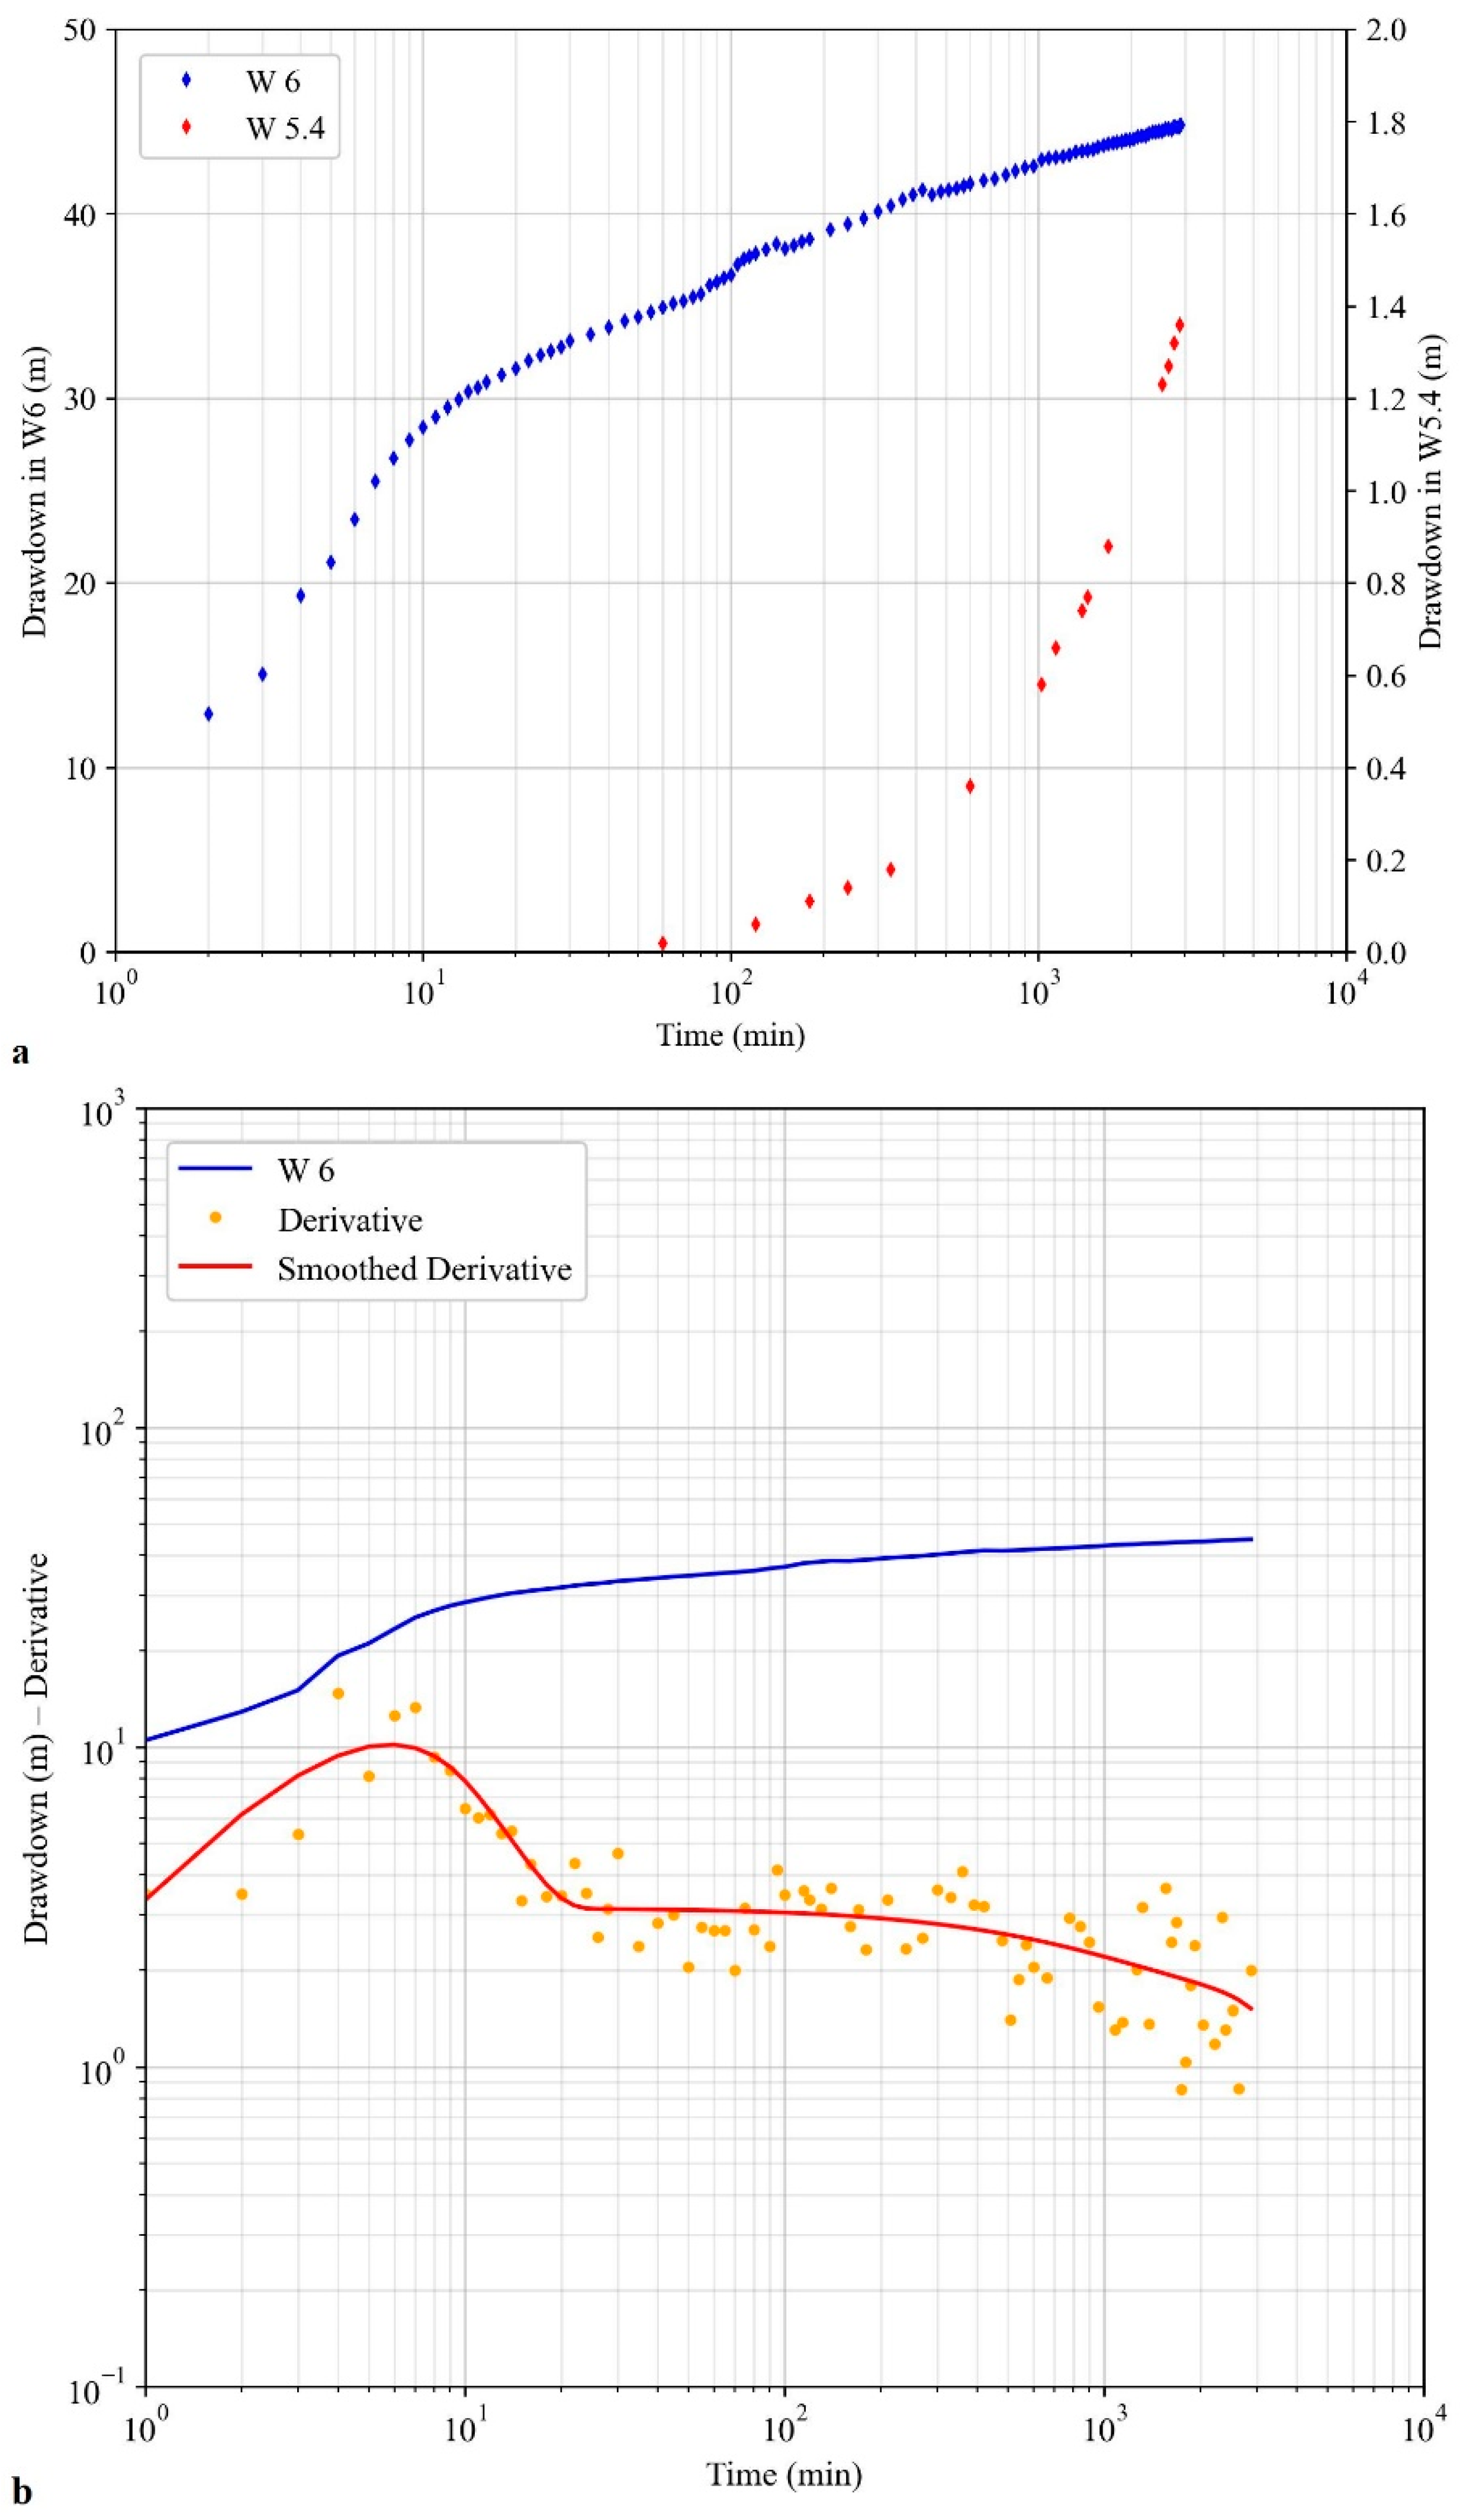
The W6 test (MET) has been conducted at a constant flow rate of 8.7 L/s for about 3000 min in the same area of the W5 test (Figure 6a). The drawdown was measured in the pumping well (also during the recovery, not shown in the graphs) and in an observation well, W5.4, with a lower frequency. As for test W5, the drawdown at the end of the test was also monitored in the other wells of the area (Figure 6b).
After the first ten minutes, the semi-log plot of drawdown–time for the pumping well shows a trend that differs little from the Theis model (Figure 8a), by recording a significant drawdown at the end of the test (with an emptying of about 50% of the saturated aquifer intercepted by the well). The derivative of the drawdown in W6 shows a trend that can be related to the effect of the wellbore storage in the early time (up to 20 min) followed by a pseudo-radial flow in the late time (Figure 8b). The residual drawdown measured in the pumping well shows a recovery of about 99% after about 2800 min (not present in the graphs). For the pumping well, the T values determined by the Theis and Cooper–Jacob models, using the drawdown and residual drawdown data, differ little from each other (Table 1).
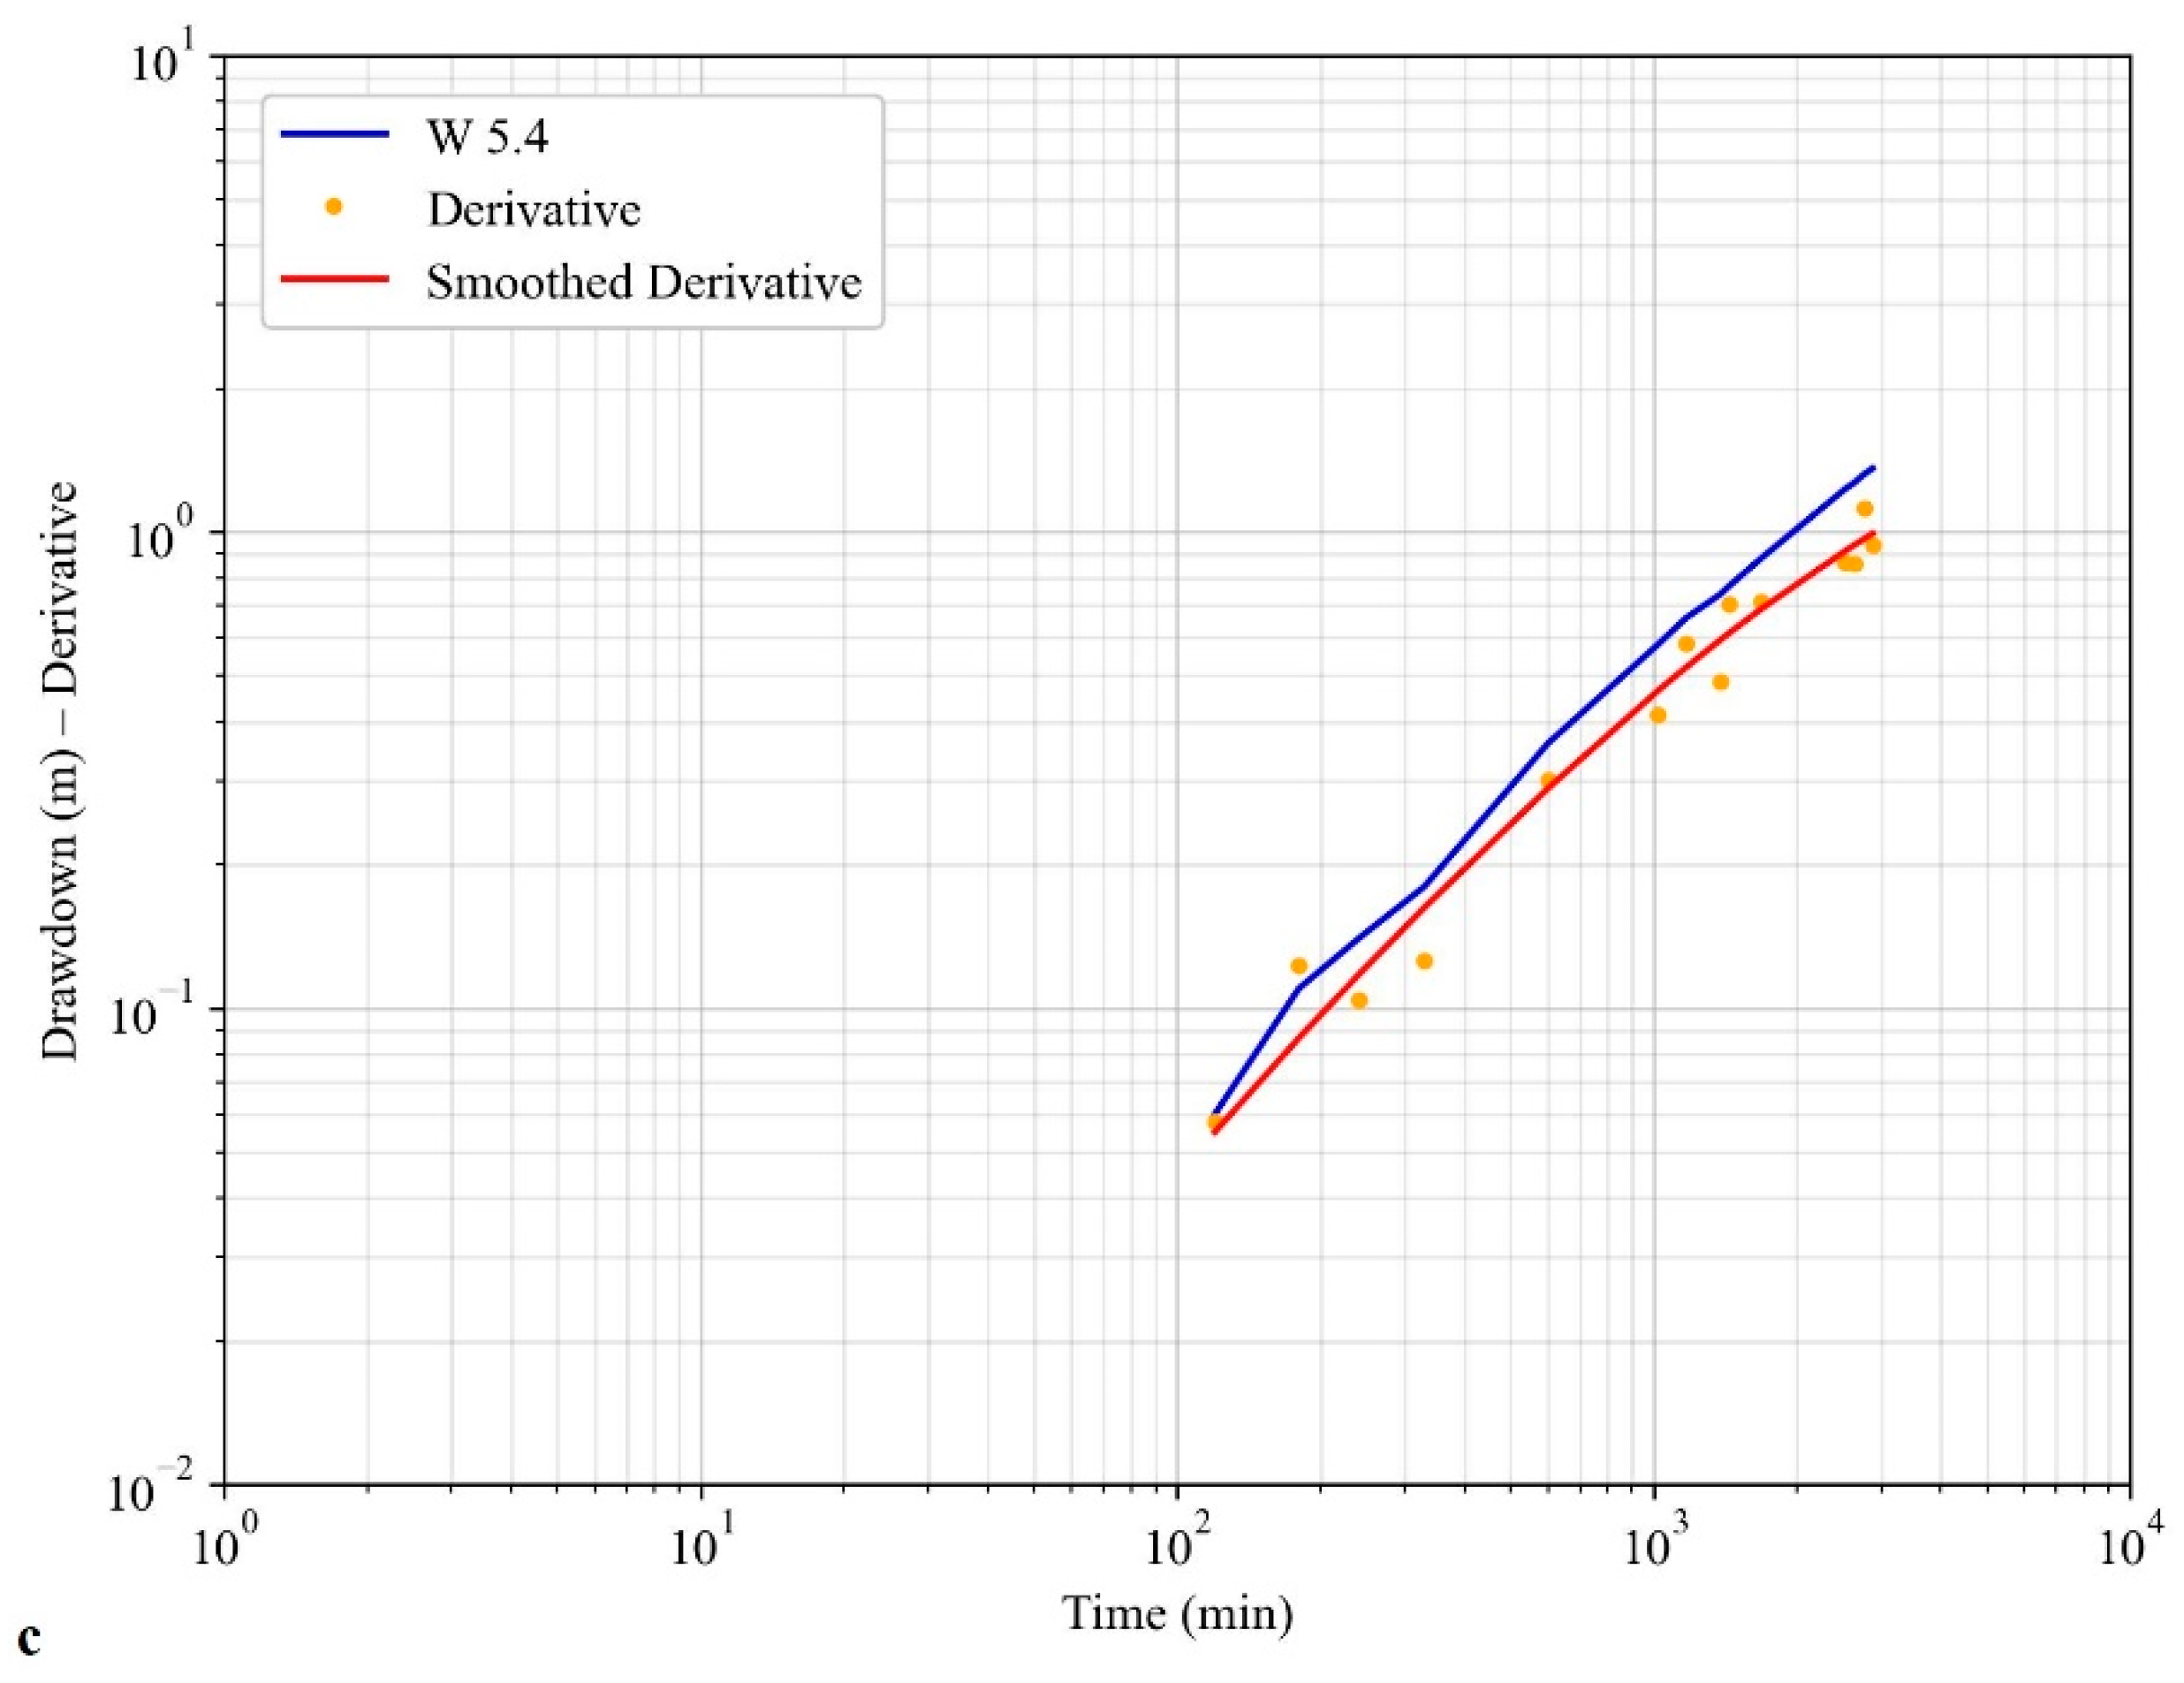
The drawdown and the derivative curves in W5.4 are completely different from those of the pumping well (Figure 8a–c). The drawdown curve in the semi-log plot shows an increase in slope in late time (Figure 8a) while the derivative slope shows a flow dimension of n = 0 (Figure 8c). These trends can be attributed to a no-flow boundary. Using the few available data for the observation well, a T value of an order of magnitude higher than that of the pumping well is found (Table 1).
By examining the drawdowns measured at the end of the test in the different observation wells, as in the case of the W5 test, lower drawdown values are recorded in the observation points located upstream of the pumping well, according to flow direction. In this case, drawdown seems not to be inversely related to the distance (Figure 6b).

4. Discussion on Aquifer and Well Response to Pumping

The results of the pumping tests, interpreted in the specific geological context, allowed us to obtain information on the response to pumping of little-known aquifers and directions on the sustainable yield of wells in these hydrogeological environments and more generally in low-permeability fractured aquifers.
The andesitic and metamorphic aquifers of the two test sites are extremely heterogeneous when reference is made both to the estimated hydraulic parameters of the aquifers (T and S) and the analysis of the trends of the drawdown and its derivative. In fact, (i) the T and S, determined by applying the models available in the literature, cover three orders of magnitude (respectively, 10−5–10−3 m2/s and 10−4–10−2, Table 1), (ii) the drawdown–time trend in the pumping well is very different from that of observation wells in three out of six tests (Figure 3, Figure 4 and Figure 8), and (iii) sometimes there is no correlation between drawdown and distance from the pumping center (Figure 6b). In some cases, the drawdown–time trend during the test time is slightly different from the Theis curve or tends to a pseudo-steady-state flow (Figure 4 and Figure 8). In other cases, the drawdown–log-time slope increases in the final part of the tests (Figure 2, Figure 5 and Figure 7), which can be attributable to no-flow boundary effects, for example due to frequent dike intrusions in the metamorphic rocks (W5 and W6 well tests) or to low-fractured aquifer zones reached by the cone of depression. Although the heterogenous hydraulic diffusivity of the aquifer affects the response time and the drawdown magnitude in the observation wells, the drawdown due to pumping reaches significant distances from the pumping well (up to 270 m), highlighting the continuity in the fractured media. In addition, a higher hydraulic gradient and a lower thickness of aquifer characterize the metamorphic rocks compared to the andesitic ones, while the behavior under pumping does not show specific peculiarities.
The attitude of the examined aquifers under pumping Is sometimes comparable with that found in hard-rock aquifers [15,33,34], and in other cases (for example, W5 and W6 tests) it is comparable with that found in rock aquifers intersected by intrusive dikes [35]. In all cases the test results highlight how the knowledge of the pumping response of this type of aquifer depends on the test time. An interpretative model derived from a test of a few hundred minutes can be completely different from that obtained after some thousand minutes of pumping. Regarding the well performance under pumping, the different specific capacity of the tested wells should be noted first. Specific capacity values, calculated homogeneously for all the wells tested after 1000 min, range among three orders of magnitude (10−4–10−2 m2/s) consistently with both the heterogeneity of the transmissivity values (Table 1) and probably the different non-linear head losses recorded in the wells. In four out of six tests, the T values calculated with data of the pumping well were one order of magnitude lower than those derived from the observation well data (Table 1). When the trend of the residual drawdown was available, a generally reversible response was found during the recovery, as shown by the comparability of the transmissivity values determined by the drawdown and residual drawdown.
Even considering the difference in the well efficiencies, once again the duration of the test is crucial to understanding the progress of the drawdown over time. A 200 min test on wells W1, W4 and W5 (Figure 2, Figure 5 and Figure 7) would have been misleading in the definition of the well’s operating flow since the subsequent drawdown–time trend implies limitations on time of pumping and flow rate.

5. Operational Approach to Define the Sustainable Yield of a Single Well

By combining the response of the aquifer to pumping with the observed well performance, information can be gained about the method to determine the sustainable yield of a single well. In such a heterogeneous hydrogeological environment, the trend of drawdown over time measured in the pumping well seems to be the key factor for the definition of the sustainable yield of the well, rather than the hydraulic parameters of the aquifer obtained from the interpretation of the pumping tests. Moreover, given the general low permeability of these aquifers and, therefore, the expected low yield of the wells, in order to define the sustainable yield of a single well, an operational approach that is simple to apply and inexpensive should be preferred.
To define the sustainable yield of a single well, two tests have been selected on the basis of the worst results in terms of drawdown–time trend measured in the pumping well. The selected tests are W1 (Figure 2) and W5 tests (Figure 7) since they show a significant increase in the drawdown–time curve slope of the pumping well during the test time. This trend can compromise the use of the well over time due to the progressive emptying of the well.
As a first step of the procedure, the analytical function drawdown–time of the pumping well obtained from the test has been determined. Then, time, flow rate and pumping mode of the well can also be empirically defined based on the saturated thickness of the aquifer intercepted by the well.
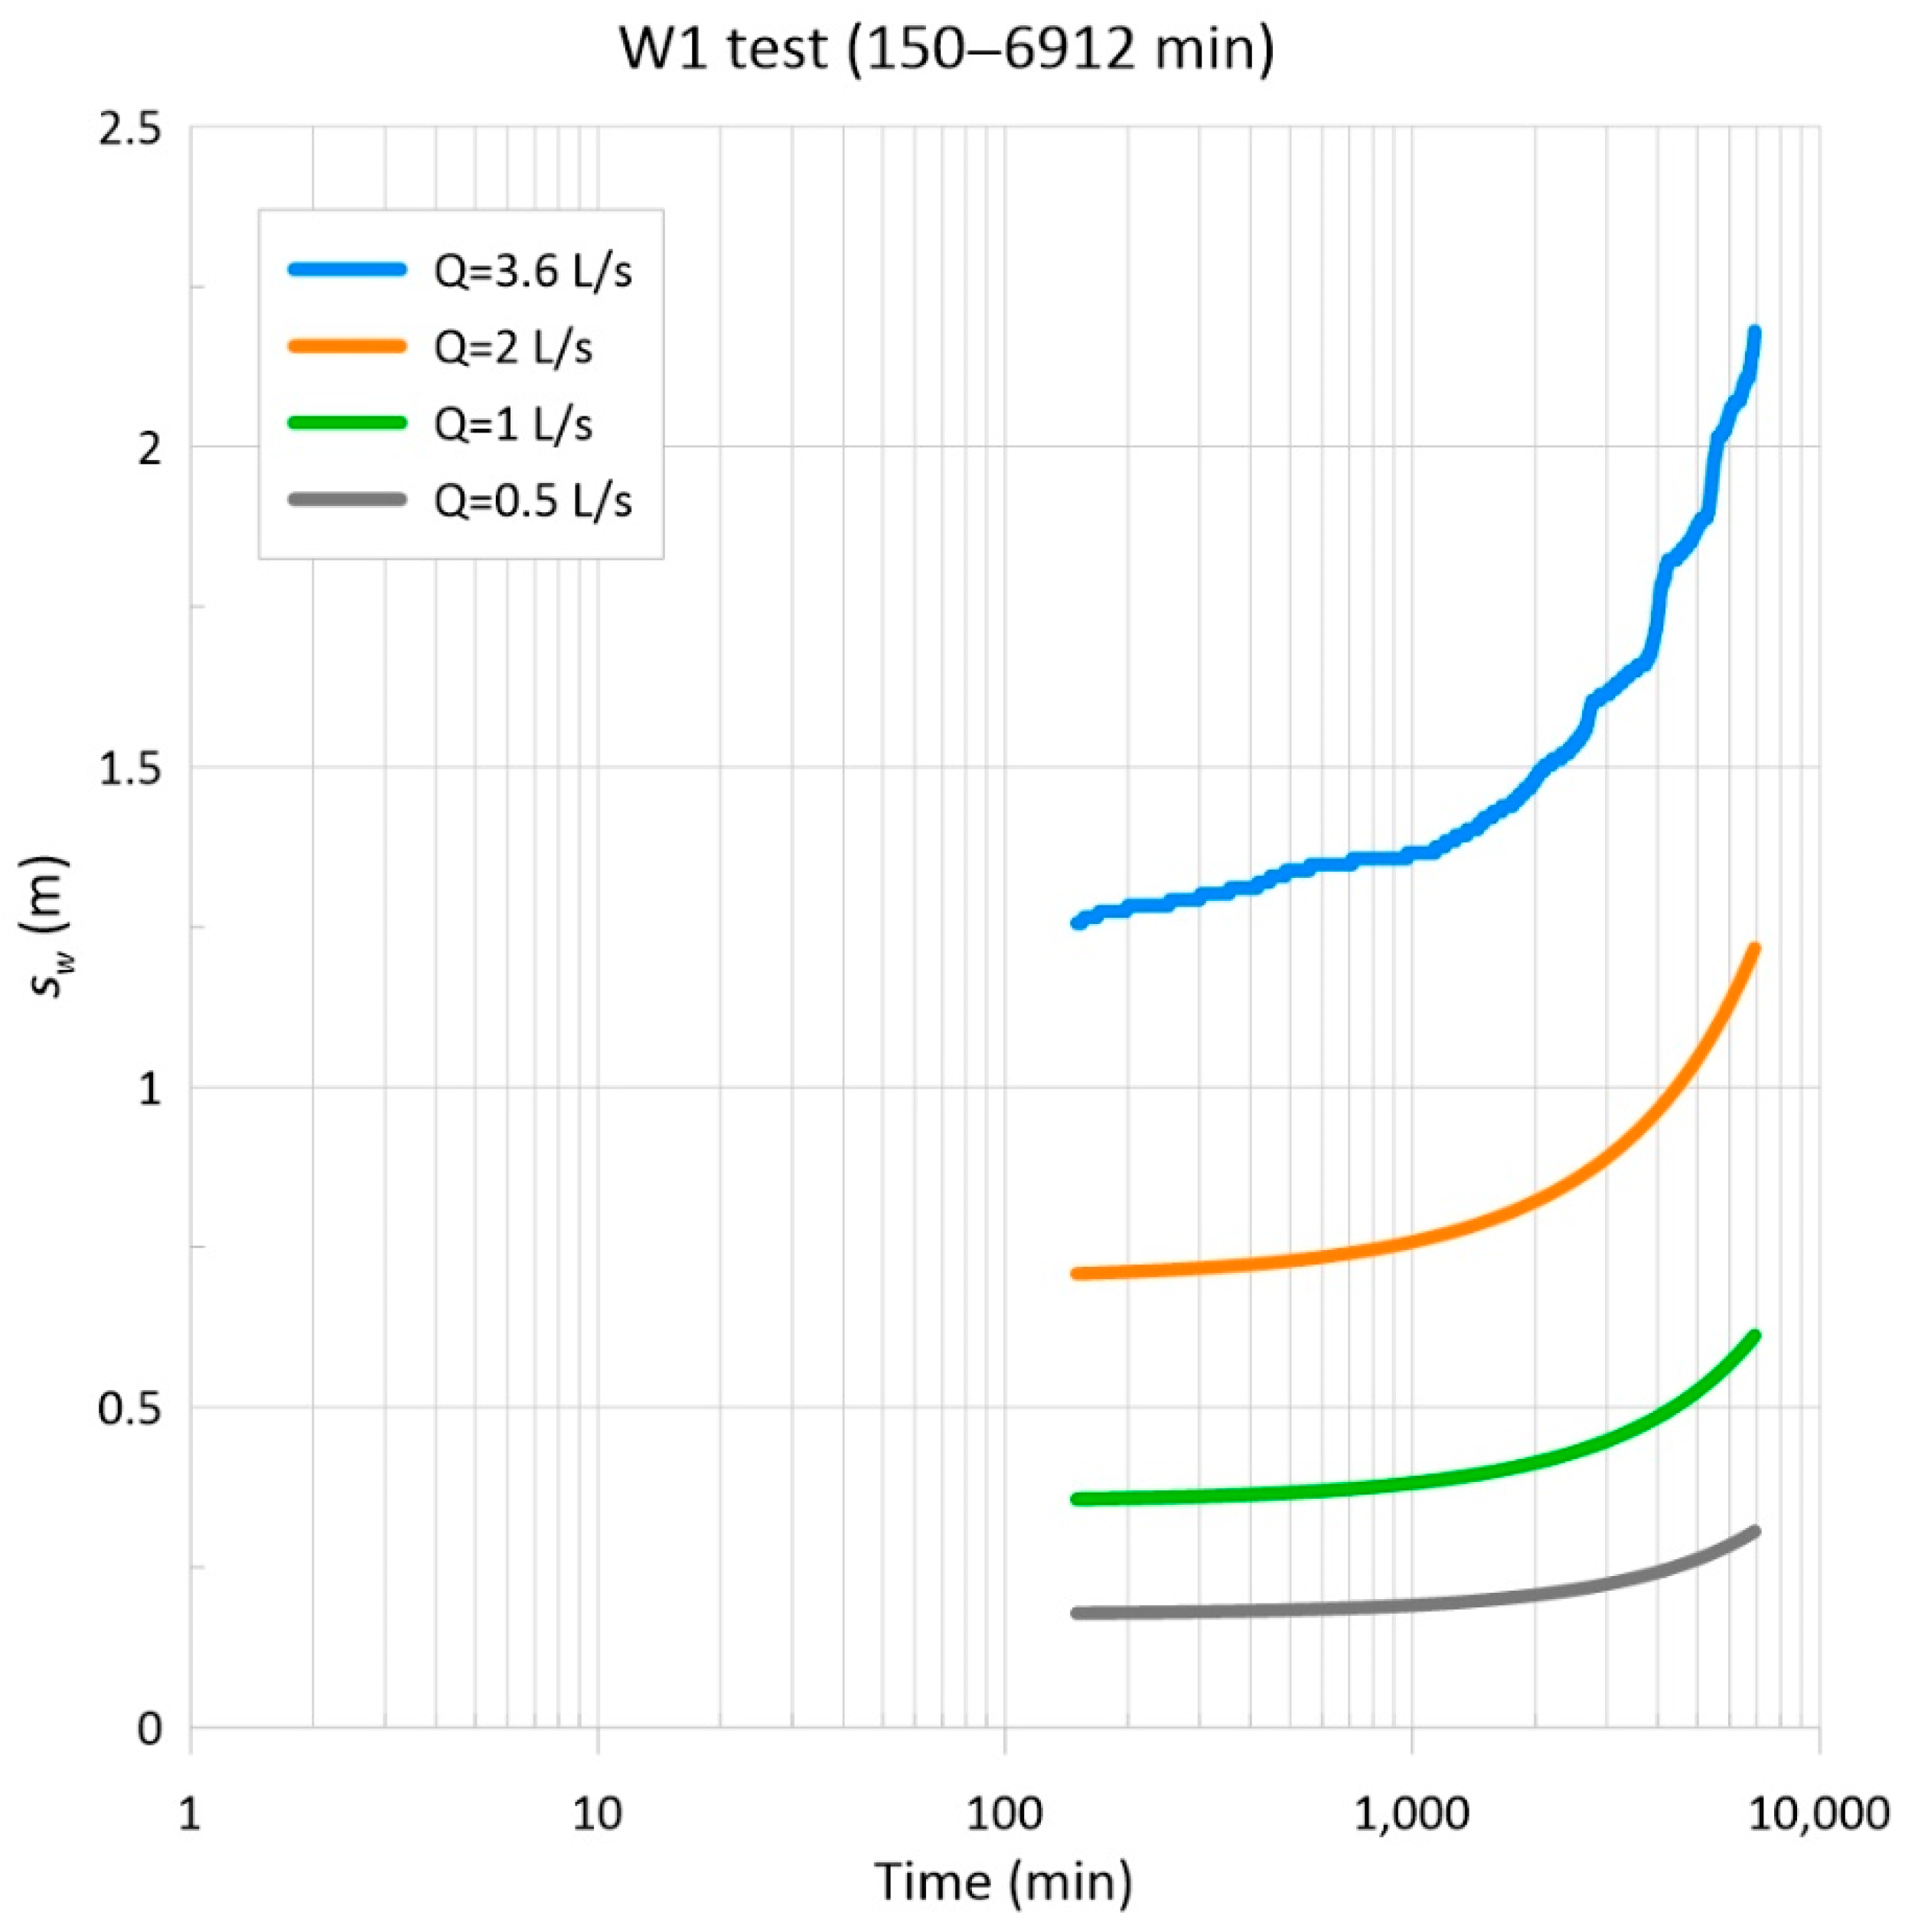
For the W1 test, a homogeneous drawdown–time trend for the pumping well and the two observation wells was found with a significant increase in the curve slope in the last test period (Figure 2). For operational purposes, the last part of the drawdown–time trend in the pumping well is the most useful one (between 150 and 6912 min). This section can be interpolated with good approximation through the following exponential function (Figure 9):
s w = 1.266 e 1.3 × 10 6 t
where sw is the drawdown in the well (in m) and t is the test time (in s). Considering that all interpretative available models of pumping tests linearly relate the drawdown to the pumping flow rate and the exponential multiplier coefficient in Equation (1) (i.e., 1.266) is a linear function of the pumping flow (Q in m3/s), then Equation (1) can be written as follows:
s w = 351.7   Q   e 1.3 × 10 6 t
considering the flow rate of the test (Q = 0.0036 m3/s).
The same results are achieved using the MLU software [24,25]. Specifically, through the software, the T and S values that best reflect the measured data have been calibrated. The equation that best fits with the data calculated by the program has been derived and it is similar to Equation (2). Therefore, other curves can be generated for alternative pumping flow rates by varying the value of Q in Equation (2), as shown in Figure 9.
Through Equation (2), the long-term drawdown relationship in the pumping well has been extrapolated, not considering the aquifer parameters. In addition, the flow rates of 2.0, 1.0 and 0.5 L/s, were analytically simulated to determine the different pumping times necessary to reach a prescribed limit of drawdown in the pumping well. This prescribed limit (swl) has been chosen in relation to the percentage of emptying of the well (We):
W e = s w l b × 100
where b is the thickness of the saturated aquifer intercepted by the well. If a We equal to 40% is selected (corresponding in the specific case to swl of 36 m, being b equal to 90 m), to reduce undesirable effects such as dewatering and the increase in non-linear head losses, the time for continuum pumping can be determined for each flow rate as shown in Table 2.
It is worth noting that the trend of the drawdown in the first 1000 min of the test, thereby showing a tendency to stabilize the drawdown (Figure 2), would lead to completely different conclusions on the use of the well.
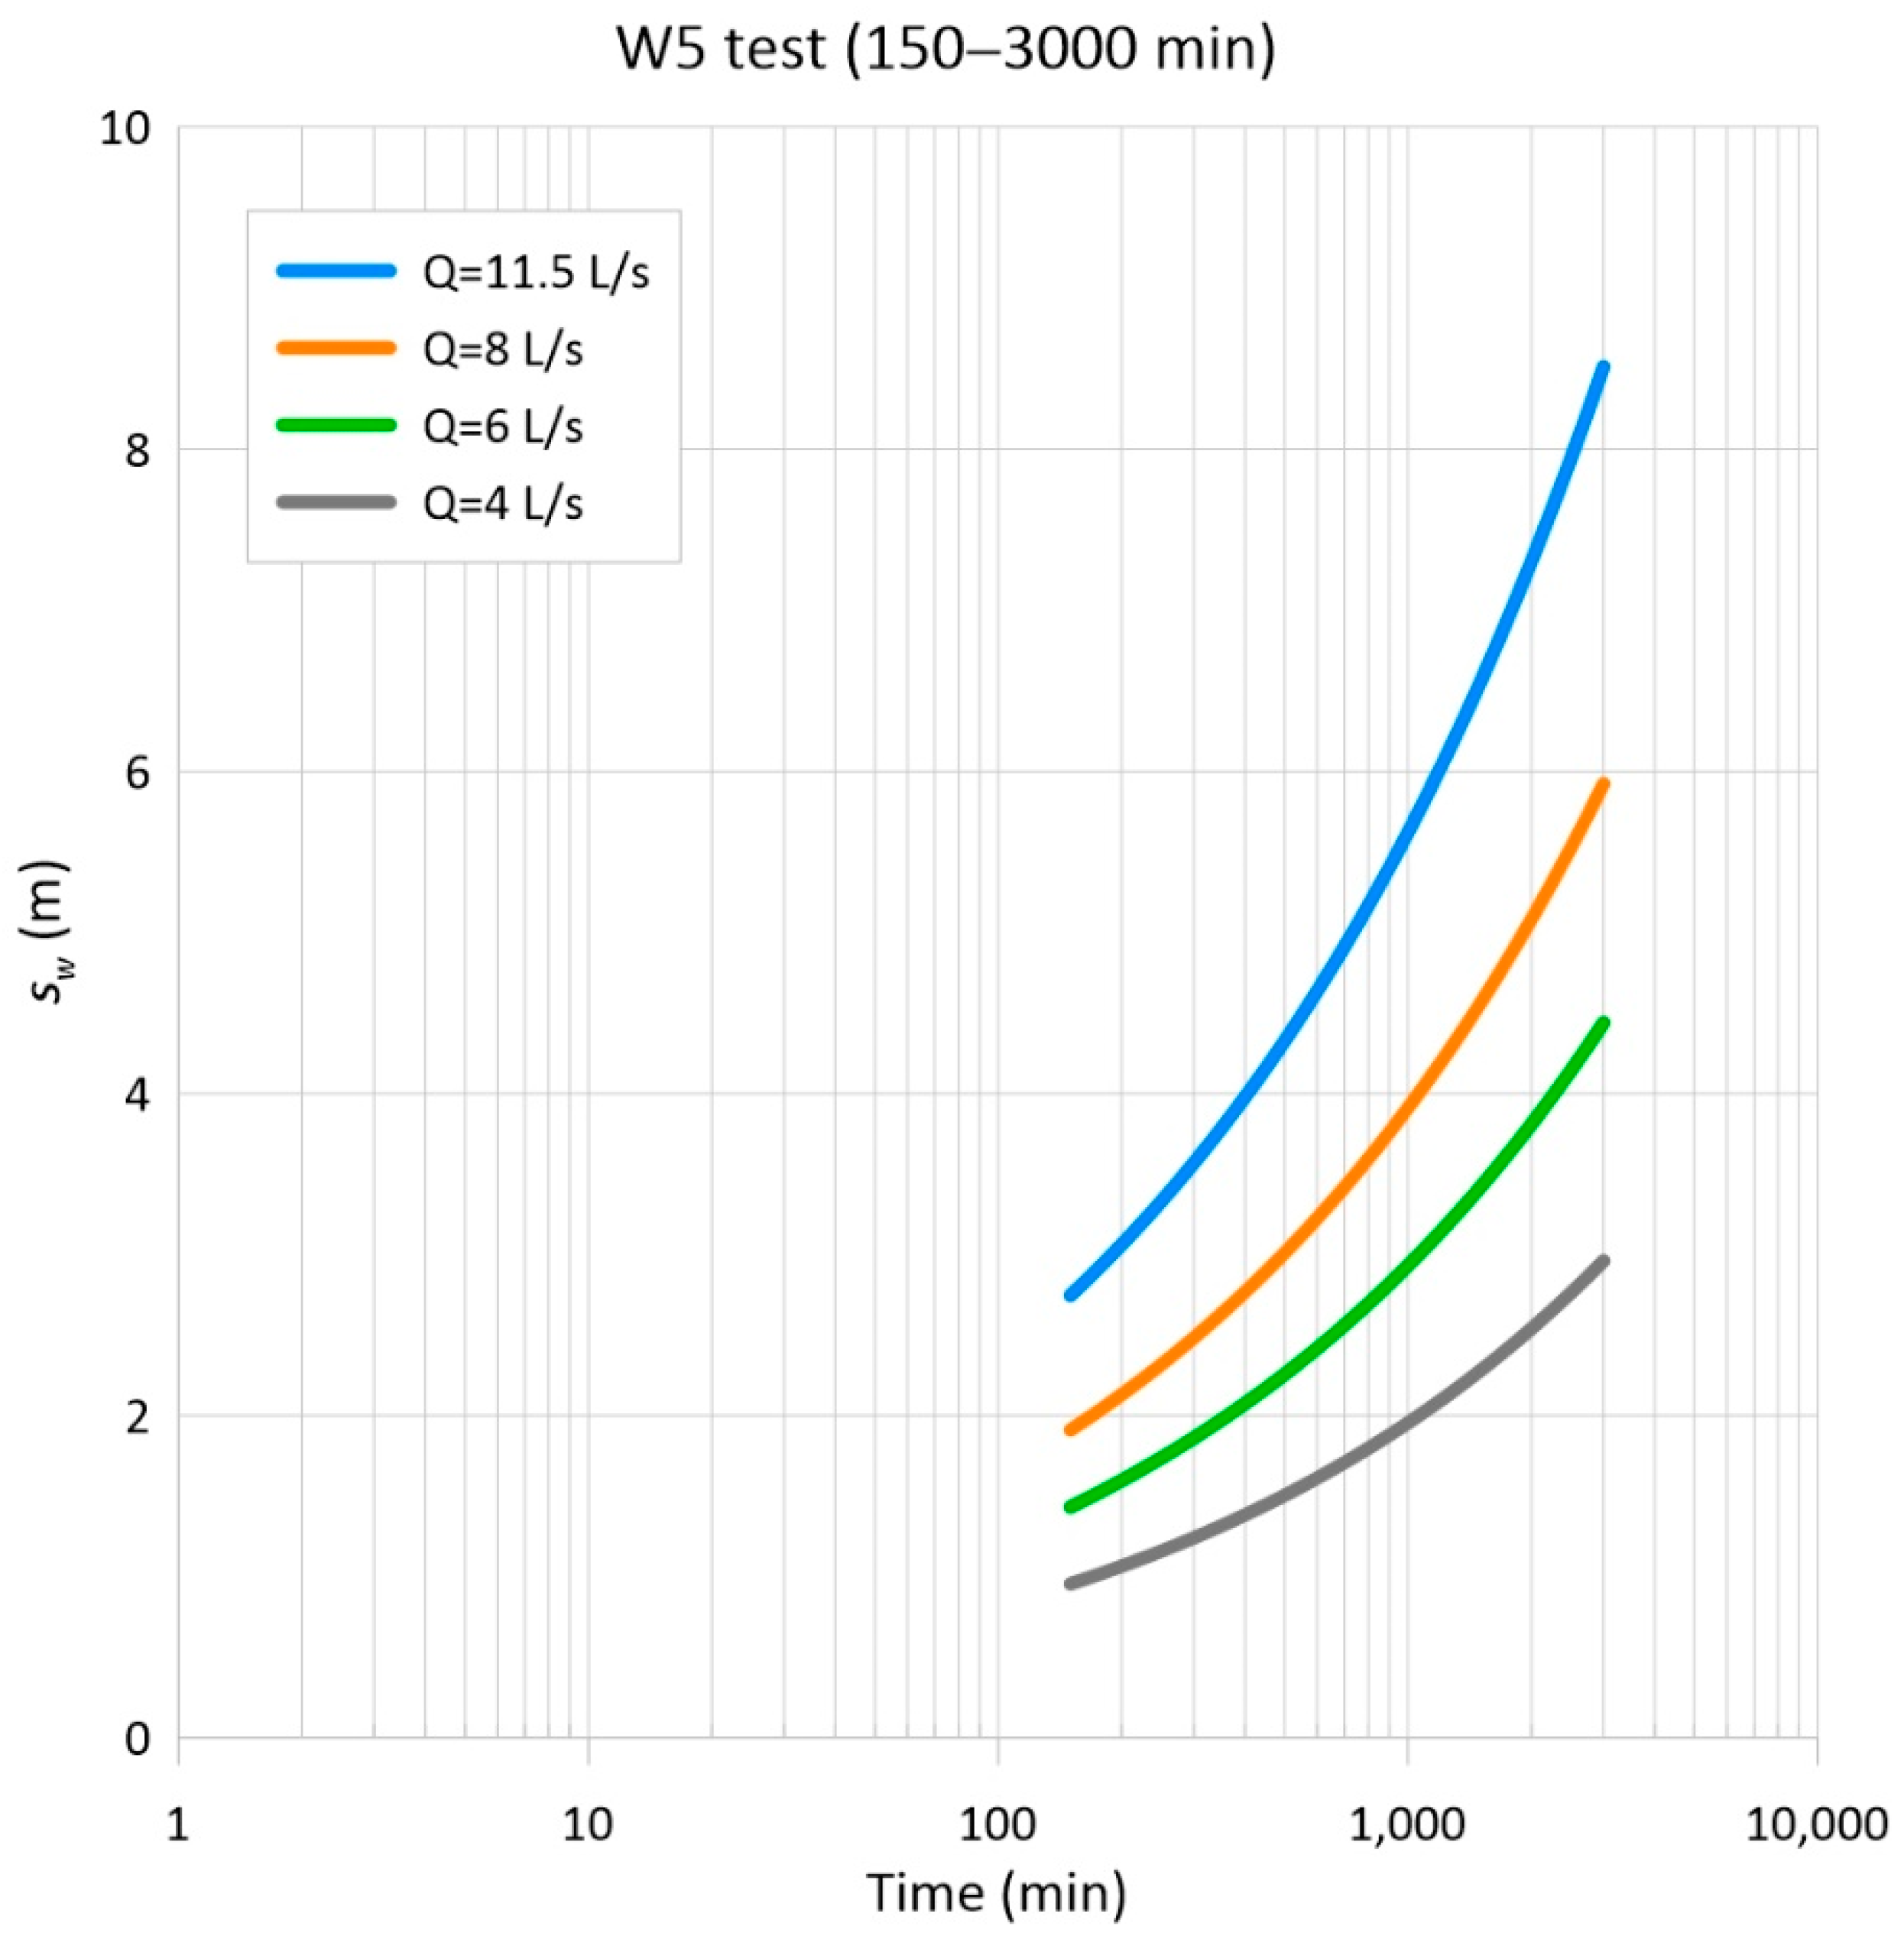
For the W5 test, drawdown–time trends for the pumping well and observation wells also show a significant increase in the curve slope in the last test period (Figure 7). The last part of the drawdown–time curve (150–3000 min) of the pumping well can be interpolated with good approximation with the following power function (precautionary excluding the last 500 min of the test, where a reduction in the slope of the curve can be seen):
s w = 0.088   t 0.378
where sw is the drawdown in the well (in m) and t is the test time (in s). By reducing the coefficient 0.088 linearly as a function of flow rate of the test (0.0115 m3/s), Equation (3) can be written as follows:
s w = 7.652   Q   t 0.378
where Q is the pumping flow rate (in m3/s). Additionally, in this case, using the processing conducted through MLU, after obtaining the values of T and S that better interpret the measured data, the equation that best fits with the calculated data is comparable to Equation (4).
By using Equation (4), once again overlooking the hydraulic parameters of the aquifer, different flow rate scenarios have been simulated (Figure 10), assuming a maximum drawdown of 24 m corresponding to a We of 40% (aquifer thickness 60 m), to determine the time of continuous pumping for each simulated flow rate (Table 3).
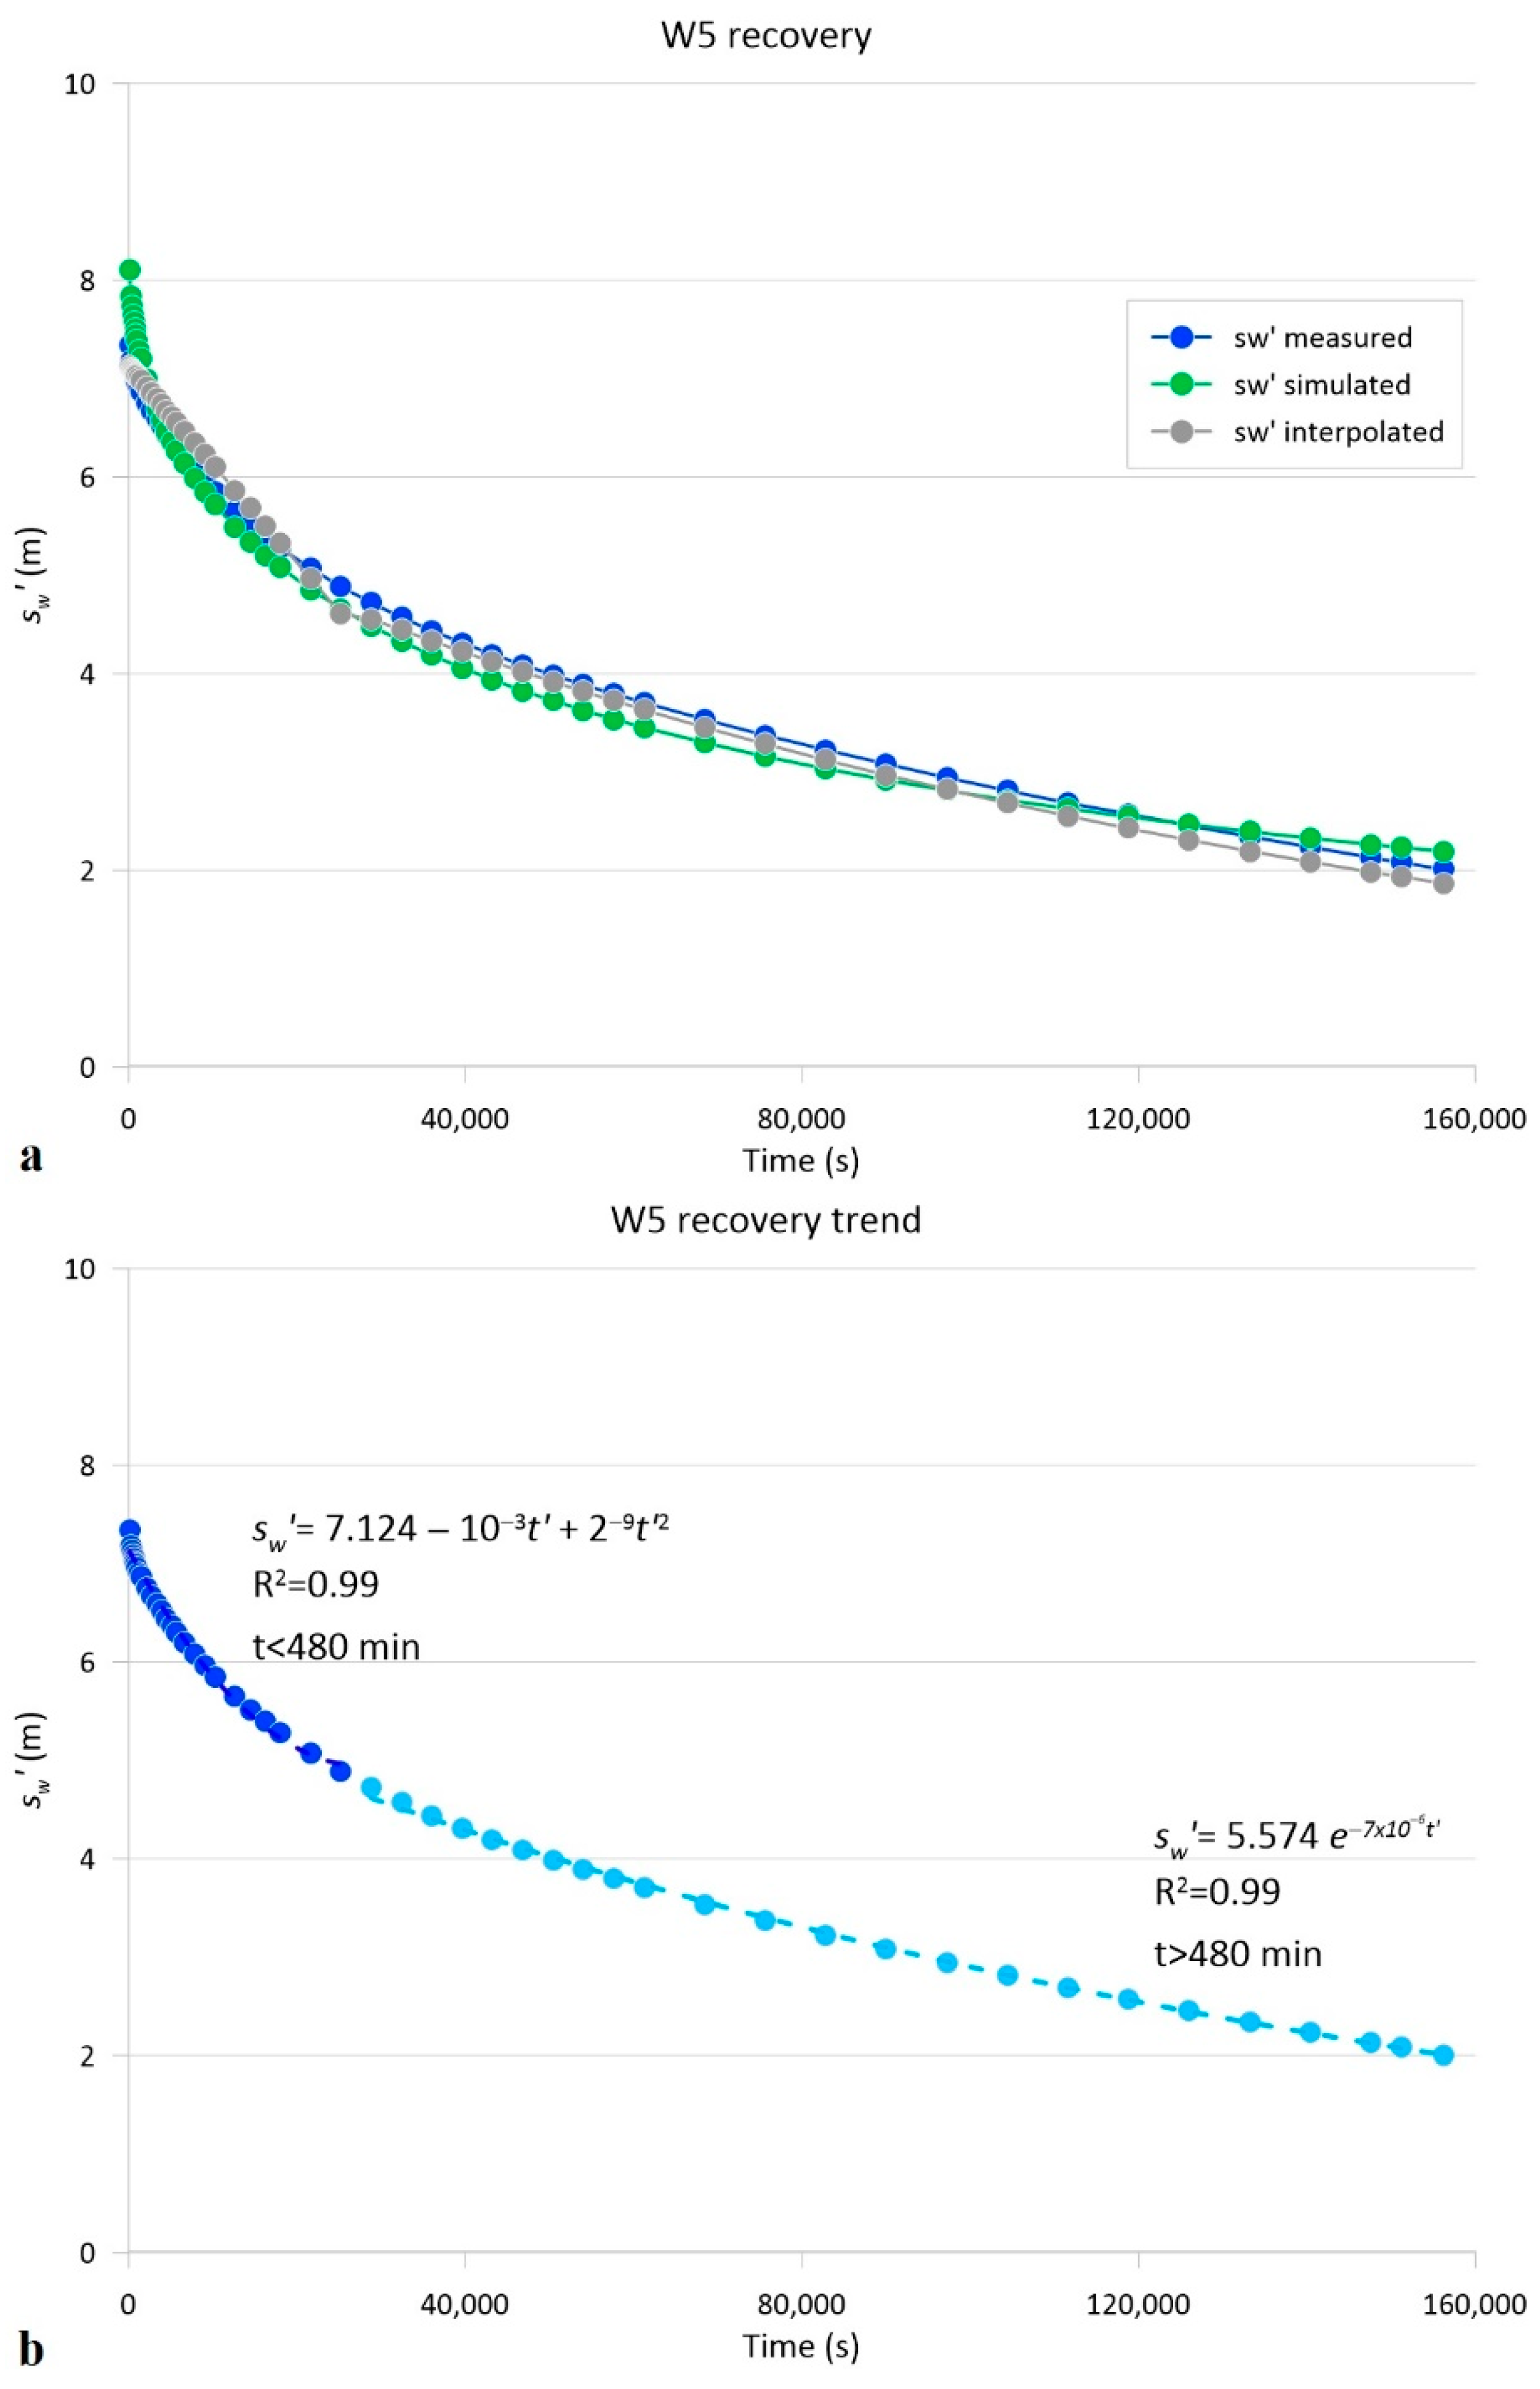
For this test the measurement of the residual drawdown after pumping is also available (Figure 11a). The residual drawdown, measured 2605 min after the end of pumping, was equal to 75% of the drawdown recorded at the end of the test, which lasted 3000 min. The residual drawdown ( s w ) in the W5 well shows a double trend as is seen with other wells. This trend can be represented with sufficient approximation through two curves with the following tendences (Figure 11b).
s w = 7.124 10 3 t + 2 9 t 2   f o r   t < 480   min
s w = 5.574   e 7 × 10 6   t   f o r   t > 480   min
where s w is the residual drawdown (in m) and t′ is the time from the beginning of the recovery (in s). It should be noted that Equations (5) and (6) have been obtained simply by means of an Excel spreadsheet, and the interpolated data slightly differ from measured data and simulated data obtained by MLU (Figure 11a). Through the above equations, taking into account how long in proportion the time fractions of both the rapid recovery and the slow recovery are compared to the total duration of the pumping, as well as the maximum drawdown at the end of pumping, it is possible to also reconstruct the recovery curve for flow rates other than those tested.
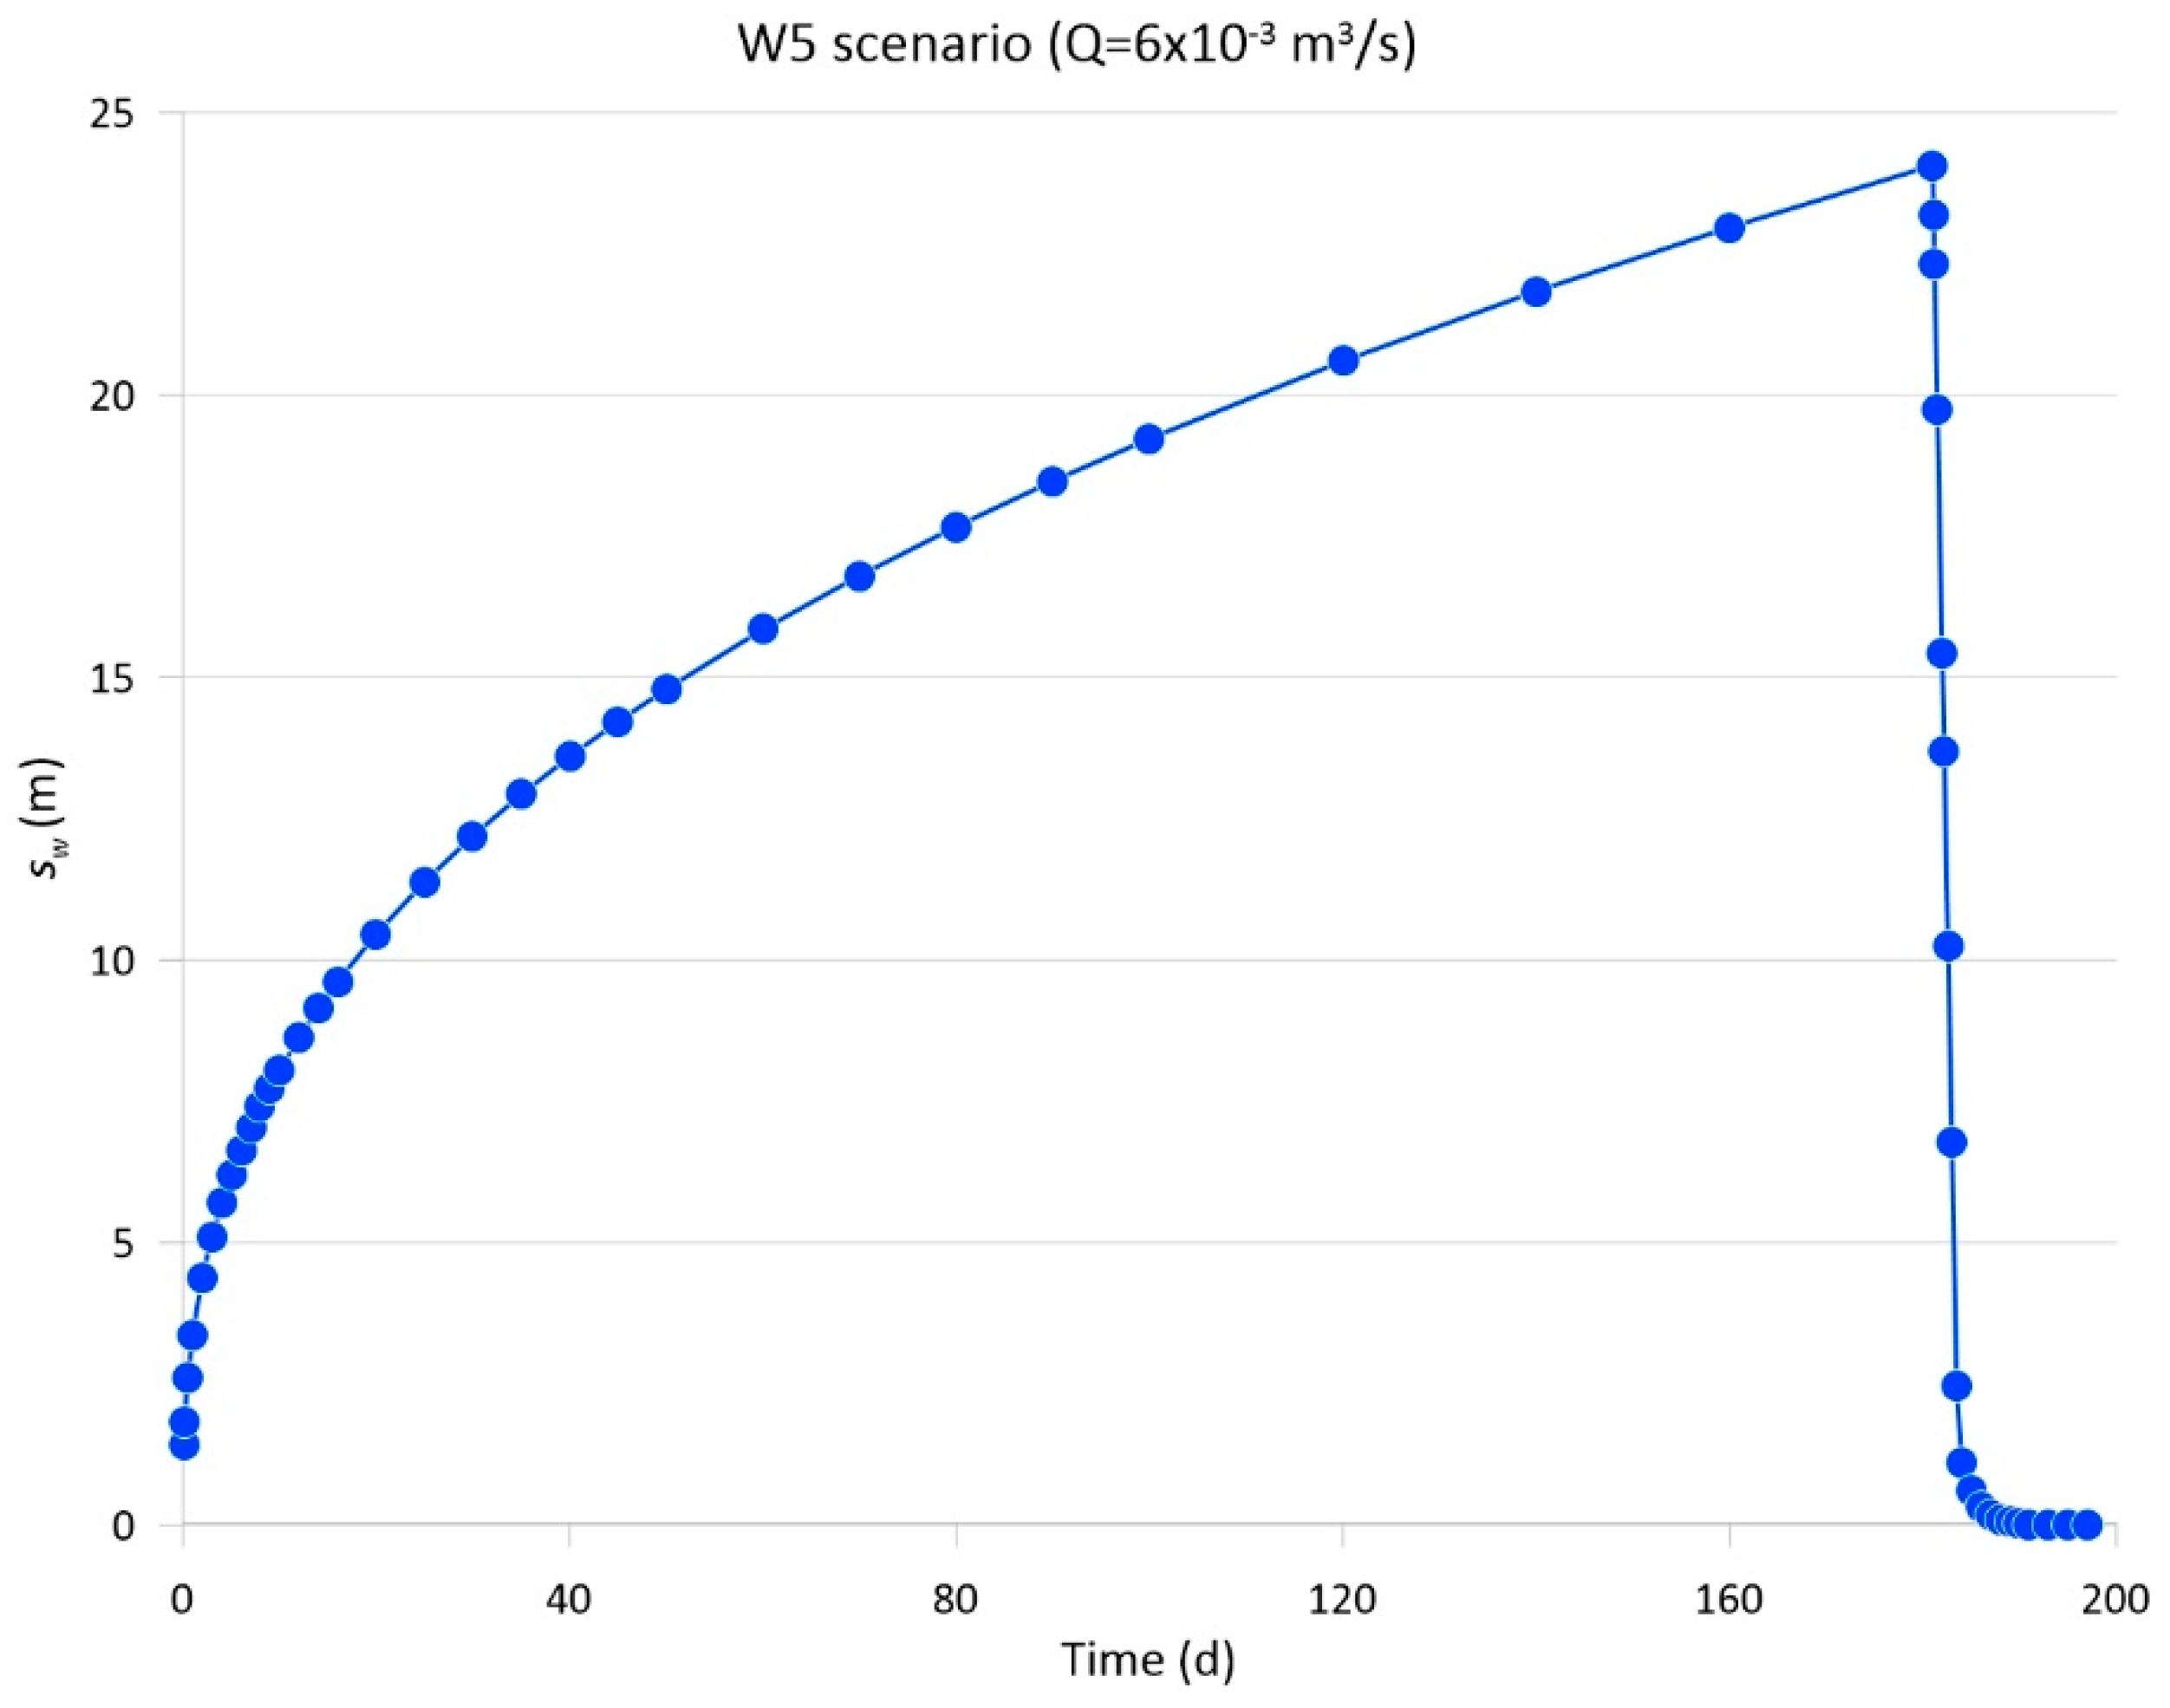
As an example, the drawdown in well W5 at a constant flow rate of 6 L/s has been simulated by applying Equation (4) to reach the sustainable drawdown of 24 m (Figure 12). Applying the specific Equations (5) and (6) obtained from the measured recovery data (Figure 11b), the shape and time of the recovery after pumping has also been extrapolated (Figure 12).
For the examined worst cases, showing a transient response of the drawdown during time, the possible pumping configurations in terms of flow rate and times are function of both the trend of the drawdown in time and of the prescribed limit of drawdown in the well (which avoid the emptying). The transient response of the well and the aquifer to pumping is due to both the low yield in groundwater of the aquifer (estimated average recharge of 56 mm) and to the presence of no-flow boundary (granitoid dikes). In these cases, it is clear that much of the groundwater extracted from the well derives from the storage of the aquifer.

6. Conclusions

In very heterogeneous aquifers, characterized by reduced recharge and low hydraulic diffusivity, such as the examined fractured aquifers, the definition of the operational flow rate of wells should be based on methods of easy application but at the same time on sufficient observed data. This is necessary in order to not significantly affect the project cost of wells that cannot provide high operating flow rates (not more than a few litres per second) but are still crucial in order to supply water for small communities. These conditions are even more binding when the drawdown in the aquifer and in the well responds to pumping according to an unsteady-state regime. In the latter case, the flow rate and pumping time of the well mainly depend on the storage capacity of the aquifer, as demonstrated by the analysed cases.
Consequently, to define the operational pumping flow of a well in this hydrogeological environment, the study shows that it is preferable to provide pumping tests at a constant flow rate of significant duration instead of the relatively short step-drawdown tests, usually adopted to evaluate the operative flow. In fact, in these heterogeneous aquifers characterized by low hydraulic diffusivity (ranging in the orders of magnitude 10−1–100 m2/s), a test lasting not less than two days is necessary to extrapolate a reasonable prediction of the long-term drawdown behaviour in the pumping well. The late drawdown–time curve and residual drawdown segment-curves during the recovery, also approximated by power, exponential or polynomial equations, represent the first step to deduce the long-term drawdown in the well. This prediction combined with the definition of a drawdown limit in the well (function of the saturated thickness of the aquifer intercepted by the well) is essential to plan the first operation of the well (flow rate and time of pumping). Subsequently, through the monitoring acquired during the initial operation of the well, the following mode and flow of operation can be updated and improved.

Author Contributions

Conceptualization, V.P. and C.S.; methodology, V.P., C.S., T.D.D. and F.L.; validation, V.P. and F.L.; formal analysis, V.P., C.S. and T.D.D.; data curation, C.S., T.D.D. and F.L.; writing—original draft preparation, V.P., C.S. and F.L.; writing—review and editing, V.P. and C.S.; visualization, C.S. and T.D.D.; supervision, V.P.; funding acquisition, V.P. All authors have read and agreed to the published version of the manuscript.

Funding

This research was supported by the Agritech National Research Center and received funding from the European Union Next-Generation EU (PIANO NAZIONALE DI RIPRESA E RESILIENZA (PNRR)—MISSIONE 4 COMPONENTE 2, INVESTIMENTO 1.4—D.D. 1032 17 June 2022, CN00000022). This manuscript reflects only the authors’ views and opinions, neither the European Union nor the European Commission can be considered responsible for them.

Data Availability Statement

The data presented in this study are available upon request from the corresponding author. The data are not publicly available due to privacy reasons.

Acknowledgments

The Authors would like to thank Sandra D’Avenio for her support in English revision. This work is dedicated to the memory of Fulvio Formica, recently deceased, with which V.P. shared the academic period and first experiences in pumping tests. The authors would also like to thank the editor and the reviewers for their comments which improved the quality of the manuscript.

Conflicts of Interest

The authors declare no conflict of interest. The funders had no role in the design of the study; in the collection, analyses, or interpretation of data; in the writing of the manuscript; or in the decision to publish the results.

References

  1. Alley, W.M.; Reilly, T.E.; Franke, O.L. Sustainability of Ground-Water Resources; U.S. Department of the Interior, U.S. Geological Survey: Reston, VA, USA, 1999; Volume 1186, pp. 1–79.
  2. Elshall, A.S.; Arik, A.D.; El-Kadi, A.I.; Pierce, S.; Ye, M.; Burnett, K.M.; Wada, C.A.; Bremer, L.L.; Chun, G. Groundwater sustainability: A review of the interactions between science and policy. Environ. Res. Lett. 2020, 15, 093004. [Google Scholar] [CrossRef]
  3. Misstear, B.D.R.; Beeson, S. Using operational data to estimate the reliable yields of water-supply wells. Hydrogeol. J. 2000, 8, 177–187. [Google Scholar] [CrossRef]
  4. Van Tonder, G.J.; Botha, J.F.; Chiang, W.H.; Kunstmann, H.; Xu, Y. Estimation of the sustainable yields of boreholes in fractured rock formation. J. Hydrol. 2001, 241, 70–90. [Google Scholar] [CrossRef]
  5. Beeson, S.; Misstear, B.D.R.; van Wonderen, J.J. Assessing the reliable outputs of groundwater sources. J. Inst. Water Environ. Manag. 1997, 11, 295–304. [Google Scholar] [CrossRef]
  6. Hammond, P.A. Reliable yields of public water-supply wells in the fractured-rock aquifers of central Maryland, USA. Hydrogeol. J. 2018, 26, 333–349. [Google Scholar] [CrossRef] [Green Version]
  7. Piscopo, V.; Summa, G. Experiment of pumping at constant-head: An alternative possibility to the sustainable yield of a well. Hydrogeol. J. 2007, 15, 679–687. [Google Scholar] [CrossRef]
  8. Baiocchi, A.; Lotti, F.; Simone, M.; Piacentini, S.M.; Piscopo, V. Comparison of pumping at constant head and at a constant rate for determining the sustainable yield of a well. Environ. Earth Sci. 2014, 72, 989–996. [Google Scholar] [CrossRef]
  9. World Bank Water Data. Available online: https://wbwaterdata.org/dataset (accessed on 7 June 2023).
  10. Altunkaynak, Ş.; Yilmaz, Y. The Mount Kozak magmatic complex, Western Anatolia. J. Volcanol. Geotherm. Res. 2018, 85, 211–231. [Google Scholar] [CrossRef]
  11. Yilmaz, Y. An approach to the origin of young volcanic rocks of western Turkey. In Tectonic Evolution of the Tethyan; NATO ASI Series; Springer: Dordrecht, The Netherlands, 1989; Volume 259, pp. 159–189. [Google Scholar] [CrossRef]
  12. Yilmaz, Y.; Karacik, Z. Geology of the northern side of the Gulf of Edremit and its tectonic development of the Aegean grabens. Geodin. Acta 2001, 14, 31–43. [Google Scholar] [CrossRef]
  13. Ersoy, E.Y.; Çemen, I.; Helvaci, C.; Billor, Z. Tectono-stratigraphy of the Neogene basins in Western Turkey: Implications for tectonic evolution of the Aegean Extended Region. Tectonophysics 2014, 635, 33–58. [Google Scholar] [CrossRef]
  14. UNESCO. International Hydrogeological Map of Europe—E6 Ankara; Federal Institute for Geosciences and Natural Resources: Hannover, Germany, 1978.
  15. Baiocchi, A.; Lotti, F.; Piscopo, V.; Sammassimo, V. Hard-rock aquifer response to pumping and sustainable yield of wells in some areas of Mediterranean Region. Groundwater in Fractured Bedrock Environments. Spec. Publ. Geol. Soc. Lond. 2019, 479, 147–160. [Google Scholar] [CrossRef]
  16. Escobar, F.H.; Navarrete, J.M.; Losada, H.D. Evaluation of pressure derivative algorithms for well-test analysis. In Proceedings of the SPE International Thermal Operations and Heavy Oil Symposium and Western Regional Meeting, Bakersfield, CA, USA, 16–18 March 2004. [Google Scholar] [CrossRef]
  17. Ehlig-Economides, C.; Hegeman, P.; Clark, G. Three key elements necessary for successful testing. Oil Gas J. 1994, 92, 30. [Google Scholar]
  18. Bourdet, D. Well Test Analysis, 1st ed.; Elsevier Science: Amsterdam, The Netherlands, 2002; p. 426. [Google Scholar]
  19. Renard, P.; Glenz, D.; Mejias, M. Understanding diagnostic plots for well-test interpretation. Hydrogeol. J. 2009, 17, 589–600. [Google Scholar] [CrossRef] [Green Version]
  20. Ferroud, A.; Rafini, S.; Chesnaux, R. Using flow dimension sequences to interpret non-uniform aquifers with constant-rate pumping-tests: A review. J. Hydrol. X 2019, 2, 100003. [Google Scholar] [CrossRef]
  21. Waterloo Hydrogeologic, Inc. User Manual, Aquifer Test Pro 10.0. Pumping & Slug Test Analysis, Interpretation & Visualization Software; Waterloo Hydrogeologic: Kitchner, ON, Canada, 2020; pp. 1–518. [Google Scholar]
  22. Kruseman, G.P.; de Ridder, N.A. Analysis and Evaluation of Pumping Test Data, 2nd ed.; ILRI Publication; International Institute for Land Reclamation and Improvement: Wageningen, The Netherlands, 1994; pp. 1–372. [Google Scholar]
  23. Dashti, Z.; Nakhaei, M.; Vadiati, M.; Karami, G.H.; Kisi, O. A literature review on pumping test analysis (2000–2022). Environ. Sci. Pollut. Res. 2023, 30, 9184–9206. [Google Scholar] [CrossRef]
  24. Hemker, K.; Post, V. MLU for Windows 2.25 User’s Guide; Microfem: Amsterdam, The Netherlands, 2010. [Google Scholar]
  25. Hemker, K.; Randall, J. Modeling with MLU Applying the Multilayer Approach to Aquifer Test Analysis. Tutorial; Microfem: Amsterdam, The Netherlands, 2013. [Google Scholar]
  26. Turc, L. Le bilan d’eau des sols: Relations entre les precipitations, l’evaporation et l’ecoulement. Ann. Agron. 1955, 5, 491–595. [Google Scholar]
  27. Cooper, H.H.; Jacob, C.E. A generalized graphical method for evaluating formation constants and summarizing well field history. Am. Geophys. Union Trans. 1946, 27, 526–534. [Google Scholar] [CrossRef]
  28. Theis, C.V. The source of water derived from wells. Civ. Eng. 1940, 10, 277–280. [Google Scholar]
  29. Moench, A.F. Double-porosity models for a fissured groundwater reservoir with fracture skin. Water Resour. Res. 1984, 20, 831–846. [Google Scholar] [CrossRef]
  30. Hantush, M.S. Modification of the theory of leaky aquifers. J. Geophys. Res. 1960, 65, 3713–3725. [Google Scholar] [CrossRef]
  31. Barenblatt, G.I.; Zheltov, I.P.; Kochina, I.N. Basic concepts in the theory of seepage of homogeneous liquids in fissured rocks [strata]. J. Appl. Math. Mech. 1960, 24, 1286–1303. [Google Scholar] [CrossRef]
  32. Warren, J.E.; Root, P.J. The behavior of naturally fractured reservoirs. Soc. Pet. Eng. J. 1963, 3, 245–255. [Google Scholar] [CrossRef] [Green Version]
  33. Maréchal, J.C.; Dewandel, B.; Subrahmanyam, K. Use of hydraulic tests at different scales to characterize fracture network properties in the weathered fractured layer of a hard rock aquifer. Water Resour. Res. 2004, 40, W11508. [Google Scholar] [CrossRef] [Green Version]
  34. Dewandel, B.; Lachassagne, P.; Zaidi, F.K.; Chandra, S. A conceptual hydrodynamic model of a geological discontinuity in hard rock aquifers: Example of a quartz reef in granitic terrain in South India. J. Hydrol. 2011, 405, 474–487. [Google Scholar] [CrossRef] [Green Version]
  35. Boonstra, J.; Boehmer, W.K. Analysis of data from aquifer and well tests in intrusive dikes. J. Hydrol. 1986, 88, 301–317. [Google Scholar] [CrossRef]
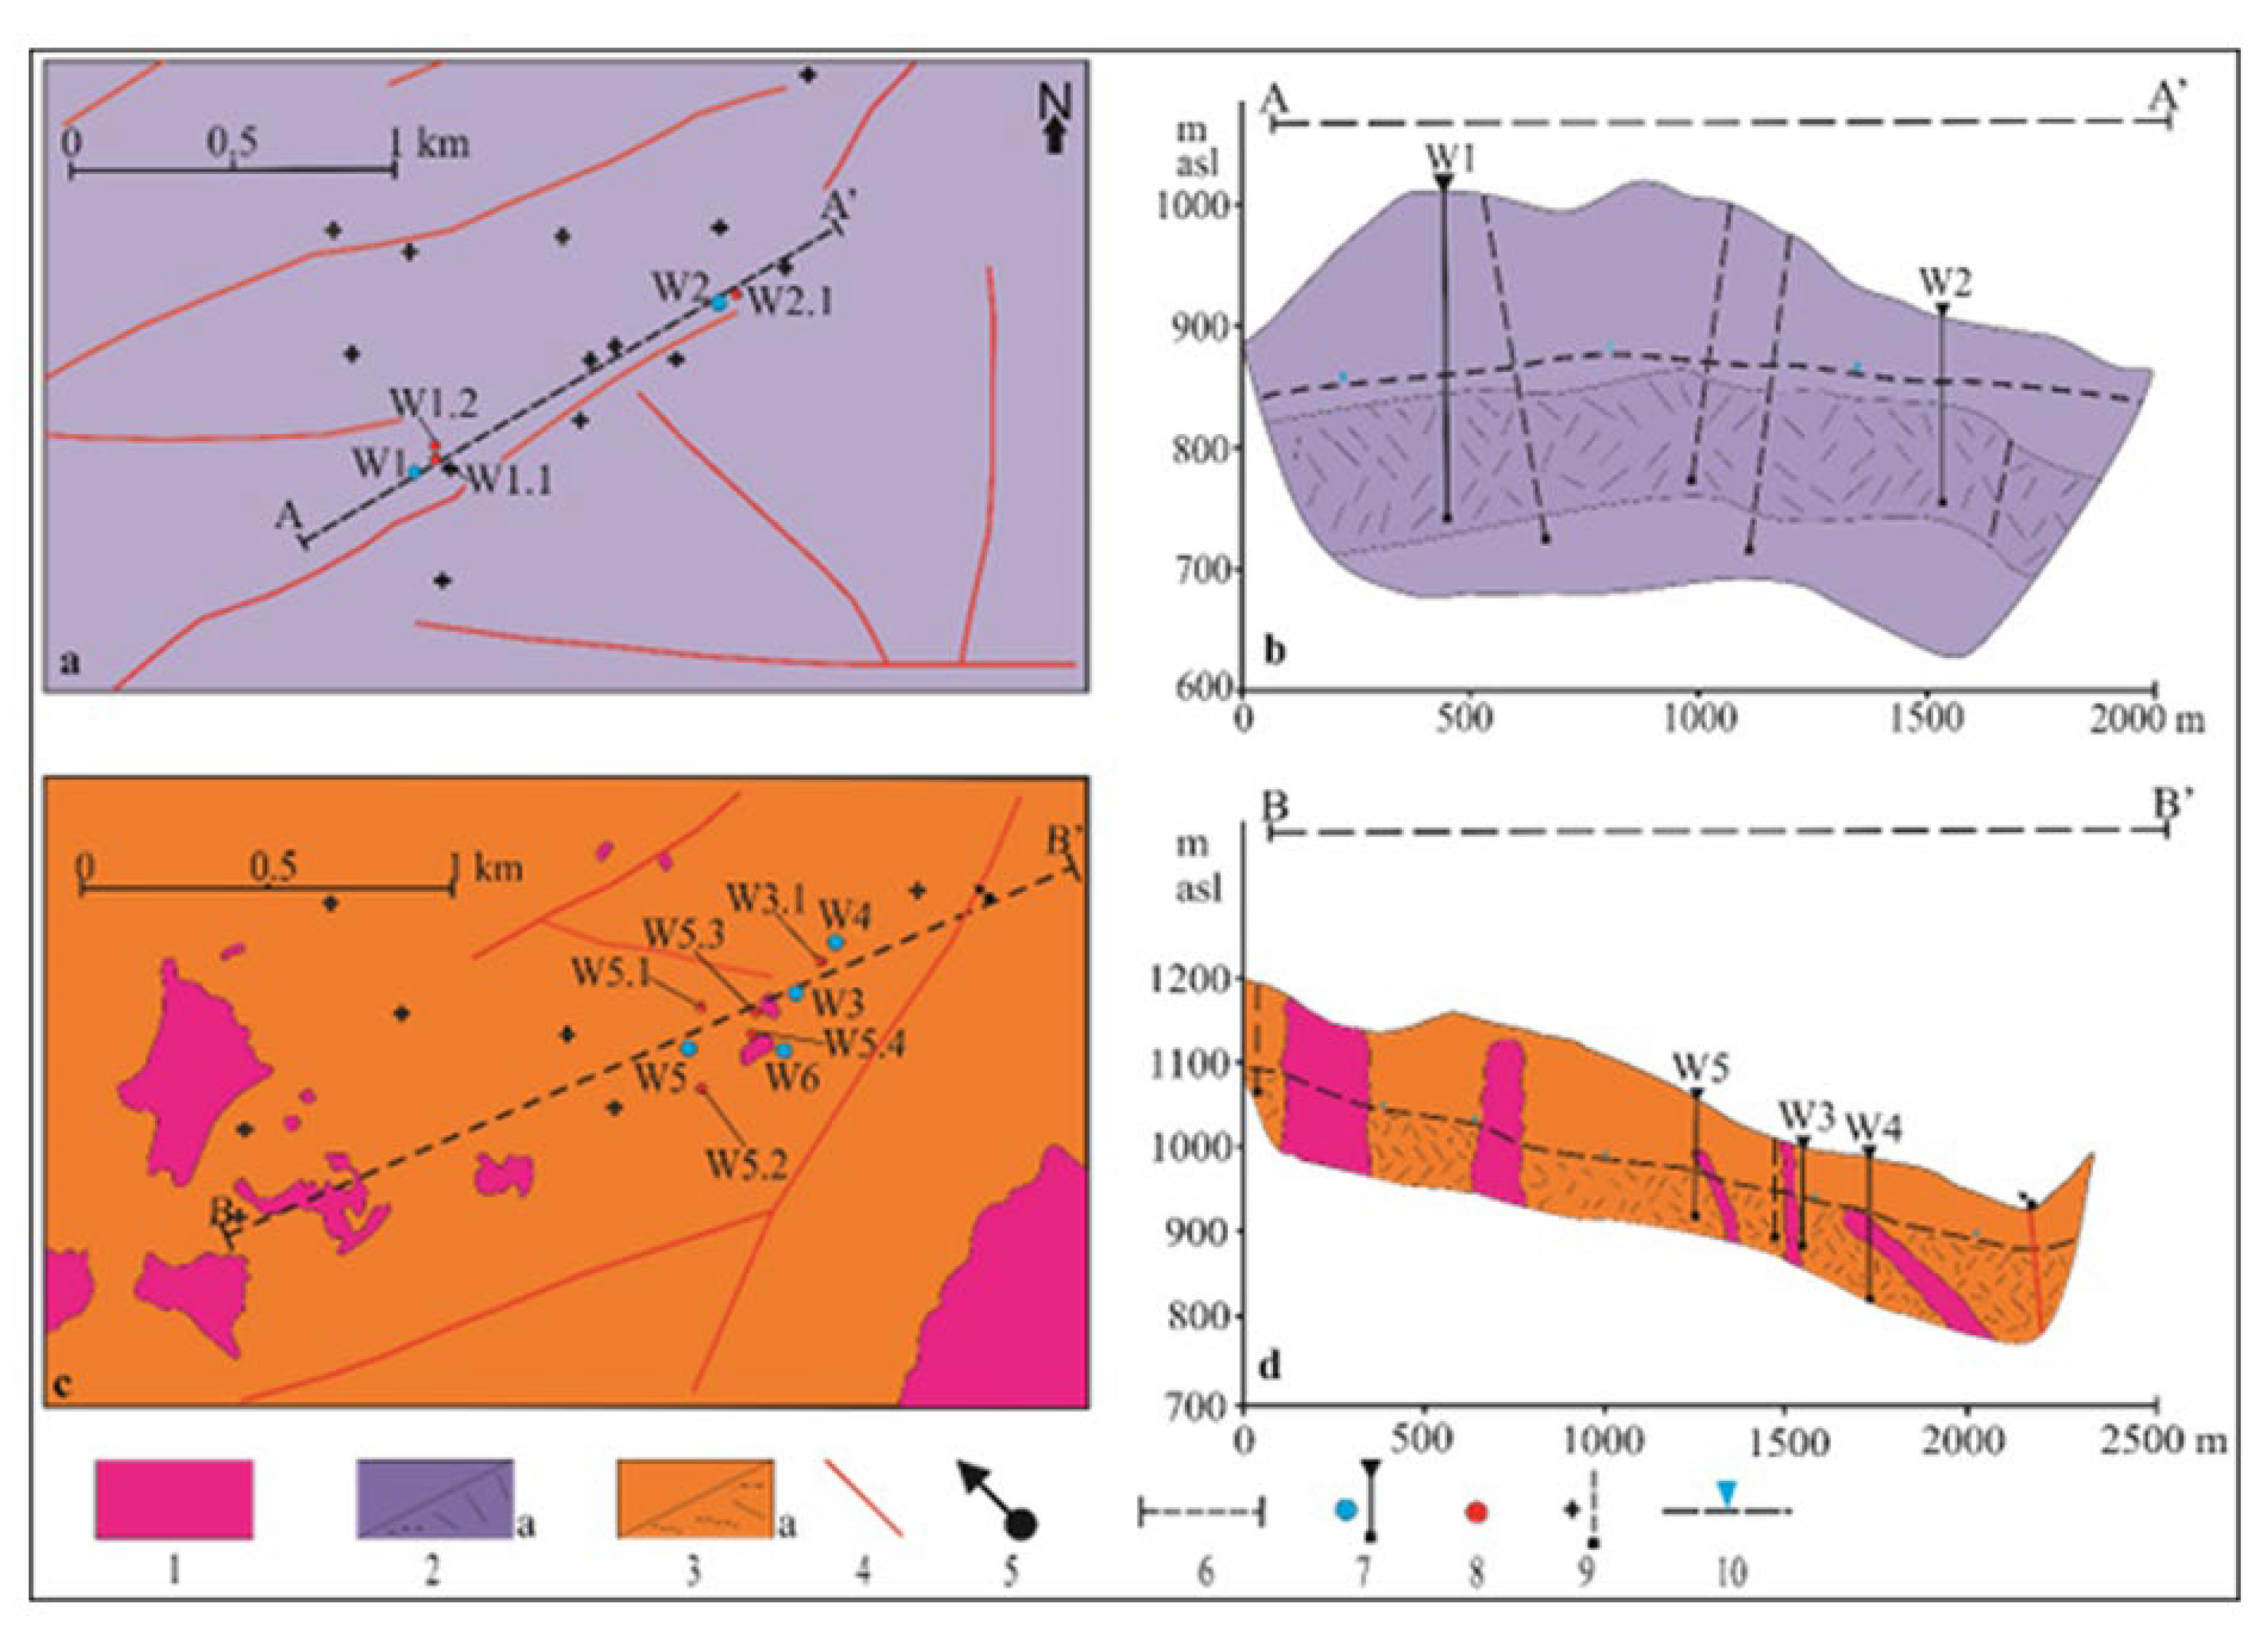
Figure 1. Geological map and cross-section of the two test sites: (a,b) test site in andesitic rocks and (c,d) test site in metamorphic rocks. Legend: (1) granitoids (Early Miocene); (2) andesite (Lower-Middle Miocene), (2a) aquifer formation; (3) metamorphic rocks (Trias), (3a) aquifer formation; (4) fault and fracture; (5) spring; (6) cross-section trace; (7) well of pumping tests; (8) observation well; (9) borehole; and (10) groundwater level.
Sustainability 15 10706 g001
Figure 2. W1 test: (a) semi-log plot of drawdown–time in pumping well (W1) and observation wells (W1.1 and W1.2); (b) bi-log plot of drawdown, derivative and smoothed derivative in pumping well (W1); (c) bi-log plot of drawdown, derivative and smoothed derivative in W1.1 observation well; and (d) bi-log plot of drawdown, derivative and smoothed derivative in W1.2 observation well.
Sustainability 15 10706 g002aSustainability 15 10706 g002b
Figure 3. W2 test: (a) semi-log plot of drawdown–time in pumping well (W2) and observation well (W2.1); (b) bi-log plot of drawdown, derivative and smoothed derivative in pumping well (W2); and (c) bi-log plot of drawdown, derivative and smoothed derivative in observation well (W2.1).
Sustainability 15 10706 g003aSustainability 15 10706 g003b
Figure 4. W3 test: (a) semi-log plot of drawdown–time in pumping well (W3) and observation well (W3.1); (b) bi-log plot of drawdown, derivative and smoothed derivative in pumping well (W3); and (c) bi-log plot of drawdown, derivative and smoothed derivative in observation well (W3.1).
Sustainability 15 10706 g004aSustainability 15 10706 g004b
Figure 5. W4 test: (a) semi-log plot of drawdown–time in pumping well (W4) and observation well (W3.1); (b) bi-log plot of drawdown, derivative and smoothed derivative in pumping well (W4); and (c) bi-log plot of drawdown, derivative and smoothed derivative in observation well (W3.1).
Sustainability 15 10706 g005aSustainability 15 10706 g005b
Figure 6. Location of W5 and W6 tests: (a) potentiometric map before testing and (b) drawdown at the end of pumping tests. Legend: (1) metamorphic rocks, (2) granitoids, (3) pumped well, (4) observation well, (5) potentiometric contour lines (m asl), (6) drawdown contour lines (m) at the end of the W5 pumping test, and (7) drawdown (m) at the end of the W6 pumping test.
Sustainability 15 10706 g006
Figure 7. W5 test: (a) semi-log plot of drawdown–time in pumping well (W5) and observation wells (W5.1 and W5.2); (b) bi-log plot of drawdown, derivative and smoothed derivative in pumping well (W5); and (c) bi-log plot of drawdown, derivative and smoothed derivative in observation well (W5.1).
Sustainability 15 10706 g007
Figure 8. W6 test: (a) semi-log plot of drawdown–time in pumping well (W6) and observation well (W5.4); (b) bi-log plot of drawdown, derivative and smoothed derivative in pumping well (W6); and (c) bi-log plot of drawdown, derivative and smoothed derivative in observation well (W5.4).
Sustainability 15 10706 g008aSustainability 15 10706 g008b
Figure 9. Late time drawdown curves of well W1 (Q = 3.6 L/s) and those obtained for different flow rates by using Equation (2).
Sustainability 15 10706 g009
Figure 10. Late time drawdown curves of well W5 (Q = 11.5 L/s) and those obtained for different flow rates by using Equation (4).
Sustainability 15 10706 g010
Figure 11. Recovery test of well W5: (a) residual drawdown–time curves obtained by using measured data ( s w measured), simulated by MLU ( s w simulated) and calculated by Equations (5) and (6) ( s w interpolated) and (b) detail of the two identified trends on the recovery curve calculated by Equations (5) and (6).
Sustainability 15 10706 g011
Figure 12. Representation of a possible drawdown–time scenario for pumping and recovery phases simulated for W5 by using Equations (4)–(6).
Sustainability 15 10706 g012
Table 1. Results of interpretation of pumping tests.
WellAquiferDepth
(m)
Hs
(m)
b
(m)
Q
(L/s)
OWr
(m)
Time
(min)
smax
(m)
T
(m2/s)
S
(-)
Tr
(m2/s)
Qs
(m2/s)
Interpretative Model
W1AND267121903.6W1 0.1669122.183.5 × 10−3--2.7 × 10⁻³No-flow boundary
3.6W1.110769120.334.6 × 10−37.2 × 10⁻³-
3.6W1.29169120.327.8 × 10−37.9 × 10⁻³-
W2AND14994903.9W2 0.1667034.208.2 × 10−5-4.0 × 10−51.1 × 10−4Constant-head boundary
3.9W2.1186700.965.6 × 10−48.0 × 10⁻⁴-
W3MET12142607.0W3 0.15144016.291.4 × 10−4-1.1 × 10−44.3 × 10−4Constant-head boundary
7.0W3.110414400.315.3 × 10−36.0 × 10⁻³- No-flow boundary
W4MET167946015.0W40.1514411.076.0 × 10−3--1.6 × 10⁻²No-flow boundary
15.0W3.16014410.338.8 × 10−36.8 × 10⁻²-
W5MET140586011.5W5 0.1530008.174.1 × 10−4-4.8 × 10−42.0 × 10−3Linear flow
11.5W5.111030000.271.3 × 10−33.2 × 10⁻²- No-flow boundary
11.5W5.211630005.054.7 × 10−41.2 × 10⁻³-
W6MET9583608.7W6 0.15289544.813.5 × 10−4-4.2 × 10−42.0 × 10−4Radial flow
8.7W5.410528801.365.4 × 10−35.6 × 10⁻³- No-flow boundary
AND—andesite rocks, MET—metamorphic rocks, Hs—screened horizon, b—aquifer thickness, Q—flow rate, OW—observation well, r—distance of OW from pumping well, Time—pumping time, smax—drawdown at the end of the test, T—transmissivity, S—storativity, Tr—transmissivity from recovery test, Qs—specific capacity at 1000 min.
Table 2. Sustainable yield of the well W1 and time of continuous pumping for a maximum drawdown of 36 m.
Q (L/s)Time of Pumping (d)
3.629
2.034
1.040
0.546
Table 3. Sustainable yield of the well W5 and time of continuous pumping for a maximum drawdown of 24 m.
Q (L/s)Time of Pumping (d)
11.532
8.084
6.0181
4.0529
Disclaimer/Publisher’s Note: The statements, opinions and data contained in all publications are solely those of the individual author(s) and contributor(s) and not of MDPI and/or the editor(s). MDPI and/or the editor(s) disclaim responsibility for any injury to people or property resulting from any ideas, methods, instructions or products referred to in the content.