Article

Development of a Municipal Solid Waste Management Life Cycle Assessment Tool for Banepa Municipality, Nepal

by
Prasesh Pote Shrestha
1,
Anish Ghimire
1,*,
Mohan B. Dangi
2 and
Michael A. Urynowicz
3
1
Resource Recovery Research Group (Re3G), Department of Environment Science and Engineering, Kathmandu University, Dhulikhel 45200, Nepal
2
Department of Geography and City & Regional Planning, California State University, Fresno, CA 93740, USA
3
Department of Civil & Architectural Engineering, University of Wyoming, Laramie, WY 82071, USA
*
Author to whom correspondence should be addressed.
Sustainability 2023, 15(13), 9954; https://doi.org/10.3390/su15139954
Submission received: 6 April 2023 / Revised: 18 June 2023 / Accepted: 19 June 2023 / Published: 22 June 2023
(This article belongs to the Special Issue Life Cycle Assessment as an Environmental Sustainability Tool)

Abstract

:
In this study, the life cycle assessment (LCA) method has been used to evaluate the environmental impacts of various municipal solid waste (MSW) management system scenarios in Banepa municipality, Nepal, in terms of global warming potential (GWP), acidification potential (AP), eutrophication potential (EP), human toxicity potential (HTP), abiotic depletion potential (ADP), and photochemical ozone creation potential (POCP). There are at least six possible scenarios of MSW management in Banepa: the current or baseline scenario (Scenario 1); composting with landfilling (Scenario 2); material recovery facility (MRF) recycling, composting, and landfilling (Scenario 3); MRF and anaerobic digestion (AD); composting, and landfilling (Scenario 4); MRF, composting, AD, and landfilling (Scenario 5); and, finally, incineration with landfilling (Scenario 6). Using both information from Ecoinvent 3.6 (2019) and published research articles, a spreadsheet tool based on the LCA approach was created. The impact of the recycling rate on each of the six abovementioned scenarios was evaluated using sensitivity analysis, which showed that the recycling rate can considerably decrease the life-cycle emissions from the MSW management system. Scenario 3 was found to have the least overall environmental impact with a GWP of 974.82 kg CO2 eq. per metric ton (t), EP of 0.04 kg PO4 eq./t, AP of 0.15 kg SO2 eq./t, HTP of 4.55 kg 1,4 DB eq./t, ADP of −0.03 kg Sb eq./t, and POCP of 0.06 kg C2H4 eq./t. By adoption of MRF and biological treatments such as composting and AD, environmental impact categories such as AP, EP, HTP, ADP, POCP, and GWP can be significantly reduced. The findings of this study can potentially serve as a reference for cities in the developing world in order to aid in both the planning and the operation of environmentally friendly MSW management systems.

1. Introduction

Municipal solid waste (MSW) management is one of the primary environmental challenges for developing countries. Urban growth has increased the generation of waste from residential sites as well as private and public service facilities. Despite related environmental, social, and economic problems, MSW can be used as a valuable resource that can offset future energy demands if managed via waste-to-energy pathways [1]. The organic fraction of MSW (OFMSW) can be turned into useful resources, such as fertilizers (compost and digestate) and biomethane, which can aid in achieving a circular economy [2]. However, MSW can also cause environmental deterioration and global warming as a result of the emission of anthropogenic greenhouse gases (GHGs), such as methane (CH4), carbon dioxide (CO2), and nitrous oxide (N2O). CH4 from solid waste disposal sites (SWDS), primarily from industrialized nations, is estimated to be between 20 and 40 million tonnes globally, which is around 5–20% of the world’s total anthropogenic CH4 emissions [3], and annual emissions of all anthropogenic GHG is between 1 to 4% of the world’s total [4]. MSW management systems are complex and difficult to analyze, monitor, and measure [5]. Thus, to establish an appropriate MSW management system that minimizes the negative effects on human health and the environment, MSW management strategies require a standardized and well-described structure for evaluating environmental performance [6].
Life cycle assessment (LCA) can be used to quantify input, output, and environmental consequences over the life cycle of the project. It can be used to determine the environmental impacts of different MSW management systems, which can be useful in undertaking investment decisions for sustainable waste management infrastructures in emerging cities in low- and middle-income countries [7]. The integrated management approach, using a combination of recycling, composting, and anaerobic digestion (AD) as well as landfilling, had the lowest overall environmental impacts in terms of acidification potential (AP), eutrophication potential (EP), global warming potential (GWP), and human toxicity potential (HTP), according to an LCA conducted in Mumbai, India [7]. The incineration of MSW was shown to reduce GHG emissions but increase human toxicity potential. Another study conducted in Chandigarh, Mohali, and Panchkula, India, revealed that the open dumping of MSW had the most damaging environmental effects, while systems that included material recovery facilities (MRF), recycling, composting, and sanitary landfilling had the least damaging effects on the environment [8]. LCA was also used to analyze the effects of four different MSW management scenarios in the city of Nagpur in India. The scenarios were compared using the Gabi 8.5.0.79 database and the CML-1A impact characterization method [9]. In terms of GWP, HTP, EP, and Photochemical Ozone Creation Potential (POCP) categories, the MRF, composting, and landfilling scenarios had the least negative effects on the environment, while the composting and landfilling scenario had the most negative effects [9].
In Nepal, few studies have assessed the current and possible MSW management options from an LCA perspective [10,11,12]. A study considered three alternative scenarios during the LCA of the MSW management system in the city of Kathmandu [12]. Based on fuel energy consumption (FEC), GWP, EP, and AP, the three scenarios were compared in the study. Scenario 1 represented “business as usual” and consisted of collection, transportation, and landfilling; Scenario 2 included recycling; and Scenario 3 included conjunctive disposal consisting of composting and landfilling. Compared to the other scenarios, the study found Scenario 3 to have the least negative effects on the environment in terms of FEC, AP, EP, and GWP. Another LCA study assessed the environmental effects of Kathmandu’s waste management employing landfill gas (LFG) recovery for electricity production and the composting of organic waste, as well as scenarios for waste disposal without LFG recovery [11]. It was determined that recovering LFG from the landfill and using the gas to generate electricity was advantageous and least damaging to the environment. In another study in the Dhulikhel municipality (Nepal), the LCA tool was used to assess the potential environmental effects of four waste treatment scenarios [10], and those with biological treatment options were found to be the most environmentally advantageous. Although there is a lack of uniformity in the usage of LCA-based studies for evaluating the environmental effects of MSW management systems, existing decision support tools (DSTs), such as EASETECH, WRATE, MSW-DST, SWOLF [13], and others, that are geared for developed nations and cities in low- and middle-income may be helpful in the selection of potential MSW management scenarios in those nations, and this would include a country such as Nepal. As such, the goal of this study is to provide a spreadsheet-based decision support tool that can be customized depending on site-specific locations in order to assess the environmental effects of various MSW management methods in Banepa, Nepal, using a gate-to-grave approach (more information about the study location is included in Section 2 below). Six MSW management scenarios were evaluated and contrasted with Banepa’s current MSW management system, and, in addition, sensitivity analysis was conducted in order to ascertain the environmental implications of recycling rates.

2. Materials and Methods

2.1. Study Area and MSW Composition

Located 25 km east of Kathmandu, the Nepali capital, at an altitude of 1463 m above sea level, the Banepa municipality (27°38′ N 85°31′ E) is a small and ancient region (Figure 1). According to the recent 2021 census, it has a population of 67,690 people, and a population density of 1231 people per km2. It comprises 14 wards, and it is a vibrant business hub of Nepal. The composition of MSW in Banepa includes 68.1% organic waste, 11.19% plastics, 9.14% paper and paper products, 1.33% glass, 1.83% metals, 1.19% textiles, 0.32% rubber and leather, and 6.9% others [14]. For resource recovery from MSW, biological treatment methods, i.e., composting and AD, may be appropriate. In addition, inorganic waste, such as plastics, rubber, leather, and wood, which have a high calorific value, could be treated using options such as incineration. The scenarios based on the different MSW management system scenarios have been considered in the study, as described in the following subsections.

2.2. Life Cycle Assessment

From waste collection until its final disposal, including waste-to-energy, emissions can be released into the air, water, and land at any time during MSW management [14]. Both human health and the environment may be harmed by these pollutants. However, environmental impact assessment tools can be used during the decision-making process in order to help manage these hazards [15]. The LCA recommended by the International Organization for Standardization (ISO): ISO 14040:2006, ISO 14044:2006 is a comprehensive method for estimating the environmental impact of the products under consideration of various waste management scenarios [16], which aids in identifying “environmental hot spots” or variables in a system that have the greatest environmental influence, thereby helping to reduce negative environmental effects as well as increase the sustainability of the system. A generic LCA consists of four steps: (i.) goal and scope definition; (ii.) inventory analysis; (iii.) assessment of potential impacts; and (iv.) interpretation of the findings in relation to the study’s objectives [16,17].

2.3. Goal and Scopes of the Study

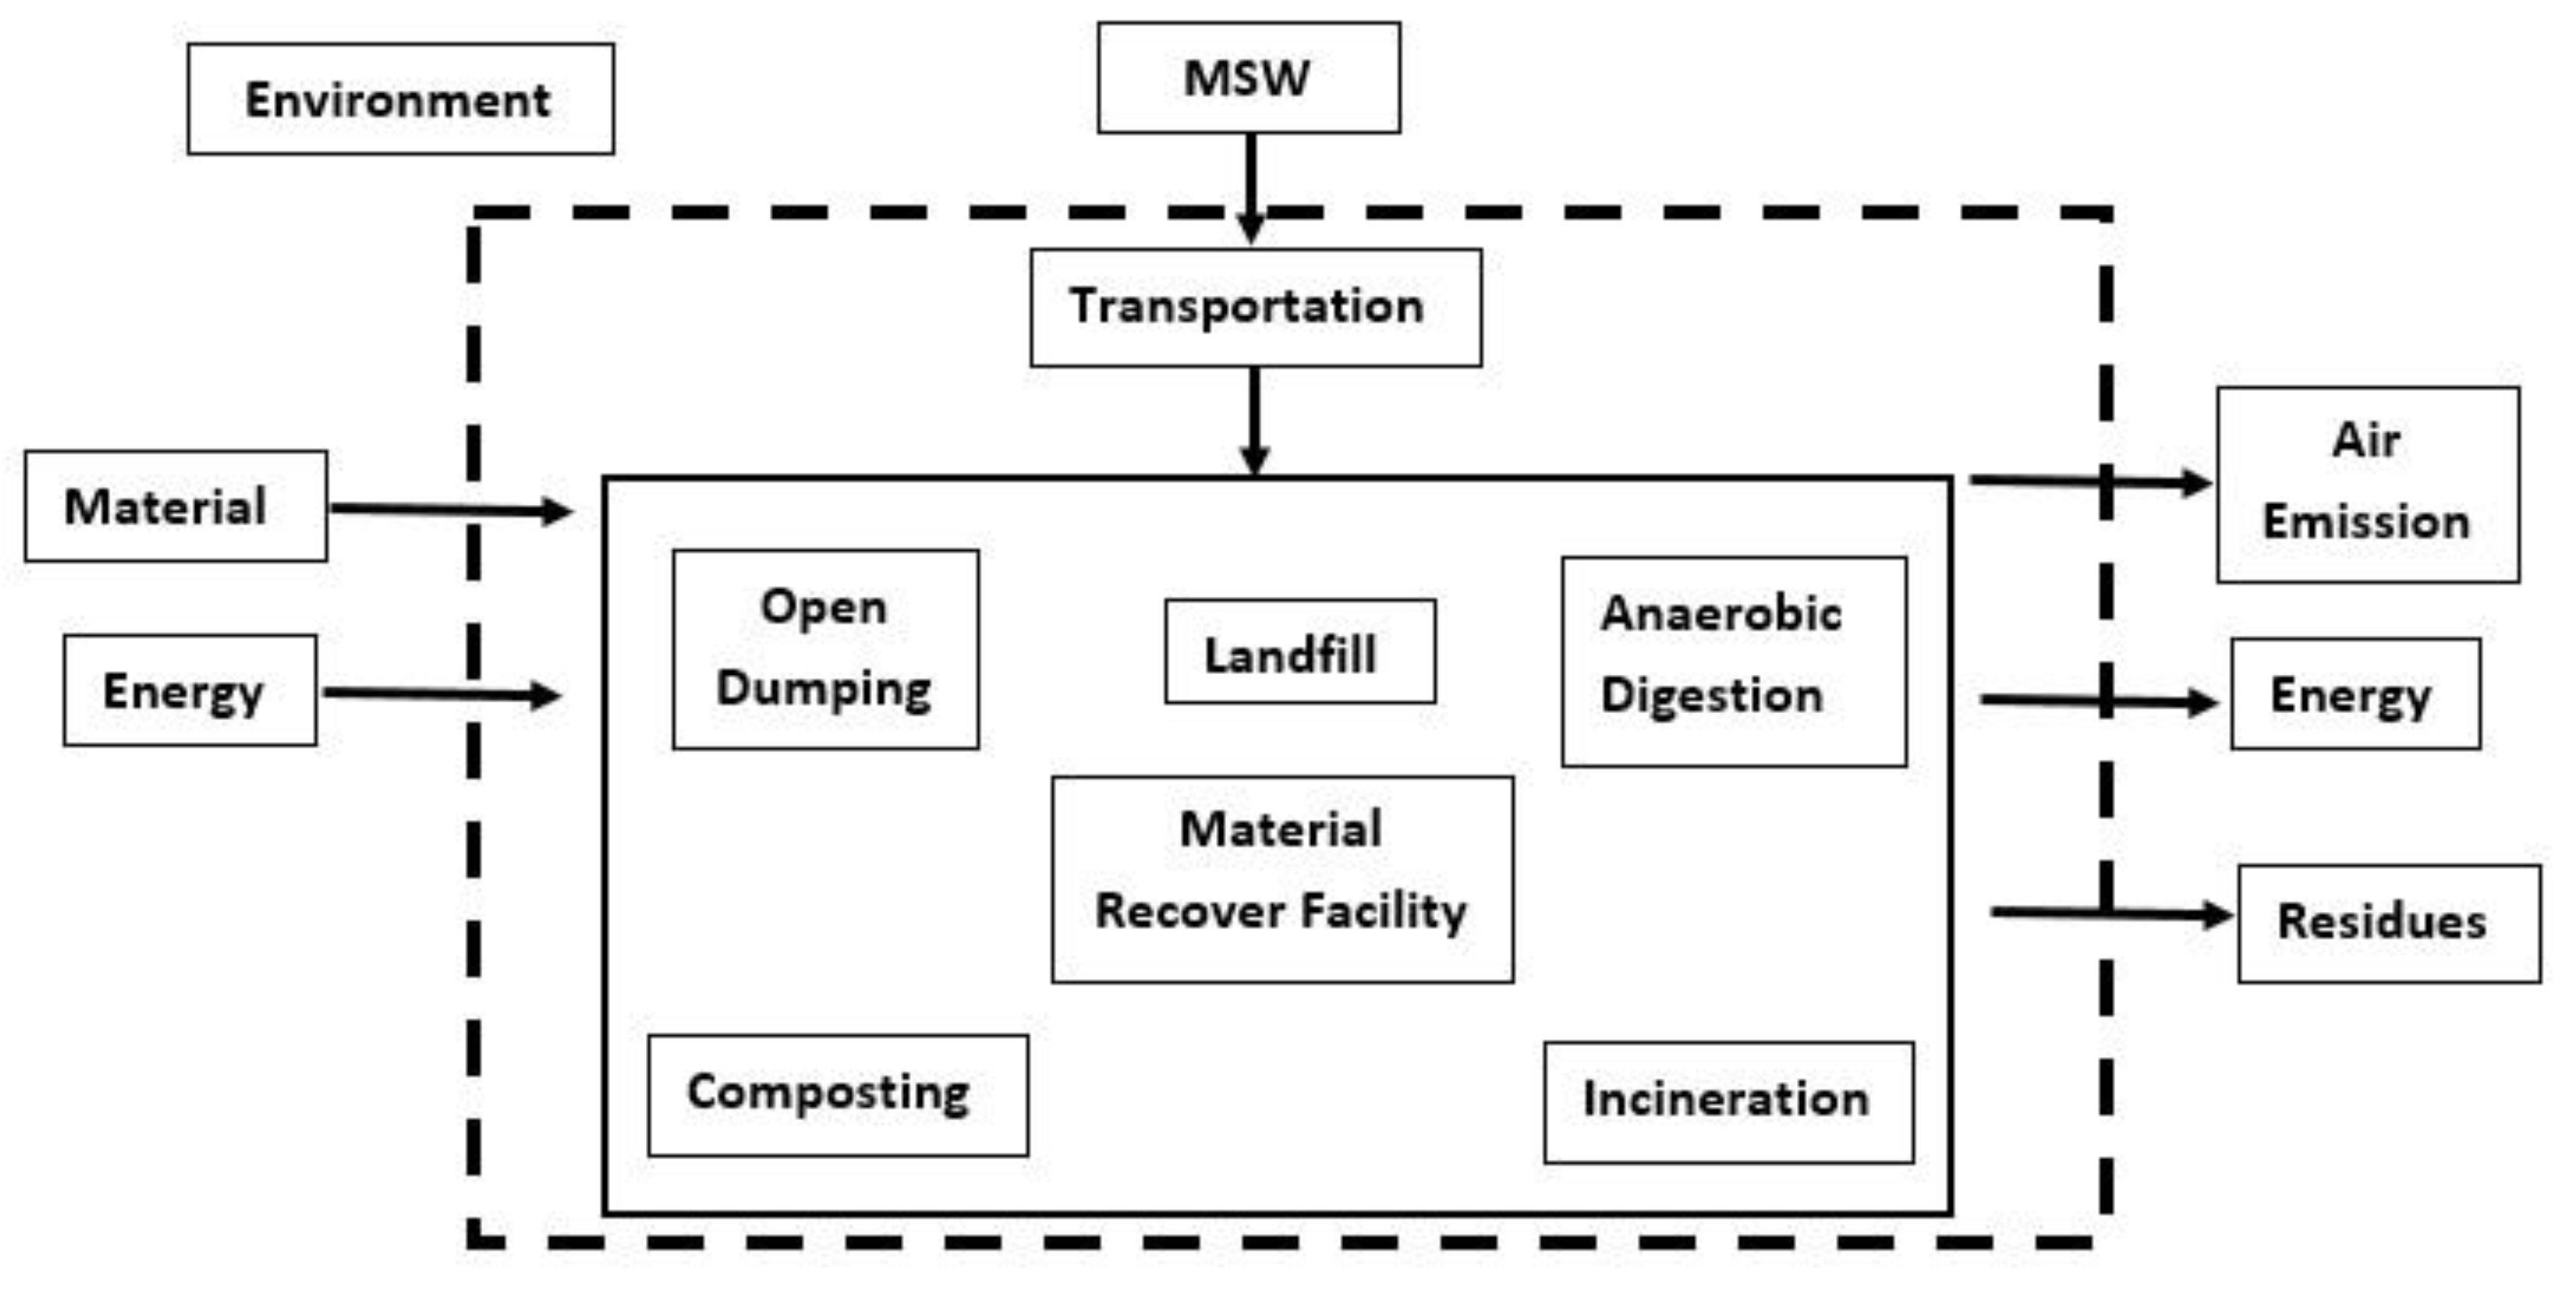
This study aimed to compare the possible environmental impacts of six MSW management scenarios, including the current or baseline conditions (i.e., Scenario 1) using LCA. The life cycle period or the scope considered was from gate-to-grave, which includes the transportation of waste to treatment facilities (open dumping, material recovery facility, composting, anaerobic digestion, and incineration) as well as the final disposal of the waste in landfills. System boundaries for the current study are shown in Figure 2 below. The mass and energy inputs and outputs from the MSW management procedures were considered within the system boundary in terms of emissions to the environment and the production of biogas, electricity, compost, and digestate. Leachate and emissions from land surfaces were not considered, and the MSW collection strategy for all scenarios within the study region was the same. The assessment of environmental impacts was performed based on inventory created in Microsoft Excel® adapted from a GHG accounting tool previously developed by [18] (provided as a supplementary file) with data from published research articles, reports, and Ecoinvent Database 3.6 (Recipe Midpoint (H) V 1.13 method), 2019, using cumulative life cycle impact assessment (LCIA) of the readily available dataset information of concerned impact categories. The proposed MSW management scenarios in Banepa were compared using the functional unit (FU) of 1 metric ton (t) of MSW.

2.4. MSW Management System Scenarios

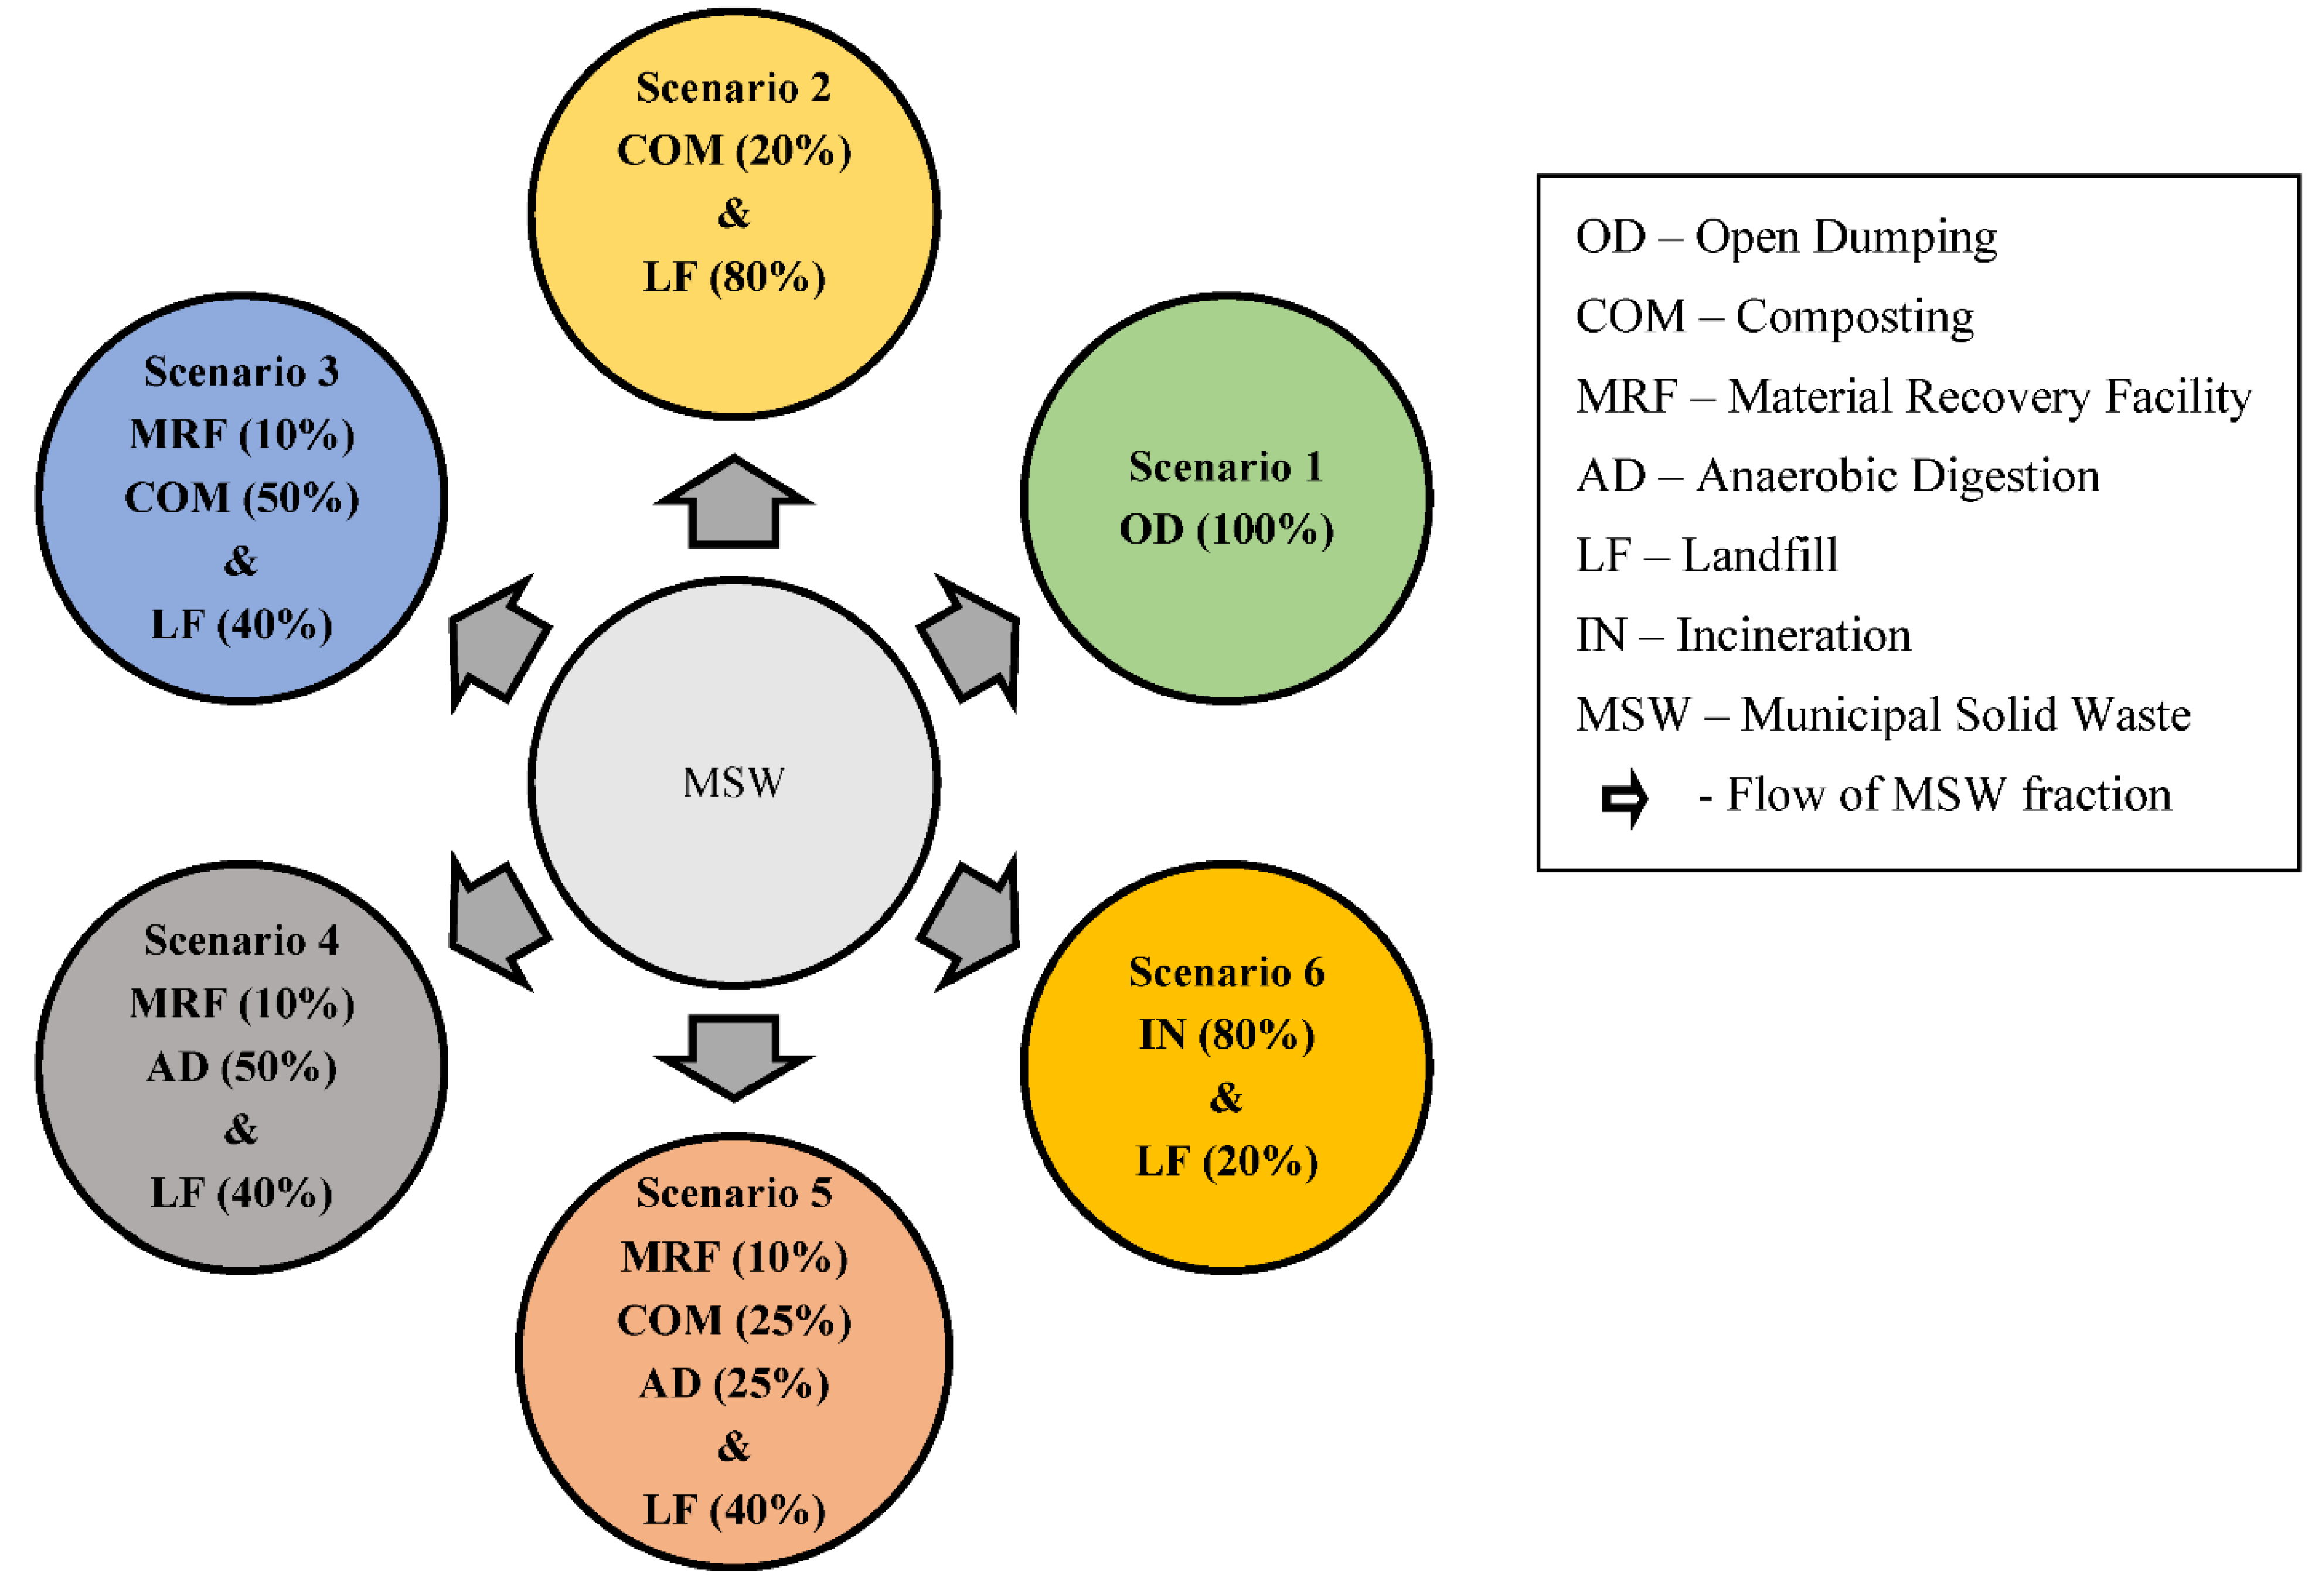
There are six scenarios, including the baseline scenario for the MSW management system practices in Banepa (Figure 3).

2.4.1. Scenario 1 (S1): Baseline or Current Scenario:

This scenario is consistent with the current SWM methods, which include collection, transportation, and open dumping at the recently closed Sisdol Landfill site, which is located about 46.3 km west of Banepa. Rainwater can come into contact with disposed waste, and the moisture created by the decomposition process results in leachate. The Sisdol Landfill site came into operation in 2005 with a design life of 2–3 years, and it currently has no provision for the collection, use, and treatment of LFG or for the treatment of leachate, which poses serious environmental impacts. Although the landfill site is currently closed and has been replaced by one called Banchare Danda Landfill, it has nonetheless been used as the baseline for this study.

2.4.2. Scenario 2 (S2): Composting Combined with Landfilling

A total of 20% is designated for composting, and the remaining 80% is dumped directly into the proposed landfill site at Banepa ward 14 (Chature) for all of the MSW produced in Banepa. The site considered for the composting plant is 6 km southwest of the city center of Banepa, and there is a plan to user it as a waste disposal site [19]. The compost produced will be used as a fertilizer in the agricultural fields of Banepa.

2.4.3. Scenario 3 (S3): Material Recovery Facility, Composting Combined with Landfilling

A recycling facility could support the recovery of recyclable materials, assist in the treatment of the biodegradable portion of MSW in a composting or AD plant, and support the disposal of the remaining portion at a landfill. Based on MSW composition and material flow analysis (MFA), as conducted in previous studies [15], the scenario assumes 10%, 50%, and 40% of the total MSW will be diverted to the MRF, composting, and landfilling, respectively, as treatment options. The by-products from the scenario are compost materials and recyclable materials. At the MRF, recyclable materials are separated, and they are recycled at a 20% rate. A total of 80% of the OFMSW is treated at the composting facility, and the remaining 20% is sent to the proposed landfill.

2.4.4. Scenario 4 (S4): MRF, AD Combined with Landfilling

The scenario assumes that 10% of the total MSW is diverted into MRF, that 50% goes to the AD plant, and that the rest goes to landfilling. The digestate and the recyclable materials will be used in agricultural land and recyclable industries, in that order. Biogas produced from the digester will be upgraded into bio-methane (CH4), which can be used as a replacement for fossil fuels for heating and cooking purposes. In this scenario, it is assumed that 80% of the organic waste will be processed at the AD plant, along with 20% of the recyclable materials being recycled, and the other 20% will be disposed of in the landfill site.

2.4.5. Scenario 5 (S5): Material Recovery Facility, Composting, and Anaerobic Digestion Combined with Landfilling

This scenario incorporates both composting and AD by recycling the recyclable material at a rate of 10%, sending 50% of the organic waste to AD and composting facilities, and disposing of the remaining waste in landfills. It consists of MRF, a biological treatment facility, and also landfilling. The scenario assumes that 10% of total waste will go to an MRF, 25% to a composting facility, 25% to AD, and 40% to landfill. Biogas, compost, and digestate are some of the byproducts from this scenario.

2.4.6. Scenario 6 (S6): Incineration Combined with Landfilling

The study assumes that 80% of MSW is diverted to an incineration facility and that the remaining amount is disposed at the landfill. In this case, a continuous-type fluidized bed incinerator was contemplated to deal with the collected waste [3].

2.5. Life Cycle Inventory

A foundational step in the LCA process is the life cycle inventory (LCI). The defined functional unit provides a list of the material flows, energy flows, and environmental releases. LCI is carried out in three steps. At the beginning, it is important to identify all of the processes that take place during a product’s life cycle, from the production of energy and raw materials to the disposal of waste. In addition, directly during the process or inadvertently from the existing literature and databases, data regarding the complete processes, including inputs, outputs, and emissions into the air, water, and soil, should be gathered. Finally, data is normalized to the FU defined in the assessment. According to the system boundaries considered in this study (Figure 3), the life cycle of the MSW management system and emissions to and from the environment are calculated together with inputs such as diesel as a fuel and energy and outputs such as compost, digestate, and biogas. The Asian Development Bank report [14], Banepa city office [19], published the literature, and Ecoinvent database 3.6 provided the MSW composition, the quantity, the locations of possible treatment and disposal sites, and the emission factors dataset that was utilized in our investigation. The data inventory is presented in Table 1 as two systems: (1.) the foreground system, which includes emissions of CO2, phosphate (PO4), sulphur dioxide (SO2), dichlorobenzene (DB), ethylene (C2H4), and antimony (Sb) related to the different MSW management systems and treatment options taken into consideration in the study, and (2.) the background system. The background system comprises the foreground system’s diesel and its electricity requirement as well as the generation of heat, electricity, and mineral fertilizers (compost and digestate). The following subsections provide descriptions of the various activities and unit processes in the six potential MSW management scenarios considered in the study.

2.5.1. Transportation

The transportation units considered are “Tata LPK 407, 6–7 t GVW/4–5 t payload capacity, India”. GHG emission from the use of fossil fuels by vehicles is because of the transportation of waste to and from the locations for waste treatment and disposal. The determination of emission factors from transportation assumes diesel trucks with a capacity of 4–5 t and mileage of 5 km/L.

2.5.2. Material Recovery Facility

The MRF comprises a conveyor system that is operated by electricity and diesel oil consumption followed by the manual segregation of waste. The emissions generated from the MRF process is due to energy consumption. For every tonne of waste handled, the MRF needs 0.7 L of diesel and 0.045 kWh of electricity, respectively [9]. The waste from MRF is disposed of in a landfill.

2.5.3. Composting

We consider that 68.1% of OFMSW collected from Banepa is diverted to the proposed composting facility. An open windrow composting facility has been considered in the study. The front-end loader or windrow turner, which is used for prescreening, grinding, composting, turning, post-screening, and contamination removal throughout the composting process, is a piece of heavy equipment that consumes electricity and diesel fuel. Emissions from energy consumption and the direct emissions from the composting process were both considered. The resulting compost will be applied to the ground as a soil amendment. The process assumes 1.33 L/t of MSW fuel requirement, and 2.7 kWh/t of MSW electricity requirement [20].

2.5.4. Anaerobic Digestion

It was assumed that the AD plant would process 85% of the total amount of collected OFMSW. Biogas (composed of 60% methane and 40% carbon dioxide) and digestate are the end products of AD. The digestate material can be utilized as fertilizers. For every tonne of OFMSW input, the plant was predicted to produce 850 kg of digestate [20]. It was also assumed that 120 m3 of biogas would be produced per tonne of OFMSW, which would be upgraded into biomethane and used for cooking and transportation [21]. The potential for reducing or avoiding GWP from AD was assessed by assuming that every 1 m3 of biogas is equivalent to 0.45 kg of liquefied petroleum gas (LPG) [22] and that each kg of LPG emits 1.67 kg of CO2 [23].

2.5.5. Landfilling

For this study, the landfill process is modeled as an unmanaged anaerobic landfill site without LFG recovery or leachate treatment facilities on the site of the Sisdol Landfill site for Scenario 1 and on the proposed area of Banepa for Scenarios 2, 3, 4, 5, and 6. LFG produced by the breakdown of organic materials in MSW is the main source of GWP. Methane emission from the degradation of waste is dependent on several parameters, such as, to take just a few examples, the climatic condition of the landfill site (rainfall, temperature, etc.), landfill management practices, the provision of landfill cover (which facilitates the oxidation of methane), and leachate recirculation. Waste from treatment plants is entirely redirected towards landfilling. The Sisdol Landfill site was designed as a semi-aerobic landfill site and started its operation in 2005 for a 3-year design period [24], but the same site was used until very recently, when the new Banchare Dada landfill site came into operation in April, 2022 [25]. Leachate is not managed and assumed to be directly discharged into the Kolpu River, which is used as a source of domestic water by the downstream community [26]. The first-tier approach suggested in the literature is used in this study to estimate the GWP from the generation of methane from the open dumping site [3].

2.5.6. Incineration

The incineration process includes energy consumption in the form of electricity. A typical incinerator consumes 70 kWh per tonne of MSW [27]. The emission from the incineration process and electricity consumption is considered. A semi-continuous fluidized bed incinerator typically is maintained at 800–900 °C emits 0–50 kg CH4/t and 0.067 kg N2O/t of MSW [28].

2.6. Sensitivity Analysis and Life Cycle Impact Assessment

The effects of the six scenarios on the environment as well as their benefits were assessed using the LCA-based spreadsheet application (MS Excel) based on the earlier works in [18,29]. The six impact categories were: GWP (in kg CO2 eq.), AP (in kg SO2 eq.), EP (in kg PO43− eq.), ADP (in kg Sb eq.), HTP (in kg 1,4-DB eq.), and POCP (in kg C2H4 eq.). Sensitivity analysis was used to determine how changing the rate of recycling or diverting waste to the MRF will affect the various environmental impact categories. The percentage of recycled materials recovered from the waste is regarded as the recycling rate. The reduction of virgin material production, waste reduction, resource recovery, and the utilization of materials are the benefits of recycling, considering that they are all important parameters in MSW management. In this study, recyclable materials such as paper, plastics, glass, metals, rubber and leather, and textiles are all taken into account. In each of the scenarios, the effects of the various recycling rates, ranging from 10% to 70%, were examined. The individual electricity technologies present in the grid also have significant impacts on the results, but they are kept fixed in this study and are not considered for sensitivity analysis.

3. Results and Discussion

3.1. Environmental Impacts of MSW Management Scenarios

MSW generation from Banepa is 8.56 t/day, of which 4.5 t/day is collected with a collection efficiency of 52.5%, and the average waste generation is 344 g/capita/day [14]. Uncollected LFGs, incineration, transportation, biological treatment processes, and energy production are the main activities that cause GHG emission. Preventing waste from decomposing in landfills is the main activity that reduces GHG emission. Additionally, the use of biogas in place of LPG, the use of compost and digestate instead of inorganic fertilizers, the sequestration of carbon by the compost and the digestate, and the avoidance of the generation of electricity and fuel using AD all reduce GHG emission. The GHG emission and the benefits of all of the scenarios, including the baseline one, are shown in Table 2. It was found that Scenario 4 had the maximum GHG benefit, and the reason for this is that a greater proportion of organic waste is redirected to the anaerobic digesters, which create biogas that replace fossil-based LPG as a cooking fuel in addition to the organic fertilizer produced during the composting process. Furthermore, GHG benefits can be observed in Scenarios 2, 3, and 5, but, comparatively, less than in Scenario 4.
The temperature rise brought on by the GHGs, such as CO2 and CH4, N2O, and hydrochlorofluorocarbons (HCFCs), is responsible for global warming. MSW treatment produces both biogenic and fossil CO2 and biomethane, with the biogenic CO2 and CH4 released by the decomposition of the biodegradable portion of MSW and the non-biogenic CO2 produced by burning non-biodegradable materials (including plastics, textiles, and rubber and leather). Although biogenic CO2 can be assumed to have a zero impact factor (i.e., it does not contribute to global warming), methane is a much stronger greenhouse gas [3]. The baseline scenario has the highest GWP (2004.56 kg CO2/t), which is caused by high fossil CO2 and biomethane emission, by a lack of waste segregation, and by an LFG control mechanism. Nevertheless, GWP can be significantly decreased by introducing MRF. Table 3 indicates that Scenario 3 had the lowest GWP (974.82 kg CO2/t) due to the composting process, which reduces the amount of biogenic methane that is produced. Composting with landfilling has been shown to have the highest GWP (1259.69 kg CO2 eq./t), while composting with landfilling and MRF has the lowest GWP (721.79 kg CO2 eq./t) [7]. Landfilling of 1 kg of MSW (average composition of MSW in European countries) has an impact of GWP equivalent to 1.08 nanograms (ng) which seems to be lower than determined in this study [30]. Another study has reported the higher contribution of GWP (37%) when seven impact categories were determined for the landfilling scenario of food catering waste [31]. This is in agreement with our results in Scenario 1. One tonne of OFMSW can produce 0.33 t of compost [20], and 1 tonne of compost application can sequester 70 kg of CO2 [32]. Similarly, 1 tonne of OFMSW can produce 0.85 t of digestate [19], and 1 tonne of digestate can sequester 8 kg of CO2 [33]. This information was used in the estimation of the impacts and the offsets in the six different scenarios.
During the compost process, acidifying gases such as NOx and SOx are released into the atmosphere, which is the primary cause of acidification. It has been discovered that NOx has a relatively stronger acidification effect than SOx, which may be due to the presence of mineral fertilizers and the features of MSW [9]. Scenario 6 had the highest AP (0.52 kg SO2 eq./t), which significantly increases acidification by transforming the sulfur and nitrogen content of incinerated waste into acidic gases such as SOx and NOx. Moreover, the processes of composting and landfilling have the potential to release gases such as N2O and NH3. Scenario 3 had the lowest AP (0.15 kg SO2 eq./t) because there are lower sulfur and nitrogen-containing chemicals involved in and oxidized during the composting and MRF processes. The study shows that MRF and incineration were found to have the maximum acidification impact (0.65 kg SO2 eq./t), while open dumping with a bioreactor landfill has the least acidification potential (0.12 kg SO2 eq./t) [7]. One study reported composting with landfilling had the least AP (0.19 kg SO2 eq./t), and that MRF and AD with a landfilling scenario had the highest AP (0.68 kg SO2 eq./t) [7].
Nutrients such as ammonia, nitrogen oxide, and phosphate are responsible for eutrophication. Due to the significant quantity of nitrogen and phosphorous emissions from the landfill site, Scenario 1 had the maximum eutrophication impact (0.09 kg PO43 eq./t). The biological processes taking place inside the disposal site generate nitrogen and phosphorous gases, which can dissolve in leachate and have greater negative effects on the environment. Scenario 3 and Scenario 4 showed the least eutrophication impact (0.04 kg PO43− eq./t) due to source separation. Research has also shown that open dumping with a bioreactor landfill has a high EP (0.47 kg PO43− eq./t) [7]. Due to the presence of impermeable synthetic liners and leachate treatment MRF, composting and landfilling have been shown to have the lowest EP [7]. A unit kg of MSW is reported to have 0.25 ng EP for landfilling [30].
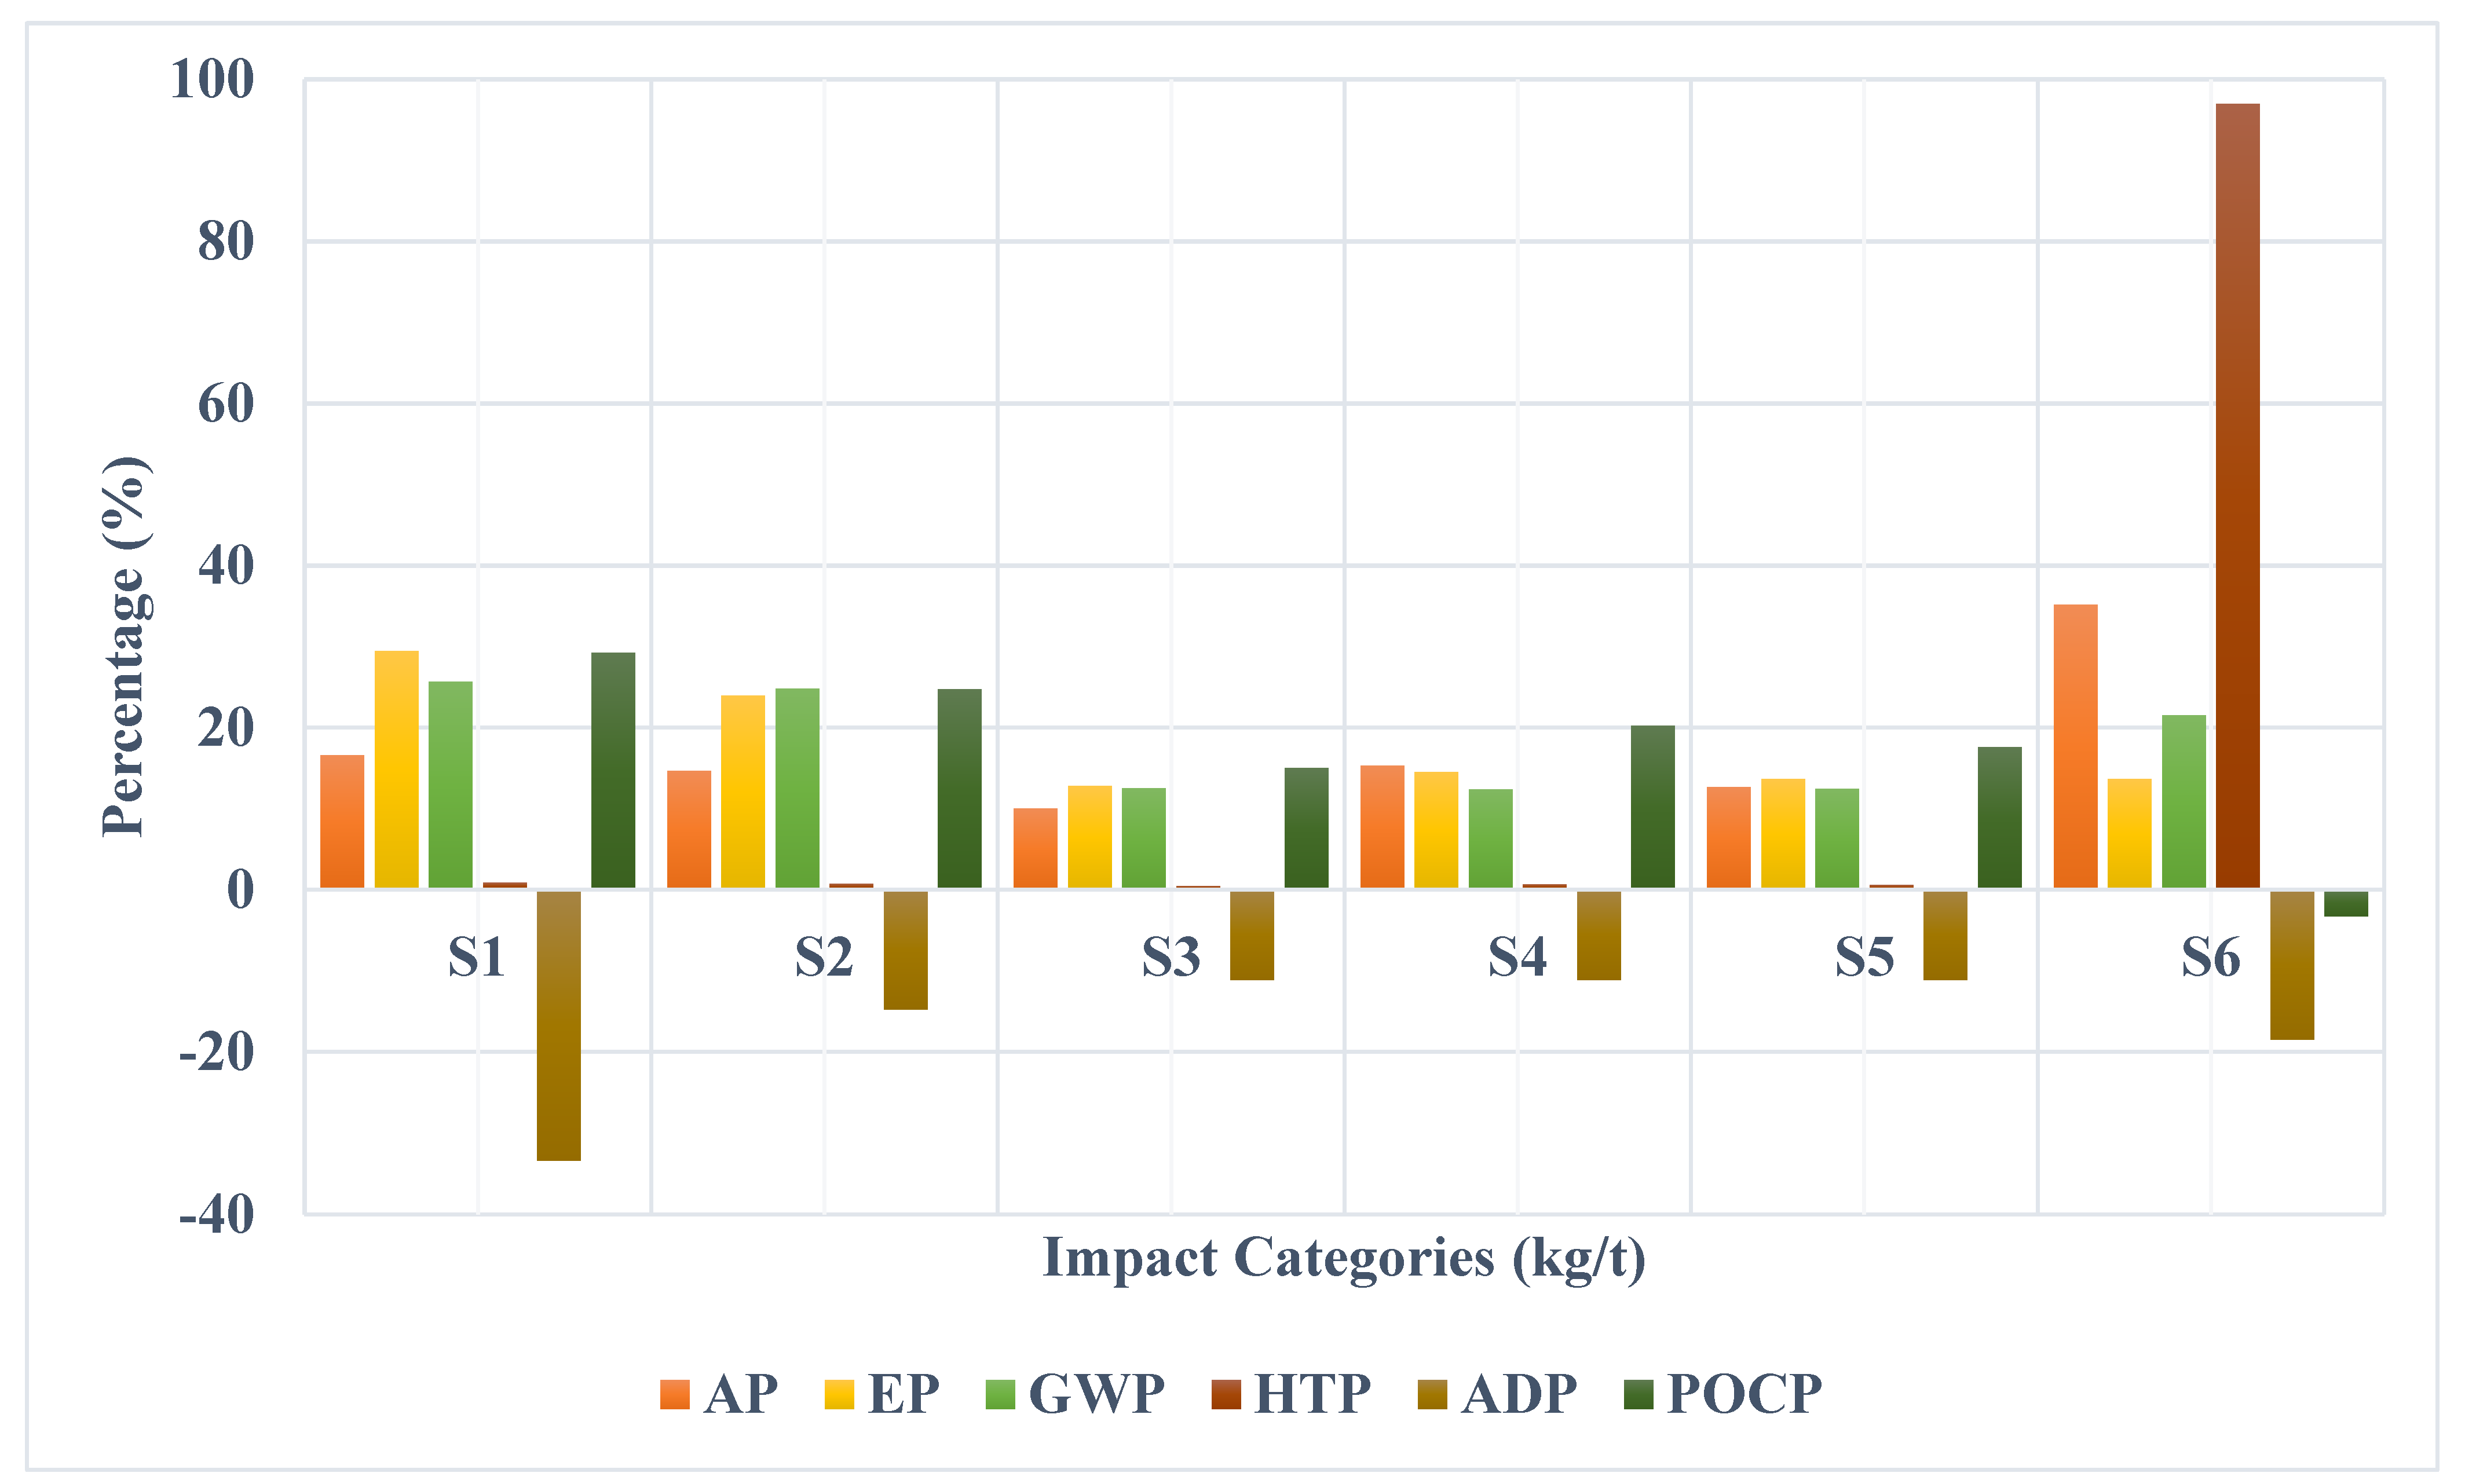
The findings in Figure 4 are based on the six impact categories (GWP, AP, EP, HTP, ADP, and POCP), respectively. Scenarios 3, 4, and 5 are also shown to have the highest abiotic depletion potential (−0.03 kg Sb eq./t), resulting in the over-extraction of non-fossil fuels (renewable resources) compared to the other scenarios. Scenario 1 had the least ADP (−0.09 kg Sb eq./t). For landfilling, a unit kg of MSW had 0.13 ng of ADP [30]. Human toxicity is caused by the emission of pollutants, such as particulate matter, SOx, NOx, and heavy metals. Scenario 6 (incineration combined with landfilling) resulted in the highest HTP (944.56 kg 1,4 DB eq./t) due to the high emissions of heavy metals, SOx, and NOx during the combustion process. Out of the possible outcomes, Scenario 3 had the lowest environmental impact (4.55 kg 1,4 DB eq./t), which suggests that composting and material recovery have less of an influence on toxicity-causing agent emissions than landfilling. The chemical interactions between NOx, carbon monoxide, and VOCs in the presence of sunlight produce tropospheric ozone and asthma, and other respiratory issues may also arise from low levels of ozone exposure [6]. Scenario 1 possessed the maximum POCP (0.12 kg C2H4 eq./t), where diesel usage, methane production, and NOx emissions were the major contributors. In addition, a large amount of photochemical oxidant precursors (VOCs, CO2, NO2, NOx, and fine particles) can be released during the process. Scenario 6 had the least POCP (−0.01 kg C2H4 eq./t).
Energy consumed in landfills and open dumping activities, such as waste spreading and leachate treatment, waste disposal practice including compaction, and application of soil cover, were not accounted for in this study due to the unavailability of reliable site-specific data.

3.2. Sensitivity Analysis

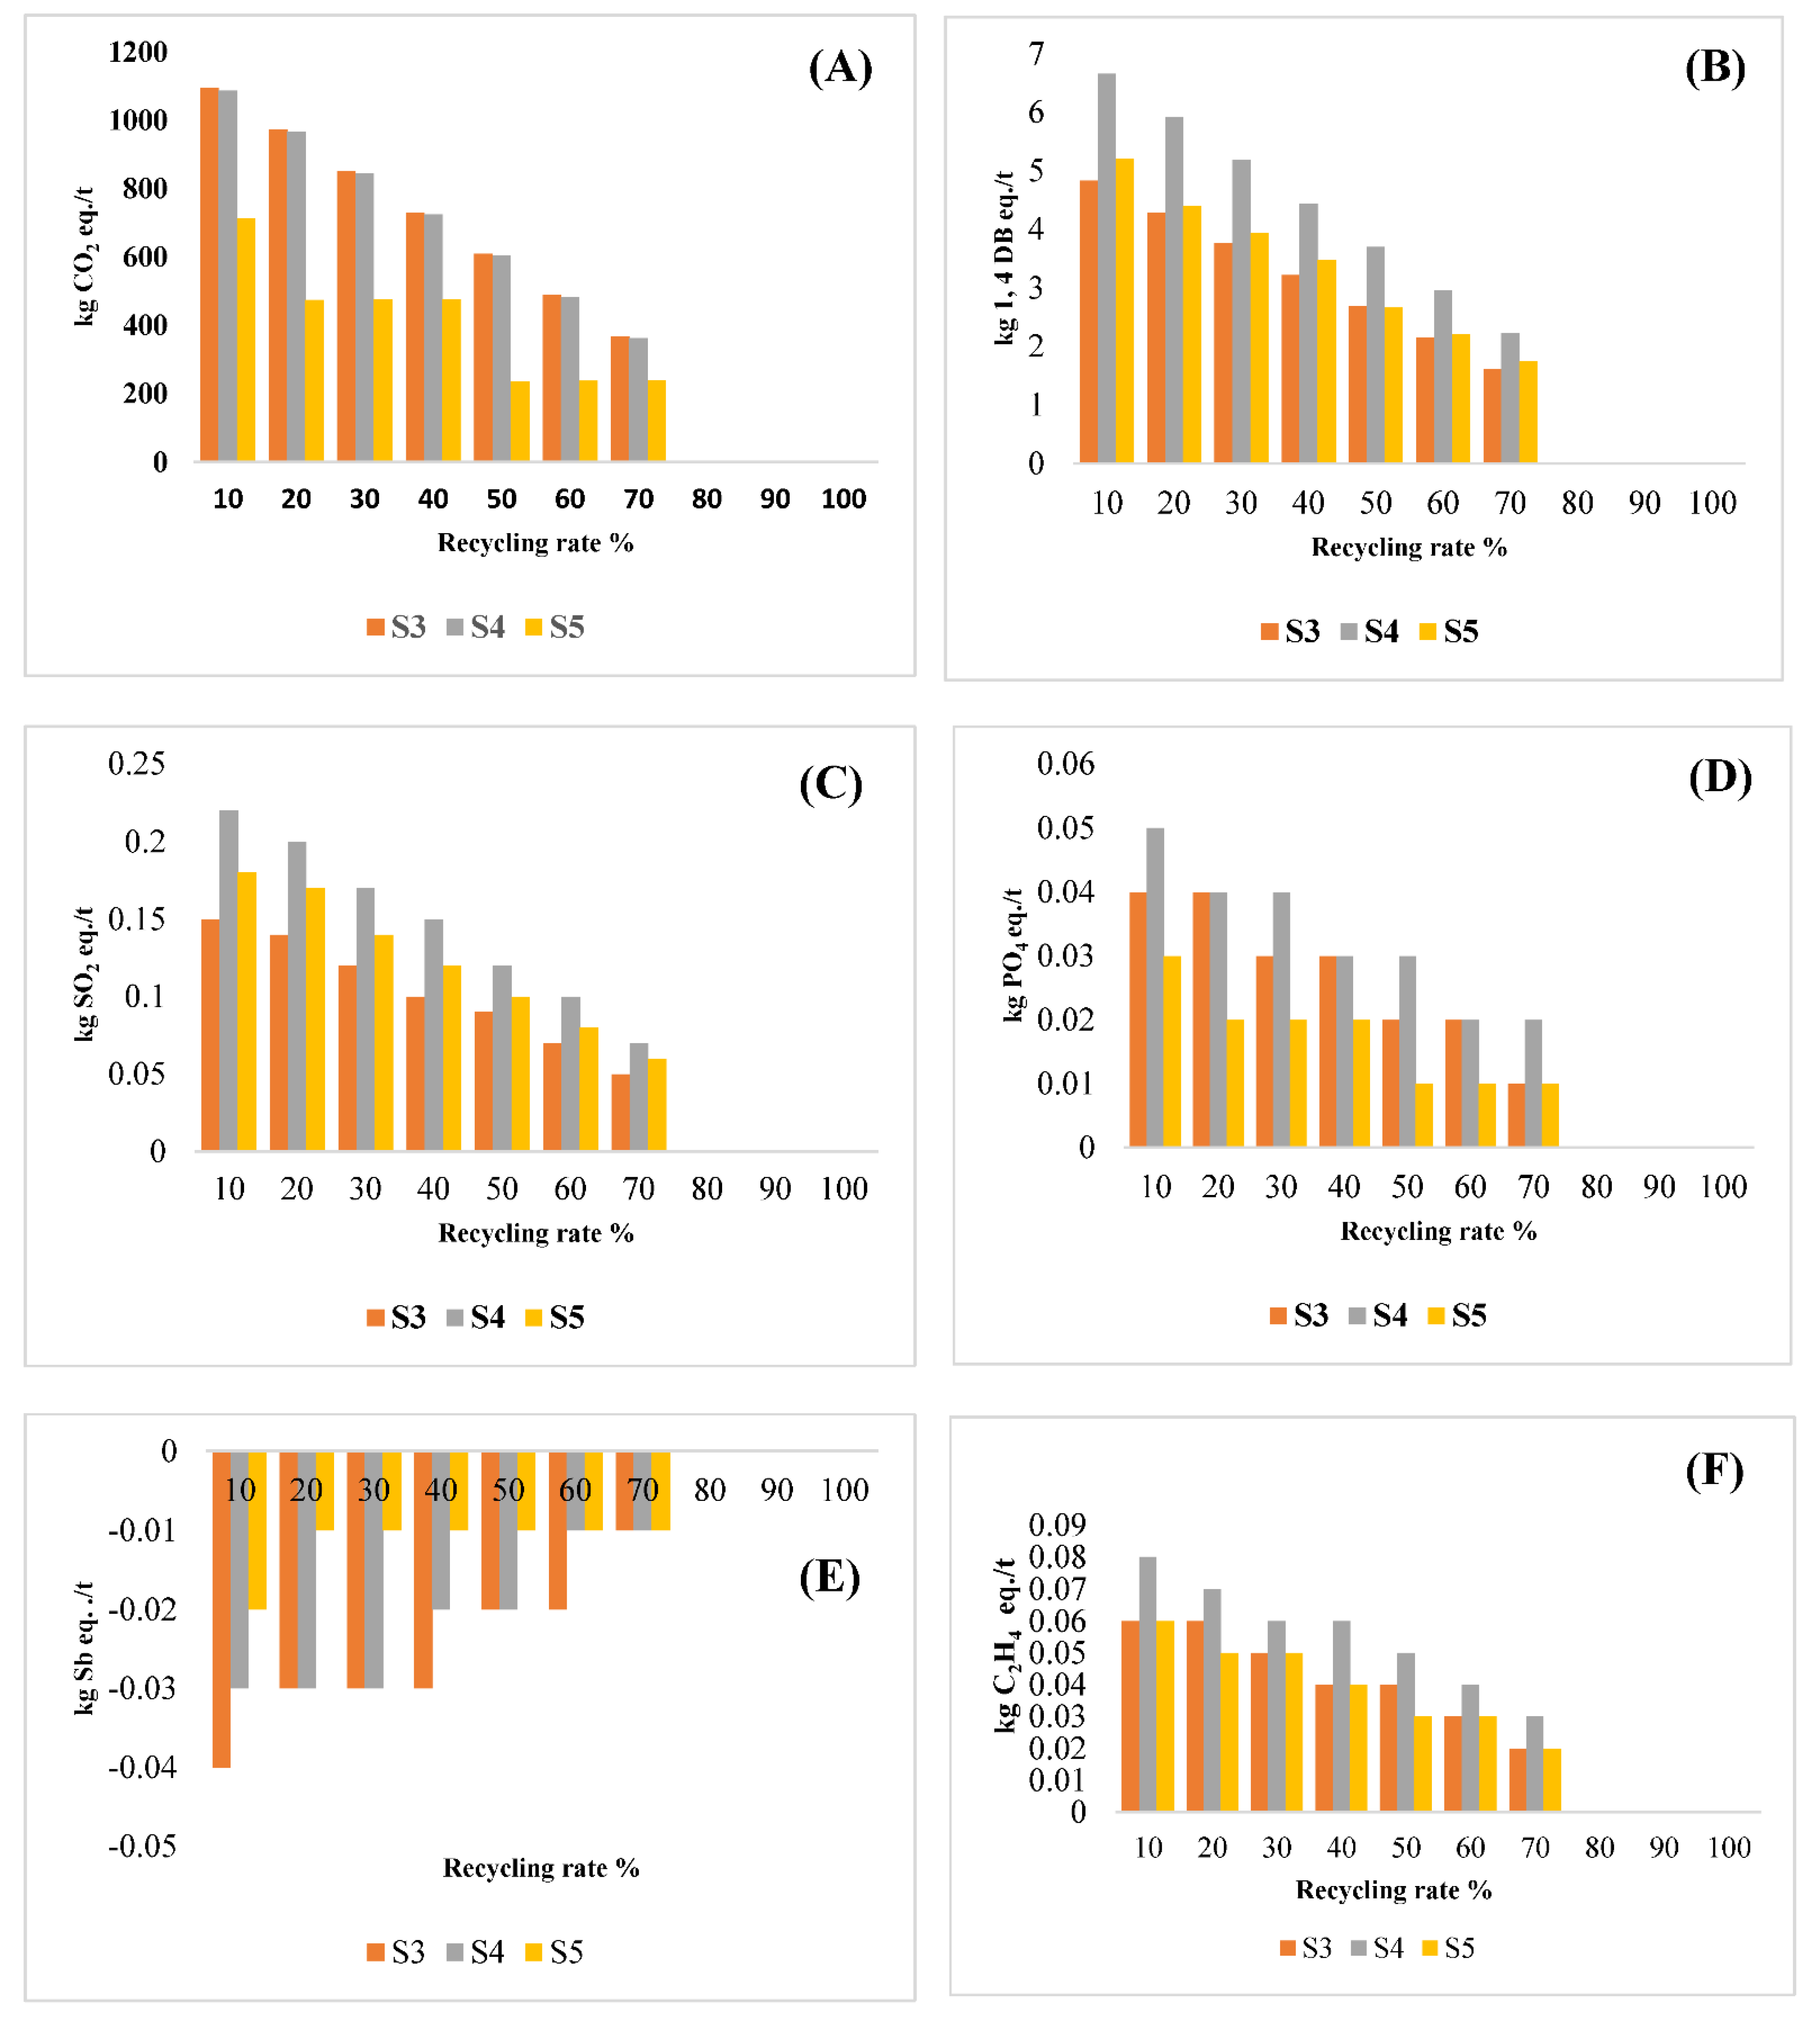
The result of the sensitivity analysis based on increasing the recycling rate from 10% to 70% is included in Figure 5. The analysis showed that MSW for landfilling and biological treatment, including composting and AD, vary from 15 to 45% as recycling ranged from 10 to 70%. This also indicates that the environmental effects of the sensitivity analysis results are caused by the variation in the recycling rate (variation in the quantity of recyclables such as paper, plastics, metals, textiles, etc. quantified in terms of percentage) in scenarios, i.e., Scenario 3, 4, and 5. The change in recycling rate and the effects on the environment are inversely correlated as in the previous studies [7,9]. As a result, it was determined that the introduction of MRF would increase the environmental advantages of recycling. Research has also shown that combining MRF, composting, and landfilling results in increased environmental benefits.

4. Conclusions and Recommendations

This study developed and successfully tested the LCA-based MSW management decision support spreadsheet tool for the city of Banepa city in Nepal in order to evaluate the best suited and most sustainable MSW management systems that have the least detrimental environmental impacts. Among the six proposed scenarios, Scenario 3, which involved the material recovery facility and composting combined with landfilling, was found to be the least impactful MSW management scenario in terms of the environmental impact categories. Scenario 3 had GWP of 974.82 kg CO2 eq./t, EP of 0.04 kg PO43− eq./t, AP of 0.15 kg SO2 eq./t, HTP of 4.55 kg 1,4 DB eq./t, ADP of −0.03 kg Sb eq./t, and POCP of 0.06 kg C2H4 eq./t. Scenario 4 had the least GWP of 966.31 kg CO2 eq./t, EP of 0.04 kg PO43− eq./t, AP of 0.23 kg SO2 eq./t, HTP of 6.58 kg 1, 4 DB eq./t, ADP of −0.03 kg Sb eq./t, and POCP of 0.08 kg C2H4 eq./t. Scenario 4 had maximum GHG benefit as it had the lowest GWP. This was due to a greater proportion of organic waste redirected into anaerobic digesters creating biogas and the replacement of fossil-based LPG as a cooking fuel in addition to the organic fertilizer produced. However, Scenario 4 had substantially higher HTP than that of Scenario 3 and 5. Scenario 3 seems to be the best scenario for MSW management for the city of Banepa, and it had the least environmental impacts in terms of AP, EP, HTP, and POCP, which are also relatively favorable from both health and environmental perspectives. The baseline or existing scenario was shown to have the most severe and detrimental environmental effects. The LCA of MSW management systems shows that emission from uncollected landfill gas poses the greatest potential threat to the environment. Sensitivity analysis also showed that the recycling rate can considerably decrease life-cycle emission, and that recycling MSW was the most desirable option for the sustainable management of waste. Environmental impact categories, such as AP, EP, HTP, ADP, POCP, and GWP, can also be significantly reduced by the adoption of MRF and biological treatments, such as composting and AD. The outcomes of the study can serve as a reference for similar emerging cities to aid in planning effective MSW management systems and improving their operation.

Supplementary Materials

The following supporting information can be downloaded at: https://www.mdpi.com/article/10.3390/su15139954/s1, Waste Management Decision Support Tool. References [18,29] are cited in the supplementary materials.

Author Contributions

Conceptualization, P.P.S., A.G. and M.B.D.; methodology, P.P.S. and A.G.; formal analysis, P.P.S.; investigation, P.P.S.; writing—original draft preparation, P.P.S.; writing—review and editing, P.P.S., A.G., M.B.D. and M.A.U.; supervision, A.G. and M.B.D. All authors have read and agreed to the published version of the manuscript.

Funding

This research received financial support from the Centre of Research for Environment, Energy and Water (CREEW), Nepal and P.P.S. received support from the University Grants Commission in Nepal.

Institutional Review Board Statement

Not applicable.

Informed Consent Statement

Not applicable.

Data Availability Statement

All the data used in the study are provided as supplementary information.

Acknowledgments

We thank the Banepa municipality officials for providing the relevant information during the research, and we acknowledge the useful suggestions provided by the paper’s anonymous reviewers. We would also like to acknowledge the support offered by SimaPro, PRé Sustainability B.V., which provided a faculty license of SimaPro and access to Ecoinvent databases.

Conflicts of Interest

There are no conflict of interest between the authors’ research or writing and the publication of this work.

Abbreviations

ADAnaerobic Digestion
APAcidification Potential
CH4Methane
CO2Carbon Dioxide
C2H4Ethylene
CFCsChlorofluorocarbons
COMComposting
DBDichlorobenzene
DSTsDecision Support Tools
EPEutrophication Potential
FECFuel Energy Consumption
FUFunctional Unit
GHGsGreenhouse Gases
GWPGlobal Warming Potential
HTPHuman Toxicity Potential
ISOInternational Organization for Standardization
INIncineration
kWhKilowatt Hour
KgKilogram
Km/LKilometer per Litre
LLitre
LCALife Cycle Assessment
LCILife Cycle Inventory
LCIALife Cycle Impact Assessment
LFGLandfill Gas
LFLandfill
m3Cubic Meter
MFAMaterial Flow Analysis
MSWMunicipal Solid Waste
MRFMaterial Recovery Facilities
MJMegajoule
NgNanogram
N2ONitrous Oxide
ODOpen Dumping
OFMSWOrganic Fraction of Municipal Solid Waste
POCPPhotochemical Ozone Creation Potential
PO4Phosphate
SbAntimony
SO2Sulphur Dioxide
SWDSSolid Waste Disposal Sites
S1Scenario 1
S2Scenario 2
S3Scenario 3
S4Scenario 4
S5Scenario 5
S6Scenario 6
tMetric tonne
VOCsVolatile Organic Compounds

References

  1. Awasthi, S.K.; Sarsaiya, S.; Kumar, V.; Chaturvedi, P.; Sindhu, R.; Binod, P.; Zhang, Z.; Pandey, A.; Awasthi, M.K. Processing of municipal solid waste resources for a circular economy in China: An overview. Fuel 2022, 317, 123478. [Google Scholar] [CrossRef]
  2. Logan, M.; Visvanathan, C. Management strategies for anaerobic digestate of organic fraction of municipal solid waste: Current status and future prospects. Waste Manag. Res. 2019, 37, 27–39. [Google Scholar] [CrossRef] [Green Version]
  3. IPCC. CH4 Emissions from Solid Waste Disposal. In Good Practice Guidance and Uncertainty Management in National Greenhouse Gas Inventories; IPCC: Geneva, Switzerland, 2006; pp. 419–439. Available online: http://www.ipcc-nggip.iges.or.jp/public/gp/bgp/5_1_CH4_Solid_Waste.pdf (accessed on 27 April 2023).
  4. Uche, M.-A.M. Consideration of Emission Ratios in Integrated Sustainable Municipal Solid Waste Management Planning. In Proceedings of the FIG Congress 2014: Engaging the Challenges-Enhancing the Relevance, Kuala Lumpur, Malaysia, 16–21 June 2014. [Google Scholar]
  5. Paes, M.X.; de Medeiros, G.A.; Mancini, S.D.; Bortoleto, A.P.; de Oliveira, J.A.P.; Kulay, L.A. Municipal solid waste management: Integrated analysis of environmental and economic indicators based on life cycle assessment. J. Clean. Prod. 2020, 254, 119848. [Google Scholar] [CrossRef]
  6. Mandpe, A.; Bhattacharya, A.; Paliya, S.; Pratap, V.; Hussain, A.; Kumar, S. Life-cycle assessment approach for municipal solid waste management system of Delhi city. Environ. Res. 2022, 212, 113424. [Google Scholar] [CrossRef] [PubMed]
  7. Sharma, B.K.; Chandel, M.K. Life cycle assessment of potential municipal solid waste management strategies for Mumbai, India. Waste Manag. Res. 2017, 35, 79–91. [Google Scholar] [CrossRef]
  8. Rana, R.; Ganguly, R.; Gupta, A.K. Life-cycle assessment of municipal solid-waste management strategies in Tricity region of India. J. Mater. Cycles Waste Manag. 2019, 21, 606–623. [Google Scholar] [CrossRef]
  9. Khandelwal, H.; Thalla, A.K.; Kumar, S.; Kumar, R. Life cycle assessment of municipal solid waste management options for India. Bioresour. Technol. 2019, 288, 121515. [Google Scholar] [CrossRef]
  10. Bajracharya, S.; Adhikari, A.; Shrestha, P.P.; Ghimire, A. Life-cycle assessment of solid waste management in Dhulikhel Municipality, Nepal. J. Environ. Eng. Sci. 2022, 17, 147–154. [Google Scholar] [CrossRef]
  11. Ranabhat, R. Life Cycle Assessment of Municipal Solid Waste Management System in Kathmandu, Nepal. J. Adv. Coll. Eng. Manag. 2016, 1, 97. [Google Scholar] [CrossRef] [Green Version]
  12. Malla, O.B.; Dangi, M.B.; Khatiwada, N.R. Life Cycle Assessment of Municipal Solid Waste Management in Kathmandu, Nepal. In Abstract Proceedings of 2019 International Conference on Resource Sustainability—Cities (icRS Cities); Elsevier: Amsterdam, The Netherlands; p. 2019. [CrossRef]
  13. Vea, E.B.; Martinez-Sanchez, V.; Thomsen, M. A review of waste management decision support tools and their ability to assess circular biowaste management systems. Sustainability 2018, 10, 3720. [Google Scholar] [CrossRef] [Green Version]
  14. ADB. Solid Waste Management in Nepal; Asian Development Bank (ADB): Mandaluyong, Philippines, 2013; Available online: https://www.adb.org/sites/default/files/publication/30366/solid-waste-management-nepal.pdf (accessed on 27 April 2023).
  15. Rajaeifar, M.A.; Tabatabaei, M.; Ghanavati, H.; Khoshnevisan, B.; Rafiee, S. Comparative life cycle assessment of different municipal solid waste management scenarios in Iran. Renew. Sustain. Energy Rev. 2015, 51, 886–898. [Google Scholar] [CrossRef]
  16. ISO 14040:2006; Environmental Management—Life Cycle Assessment—Principles and Framework. Amendment. European Standard. 2020. Available online: https://www.iso.org/standard/37456.html (accessed on 1 May 2023).
  17. McDougall, F.R.; White, P.R.; Franke, M.; Hindle, P. Integrated Solid Waste Management: A Life Cycle Inventory; John Wiley & Sons: Hoboken, NJ, USA, 2008. [Google Scholar]
  18. Ghimire, A.; Sen, R.; Annachhatre, A.P. Biosolid management options in cassava starch industries of Thailand: Present practice and future possibilities. Procedia Chemistry 2015, 14, 66–75. [Google Scholar] [CrossRef] [Green Version]
  19. Banepa Municipality. Available online: https://banepamun.gov.np/ (accessed on 27 April 2023).
  20. Al-Rumaihi, A.; McKay, G.; Mackey, H.R.; Al-Ansari, T. Environmental impact assessment of food waste management using two composting techniques. Sustainability 2020, 12, 1595. [Google Scholar] [CrossRef] [Green Version]
  21. Kumar, A.; Samadder, S.R. Performance evaluation of anaerobic digestion technology for energy recovery from organic fraction of municipal solid waste: A review. Energy 2020, 197, 117253. [Google Scholar] [CrossRef]
  22. Ananthakrishnan, R.; Sudhakar, K.; Goyal, A.; Sravan, S.S. Economic feasibility of substituting LPG with biogas for MANIT hostels. Int. J. ChemTech Res. 2013, 5, 891–893. [Google Scholar]
  23. Ecoscore 2020. Available online: https://ecoscore.be/?locale=en (accessed on 18 June 2023).
  24. Shrestha, P.K. Leachate Characterization and Management at Sisdol Landfill Site in Nepal. J. Dev. Innov. 2017, 1, 60–83. [Google Scholar]
  25. Swar, S.S.; Boonnorat, J.; Ghimire, A. Algae-based treatment of a landfill leachate pretreated by coagulation-flocculation. J. Environ. Manag. 2023, 342, 118223. [Google Scholar] [CrossRef]
  26. Dangi, M.B.; Schoenberger, E.; Boland, J.J. Assessment of environmental policy implementation in solid waste management in Kathmandu, Nepal. Waste Manag. Res. 2017, 35, 618–626. [Google Scholar] [CrossRef] [PubMed]
  27. Yay, A.S.E. Application of life cycle assessment (LCA) for municipal solid waste management: A case study of Sakarya. J. Clean. Prod. 2015, 94, 284–293. [Google Scholar] [CrossRef]
  28. IPCC. CH5 Incineration and Open Burning of Waste. Good Practice Guidance and Uncertainty Management in National Greenhouse Gas Inventories; IPCC: Geneva, Switzerland, 2006; Volume 22, pp. 14–24. Available online: https://www.ipcc-nggip.iges.or.jp/public/2006gl/pdf/5_Volume5/V5_5_Ch5_IOB.pdf (accessed on 27 April 2023).
  29. Canadian Council of Ministers of the Environment. Biosolids Emissions Assessment Model (BEAM) User’s Guide (BEAM Version 1.3) [Report]; CCME: Winnipeg, MB, Canada, 2009. [Google Scholar]
  30. Mannheim, V. Perspective: Comparison of end-of-life scenarios of municipal solid waste from viewpoint of life cycle assessment. Front. Built Environ. 2022, 8. [Google Scholar] [CrossRef]
  31. Avató, J.L.; Mannheim, V. Life Cycle Assessment Model of a Catering Product: Comparing Environmental Impacts for Different End-of-Life Scenarios. Energies 2022, 15, 5423. [Google Scholar] [CrossRef]
  32. ROU. Life Cycle Inventory and Life Cycle Assessment for Windrow Composting Systems; Recycled Organics Unit (ROU), The University of New South Wales: Sydney, Australia, 2007; p. 166. Available online: https://www.epa.nsw.gov.au/resources/warrlocal/060400-windrow-assess.pdf (accessed on 22 February 2023).
  33. Møller, J.; Boldrin, A.; Christensen, T.H. Anaerobic digestion and digestate use: Accounting of greenhouse gases and global warming contribution. Waste Manag. Res. 2009, 27, 813–824. [Google Scholar] [CrossRef] [PubMed] [Green Version]
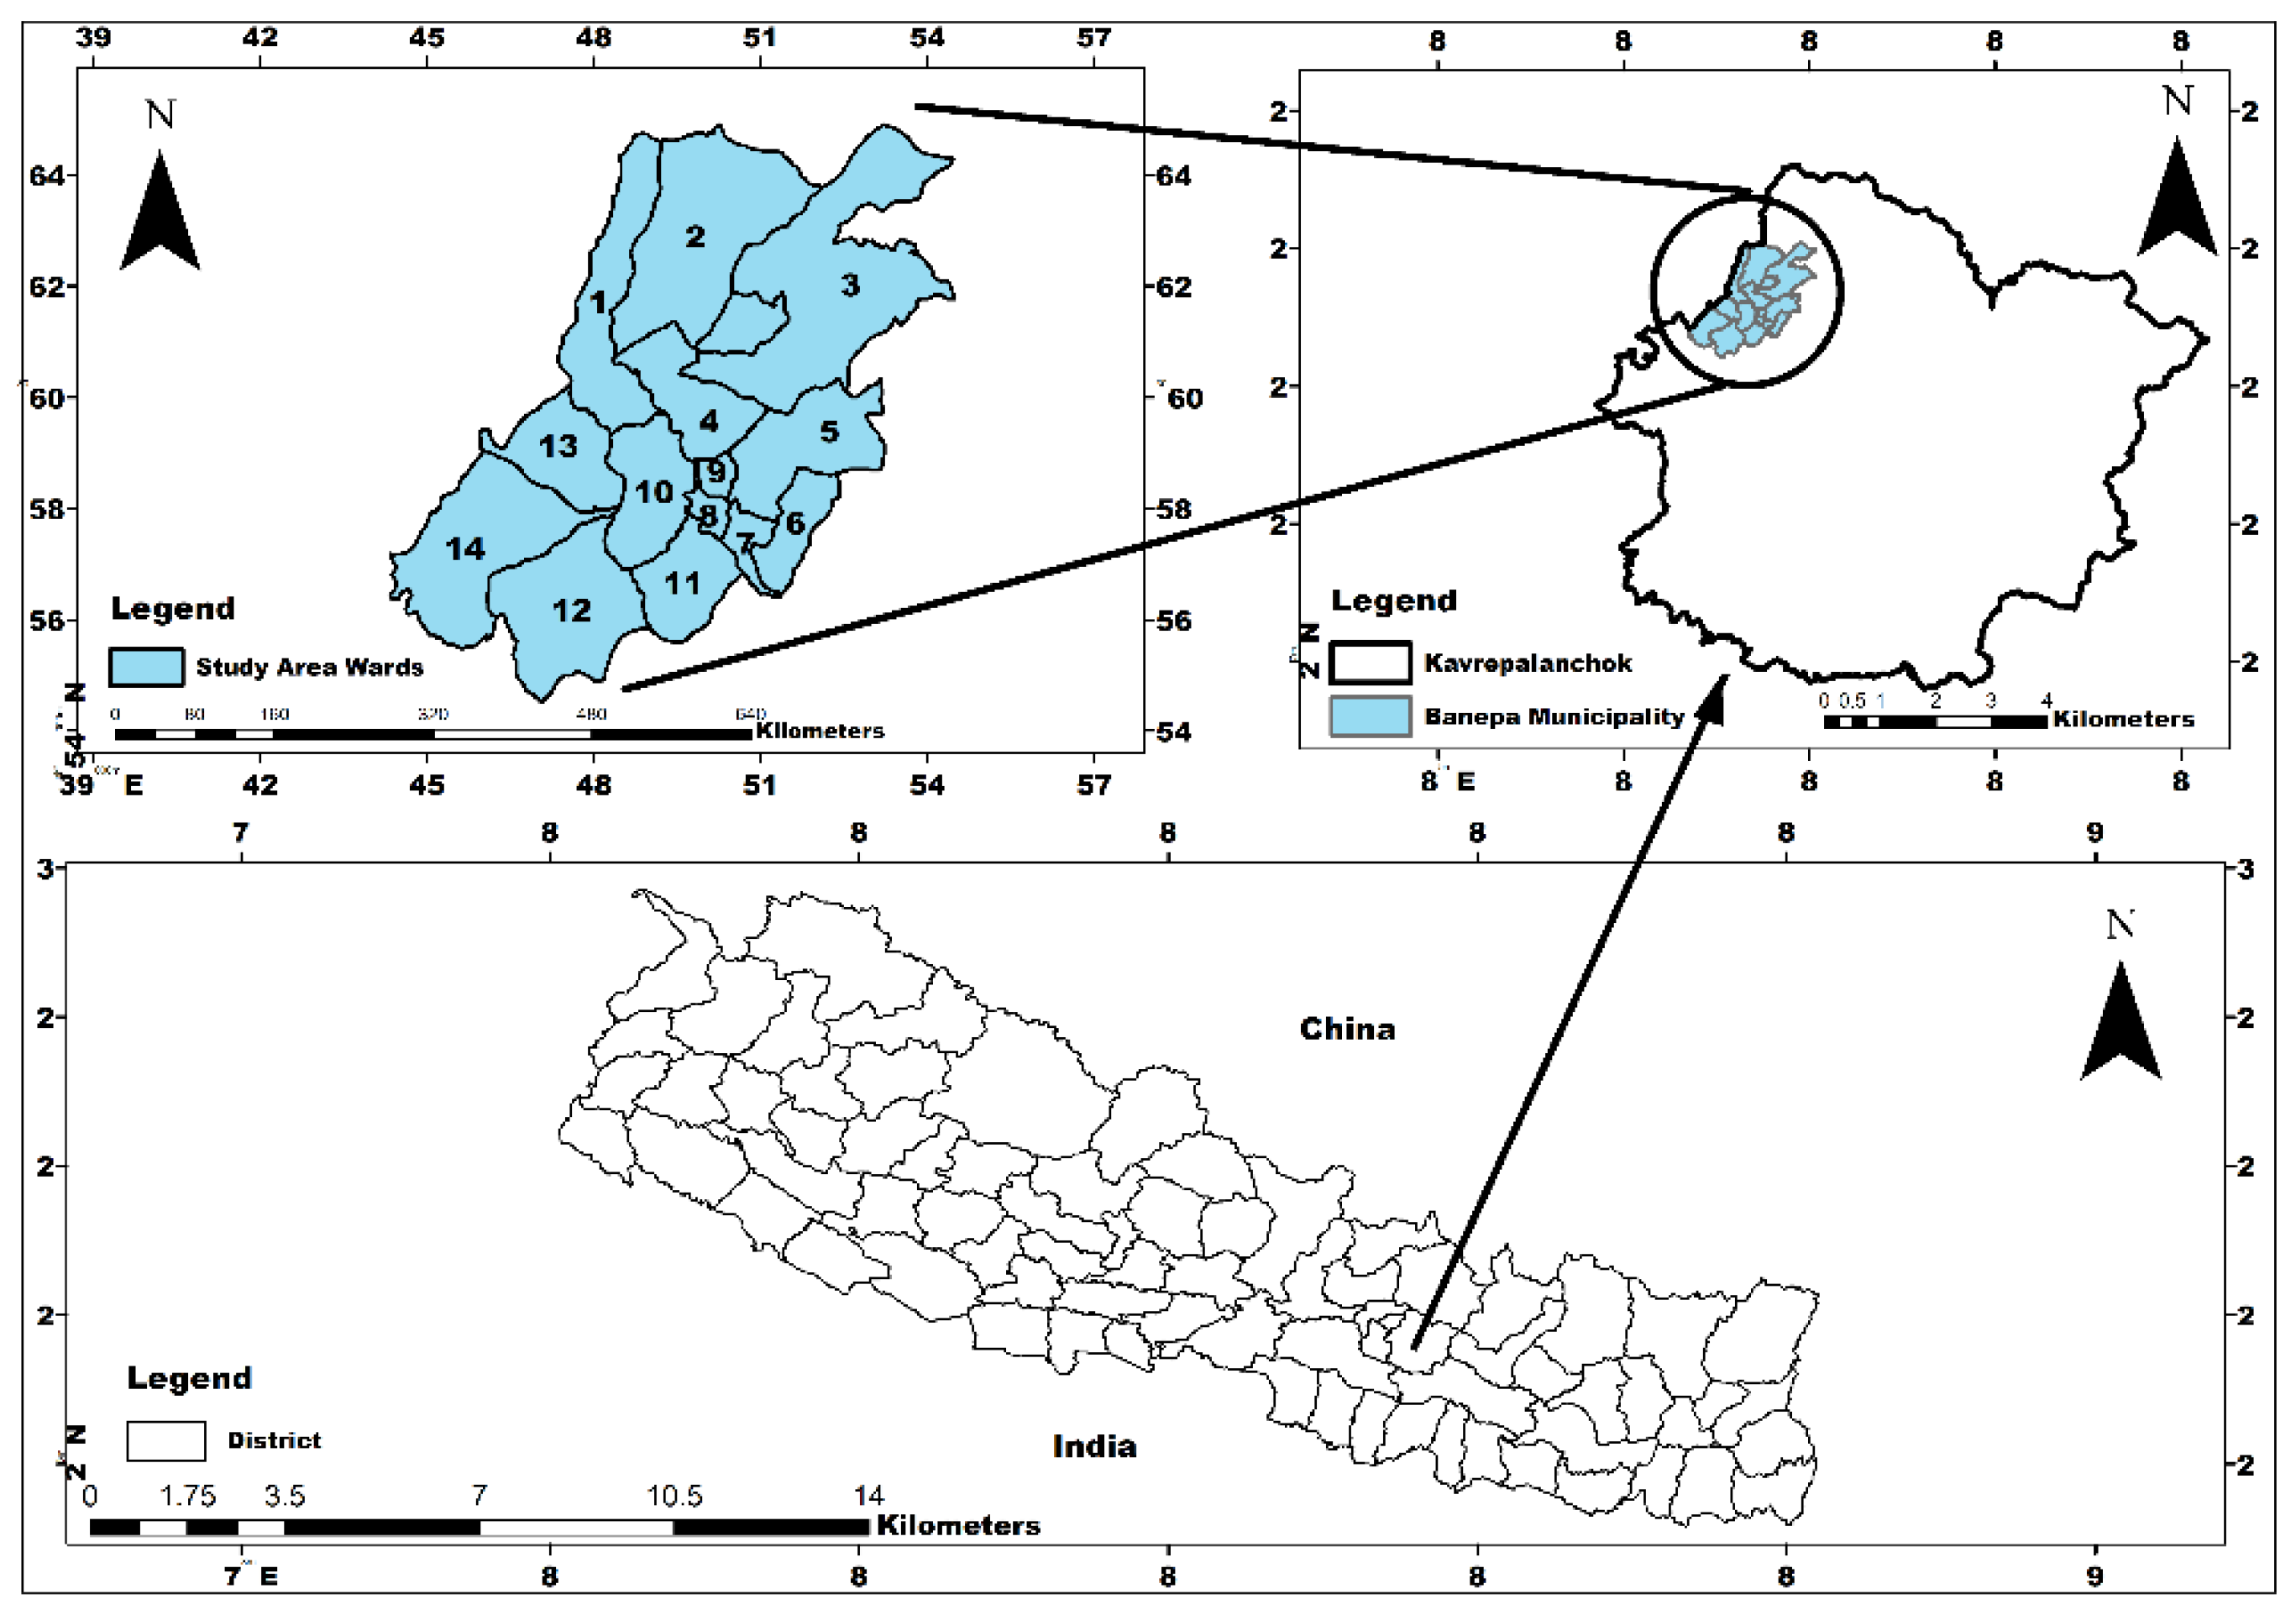
Figure 1. Map showing the location of the Banepa municipality in Kavrepalanchok district, Nepal.
Sustainability 15 09954 g001
Figure 2. System boundary of the study.
Sustainability 15 09954 g002
Figure 3. MSW flow in six different scenarios.
Sustainability 15 09954 g003
Figure 4. LCA characterization of considered environmental impact categories.
Sustainability 15 09954 g004
Figure 5. Sensitivity analysis of proposed scenarios (Scenarios 3, 4, and 5) in recycling rate in terms of GWP (A), HTP (B), AP (C), EP (D), ADP (E), and POCP (F) per tonne (t) of waste.
Sustainability 15 09954 g005
Table 1. Inventory data used for six possible scenarios of MSW management systems.
Inventory for Background Data
Inputs from TechnosphereUnitS1S2S3S4S5S6
DieselL18.522.672.472.472.802.40
ElectricitykWh-0.541.3515.258.3056.00
By-Product
CompostT-0.070.17-0.08-
DigestateT---0.430.21-
Biogasm3---1.501.50-
ElectricitykWh---22.6822.68-
HeatMJ---25.5225.52-
Inventory for Foreground Data
Air EmissionUnitS1S2S3S4S5S6
CO2 eq.kg2004.561930.60974.82948.19969.531679.90
PO4 eq.kg0.090.070.040.040.041.42
SO2 eq.kg0.240.210.150.230.190.52
1,4 DB eq.kg8.157.044.556.585.57944.56
Sb eq.kg−0.09−0.07−0.03−0.03−0.03−0.05
C2H4 eq.kg0.120.100.060.080.07−0.01
Table 2. Activities contributing to GWP and GWP benefits for the six SWM scenarios (S1–S6).
Activities Contributing to GHG’sUnitS1S2S3S4S5S6
Uncollected Landfill gaskg CO2 eq./t1994.571928.48964.24964.24964.24482.12
Transportation10.001.301.301.301.301.30
Composting-6.1222.33-11.17-
Anaerobic Digestion---42.0030.06-
Incineration-----1196.14
Electricity consumption (Treatment option)-0.000.010.090.050.34
Diesel Consumption (Treatment Option)-0.721.980.191.09-
Activities Causing BenefitsUnitS1S2S3S4S5S6
Replacing LPG gas by biogaskg CO2 eq./t---44.9622.48-
Avoidance of inorganic fertilizer (compost)-1.403.49-1.75-
Avoidance of inorganic fertilizer (digestate)---9.214.61-
Carbon sequestration from digestate application---3.401.70-
Carbon sequestration from compost application-4.6211.55-5.78-
Avoidance from electricity generation (AD)---0.140.14-
Avoidance from fuel consumption (AD)---1.921.92-
Total GHG’s contribution (kg CO2 eq./t)2004.561930.60974.82948.19969.531679.90
Table 3. Summary of results on life cycle impacts for different scenarios.
Scenario–MSW Management SystemsAcidification Potential, AP
(kgSO2 eq./t)
Eutrophication Potential, EP
(kg PO4 eq./t)
Global Warming Potential, GWP
(kg CO2 eq./t)
Human Toxicity Potential, HTP
(kg 1,4-DB eq./t)
Abiotic Depletion Potential, ADP
(kg Sb eq./t)
Photochemical Oxidation, POCP
(kg C2H4 eq./t)
Scenario 1 (Baseline)0.240.092004.568.15−0.090.12
Scenario 2 (Co-LF)0.210.071930.607.04−0.070.10
Scenario 3 (MRF-Co-LF)0.150.04974.824.55−0.030.06
Scenario 4 (MRF-AD-LF)0.230.04948.196.58−0.030.08
Scenario 5 (MRF-Co-AD-LF)0.190.04969.535.57−0.030.07
Scenario 6 (MRF-In)0.520.041679.90944.56−0.05−0.01
Disclaimer/Publisher’s Note: The statements, opinions and data contained in all publications are solely those of the individual author(s) and contributor(s) and not of MDPI and/or the editor(s). MDPI and/or the editor(s) disclaim responsibility for any injury to people or property resulting from any ideas, methods, instructions or products referred to in the content.