Abstract
Concrete is a worldwide construction material, but it has inherent faults, such as a low tensile strength, when not reinforced with steel or other forms of reinforcement. Various innovative materials are being incorporated into concrete to minimise its drawbacks while concurrently improving its dependability and sustainability. This study addresses the research gap by exploring and enhancing the utilisation of glass fibre (GF) concerning its mechanical properties and reduction of embodied carbon. The most significant advantage of incorporating GF into concrete is its capacity to reduce the obstruction ratio, forming clusters, and subsequent material solidification. The study involved experiments wherein GF was incorporated into concrete in varying proportions of 0%, 0.5%, 0.75%, 1%, 1.25%, 1.50%, 1.75%, and 2% by weight. Mechanical tests and tests for durability were conducted, and Embodied carbon (EC) with eco-strength efficiency was also evaluated to assess the material’s sustainability. The investigation found that the optimal percentage of GF to be used in concrete is 1.25% by weight, which gives the optimum results for concrete’s mechanical strength and UPV. Adding 1.25% GF to the material results in increases of 11.76%, 17.63%, 17.73%, 5.72%, and 62.5% in C.S, STS, F.S, MoE, and impact energy, respectively. Concrete blended with 1.25% of GF has the optimum value of UPV. The carbon footprint associated with concrete positively correlates with the proportion of GF in its composition. The optimisation of GF in concrete is carried out by utilising the response surface methodology (RSM); equations generated through RSM enable the computation of the effects of incorporating GF in concrete.
1. Introduction
Concrete is widely used as a building material owing to its durability, strength, and affordability [1]. Concrete exhibits a high compressive strength (CS) but a relatively low tensile strength (T.S.), rendering it a brittle and potentially fragile material [2]. In recent years, extensive research has been conducted to address this issue, resulting in the utilisation of various materials in concrete to enhance its strength. Recently, there has been a growing interest in fibre-reinforced concrete, in which fibres are used in concrete to improve its stability [3,4]. FRC is a composite mix of a cementitious matrix and discrete fibres [5]. The incorporation of fibres into the concrete mixture results in the augmentation of its strength, toughness, and flexibility [6].
Additionally, this process enhances the concrete’s ability to withstand impact, cracking, and other forms of failure [7]. Various fibre types are currently under investigation for their potential positive effects on concrete strength [8]. These include PVA (Polyvinyl alcohol) fibre, fibre of carbon, jute fibre, steel fibre, nylon fibre, basalt fibre, coir fibre, and glass fibre [9]. Previous studies have indicated that incorporating various materials, such as fibre-reinforced polymer, into the concrete mixture can enhance the strength of the concrete [10,11,12]. The incorporation of fibres into the cementitious matrix results in the suppression of crack propagation within the material. This phenomenon decreases the probability of fracture occurrence under external stress, thus averting the failure of the matrix [10]. Several researchers experimented using glass, carbon, asbestos, and polypropylene. Furthermore, filaments serve a crucial role in preventing the formation of micro cracks at the mortar–aggregate interface. Before reaching its ultimate point of failure, the phenomenon, as mentioned earlier, transforms an inherently vulnerable substrate, such as cement concrete, with limited tensile strength and impact resistance, into a durable composite material with enhanced fracture resistance, increased malleability, and unique post-cracking characteristics [9,10,11].
Glass-fibre-reinforced polymer, often known as GFRP, is chosen over other polymer forms due to its high ratio of surface area to weight and strong tensile qualities relative to its unit cost [13,14]. In the 1950s, fibreglass concrete, a composite comprised of a concrete matrix and reinforcing GF, was first used in Russia [15]. However, the relatively high cost, low resistance to an alkaline environment, and lack of in-depth studies of the material’s physicochemical parameters, which have a significant impact on the vitality, deformation characteristics, and toughness of GFRC (GF-reinforced concrete) structures, prevented the widespread use of the material in the building industry [16]. Following the development of fibre resistant to Alkali, the utilisation of GFRC (GF-reinforced concrete) in the construction sector has gained momentum [17]. This progression ensued after manufacturing GF. The substance above exhibits several benefits, such as heightened immunity to corrosion, a significantly reduced mass relative to concrete reinforced with fibres, and enhanced tensile potency in contrast to standard concrete [18]. Due to its matrix, fibre glass concrete can be employed in diverse settings, such as fortifying buildings and other structural frameworks [19]. When devising techniques for reinforcing reinforced concrete and concrete structures in chemical and oil refineries, it is crucial to employ repair materials with enhanced corrosion resistance, high strength, and adhesive properties. These characteristics must be present in the materials used for restorations [20]. Studies have been conducted on the strength characteristics of GFRC (GF-reinforced concrete) utilising GF, produced by Saint-Gobain Vetrotex. Studies have been performed on goods from Chinese manufacturers used in repairs [21].
Kasagani et al. (2018) [22] performed an initial examination of M30 concrete, utilising differing proportions of mono GF with volume (ranging from 0.1% to 0.5%) and fibre lengths of 3 mm to 20 mm. The combination of stress reinforcement and practicability is achieved using graduated fibres [23,24,25,26]. Graded fibres have been found to modify the stress and strain behaviour of GFRC. An analysis was conducted on the flexible power of GFRC using measurements of fibre capacity characteristics. Compared to MGRFC, there is a greater degree of energy distortion and increased efficiency in power absorption. The figure’s illustration indicates that fibre-reinforced composites may experience fibre capacity concerns. The study performed by Arif Ulu et al. [27] found that adding GF to concrete reduces the density of concrete by including GF content in concrete, and also, the compressive and flexural strength of concrete reduces by adding GF.
The study by Jawad Ahmad et al. (2022) [28] revealed that incorporating GF into concrete decreased slump. This can be attributed to the increased surface area of the fibres, which subsequently resulted in heightened resistance to flowability. Concrete exhibits notable enhancements in its tensile and flexural strength, augmenting its capacity to withstand cracking. This, in turn, reduces its permeability and renders it a viable option for deployment in marine settings. The crucial consideration of the impact of GF on concrete necessitates a critical examination of the water content in the concrete. In one of the most recent studies, it was found that GFRP (glass-fibre-reinforced polymers) increases the beam cracking load up to 27%, consequently resulting in increasing the moment of inertia of shafts by 33% to 75% with a fibre content of 5 to 10% [29].
Limited studies have been carried out on using Alkali-resistant GF in concrete to investigate the mechanical properties of concrete, and also, an environmental assessment of concrete blended with GF has never been performed as per the available literature. To fill this gap in the literature, this study aims to carry out a series of experiments to study the effect of GF on concrete’s mechanical characteristics and its impact on the environment by evaluating the embodied carbon (EC) and eco-strength efficiency (ESE). Based on the model developed using RSM, equations are also generated for predicting the mechanical and environmental properties of concrete containing GF. This research specifically focused on reinforcement and its impact on the phenomenon under investigation. The study’s primary objective is to explore the effectiveness of support (GF) in concrete mechanical strength and its effect on the environment; by narrowing the focus to specific factors, this study aims to establish a clear and direct relationship between GF and observed outcomes.
2. Design of Experiments
2.1. Background
The empirical evidence suggests that the Design of Experiments (DoE) is a potent approach for handling diverse inputs and streamlining the decision-making process concerning various alternatives. Numerous commercial and industrial sectors and service providers have adopted this methodology to improve the efficacy of experiments. In the past, the OVAT (one variable at a time) method has been utilised to address complex problems by separating distinct elements and evaluating each separately [30,31]. This experimental strategy involves holding all variables constant except for the variable of interest and undertaking multiple experiments to obtain optimal results for the investigated variable. The iterative method is used to solve for each variable until the correct solution is found, taking into account the problem’s inherent multiple variables. This is achieved through consideration of the issue’s intrinsic factors. While the methodology is precise and uncomplicated, it requires big datasets and an assortment of trials, both resource-intensive and time-consuming, necessitating substantial labour. This poses a significant challenge for investigating construction materials such as concrete. The present study differs from prior research that concentrated on a solitary response parameter, such as magnitude or volume, by exploring the interdependence among various response parameters. The current study seeks to investigate all response variables associated with concrete properties within the context of material substitution.
Various interdependent criteria influence the overall performance of high-strength and SCC (self-consolidated concrete). By elucidating the effect of discrete components on the investigated response variable, the design of the experiment has effectively reduced the quantity of data required for statistical modelling to produce desirable results. Scholars with insufficient subject knowledge and an ill-defined approach to problem-solving may need help tackling the wide variety of DoE analyses. The DoE has been extensively employed to study construction materials in contemporary times. The DoE has been involved in multiple stages of concrete research, encompassing the assessment of concrete durability and the design of concrete composition formulations. The limitations of NDT outcomes in assessing the potency of concrete necessitate the utilisation of numerical equations in specific scenarios during the non-destructive testing (NDT) of traditional concrete.
In this scenario, it is customary to utilise the method of simple linear regression (SLR) in conjunction with a scatter plot. Novel evaluation methods such as the Response Surface Method have emerged as valuable tools for producing exact and comprehensive predictions. The efficacy of the DoE protocols for identifying feasible alternatives to materials has been noteworthy. Various Design of Experiments (DoE) methodologies have been employed to assess the effectiveness of different alternative materials, such as tyre rubber and fly ash. Previous studies have utilised diverse research methodologies such as response surface analysis, curve-fitting techniques, and artificial neural network-based approaches to enhance novel concrete design techniques that frequently integrate traditional environmental waste constituents.
2.2. Response Surface Methodology
RSM is a prevalent experimental design technique employed in research. This methodology analyses the effects of multiple response variable factors and their interactions. RSM is a statistical approach used to construct a model and optimise the correlation between input variables and their associated outcomes [32,33]. This approach is frequently used in academic investigations to determine the most effective amalgamation of input factors that generate the intended result. Response surfaces are commonly employed in engineering, chemistry, and physics to model and optimise input variables in various scenarios. These surfaces are used to replicate and assess the impacts of diverse input variables and ultimately ascertain the best amalgamation of variables for attaining maximum output. This study adopted a research approach similar to the Taguchi strategy, with the primary objective of streamlining the testing process and enhancing the success rate. The Response Surface Methodology (RSM) is a mathematical and statistical technique that forecasts the correlation between the input and output variables. By executing RSM-planned experiments with the input variables, it is possible to foresee the nature of this relationship.
This investigation utilised the optimal design option for modelling and optimising GF. The optimum design option in RSM is the technique or strategy used to identify the optimal settings for input variables to attain the anticipated output. Depending on the nature of the problem and the objectives of the research or study, the optimal design option may employ several distinct methods. The most common approach in optimal Design is to utilise the response surface model to develop the contour plot. The contour relationship between input and output variables can be observed through that plot. The setting of optimal design options can be identified by determining the point at which output response increases or decreases.
The advanced optimisation approach is utilised to optimise responses, such as a multi-objective optimisation process and robust optimisation of input variables; this strategy can reach equilibrium among many competing goals or include the impacts of uncertainties in both the input variables and the response model. Both of these outcomes are possible with the use of this method.
3. Materials and Methods
3.1. Materials
For this investigation, since GF is one of the necessary components that must be incorporated into concrete, it was sourced from regional suppliers. Due to the necessity of the ingredient, no concessions were made throughout procuring the materials. It is crucial to consider the properties of GF when its application in concrete is required. Durability, the condition of the material, and environmental exposure were significant considerations when purchasing materials. For this study, alkali-resistant GF, also known as alkali-purchased, has a size of 36 mm. These fibres are fundamentally resistant to Alkali, which can degrade the fibre over time and lead to a loss of strength. In concrete, A.R. glass is used for durability.
Additionally, the local vendor used and bought ordinary Portland cement Type I. In the current experiment, micro silica that was purchased from a local supplier was used. After that, the necessary material was made available, and it was analysed for its density in addition to its other relevant qualities. According to the study’s findings, the substance’s features have a tight relationship with a decreased capacity for water absorption and an improved ability to permeate materials with a given particle size or diameter. The results of this inquiry into its qualities led to the revelation of this fact. The choice of the coarse aggregate provider came from within the immediate neighbourhood of the construction site. For the research, fine aggregate readily accessible in the area was used. Regional sources provided a superplasticizer with 1200 kg/m3 density to make the self-compacting concrete used in manufacturing. The superplasticizer’s primary purpose was to satisfy the water requirements of the concrete.
3.2. Mix Proportioning
A controlled concrete mixture was formulated by the directives outlined in ACI 211.1-91, devoid of any GF component. Mix proportioning with varying percentages of GF was developed using the RSM design Expert 13 software, and the findings of each model were verified by applying ANOVA. GF was used as the input and independent variable; the RSM methodology entails modifying the independent variable being investigated, analysing the natural effect of this manipulation on the variable being studied, and utilising the optimal design option that was available inside the design expert 13 software allowed for the production of the mix percentage. The percentage of GF varies from 0% to 2%. The output variables for this study include the CS, STS, FS, MOE, Embodied carbon (EC), and Eco-strength efficiency (ESE). All the other materials were kept constant, such as cement, FA (fine aggregate), silica fume, CA (coarse aggregate), superplasticizer, and water. RSM has developed different proportions with varying percentages of GF, shown in Table 1.

Table 1.
Mix proportioning by RSM.
3.3. Preparation of Samples
A circular drum mixture was used for mixing the materials. All dry materials were mixed properly in the combination. After thoroughly incorporating all dried components, such as cement and aggregates, into the mix for at least two minutes, the procedure was completed by adding water and a superplasticiser. W/C was kept constant for all the combinations, which was approximately 0.26. This mixture was wholly incorporated into the mix, becoming concrete after a few minutes of agitation. The process of progressively scattering GF over the concrete while it was being prepared lasted several minutes and the entire time it was being designed. Following the accurate preparation of the concrete, specimens were fabricated. Samples exhibiting compressive strength, measuring 100 mm in length, 100 mm in width, and 100 mm in height, were produced as per the guidelines outlined in ASTM C78/C78M [34]. Similarly, split tensile strength specimens, measuring 100 mm in diameter and 200 mm in height, were fabricated according to the standards specified in ASTMC496 [35]. The samples were subsequently assessed on the 28th day following their creation. The FS of the specimen was evaluated by conducting a test by the ASTM C78/C78M-21 standard [36]. For the modulus of elasticity, the cylindrical sample with a height of 300 mm and diameter of 100 mm was cast in compliance with ASTM C469 [37] and tested on the 28th day of casting. As per the code, Equation (1) is utilised to calculate the MoE. For the impact resistance test, samples with a diameter of 100 mm and a height of 50 mm were prepared for the ACI544 [38] drop mass test in which a 4.5 kg ball is dropped from the specific elevation of 457 mm onto the specimen [27]. Figure 1 shows the samples and testing machines utilised for performing tests and Table 2 displays the codes followed for investigations. Equation (1) [28].
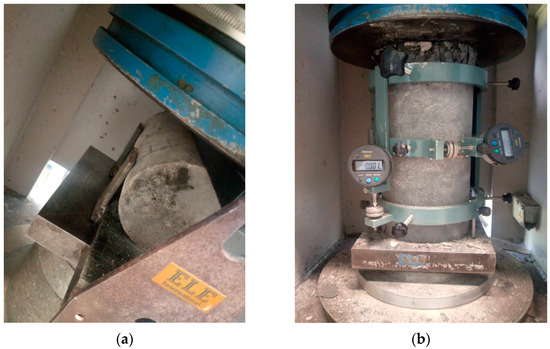
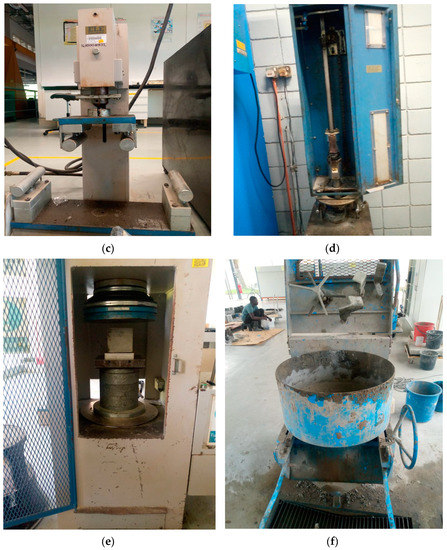
Figure 1.
Samples testing for (a) STS, (b) MoE, (c) FS, (d) IR, (e) CS, and (f) mixing.

Table 2.
Codes and specifications.
E = modulus of elasticity.
σ1 = The stress corresponding to 40% of the ultimate load (MPa).
σ2 = The stress corresponding to a longitudinal strain of 0.00005 (MPa).
ε2 = Lateral strain at the mid-height of the specimen at a stress of .
4. Results and Discussion
4.1. Mechanical Properties
4.1.1. Compressive Strength
Figure 2 depicts GF’s compressive strength (CS) at different percentages. The experimental results indicate that the control mixture containing no GF exhibits a compressive strength of approximately 52 MPa. As GF is added to the concrete, it can be seen that strength increases to some extent. By adding 0.50% of GF, CS is enhanced by 3.36%. Further inclusion of GF of approximately 0.75% increases the strength by 5.76%. If the amount of GF is increased to 1%, CS is increased by 9.30% in contrast to the control mix, while blending the concrete with 1.25% of GF enhances the CS by 11.76%. Further inclusion of GF in concrete results in the depletion of CS. Adding 1.5% of GF increases the strength by 11.52%, less than GF1.25%. GF1.75% increases the strength by 8.26% by adding 1.75% of GF. GF2% has less strength than other proportions containing GF. In GF2%, including 2% of GF increases the strength by 5.13%. According to the study by Mastali et al. [39], 1.25% of GF in concrete is the optimal percentage for compressive strength, which is also supported by this investigation. It has been discovered that incorporating GF into concrete improves the material’s microstructure, thereby reducing the formation and size of microcracks. This ultimately increases the concrete’s density and compressive strength [40]. When GF is incorporated into concrete, its high energy absorption capacity dissolves energy during compressive deformation. The energy absorption property evidenced by GF increases the overall toughness of concrete, allowing it to withstand high compressive forces [41]. A study conducted by T. Thaker et al. [42] concluded that adding 1.2% of GF to concrete improves compressive strength by 21.2%.
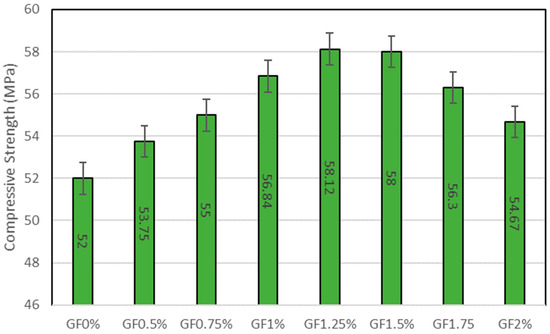
Figure 2.
Compressive strength.
4.1.2. Split Tensile Strength
The split tensile strength (STS) of each proportion is illustrated in Figure 3. Based on the results, it is evident that the control proportion exhibits a split tensile strength of 4.99 MPa. The incorporation of GF results in an improvement in split tensile strength. As per the investigation, adding 0.50% of GF to concrete increases the STS by 3.20%, further increasing the GF content to 0.75% increases the STS by 8.81%, and raising the quantity of GF to 1% results in an increase in STS of 13.62% in comparison to the control sample. If the GF amount is increased to 1.25%, STS is increased by 17.63%. Adding 1.50% of GF enhances the STS by 15.43%, which shows that 1.25% of GF is the optimum amount of GF that increases the strength by 17.63%. Further addition of GF results in the depletion of STS. If the content of GF is augmented to 1.75%, strength increases by just 8.81%. A 2% addition of GF in concrete increases the strength by 6%. As per the study’s findings and experimental data, it can be seen that 1.25% of GF is the ideal percentage of GF to be used in concrete, which provides the maximum strength, but more increases in the amount of GF results in the depletion of strength. As per the investigation performed by Kushartomo et al. [43], the optimum percentage of GF to be used in concrete is 2%, at which the split tensile strength (STS) is maximum. The accumulation of fibres in concrete has led to a reduction in the propagation of fractures, which has led to an increase in the material’s resistance to injury under tensile forces [44]. Utilising glass fibre reinforcement (GF) in concrete structures facilitates load dispersion over a larger surface area, thereby transferring tensile stresses to a larger region. This phenomenon effectively mitigates the likelihood of concrete fracture by reducing the tension concentration. GF acts as a bridge between fractures and their propagation, inhibiting their growth. This mechanism for preventing cracks also increases the split tensile strength of concrete [40]. A study by T. Thaker et al. [42] concluded that adding 1.2% of GF to concrete enhances the split tensile strength by 14.48% in contrast to the control sample.
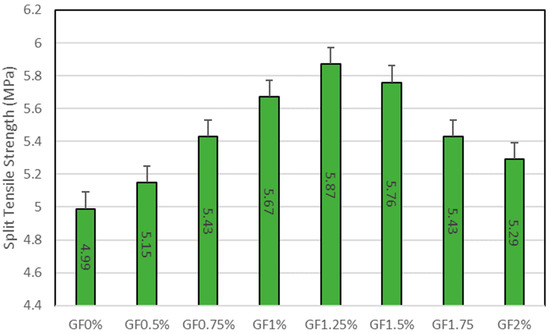
Figure 3.
Split tensile strength.
Figure 4 provides a graphical representation of the relationship between concrete’s compressive and split tensile strengths. The coefficient represented by the variable “R” denotes a significant relationship between concrete’s compressive and tensile strengths. The equation depicted in Figure 4 regarding the correlation between STS and CS can be used to determine either the STS or the CS if one of the two is already known.
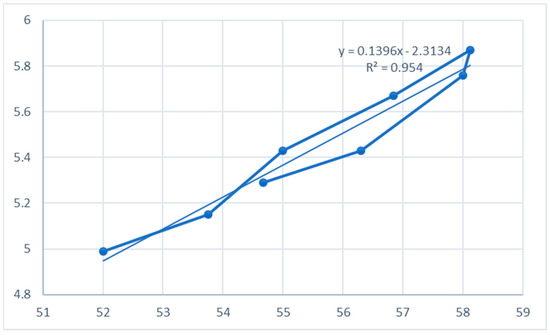
Figure 4.
Correlation between STS and CS.
4.1.3. Flexural Strength
Experimental data for the flexural strength of concrete blended with GF is shown in Figure 5. It is clear from the findings that the inclusion of GF in concrete increases the FS control mix with 0% of GF content having a minimum FS of approximately 4.23 MPa. Including 0.50% of GF results in a 7.56% increase in the FS. GF0.75%, in which 0.75% of GF is added to the concrete, enhances the strength by 9.92%. The inclusion of 1% of GF shows a 13.00% rise in the FS content of GF. When the inclusion is increased to 1.25%, the FS is increased by 17.73%, which is the optimum percentage to be added, and the maximum rise in FS can be seen by adding 1.25% in contrast to the control sample. Further addition of GF in concrete results in decreased FS, which can be seen in GF1.5% by adding 1.5% of GF. By increasing the amount of GF to 1.75%, FS is reduced compared to GF1.25%. GF1.75% has an FS 10.87% more than the control sample, and the GF2% sample exhibits a strength approximately 8.27% greater than that of the reference sample. A study by Mastali et al. [39] found that, regarding the increase in flexural strength, the GF with a concentration of 0.75% in the specimen exhibited the highest rate. However, the GF with concentrations of 1.25% and 0.75% in the samples demonstrated optimal initial fracture and ultimate impact resistance performances, respectively. The incorporation of glass fibre into concrete has been observed to enhance its flexural strength owing to the ability of GF to facilitate the transfer of load to diverse regions of the material and the consequent distribution of the load over a wider surface area. The load-transferring mechanism employed by GF serves to mitigate the stress concentration at discrete locations and confer resistance against flexural stresses [42]. GF in concrete creates a 3-dimensional network providing more strength and stiffness; this reinforcement helps reduce the cracks, distribute the loads, and enhance the overall flexural strength of concrete [22]. A study conducted by T. Thaker et al. [42] concluded that adding 1.2% of GF increases flexural strength by 10.15% compared to the control sample, and this is the optimum percentage to be used in concrete.
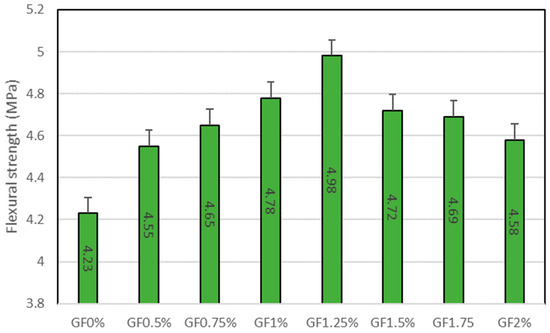
Figure 5.
Flexural strength.
4.1.4. Modulus of Elasticity
The modulus of elasticity of concrete was investigated as per ASTM C469 [37]; for calculation, the MoE Equation (1) was utilised. The findings on the modulus of elasticity of concrete with different proportions of GF are presented in Figure 6. It is indicated that incorporating GF into concrete yields a beneficial impact on the material’s MOE (modulus of elasticity). The MOE of the control sample containing zero per cent GF is approximately 33.89 GPa, while adding 0.50% GF to concrete boosts its strength by 1.66%. The MOE increases by 2.84% when 0.75% GF is added. Including 1% GF in GF1% increases the modulus of elasticity by 4.55%. The utmost increase in MOE that can be achieved by adding 1.25% GF is 5.72%. The incorporation of additional GF diminishes the MOE. Compared to GF1.25%, GF at 1.5% increases the MOE by 5.61%. GF1.75% has an MOE that is 14.05% points higher than the control sample, while GF2% has an MOE of 2.53% points; thus, introducing more GF than 1.25% reduces the MOE. The GF has high rigidity because it can resist deformation [43], which increases the MOE of concrete. An excessive amount of GF in concrete lessens the MOE due to the formation of clusters that reduces the workability and cohesiveness of concrete. At high concentrations of GF of more than 1.25%, the increased abundance of fibres can potentially disrupt the concrete matrix’s internal structure. This disturbance can produce fissures, micro-cracks, or interfacial defects, compromising the structural integrity of the composite material and lowering its modulus of elasticity.
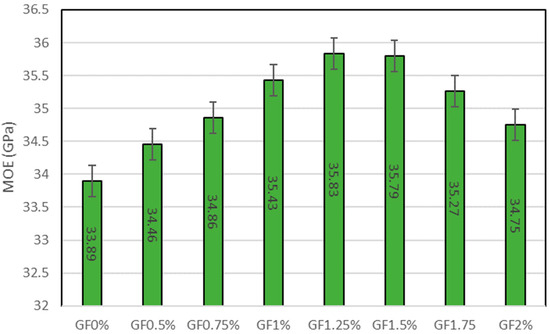
Figure 6.
Modulus of Elasticity (MOE).
4.1.5. Impact Resistance
Table 3 depicts the number of blows at which each sample reached its initial and ultimate crack. It can be seen that the control mix has the minimum resistance to impact loading. The addition of GF has enhanced the ability of concrete to resist sudden impact on concrete. The inclusion of GF shows a positive effect by improving the impact resistance, as can be seen in Figure 7, with up to 1.25% addition of GF. Moreover, 1% and 1.25% can be considered the optimal percentages of GF that can be used to provide a higher degree of resistivity to sudden impact loadings on concrete. Further addition of more than 1.25% GF results in a declination of resistance to impact. Impact energy is also evaluated in Table 3 and Figure 7. The results show that the control mix has the minimum energy for both initial and final cracks, which are 2467.8 and 3475.48 J, respectively. Including 0.50% of GF, the impact energy for initial and final cracks increases by 25% and 13.01%. Further addition of 0.75% enhances the impact energy by 37.5% and 20.11%. Moreover, 1% of GF in concrete increases the impact energy by 55.83% and 41.42% in contrast to the control sample. Adding 1.25% of GF in concrete increases the impact energy by 62.5% and 45.56%; this is the maximum impact energy among all the mixes. Further addition of GF results in a decline in impact resistance; this is due to the excessive content of fibre, because of which fibres are not properly bonded with the cement matrix in surroundings, resulting in weak interfacial bonding.

Table 3.
Number of blows to initial and final cracks with impact energy.
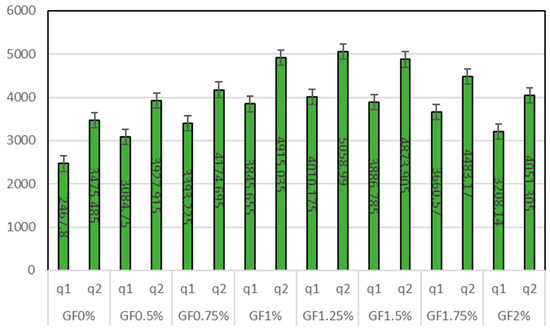
Figure 7.
Impact Energy.
4.2. Durability
Ultrasonic Pulse Velocity
We employed a non-destructive test to examine the concrete’s quality, durability, and integrity. Ultrasonic pulse travel time measurement is a technique that can assist in identifying areas within concrete structures that exhibit reduced strength, cracking, or delamination. Figure 8 depicts the UPV of mixes with varying amounts of glass fibre. The value of UPV is between 447 m/s and 452 m/s. The control mix has the lowest UPV of 447 m/s, whereas GF0.5% with 0.50% of GF has a UPV value of 449 m/s. Further addition of GF content results in an increase in UPV, which shows that the addition of GF also increases the UPV to an optimum percentage. Beyond that, UPV starts to decline. It can be seen that GF1.25% has the maximum UPV of 452 m/s, which is approximately 1.11% more than the control mix; adding more GF beyond 1.25% results in a reduction in UPV, which shows that 1.25% is the optimum percentage to be used in concrete for better durability, better integrity, and fewer defects. A study carried out by Sandeep L. Hake et al. [45] shows that all the mixes containing various proportions of GF exhibit superior UPV, which shows that it improves the quality of concrete and concrete exhibits higher velocity due to its density, homogeneity, and uniformity in comparison to other materials. The inclusion of GF improves the UPV, which may be because of the enhanced bonding between the GF, cement matrix, and aggregate particles. GF has a high density as it is added to concrete. It also increases the overall density of concrete, which UPV increases. UPV starts declining after some extent due to fibre clustering in concrete and inadequate bonding between cementitious materials, the aggregate, and GF.
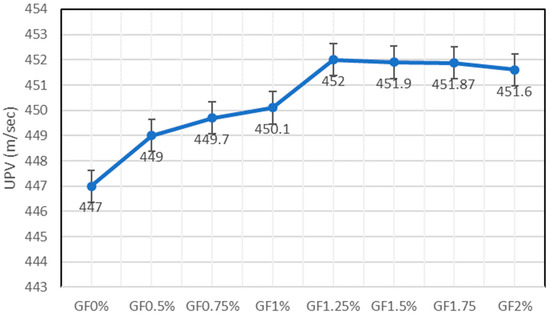
Figure 8.
Ultrasonic pulse velocity.
Figure 9 shows the correlation between the compressive strength of concrete and UPV. The value of R2 indicates that there is a solid relationship between both UPV and compressive strength. The equation in Figure 9 can be used to estimate the value of UPV or compressive strength if either of them is known. “X” in this equation represents the compressive strength, while “Y” is the value of UPV.
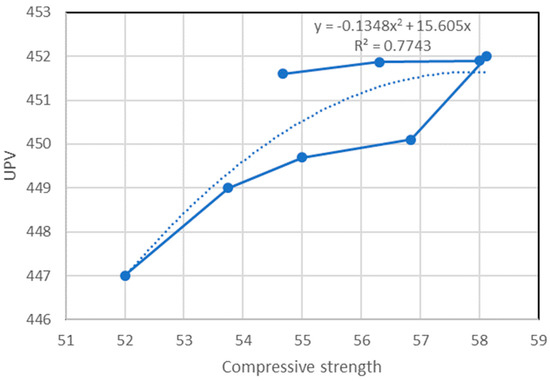
Figure 9.
Correlation between UPV and Compressive strength.
4.3. Assessment of Sustainability
4.3.1. Embodied Carbon
The calculation of embodied carbon for each substantial proportion containing different percentages of GF has been conducted through a comprehensive literature review. The embodied carbon factor for each material was taken from the available literature review, as shown in Table 4.

Table 4.
Embodied carbon factors.
Figure 10 displays the embodied carbon for each proportion. It shows that the accumulation of GF in concrete increases the embodied carbon. The embodied carbon of the control mix is 499.3 Kg·CO2/kg. The accumulation of 0.50% GF in concrete has an embodied carbon of 503.53 Kg·CO2/kg more than the control sample. Further inclusion of 0.75% GF has embodied carbon of 505.65 Kg·CO2/kg. The control mix has the minimum embodied carbon, and GF2% with 2% of GF has the maximum embodied carbon of approximately 516.24 Kg·CO2/kg, which is 3.39% more than the control sample, which is justifiable because of GF’s high embodied carbon factor.
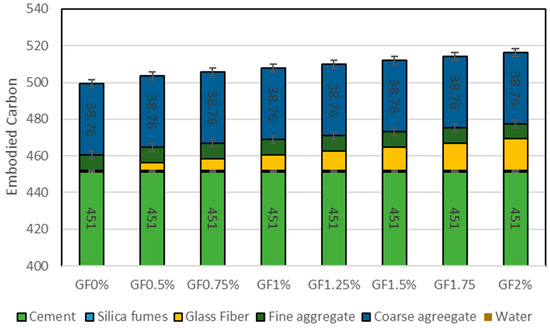
Figure 10.
Embodied Carbon (EC).
4.3.2. Eco Strength Efficiency
Concrete cannot be selected only because its low embodied carbon is more sustainable, so the selection of concrete’s eco-strength efficiency should be considered. Eco-strength efficiency (ESE) is the evaluation of the environmental sustainability of concrete based on the proportion of its mechanical strength to its embodied carbon footprint. This research seeks to evaluate the effectiveness of concrete in terms of its mechanical performance while minimising its environmental impact. This study computed the ESE (Effective Stress Exerted) values for various concrete formulations containing variable amounts of glass fibre. Eco-strength efficiency is the ratio of CS (compressive strength) and EC (embodied carbon) of concrete. The compressive strength of concrete is considered to calculate the eco-strength efficiency as it is the principal mechanical property of concrete that is considered while selecting the concrete. Figure 11 shows the eco-strength efficiency (ESE) of concrete, and it can be seen that the control mix has the lowermost ESE of approximately 0.104 MPa/kgCO2·m3. Eco-strength efficiency increases with increases in GF up to 1.25% of GF inclusion, which has the maximum eco-strength efficiency. GF1.25% has 9.44% more ESE than the control sample. As the content of GF rises more than 1.25%, ESE decreases. GF1.5% with 1.5% of fibre inclusion has an ESE 8.77% higher than the control mix, and GF 1.75% increases the ESE by 5.14%. Blending concrete with 2% fibre increases the ESE by 1.68%. GF1.25% is recommended as it has the highest ESE among all the mixtures.
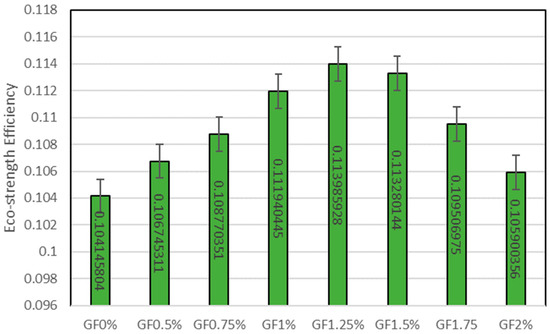
Figure 11.
Eco-strength efficiency (ESE).
5. ANOVA (Analysis of Variance)
Employing the RSM model, Table 5 examines GF’s impact on the hardened qualities of concrete and evaluates the material’s potential to be sustainable. This method is well-known for its increased accuracy and dependability [53]. The RSM experimental dataset analysed multiple regressions in the context of this specific research. The tabular data presented herein depict the ANOVA results obtained from the anticipated model utilising the optimal design alternative. The statistical significance level for the sum of squares (S.S.), p-values, and F-value is 0.005 [54]. The statistical significance of each component is assessed using p-values of 0.05 and 0.01 [55]. The values above suggest good concordance between the observed and anticipated values. The ANOVA analysis findings indicate that the input component demonstrates model p-values equal to or lesser than 0.005 [56,57]. After 28 days of curing, the RSM model produced F-values of different concrete properties. The study determined the F-values for various properties of concrete, including CS, STS, FS, MoE, UPV, EC, and ESE. The obtained F-values were 52,976.01, 1087.28, 78.02, 42,321.97, 120.46, 3.822 × 10⁷, and 34,273.33, respectively. Table 5 presents the values mentioned earlier. The statement serves to emphasise the importance of the models that were obtained.

Table 5.
Results of ANOVA for each response.
Moreover, the model’s validity and efficacy are assessed using the lack of appropriate fits and diminished F values. The absence of fits implies the presence of fluctuations in the data in the vicinity of the model’s fitting region. When the p-value for Lack of Fit exceeds 0.005, it does not attain statistical significance. For CS, MoE, EC, and ESE, the fifth model was considered the best-suited model; for STS, the sixth model was considered the best-fit model; for FS and UPV, the quadratic model was suggested as the best-fit model. Model terms that are significant for compressive strength are A, A2, A3, A4, and A5; for split tensile strength, effective model terms are A, A2, A3, A5, and A6; effective model terms for flexural strength are A and A2. At the same time, for the modulus of elasticity, the model terms are A, A2, A3, A4, and A5. For UPV, they are A and A2. Furthermore, for embodied carbon, A, A2, A3, A4, and A5 are significant. Lastly, for eco-strength efficiency A, A2, A3, A4, and A5 are the model’s significant terms.
Table 6 displays a statistical evaluation of the model’s dependability and reliability. Various metrics can be employed to assess the trustworthiness of a model, such as the standard deviation and R2 values [58,59,60,61,62]. The term R2 is commonly called the coefficient of determination in the academic literature [23,63]. The R-squared value, denoted as R2, measures the level of agreement between the data and the model generated through the utilisation of response surface methodology (RSM) [61,64]. The value of R2 varies from 0–100% [22,29]. The greater the value of the R2 model, the higher the accurate [54,55]. For all the developed models in this investigation, it can be seen in the table that the value of R2 is near 0.9, which means that all the developed models have very high accuracy. The value of R2 for each response, including CS, STS, FS, MoE, UPV, EC, and ESE, is 0.9999, 0.9991, 0.9398, 0.9999, 0.9601, 0.9999, and 0.9999, respectively. Furthermore, the adequate precision for each response should be more than 4; the more critical the accurate precision, the more accurate the model will be. It can be seen that adequate accuracy for every response is more than 4; it also displays the reliability of models. The adequate precision for CS, STS, FS, MoE, UPV, EC, and ESE is 605.4968, 87.5383, 19.1229, 540.5094, 24.1984, 16,367.6796, and 471.9818.

Table 6.
Accuracy and dependability of the Response Surface Methodology (RSM) model.
Equations (2)–(8) can be used to predict the properties of concrete with varying amounts of GF. “A” in the equation represents the GF as an input variable. Using the factor-coded equation, estimating the response for predetermined values of each component is feasible. It is common practice to assign a matter of one plus to high levels of a factor and a value of one minus to low levels of the same component [65]. Using an encoded equation confers advantages in determining the relative impact of the components through the evaluation of the factor coefficients. We followed the procedures outlined previously to accomplish this. Figure 12, Figure 13, Figure 14, Figure 15, Figure 16, Figure 17 and Figure 18 present the predicted and actual models with normal plots of residuals for each response.
Compressive Strength = 56.8288 + 7.00432 ∗ A − 3.95621 ∗ A2 − 12.782 ∗ A3 + 0.462652 ∗ A4 + 7.11272 ∗ A5
Split Tensile Strength = 5.67723 + 0.945745 ∗ A − 0.646647 ∗ A2 − 1.46377 ∗ A3 − 1.14357 ∗ A4 + 0.668227 ∗ A5 + 1.25315 ∗ A6
Flexural Strength = 4.78475 + 0.182492 ∗ A − 0.384031 ∗ A2
Modulus of Elasticity = 35.4304 + 2.18387 ∗ A − 1.26565 ∗ A2 − 3.92697 ∗ A3 + 0.157147 ∗ A4 + 2.17275 ∗ A5
Embodied Carbon = 507.769 + 8.45748 ∗ A − 0.0277906 ∗ A2 + 0.0613384 ∗ A3 + 0.033847 ∗ A4 − 0.0538244 ∗ A5
Eco-strength Efficiency = 0.111917 + 0.0119095 ∗ A − 0.00791816 ∗ A2 − 0.0249211 ∗ A3 + 0.00102504 ∗ A4 +0.013889 ∗ A5
UPV = 450.501 + 2.44121 ∗ A − 1.12043 ∗ A2
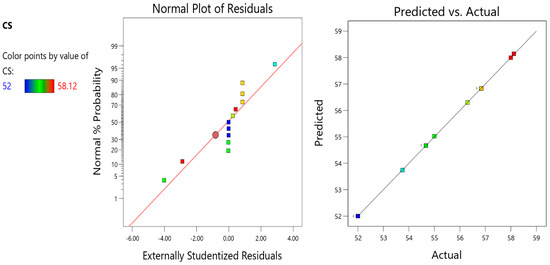
Figure 12.
The plot of residuals and plot of predicted and actual values for compressive strength.
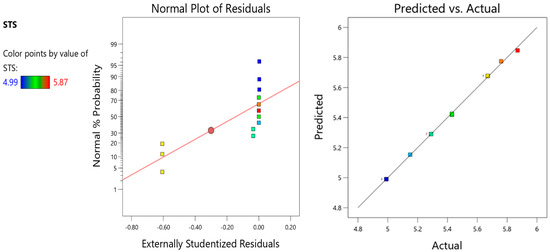
Figure 13.
The plot of residuals and plot of predicted and actual values for split tensile strength.
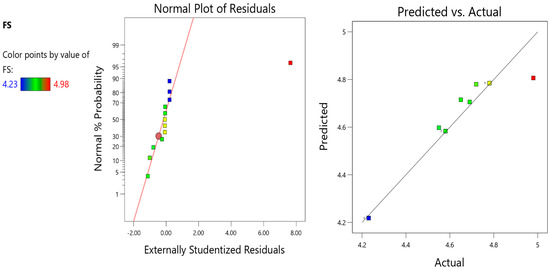
Figure 14.
The plot of residuals and plot of predicted and actual values for flexural strength.
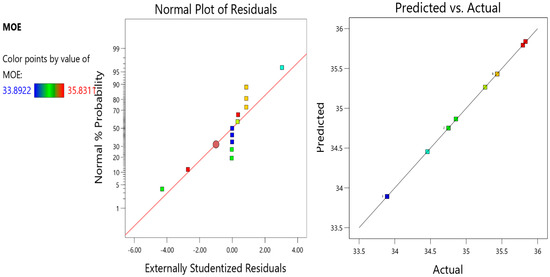
Figure 15.
The plot of residuals and plot of predicted and actual values for MOE.
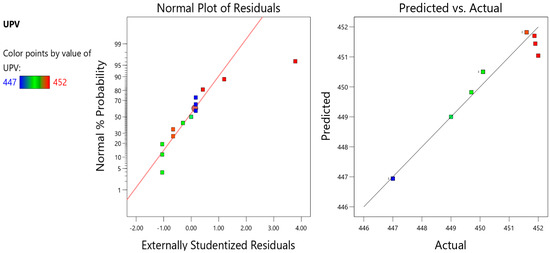
Figure 16.
The plot of residuals and plot of predicted and actual values for UPV.
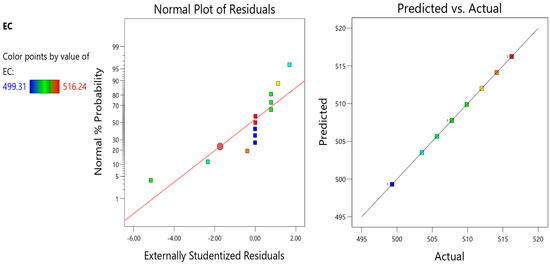
Figure 17.
The plot of residuals and plot of predicted and actual values for embodied carbon.
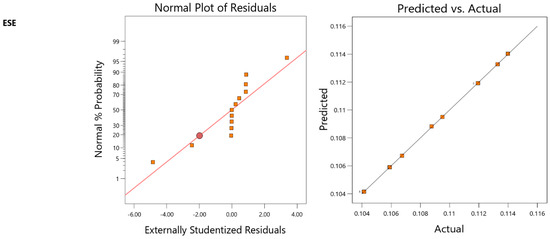
Figure 18.
The plot of residuals and plot of predicted and actual values for eco-strength efficiency.
6. Optimisation of Glass Fibre in Concrete Using RSM
It might be challenging to successfully obtain ideal values for numerous replies simultaneously. As a result, many approaches for multi-objective optimisation are used to maximise various outcomes. In this research, a compromised approach of optimisation was used for the numerous responses from eight participants. As was outlined previously, only one independent variable was included in this study: The amount of GF it contained. Six dependent variables were used: CS, STS, FS, MoE, EC, and ESE. The study utilised the Response Surface Methodology (RSM) to identify the most favourable amalgamation of factors to optimise the six variables. The study employed Design Expert version 13 to achieve an optimal design. Each variable and answer choice was associated with a certain degree of importance. A multi-objective optimisation methodology can yield a solution that closely approximates the upper and lower bounds that have been defined, as demonstrated in Table 7.

Table 7.
Optimisation of variables.
The standard for desirability is determined by the degree of similarity between the observed result and the proposed solution. To maximise potential outcomes, individuals should strive to maintain high attractiveness in their immediate environs. The total desirability value is 0.991, which is close to 1, which suggests that the optimisation response is feasible. With desirability of 0.991, response values for CS, STS, FS, MoE, EC, and ESE are 52.122, 4.969, 4.23, 33.93, 499.413, and 0.104. The optimised value of GF to be used in concrete is 0.0124. Different goals were set for all the input and output factors for the optimisation process. The goal for GF, CS, FS, and MoE is in range, while the goal for split tensile strength, EC, and ESE was minimised (Figure 19 and Figure 20).
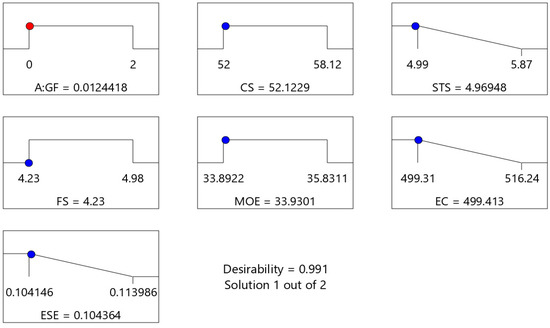
Figure 19.
Ramp diagram for optimisation of variables.
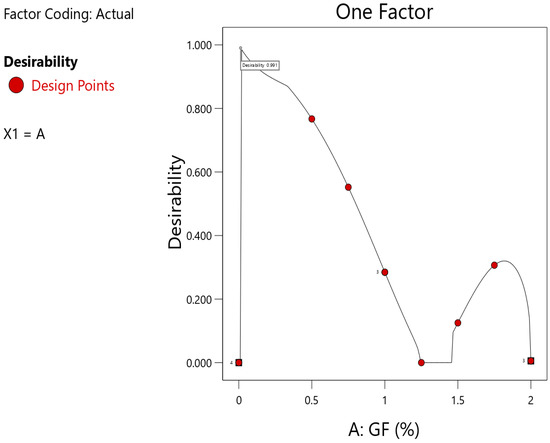
Figure 20.
One-factor diagram for desirability for optimisation of concrete blended with GF.
7. Validation of Model Developed by RSM
The optimised proportion of GF achieved by the optimisation process through RSM was to validate each model. As per the optimisation, the optimised value of GF is 0.0124. The experiments were conducted as per the optimised value, and mechanical strength was then compared with the optimised value for each response; the margin of error is less than 5%, showing that each model is highly optimised and accurate. Equation (9), mentioned below, calculates the error between experimental and predicted values. Table 8 represents the difference between predicted and observed values.

Table 8.
Validation of models.
8. Conclusions
The principal aim of this study was to examine the impact of glass fibre (GF) on the mechanical characteristics of concrete with different proportions of GF. RSM was utilised to design the experimental setup, and by using the RSM, models of each response were generated to forecast and predict the optimal values for each response. GF was optimised to find the optimal value of GF to be used in concrete. Then, according to the optimised value of GF, experiments were conducted to validate each model generated by RSM. The main findings from this investigation are as follows:
- According to the study, the optimum percentage of GF to be used in concrete is 1.25%, which results in increasing the compressive strength (CS), split tensile strength (STS), flexural strength (FS), and modulus of elasticity (MoE) by 11.76%, 17.63%, 17.73%, and 5.72%, respectively.
- Increasing the GF content increases the embodied carbon; a proportion containing 2% of GF has the maximum embodied carbon, while concrete containing 1.25% GF has the highest ESE.
- The addition of GF has shown a significant improvement in the sudden impact. Specifically, 1.00% or 1.25% inclusion of GF is the optimal percentage with high resistance to sudden impacts on concrete.
- For the assessment of concrete’s quality and integrity, the UPV test was conducted, which shows that all the proportions with varying quantities of GF improved the value of UPV, which means GF addition in concrete improves its quality. Concrete containing 1.25% of GF has the maximum UPV.
- For CS (compressive strength), MoE (modulus of elasticity), EC (embodied carbon), and ESE (eco-strength efficiency), the fifth model is declared as the best-fit model. For STS (split tensile strength), the sixth model is declared the best-fit model. The quadratic model is deemed the most suitable fit for flexural strength (FS).
- The value for the coefficient of determination (R2) for CS (compressive strength), STS (split tensile strength), FS (flexural strength), MoE (modulus of elasticity), EC (embodied carbon), and ESE (eco-strength efficiency) are 0.9999, 0.9991, 0.9398, 0.9999, 0.9999, and 0.9999, respectively.
- The optimised values obtained via the process of optimisation of each response using RSM are 0.0124, 52.122, 4.969, 4.23, 33.93, 499.413, and 0.104 for CS (compressive strength), STS (split tensile strength), FS (flexural strength), MoE (modulus of elasticity), EC (embodied carbon), and ESE (eco-strength efficiency).
- The validation process shows that the margin of error among experimental and anticipated values is less than 5%, which shows that the model developed by RSM for each response is highly accurate.
Author Contributions
Conceptualisation, M.B.K., N.S. and A.W.; methodology, H.T. and M.B.K.; software, M.B.K.; validation, M.B.K., H.R.A. and D.R.; formal analysis, D.R. and O.B.; investigation, M.B.K. and H.R.A.; resources, N.S.; data curation, M.B.K.; writing—original draft preparation, H.T. and M.B.K.; writing—review and editing, M.H.N.; visualisation, A.W. and M.B.K.; supervision, D.R., O.B. and N.S.; project administration, N.S. and A.W.; funding acquisition, N.S. All authors have read and agreed to the published version of the manuscript.
Funding
This study is supported via funding from Prince Sattam bin Abdulaziz University project number (PSAU/2023/R/1444).
Institutional Review Board Statement
Not available.
Informed Consent Statement
Informed consent was obtained from all subjects involved in the study.
Data Availability Statement
Data related to this research are not available for public access.
Acknowledgments
The authors thank Rj Intan Shafinaz (lab attendant at the Civil engineering department) at Universiti Teknologi Petronas for helping to conduct the experiments.
Conflicts of Interest
The authors declare no conflict of interest.
References
- Alam, M.; Ahmad, S.I. Concrete and It’s Properties; Bangladesh University of Engineering and Technology (BUET): Dhaka, Bangladesh, 2020. [Google Scholar] [CrossRef]
- Aydın, F.; Akyürek, M.; Arslan, Ş.; Yılmaz, K. Effects of concrete cover thickness and concrete strength on temperature transfer in high temperature exposed FRP reinforced concrete. Rev. Constr. 2023, 22, 242–258. [Google Scholar] [CrossRef]
- Widiana, N.; Satyarno, I.; Siswosukarto, S. The Effect of Polypropylene Fiber and Steel Fiber on Geopolymer Concrete. J. Tek. Sipil Perenc. 2023, 25, 71–80. [Google Scholar] [CrossRef]
- Karim, M.; Abdullah, M.; Ahmed, T. An Overview: The Processing Methods of Fiber-reinforced Polymers (FRPs). J. Mech. Eng. Technol. 2021, 12, 10–24. [Google Scholar] [CrossRef]
- Al-Rousan, E.T.; Khalid, H.R.; Rahman, M.K. Fresh, mechanical, and durability properties of basalt fiber-reinforced concrete (BFRC): A review. Dev. Built Environ. 2023, 14, 100155. [Google Scholar] [CrossRef]
- Khan, M.B.; Shafiq, N.; Waqar, A.; Radu, D.; Cismaș, C.; Imran, M.; Almujibah, H.; Benjeddou, O. Effects of Jute Fiber on Fresh and Hardened Characteristics of Concrete with Effects of Jute Fiber on Fresh and Hardened Characteristics of Concrete with Environmental Assessment. Buildings 2023, 13, 1691. [Google Scholar] [CrossRef]
- Ardhira, P.J.; Ardra, R.; Harika, M.; Sathyan, D. Study on fibre reinforced foam concrete-a review. Mater. Today Proc. 2023, in press. [Google Scholar] [CrossRef]
- Khan, M.B.; Waqar, A.; Bheel, N.; Shafiq, N.; Sor, N.H. Optimization of fresh and mechanical characteristics of carbon fiber-reinforced concrete composites using response surface technique. Buildings 2023, 13, 852. [Google Scholar] [CrossRef]
- Ahmad, J.; Zhou, Z.; Deifalla, A.F. Structural properties of concrete reinforced with bamboo fibers: A review. J. Mater. Res. Technol. 2023, 24, 844–865. [Google Scholar] [CrossRef]
- Karim, M.; Abdullah, M.; Deifalla, A.; Azab, M.; Waqar, A. An assessment of the processing parameters and application of fibre-reinforced polymers (FRPs) in the petroleum and natural gas industries: A review. Results Eng. 2023, 18, 101091. [Google Scholar] [CrossRef]
- Basit, M.; Engineering, E.; Petronas, U.T.; Is-kandar, B.S. Production of Biochar from Waste Biomass Feedstock and its Applications in Sustainable Construction. J. Xi’an Pet. Inst. 2023, 19, 662–690. [Google Scholar]
- Waqar, A.; Khan, M.B.; Othman, I.; Mansoor, M.S.; Shafiq, N. A Systematic Literature Review on Risk Analysis of Health and Safety in Oil Refinery and Onshore Pipeline Construction Projects. In Proceedings of the 2022 International Conference on Data Analytics for Business and Industry (ICDABI), Sakhir, Bahrain, 25–26 October 2022; pp. 358–365. [Google Scholar] [CrossRef]
- Panzera, T.H.; Christoforo, A.L.; Ribeiro Borges, P.H. 15—High performance fibre-reinforced concrete (FRC) for civil engineering applications. In Advanced Fibre-Reinforced Polymer (FRP) Composites for Structural Applications; Woodhead Publishing Series in Civil and Structural Engineering; Bai, J., Ed.; Woodhead Publishing: Cambridge, UK, 2013; pp. 552–581. [Google Scholar]
- Raut, M.V. Influence of fine-grain fly ash along with glass fiber on strength and cost of proposed concrete mixes. Mater. Today Proc. 2023, in press. [Google Scholar] [CrossRef]
- Mao, J.; Liang, N.; Liu, X.; Zhong, Z.; Zhou, C. Investigation on early-age cracking resistance of basalt-polypropylene fiber reinforced concrete in restrained ring tests. J. Build. Eng. 2023, 70, 106155. [Google Scholar] [CrossRef]
- Ranaivomanana, H.; Leklou, N. Investigation of microstructural and mechanical properties of partially hydrated Asbestos-Free fiber cement waste (AFFC) based concretes: Experimental study and predictive modeling. Constr. Build. Mater. 2021, 277, 121943. [Google Scholar] [CrossRef]
- Zhang, C.; Zhu, Z.; Wang, S.; Zhang, J. Macro-micro mechanical properties and reinforcement mechanism of alkali-resistant glass fiber-reinforced concrete under alkaline environments. Constr. Build. Mater. 2023, 368, 130365. [Google Scholar] [CrossRef]
- Wypych, G. 16—Weathering of Compounded Products. In Hand book of material weathering, 5th ed.; Elsevier: Oxford, UK, 2013; pp. 581–717. [Google Scholar] [CrossRef]
- Harish, B.A.; Hanumesh, B.M.; Venkata Ramana, N.; Gnaneswar, K. Mechanical properties of recycled coarse aggregate concrete incorporating steel and glass fibre. Mater. Today Proc. 2023, in press. [Google Scholar] [CrossRef]
- Paktiawal, A.; Alam, M. Alkali-resistant glass fiber high strength concrete and its durability parameters. Mater. Today Proc. 2021, 47, 4758–4766. [Google Scholar] [CrossRef]
- Jonalagadda, K.B.; Kumar Jagarapu, D.C.; Eluru, A. Experimental analysis on supplementary cementitious materials with Alkali Resistant glass fibers. Mater. Today Proc. 2020, 27, 1569–1574. [Google Scholar] [CrossRef]
- Kasagani, H.; Rao, C.B.K. Effect of graded fibers on stress strain behaviour of Glass Fiber Reinforced Concrete in tension. Constr. Build. Mater. 2018, 183, 592–604. [Google Scholar] [CrossRef]
- Li, G.; Zhou, Q.; Wang, W.; Lu, C.; Chen, C.; Guo, Z.; Lu, C. Chloride diffusion along the interface between concrete matrix and repair materials under flexural loading. Constr. Build. Mater. 2023, 372, 130829. [Google Scholar] [CrossRef]
- Kondratyeva, N.; Golovatyuk, M. Research of technical characteristics of glass-fiber concrete. Urban Constr. Archit. 2023, 13, 82–91. [Google Scholar] [CrossRef]
- Al, R.H.; Shehzad, M.K.; Garcia-taengua, E. Flexural and deflection behaviour of synthetic fibre reinforced concrete beams reinforced with glass fibre reinforced polymers bars under sustained service load. Structures 2023, 54, 946–955. [Google Scholar]
- Peters, A.M.; Henderson, B.L.; Manjusha, M.; Althaf, M.; Mahato, K.K.; Rathore, D.K. Compressive and flexural behavior of glass fiber- reinforced concrete Compressive and flexural behavior of glass fiber-reinforced concrete. J. Phys. Conf. Ser. 2023, 2423, 012025. [Google Scholar] [CrossRef]
- Ulu, A.; Tutar, A.I.; Kurklu, A.; Cakir, F. Effect of excessive fiber reinforcement on mechanical properties of chopped glass fiber reinforced polymer concretes. Constr. Build. Mater. 2022, 359, 129486. [Google Scholar] [CrossRef]
- Ahmad, J.; González-Lezcano, R.A.; Majdi, A.; Ben Kahla, N.; Deifalla, A.F.; El-Shorbagy, M.A. Glass Fibers Reinforced Concrete: Overview on Mechanical, Durability and Microstructure Analysis. Materials 2022, 15, 5111. [Google Scholar] [CrossRef] [PubMed]
- Kennedy, C.; Bheel, N.; Nadeem, G.; Benjeddou, O.; Waqar, A.; Khan, M.B. Efficiency of ficus sycomorus exudates as corrosion inhibitor for mild steel pipes in acid concentrated water and soil. Saf. Extrem. Environ. 2023. [Google Scholar] [CrossRef]
- Shamskilani, M.; Pourrostami Niavol, K.; Erfan, N.; Mehrnia, M.; Sharafi, A. Removal of Emerging Contaminants in a Membrane Bioreactor Coupled with Ozonation: Optimization by Response Surface Methodology (RSM). Water Air Soil Pollut. 2023, 234, 304. [Google Scholar] [CrossRef]
- Cheng, C.-L.; Shalabh, S.; Garg, G. Coefficient of determination for multiple measurement error models. J. Multivar. Anal. 2014, 126, 137–152. [Google Scholar] [CrossRef]
- Waqar, A.; Bheel, N.; Shafiq, N.; Othman, I.; Khan, M.B.; Mansoor, M.S.; Benjeddou, O.; Yaseen, G. Effect of volcanic pumice powder ash on the properties of cement concrete using response surface methodology. J. Build. Pathol. Rehabil. 2023, 8, 17. [Google Scholar] [CrossRef]
- Chicco, D.; Warrens, M.J.; Jurman, G. The coefficient of determination R-squared is more informative than SMAPE, MAE, MAPE, MSE and RMSE in regression analysis evaluation. PeerJ Comput. Sci. 2021, 7, e623. [Google Scholar] [CrossRef]
- ASTM C78/C78M; Flexural Performance of Composite RC Beams Having an ECC Layer at the Tension Face. ASTM: West Conshohocken, PA, USA, 2021.
- ASTMC496; Standard Test Method for Splitting Tensile Strength of Cylindrical Concrete Specimens 1. ASTM: West Conshohocken, PA, USA, 2017.
- ASTM C78/C78M-21; Flexural Performance of Composite RC Beams Having an ECC Layer at the Tension Face. ASTM: West Conshohocken, PA, USA, 2017.
- ASTM C469; Standard Test Method for Static Modulus of Elasticity and Poisson’s Ratio of Concrete in Compression. ASTM: West Conshohocken, PA, USA, 2017.
- ACI544; Experimental and Statistical Analysis of Repeated Impact Records of Hybrid Fiber-Reinforced High-Performance Concrete. American Concrete Institute: Farmington Hills, MI, USA, 2018.
- Mastali, M.; Dalvand, A.; Sattarifard, A.R. The impact resistance and mechanical properties of reinforced self-compacting concrete with recycled glass fibre reinforced polymers. J. Clean. Prod. 2016, 124, 312–324. [Google Scholar] [CrossRef]
- Prasad, N.; Murali, G.; Vatin, N. Modified Falling Mass Impact Test Performance on Functionally Graded Two Stage Aggregate Fibrous Concrete. Materials 2021, 14, 5833. [Google Scholar] [CrossRef]
- Patil, D.; Anadinni, S. Computation of Static Modulus of Elasticity and Poisson’s Ratio of M20 Grade Self-Curing Concrete with Peg-400 as a Self Curing Agent Using is Code and ASTM Standard. In Proceedings of the Proceedings of the International Conference on Recent Advances in Computational Techniques (IC-RACT) 2020, Mumbai, India, 27–28 March 2020. [Google Scholar] [CrossRef]
- Thaker, T.; Dalal, S.P.; Motiani, R.; Contractor, H. Effect of Electrical Grade Glass fibers and Alkaline Resistant Glass fibers on high strength concrete. Mater. Today Proc. 2022, 62, 6998–7001. [Google Scholar] [CrossRef]
- Kushartomo, W.; Ivan, R. Effect of Glass Fiber on Compressive, Flexural and Spliting Strength of Reactive Powder Concrete. MATEC Web Conf. 2017, 138, 03010. [Google Scholar] [CrossRef]
- Dominic, M. Properties of Glass Fiber Reinforced Concrete A Review. Int. J. Creat. Res. Thoughts 2018, 6, 356–360. [Google Scholar]
- Hake, S.L.; Shinde, S.S.; Bhandari, P.K.; Awasarmal, P.R.; Kanawade, B.D. Effect of Glass Fibers on Self Compacting Concrete. E3S Web Conf. 2020, 170, 06018. [Google Scholar] [CrossRef]
- Patel, R.; Solanki, J.; Pitroda, D.J. A Study on Glass Fibre as an Additive in Concrete to Increase Concrete Tensile Strength. Glob. Res. Anal. 2013, 2, 85–87. [Google Scholar]
- Zweben, C.H. Composites: Overview; Bassani, F., Liedl, G.L., Wyder, P.B.T.-E.C.M.P., Eds.; Elsevier: Oxford, UK, 2005; pp. 192–208. [Google Scholar] [CrossRef]
- Kumar, P.P.; Chaitanya, B.K. Performance evaluation of glass fiber reinforced high-performance concrete with silica fume and nano-silica. IOP Conf. Ser. Earth Environ. Sci. 2022, 982, 012018. [Google Scholar] [CrossRef]
- Collins, F. Inclusion of carbonation during the life cycle of built and recycled concrete: Influence on their carbon footprint. Int. J. Life Cycle Assess. 2010, 15, 549–556. [Google Scholar] [CrossRef]
- Thilakarathna, P.S.M.; Seo, S.; Baduge, K.S.K.; Lee, H.; Mendis, P.; Foliente, G. Embodied carbon analysis and benchmarking emissions of high and ultra-high strength concrete using machine learning algorithms. J. Clean. Prod. 2020, 262, 121281. [Google Scholar] [CrossRef]
- Hammond, G.; Jones, C. The Inventory of Carbon and Energy (ICE). A BRIA Guide. Embodied Carbon. 2014. Available online: http://www.emccement.com/pdf/Full-BSRIA-ICE-guide.pdf (accessed on 9 July 2023).
- Turner, L.K.; Collins, F.G. Carbon dioxide equivalent (CO2-e) emissions: A comparison between geopolymer and OPC cement concrete. Constr. Build. Mater. 2013, 43, 125–130. [Google Scholar] [CrossRef]
- Kumar, R.; Shafiq, N.; Kumar, A.; Jhatial, A.A. Investigating embodied carbon, mechanical properties, and durability of high-performance concrete using ternary and quaternary blends of metakaolin, nano-silica, and fly ash. Environ. Sci. Pollut. Res. 2021, 28, 49074–49088. [Google Scholar] [CrossRef] [PubMed]
- Cushman, B.R. Energy Consumption Energy Type; Dartmouth College: Hanover, NH, USA, 2017. [Google Scholar]
- Jones, R.; Mccarthy, M.; Newlands, M. Fly Ash Route to Low Embodied CO2 and Implications for Concrete Construction. In Proceedings of the 2011 World of Coal Ash (WOCA) Conference, Denver, CO, USA, 9–12 May 2011. [Google Scholar]
- Carvalho, A.; Souza, M.; Marques, T.; Souza, D.; Souza, E. Familywise type I error of ANOVA and ANOVA on ranks in factorial experiments. Ciênc. Rural 2023, 53, e20220146. [Google Scholar] [CrossRef]
- Ali, M.; Kumar, A.; Yvaz, A.; Salah, B. Central composite design application in the optimization of the effect of pumice stone on lightweight concrete properties using RSM. Case Stud. Constr. Mater. 2023, 18, e0195. [Google Scholar] [CrossRef]
- Schneider, A.; Hommel, G.; Blettner, M. Simple Linear Regression IV The Coefficient of Determination, R 2. 0–3. Dtsch. Arztebl. Int. 2010, 107, 776–782. [Google Scholar]
- Waqar, A.; Othman, I.; Almujibah, H.; Khan, M.B.; Alotaibi, S.; Elhassan, A.A.M. Factors Influencing Adoption of Digital Twin Advanced Technologies for Smart City Development: Evidence from Malaysia. Buildings 2023, 13, 775. [Google Scholar] [CrossRef]
- Sajjad, M.; Hu, A.; Waqar, A.; Falqi, I.; Alsulamy, S.; Bageis, A.; Alshehri, A. Evaluation of the Success of Industry 4.0 Digitalization Practices for Sustainable Construction Management: Chinese Construction Industry. Buildings 2023, 13, 1668. [Google Scholar] [CrossRef]
- Hahn, G.J. The Coefficient of Determination Exposed. Chem. Technol. 1973, 3, 609–612. [Google Scholar]
- Waqar, A.; Skrzypkowski, K.; Almujibah, H.; Zagórski, K.; Khan, M.B.; Zagórska, A.; Benjeddou, O. Success of Implementing Cloud Computing for Smart Development in Small Success of Implementing Cloud Computing for Smart Development in Small Construction Projects. Appl. Sci. 2023, 13, 5713. [Google Scholar] [CrossRef]
- Mirza, F.A.; Soroushian, P. Effects of alkali-resistant glass fiber reinforcement on crack and temperature resistance of lightweight concrete. Cem. Concr. Compos. 2002, 24, 223–227. [Google Scholar] [CrossRef]
- Marimuthu, V.; Annadurai, R. A study on the macro-properties of PCB fiber-reinforced concrete from recycled electronic waste and validation of results using RSM and ANN. Asian J. Civ. Eng. 2023, 24, 1667–1680. [Google Scholar] [CrossRef]
- Waqar, A.; Khan, M.B.; Shafiq, N.; Skrzypkowski, K.; Zagórski, K.; Zagórska, A. Assessment of Challenges to the Adoption of IOT for the Safety Management of Small Construction Projects in Malaysia: Structural Equation Modeling Approach. Appl. Sci. 2023, 13, 3340. [Google Scholar] [CrossRef]
Disclaimer/Publisher’s Note: The statements, opinions and data contained in all publications are solely those of the individual author(s) and contributor(s) and not of MDPI and/or the editor(s). MDPI and/or the editor(s) disclaim responsibility for any injury to people or property resulting from any ideas, methods, instructions or products referred to in the content. |
© 2023 by the authors. Licensee MDPI, Basel, Switzerland. This article is an open access article distributed under the terms and conditions of the Creative Commons Attribution (CC BY) license (https://creativecommons.org/licenses/by/4.0/).
