Article

Unlocking the Potential of Digital, Situation-Aware Nudging for Promoting Sustainable Mobility

1
Department of Geoinformatics, University of Salzburg, 5020 Salzburg, Austria
2
Salzburg Research Forschungsgesellschaft mbH, 5020 Salzburg, Austria
3
TraffiCon GmbH, 5020 Salzburg, Austria
4
Sustainability InnoCenter Ekonomisk Förening, 753 21 Uppsala, Sweden
*
Author to whom correspondence should be addressed.
Sustainability 2023, 15(14), 11149; https://doi.org/10.3390/su151411149
Submission received: 3 June 2023 / Revised: 5 July 2023 / Accepted: 13 July 2023 / Published: 17 July 2023

Abstract

:
The context ultimately decides on mobility options and thus shapes mobility behavior. Nudges are an increasingly used strategy for promoting sustainable modes of everyday mobility. However, in most cases, the design of nudges and the triggers for issuing these interventions neglect the user’s specific context and are thus less relevant to the recipient. Digital nudges communicated through mobile devices offer situation awareness, which is facilitated by geographic information systems (GIS). Using the geographic reference as the “primary key” allows for connecting the current location information of recipients with static and real-time environmental data that define the contextual situation. We describe a framework for triggering situation-aware nudges and provide a functional proof-of-concept. Through linking concepts from behavioral economics and psychology with methods from GIS science and Human-Computer-Interaction (HCI), we illuminate new opportunities for promoting sustainable mobility.

1. Introduction

Promoting sustainable mobility is imperative in tackling the negative effects of motorized individual transport. However, in doing so, concerted efforts at the systemic level need to be implemented [1]. Gössling [2] clusters the broad range of interventions for car reduction into three classes, namely the provision of good alternatives, comprehensive investments into adequate infrastructure, and communication strategies that frame reduced car use positively. Whereas the former two classes are widely anticipated in policies, the latter remains often neglected. Although mounting evidence refutes the applicability of economic arguments (rational choices based on complete knowledge) in explaining and adapting mobility behavior [3], research on how sustainable mobility can be popularized through behavioral interventions remains comparably scarce [4]. Likewise, the number of implemented policies and successful campaigns is limited—although there is strong interest from urban sustainability strategists and mobility planners. In this paper, we focus on nudging, which is an increasingly relevant option for inducing mobility behavior change. We are keen to understand how digital nudges can be implemented smartly to promote sustainable mobility practices so that the immediate context (the situation) of the recipient of a digital nudge is considered. We link domains engaged in mobility behavior change and provide a comprehensive framework that facilitates a data-driven, GIS-based approach for delivering situation-aware nudges to clients. The presented approach is adaptable and transferable and can thus be implemented and employed for any behavior-oriented sustainable mobility promotion.

2. Background

To develop a framework for situation-aware nudging towards sustainable mobility, we draw from several domains, which are seldom linked in the academic discourse, and link them on conceptual and technical levels. Besides academic challenges, which become evident from the literature, we anticipate the urgent need for supportive tools in the ongoing mobility transition from stakeholders in the public sector. Thus, we conducted focus groups, which informed the conceptual and technical design of the proposed framework. All three sources are integrated and inform the conceptual design of the proposed framework for situation-aware nudging (see Figure 1).

2.1. Nudging and Sustainable Mobility

Nudging [5] is a method of changing behavior that stems from behavioral economics. In contrast to the classical economy, where rational decisions by all actors are assumed (“homo oeconomicus”), behavioral economics works with the heuristics of human behavior [6], that is, considering cognitive biases in judgments and decisions [7]. Nudging targets the choice architecture (i.e., the environment in which decisions are made). It is designed so that people’s choices are steered predictably, without punishment, change of economic parameters, and neglecting any options. An example from everyday life is how goods are arranged and presented in a store. Nudging and related behavior change methods have the potential to be used for promoting pro-environmental behavior, such as energy conservation, healthy food choices, and sustainable mobility behavior [8]. In a recent literature review, Hummel & Maedche [9] found that most nudges are used in the health context. Moreover, they concluded that the effectiveness of nudges is rather low to moderate, with a high degree of uncertainty. Similarly, Mertens et al. [10] found a small to moderate effect size in their meta-analysis of nudges but also noted a range of findings, depending on the behavioral domain, with nudging for food choices being the most effective.
With the increase in choices made in digital environments, digital nudges have witnessed an upsurge over the past couple of years [11]. Digital nudging means that a digital tool (e.g., a website or a mobile application) is used to influence decisions in the digital or analog environment. Over the past years, digital nudging techniques have been applied to topics revolving around sustainability. Klieber et al. [12] present a SWOT analysis of nudging in the context of smart city initiatives. Low costs and direct access to citizens are major advantages, while ethical concerns are seen as threats. In a comprehensive discussion of “Green Nudges” from a legal and ethical viewpoint, Santos Silva [13] concludes that nudges are a feasible tool for behavior change that translates laws and regulations into actionable items. However, she stresses in her concluding thesis that sound regulatory work and boosts (incentive-based measures) should precede nudging interventions for meeting sustainability goals.
The transport sector accounts for large shares of greenhouse gases (GHG), and the decline in emissions is not the same as in other sectors [14]. This makes mobility particularly relevant for any sustainability strategy. On the other hand, personal mobility is highly habitual and, therefore, hard to change through interventions that address reasoning [15]. Despite this, nudging is not as commonly used in fostering sustainable mobility as it is in other fields. For example, in the recent meta-analysis by Mertens et al. [10], nudges for environmental issues focused predominantly on energy savings and greener choices in online shopping, while only two studies had mobility as a behavioral domain for nudging. Luger-Bazinger & Hornung-Prähauser [16] found moderate evidence for the effect of nudges in a natural experiment with 202 participants, who were exposed to social comparison nudges that encouraged them to choose the bicycle for utilitarian trips. In a recent review study, it was found that digital apps showed promising effects in terms of switches from private car to public transport, when attractive functionalities (mobility as a service, real time information etc.) are combined with persuasive elements, such as challenges, rewards, or social comparison [17]. Luger-Bazinger et al. [18] conducted a review analysis of current digital nudges in the mobility sector and found a lack of theoretical foundation in behavior change models. Moreover, they suggest considering the context of persons in digital mobility nudging applications, as it is done in the health field with just-in-time adaptive interventions. In line with this recommendation, Mont et al. [19] state in a review report that the efficiency and effectivity of nudging in the mobility sector is ultimately dependent from framework conditions. For instance, nudges for promoting walking will hardly work, if the walkability of the environment is poor (lack of sidewalks, heavy motorized traffic etc.). Against this backdrop, it is not surprising that context or situation awareness is regarded as essential for effective nudging [20].

2.2. Environmental Conditions and Mobility Behavior

The immediate environment has a fundamental influence on mobility behavior. We distinguish between the built environment and its organization (road design, accessibility, etc.), the static natural environment (exposure to green and blue space, topography, etc.), and dynamic variables (weather, exposure to pollutants or noise, velocity of traffic, occupancy rate in public transport, etc.). The literature on the relationship between these environmental conditions and mobility behavior is extensive. Sallis et al. [21] found compelling evidence for the relationship between urban design that is favorable for walking and cycling and the level of physical activity across cities worldwide. These findings are supported by Eldeeb et al. [22] and Næss et al. [23], who further point to the fact that the effects of environmental variables on mode choice are not distributed equally in space but depend on structural aspects (such as accessibility or distance), and socio-demographic patterns. Dynamic environmental factors, above all weather conditions, are especially relevant for mode choice when considering pedestrians, cyclists, or scooter riders, who are directly exposed to weather or emissions. Gerike et al. [24] highlight the importance of place functions in addition to adequate infrastructure in the context of walkable environments. Whereas the latter is mainly relevant for moving from A to B efficiently and safely, the former addresses the demand for comfortable public spaces, perceived as welcoming by citizens. In addition to the huge number and variety of influential variables, car parking space, showers, and lockers at the workplace, as well as benefits for public transport users, are decisive factors for commuters’ mode choice [25,26].
Although the correlations between environmental variables and mobility behavior, primarily mode choice, are striking, one must be cautious with causal conclusions. Considering attitudes and socio-cultural norms in explanatory conclusions [27] and accounting for different levels of mobility choices and their respective propensity to biases [4] is of fundamental importance for promoting sustainable mobility.
Ton et al. [28] review several determinants for mode choice in the Netherlands, which can be reduced to internal (personal) and external factors. Geographical information systems facilitate the representation and integration of environmental conditions (external determinants). Time and location are used as primary keys for not only integrating various information layers but also relating individuals to their immediate environment. Nudging, in our context, aims at influencing and modifying mobility behavior by addressing internal factors. Situation-aware nudges consider both internal and external determinants for mode choice and are thus promising in terms of efficiency and effectiveness.

2.3. Insights from Practitioners

As a third aspect, besides the literature on digital nudging and sustainability, as well as the interrelation between mobility behavior and the environment, we dug into common practices in city administrations. To date, few, if any cities and regions, have implemented nudging strategies to promote sustainable mobility. Thus, we conducted semi-structured, qualitative interviews with selected representatives from cities in Sweden, Spain, Germany, and Luxemburg to evaluate the potential for this type of intervention. The collected demands and concerns informed the conceptual design of our framework for situation-aware nudging for promoting sustainable mobility.
The sample of stakeholders was recruited within the professional network of authors. We aimed at representatives from cities of different sizes but with an advanced sustainable mobility agenda. Small cities included were Sjöbo and Visby (both Sweden) and Leudelange (Luxemburg). Uppsala (Sweden) and Santander (Spain) represented medium-sized, and Munich (Germany) and Stockholm (Sweden) were large cities. The interviewees had professional backgrounds in strategic fields (4), planning (3), information provision (1), engineering (1), innovation (1), and academia (1). The gender ratio of the sample was balanced (6 female, 5 male).
There was a general consensus on the instrumental role of the transport sector in achieving national and transnational climate protection goals. Some respondents mentioned a lack of adequate data to provide facts on environmental and mobility parameters and to monitor the urban system. Cities’ responses to the need for a more sustainable transport system vary by city, with pull measures (such as discounted public transport tickets and increased capacities or promoting cycling and public transport) being the most common. Dedicated nudging strategies are not yet used in any of the cities. Moreover, most city representatives are not familiar with nudging concepts at all.
Asked about potential motivational interventions, stakeholders reported information sharing (8 mentions), communication (6), digital platforms and apps (6), technological innovations—mostly related to sharing models (6), pricing techniques and incentives (3), events and educational activities (3), and informational nudging (1). The urgency for reducing emissions was regarded as the main driver for using motivational interventions. Stakeholders identified citizens’ resistance towards mobility behavior change as a major barrier. In addition, they pointed to the low priority on the agenda of decision-makers in administration and politics, which leads to very limited financial resources for feasibility studies and investments into infrastructure.
Several respondents expressed agreement regarding the positive impact of employing motivational techniques for encouraging sustainable mobility behavior. The openness towards behavioral interventions correlates with the city’s technological advancement in the mobility sector, such as car and bike sharing systems and the promotion of electric cargo bikes. However, stakeholders agreed on prioritizing a robust and attractive built infrastructure for sustainable mobility before motivational interventions become effective. Regarding nudges, their relevance to the local context and their ability for customization is regarded as critical to success. This finding is in line with conclusions in academic literature [19,20], leaving us with a clear picture of the requirements for successfully using digital nudging intervention for the promotion of sustainable mobility.

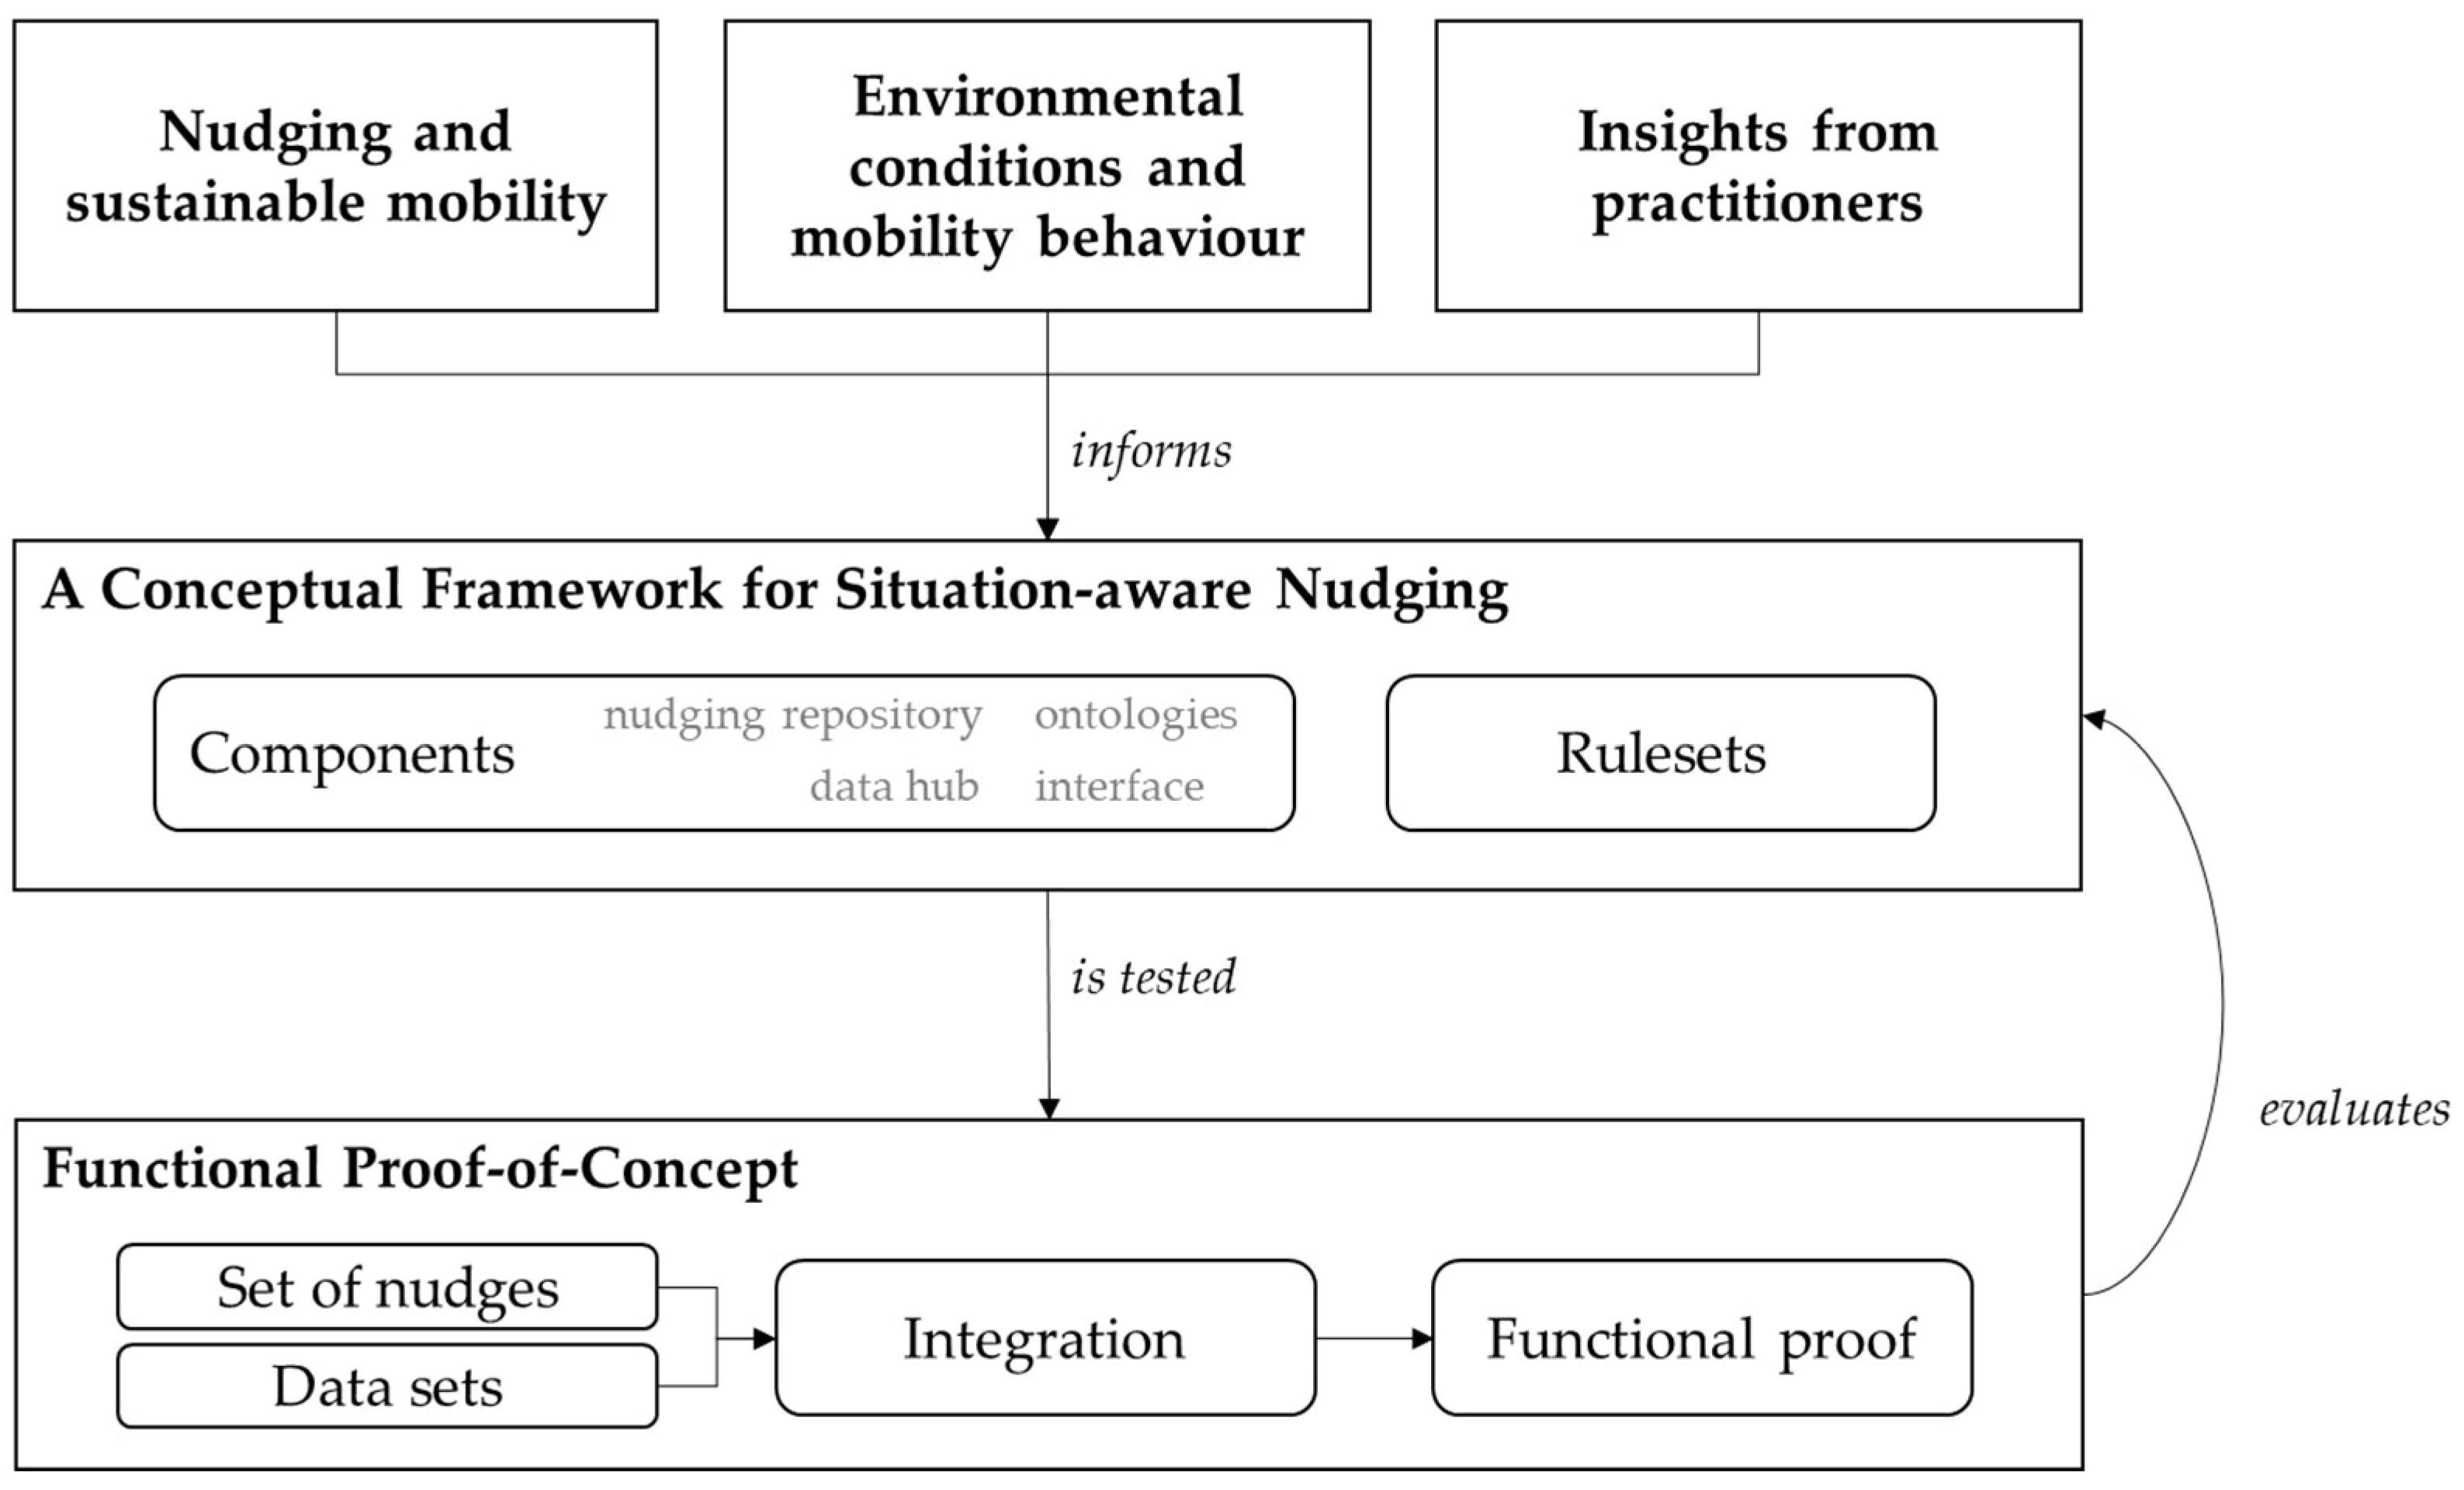
3. Method: A Conceptual Framework for Situation-Aware Nudging

In our understanding of situation awareness, we conceptually mainly draw from GIS science and Human–Computer Interaction, where context or situation awareness plays a central role. In GIS science, the concept is tightly intertwined with location-based services (LBS), which became popular in research and application with the advent of mobile devices and the ubiquitous internet. Based on data generated by location-based services, connected devices, and the establishment of 5G networks, location-based analytics have become a rapidly emerging field [29]. In human–computer interaction (HCI) research, the context of interaction is explicitly considered as a parameter since it influences the user as well as the system. The underlying assumption is that “interaction does not occur within a vacuum” [30] (p. 154).
Concepts from GIS science and HCI are particularly relevant for digital nudging, as the digital sphere needs to be linked with the choice architecture of individuals. Regarding mobility choices in a natural setting, the environment that defines a situation is never static but dynamic, which further adds to the requirements for the digital representation of situations. For the design of situation-aware nudging as proposed in this paper, we built upon the work of Coutaz et al. [31] and adapted it for our purposes. We follow Coutaz et al. in their understanding of a “situation” as information space, which is—in our case—defined by the relevant parameters for mobility choices as outlined in the previous section. This information space is represented at different levels of abstraction, which are:
(a)
Data: multiple real-time sensors and data sources are integrated;
(b)
Information: situations are described along external determinants for mobility choices;
(c)
Situation identification: an ontology translates definitions of situations into manageable framework conditions;
(d)
Trigger for nudges: situation-aware nudges are delivered to users following predefined rules.
We use the spatial and temporal reference as keys for the definition of situations and for linking these representations of situations with individual users who receive nudges. With this, we can design a set of nudges that either contain semantic information about a situation or are tied to situational conditions.
Technically, the levels of abstraction build on one another. Data are stored and managed in a spatial database, which forms the building block of the proposed workflow for situation-aware nudging. Levels (b–d) are reflected in how the data are queried. The request from the client contains location information, which decides—together with the point in time—which nudges are relevant.

3.1. Components

The proposed framework consists of four core components, as illustrated in Figure 2. First, nudges and attached conditions are stored in a nudging repository. Second, a data hub manages the required data, which are necessary for defining situations. Data are either stored in a central database or are referenced in the data hub (distributed data storage). Third, ontologies link the data hub with the nudging repository, considering clients’ situations. Fourth, an interface connects clients with the central data hub and controls for the temporal aspects of situation-aware nudges. In the following, we describe the components in more detail.
The nudging repository contains all available nudges, each with text and nudging conditions. The nudging text is the information conveyed to receivers of the nudges. Depending on the nudging design, these texts range from simple information to concrete calls for action. The texts are either fixed or contain flexible elements that can be updated depending on conditions (time stamp, location, environmental variables) or user-specific characteristics (mode preferences, age, gender, etc.). The nudge conditions refer to situations in which the nudge is available and to predefined exclusion criteria based on user-specific characteristics. Table 1 presents examples of the different types of nudge texts and conditions. The different types of texts and conditions can be combined as needed.
Situation awareness is attributed in two different ways to nudges. First, nudge texts contain semantic information that describes a situation; for instance, “Most roads are congested and weather will be dry the entire day. Why not take the bike to work?” In this example, the text refers to traffic and weather conditions, which directly describe the current situation. Second, if nudge texts do not contain specific information on the situation, situation awareness can still be introduced by conditions, such as, “Why not take the bike today?” with the conditions: location = home, and bikeability around the current location = high.
Technically, the nudging repository is a flat database table with columns containing a unique ID, the nudge text, thresholds for conditions, and applicability criteria. The nudges from the repository are linked to the data hub through ontologies. The delivery of nudges to clients follows a predefined ruleset, which is present in Section 2.2.
The data hub connects situation awareness, described by various input data layers, with the nudges, which are then delivered to the client. Input data layers are managed in a data repository, where the temporal (timestamp) and spatial (geometry + location) information are used for syntactically (and subsequently semantically) integrating different data sources. We distinguish between static and real-time data. The former refers to the built environment, such as the representation of the road network in a graph with linked attributes or derived layers (for instance, walkability and bikeability indicators). The latter account for dynamic factors that decide on the relevance of nudges, such as the current weather situation or public transport services in immediate proximity. Static and dynamic data are integrated and interpreted to describe situations. For this, we use thresholds for the different input data, corresponding with lower and upper limits for acceptance. Qualitative information in the nudges or nudge conditions is translated into manageable sets of value combinations. “Excellent weather”, for instance, requires a minimum duration of sunshine, the absence of precipitation, air temperature within a predefined range, and no strong wind.
As outlined before, nudges contain situation-relevant information, either in their content or as conditions. For defining ontologies, which link nudges to users’ situation and mode preferences, we extract and formalize relevant information from the nudge texts, user information, and the situation. A value derived from the nudges’ semantic content or related conditions is assigned to each situational factor, which can have different qualities depending on the role. The quality is defined by the design or available location information of a user. A factor can be calculated along a route if start (home) and end (work) locations are known, or it can be calculated for the area near a specific location. Each situational factor is represented by 1–2 attributes from datasets. In the case of two attributes, an operator decides how they are logically connected. The value for situational factors is translated into thresholds for the considered attributes according to the ruleset (see Section 2.2.). Table 2 shows examples of how ontologies are defined:
Communication between clients and the data hub is managed in an interface (API). A schedule defines time frames for when nudges are sent to clients and controls for the maximum number and the unique use of nudges per user. The API sends a request to the client, which returns user preferences and location information. With this, the interface queries the data hub and returns adequate nudges, if available, for the specific situation of the user. To ensure privacy, temporary user IDs, which are deleted every day, are used for communication between the client and the data hub.

3.2. Rulesets

The organization for delivering nudges to the client follows layered rulesets, which are linked to the interface and data hub on the one side and the nudging repository with the ontologies on the other side.
To return relevant, situation-aware nudges, a set of rules processes the attributes of the end user, which are conveyed as part of the request to the data hub (see Figure 3). Depending on mode preferences and location information, nudges from the repository are filtered. In addition, rules linked to the schedule, which is part of the interface, define the frequency of nudging, the maximum number of nudges per day, and time frames for certain nudges. These rules are adaptable and can thus be optimized for different user groups or intervention goals. Another layer of rules is linked to the nudge ontologies. These rules are defined as queries for the data hub, in which thresholds are used for reflecting situational factors. Again, these rules can be adapted according to the perception of situations in targeted user groups. The perception of “moderate temperature”, for instance, differs significantly between regions [32]. The same holds true for the traffic state [33], the distance to public transport stops [34], and other situational factors that are perceived and rated by citizens. Applying these layered rulesets leads to a subset of situation-aware nudges from which nudges are randomly selected and delivered to the client.

4. Results: Functional Proof-of-Concept

We tested the functionality of a set up for situation-aware nudging in a real-world environment as proposed in the previous section in the context of the DyMoN research project (https://dymon.eu/, accessed on 9 May 2023). For this functional proof-of-concept, we focused on the use case of promoting sustainable commuting in the urban agglomeration of Salzburg, Austria. We built the entire system as described in the previous section and used an existing health app as an exemplary client. Results on the efficiency and effectiveness of situation-aware nudges will be published elsewhere. The focus here is on conceptual development and technical implementation.
The city of Salzburg is located in the Austrian–German border region and has a population of 155,000. The urban agglomeration has a total of around 300,000 inhabitants. Salzburg has central functions for the wider region and attracts almost 54,000 workers [35] who commute to the city daily. In addition, 51,000 commuters travel to their workplace within the city (see Figure 4). The modal split for Salzburg reflects the dominance of motorized individual transport, even for commutes within the city. 47% of all commuters within the city take the car. The shares for public transport (14%), walking (9%), and cycling (26%) are way below [36], despite short distances and a flat topography.
Digital nudging is ultimately connected to the discourse on privacy and data protection. For the European Union, the General Data Protection Regulation (GDPR) and its national legal implementations apply. This legal background has direct implications for the design of a digital nudging system. For the proof of concept, we left the consent management entirely up to the client application. The communication between the app and the interface was designed for anonymized data. This means that no personal data was conveyed to the data hub. Apart from the legal framework, cultural attitudes toward digital tools had to be considered in the design. The German-speaking countries show more reservation towards personal digital tools and services than other European regions [37,38].
Although government agencies are increasingly sharing data on open government data (OGD) portals, the availability and accessibility of required data are partly poor for the study area. This holds particularly true for real-time data from public transport and motorized road traffic. For instance, public transport operators do not share data on occupancy rates. Real-time arrival and departure data of public transport at any stop is not directly accessible but needs to be fetched from trip planner applications. Traffic state data from motorized road traffic is available but only accessible via a proprietary interface. Despite the often-proclaimed data deluge in transport research [39], we still face lacking or unsuitable data [40].
Given the high number of commuters that rely on the car as a preferred mode, the social attitude towards digitalization, and the partial lack of adequate and accessible data make Salzburg a challenging, and thus perfectly suited, environment for a proof-of-concept.

4.1. Set of Nudges

The set of nudges used for the functional proof-of-concept was developed in a co-creation process meeting the highest ethical standards [41]. The nudge design is based on the established behavior change model COM-B [42], which links capabilities (C) and opportunities (O) with motivation (M) and is adapted for mobility-related purposes [18]. All three components influence behavior and can thus be used for behavior change interventions. The final set of nudges, used for the functional proof-of-concept, is published in a Zenodo repository [43]. In total, 166 different nudges are available. They are characterized by mode, trip purpose, types of behavior change, and behavior change technique, according to Michie et al. [44]. Table 3 summarizes the used set of nudges:
We import the nudges from the public repository [43] into a PostgreSQL database on our premises (see Section 4.3), from where the nudges are retrieved via an internally used API. This nudge API checks the authentication, accepts multiple mandatory (mode preference, date, and time) and optional (current location, home, and workplace location, IDs of previously received nudges) parameters, and returns a random nudge that satisfies the respective situational conditions and the preferences of users.

4.2. Data Sets

The set of nudges and additional situational factors define the information demand translated into data requirements. The data hub is implemented as a central data warehouse where real-time and static data are stored and further processed for performance reasons. The following data sets are used for our functional proof-of-concept:
  • Weather: data on an hourly forecast of air temperature, precipitation, wind speed, and sunshine duration are retrieved and either directly used or further processed; for instance, we calculated daily means from hourly values or estimated the probability of the presence of glaze from temperature and precipitation. All weather data are openly accessible;
  • Public transport data: we use openly available national GTFS (General Transit Feed Specification) data for locations of public transport stops and timetables. From this data set, we calculate public transport accessibility and departure frequencies for each stop;
  • Traffic situation: data on current and forecasted traffic state is used on the level of single road segments. Based on these data, we calculate a variable expressing the occurrence of congestion. For accessing the data, we use a nationally available proprietary service;
  • Car parking: we use data on real-time occupation rates of car parking facilities for calculating the availability rate of car parking. For this, we use an openly accessible service for our study area. However, this data source is limited to managed parking facilities and does not consider on-street marking;
  • Street network: we use an openly available, authoritative representation of the street network for deriving several quality indicators. The suitability and attractiveness of routes and surroundings of home/work/current location are assessed with the NetAScore tool [45];
  • Mobility survey: for the definition of thresholds that describe reasonable situations (such as maximum walking distance to bus stops etc.), we use data from the last national, representative mobility survey. These data are freely available, but registration is required to access the full data set.
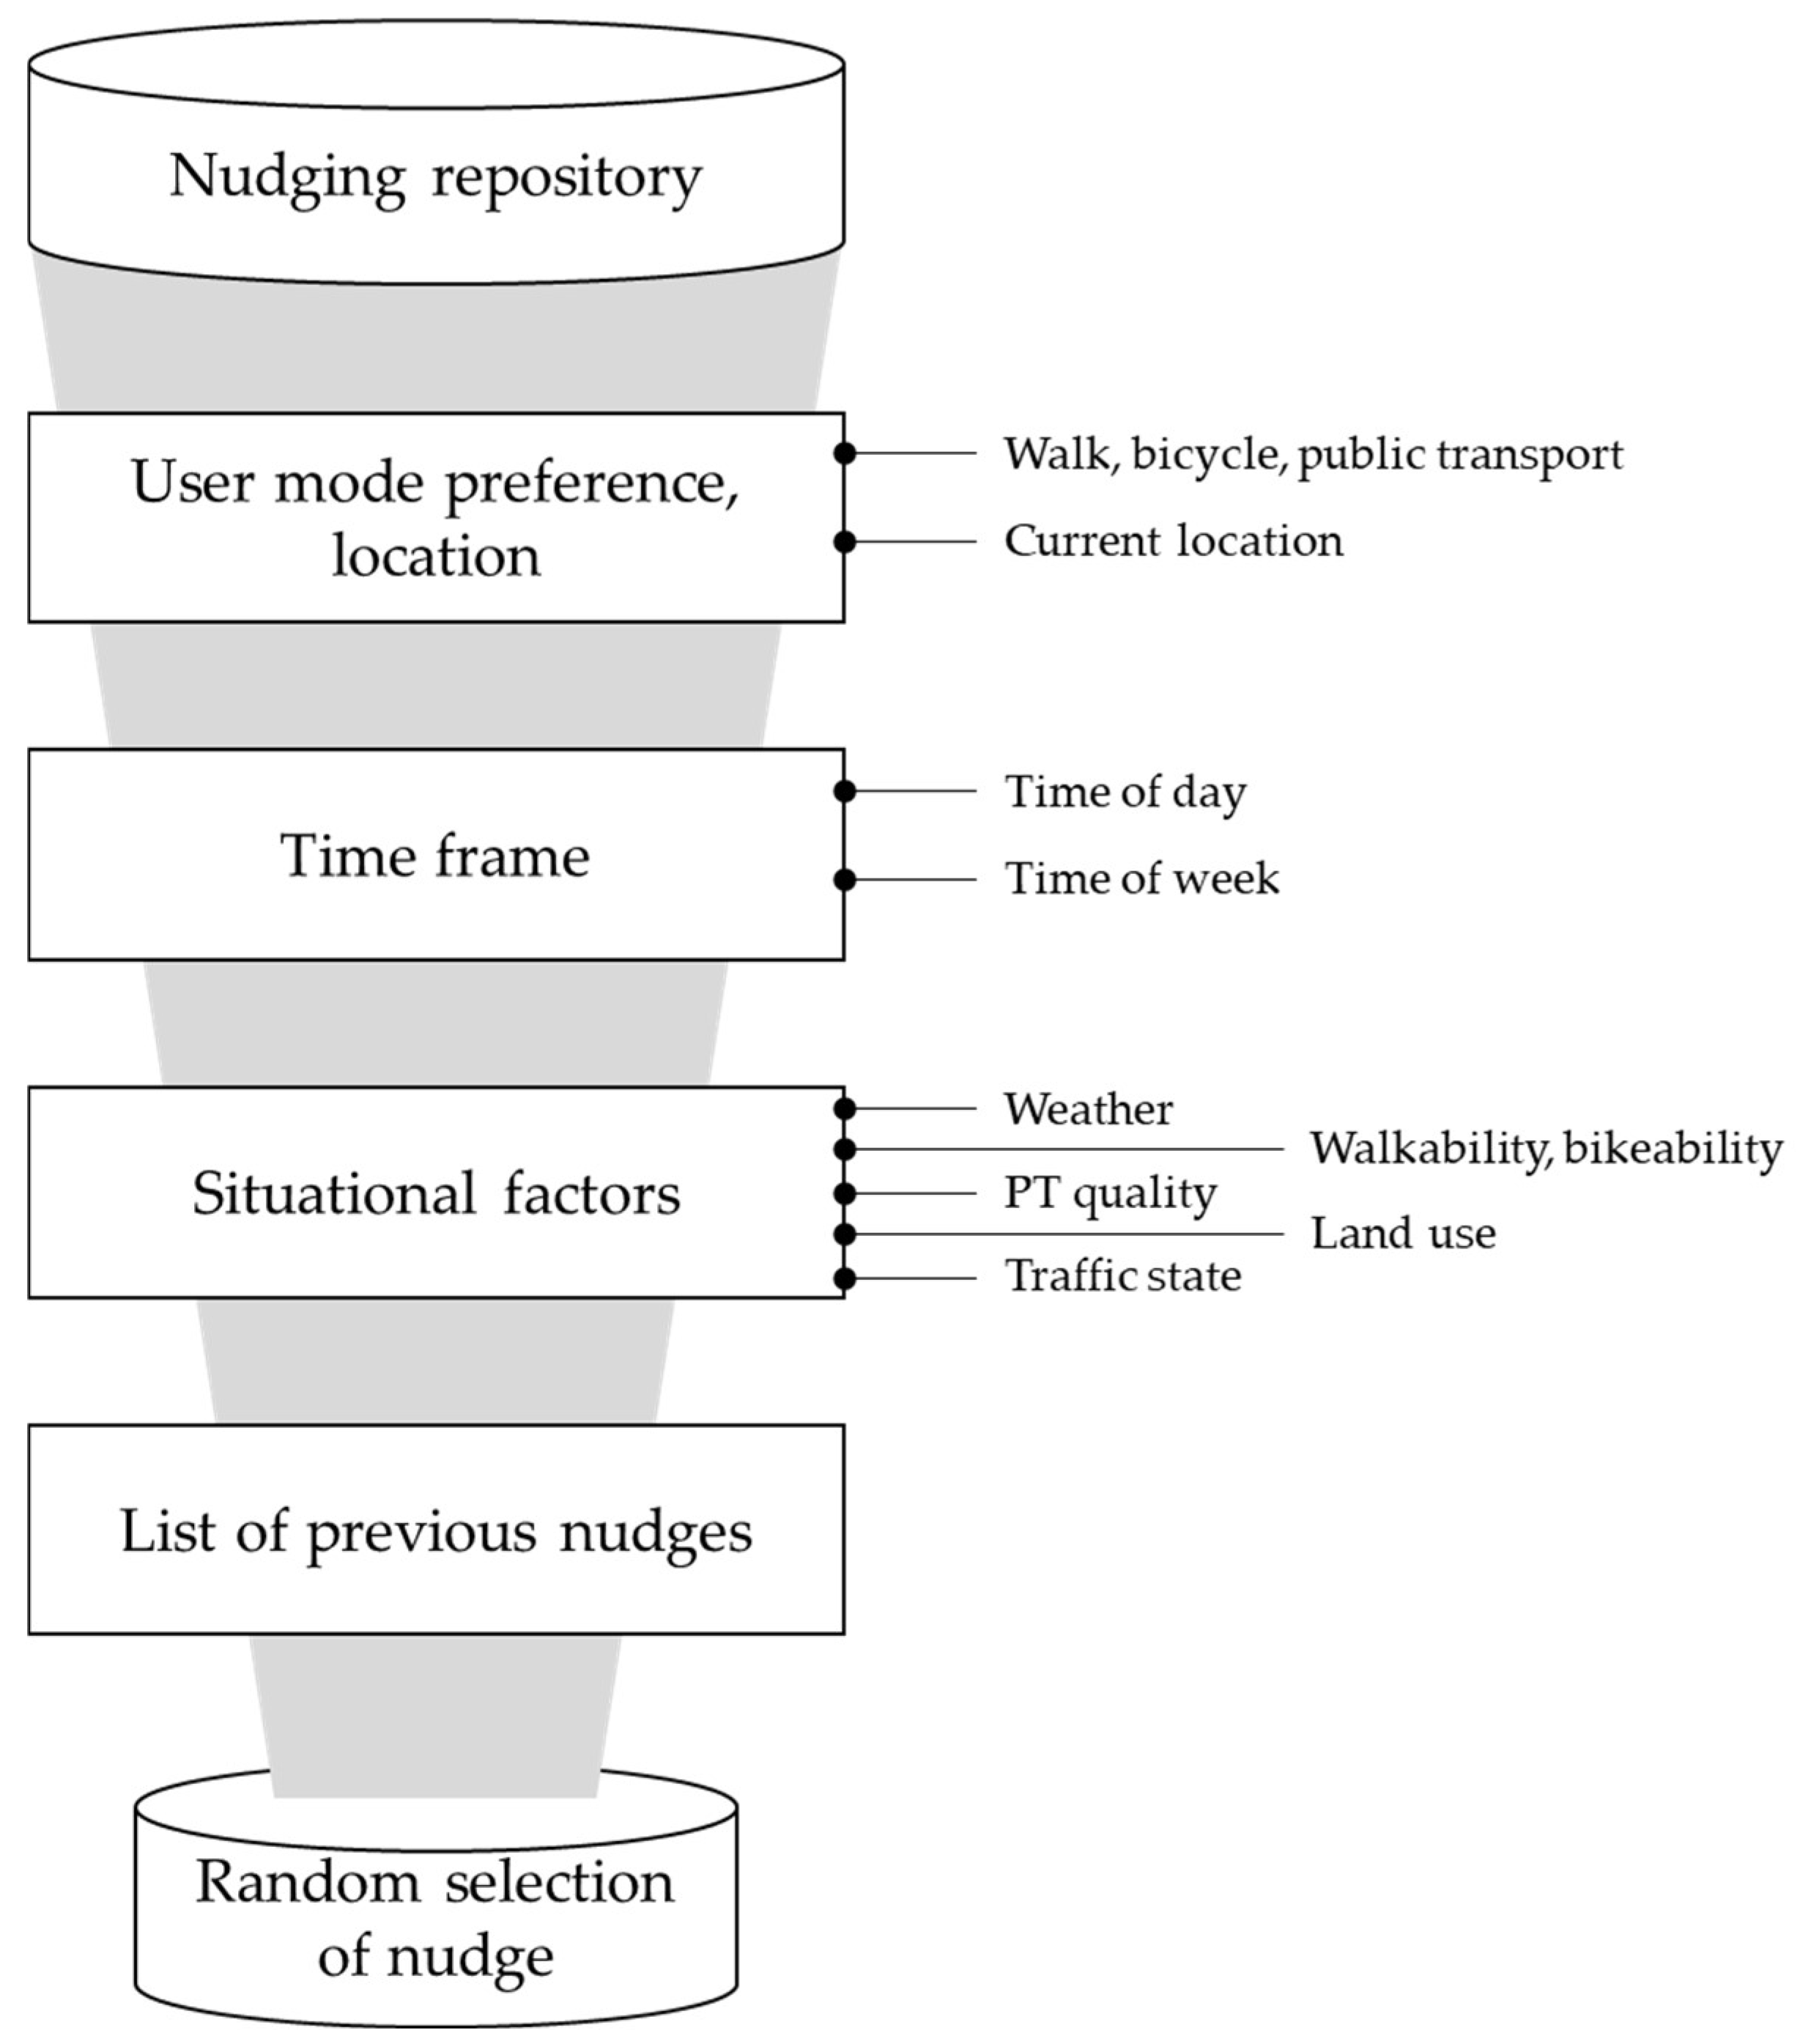
For the proof-of-concept, we could not cater to the full information needed due to lacking data availability or access. This was the case for the public transport occupancy rate (instead, we simulated data) and information on bicycle parking occupancy. Wherever data was not available, the situation-aware variable was interpreted as a null value, turning some situation-aware nudges into nudges that are triggered regardless of the situation.

4.3. Integration

The entire architecture, as shown in Figure 2, was implemented on our premises. The functional proof-of-concept is part of a larger field test conducted within the DyMoN project. The following description of the technical setup and integration is independent of the client, a proprietary health app in the specific case.
All components except for the interface are realized on a server, with the nudging repository, the various data sets, and functions (ontologies and rules) required to select applicable nudges based on the input parameters (‘mode_preference’, ‘date_time’, ‘locations’) and situational factors implemented in a PostgreSQL database. The nudge repository and input datasets are stored as database tables. The ‘get_nudge’ function acts as an entry point and can be called through the internally used nudge API. This function passes through the input parameters and returns a random nudge from the result set of the following function. The function ‘get_nudges’ checks and casts the input parameters, calculates the situational factors, and returns all applicable nudges. The situational factors are calculated in subordinate functions, in which the attributes (e.g., ‘temperature’, ‘precipitation’) representing a situational factor (e.g., ‘glaze’) are derived based on the input parameters (‘date_time’, ‘locations’) and checked against the predefined thresholds. If the conditions for a given situation are met, the appropriate values (e.g., ‘no glaze’) are returned as a situational factor. Finally, the input parameters (‘mode_preference’, ‘date_time’) and the values of all situational factors are compared to the conditions of each nudge, and only applicable nudges are returned as JSON files. The structure of the functions looks as follows (Box 1):
Box 1. Pseudo-code for the get_nudge function.
get_nudge(mode_preference, date_time, location_current, location_home, location_work) -- Function calling situation-aware nudges
        get_nudges(mode_preference, date_time, location_current, location_home, location_work) -- Function for getting a set of appropriate nudges
     get_weather(date, location_work) -- This function derives relevant weather parameters in an array using the data of the closest weather station.
     get_pt_proximity(location_home) -- This function counts the number of public transport stops for single points (home) within a buffer.
     get_pt_departure_frequency(date, location_home) -- This function calculates the daily mean number of public transport departures for the current day and the next day for single points (home) within a buffer.
     get_pt_occupancy(location_home) -- This function estimates the public transport occupancy rate for single points (home) within a buffer. Due to a lack of accessible data, we use simulated data.
     get_traffic_state(location_home, location_work) -- This function calculates a car route between pairs of points (home-work) using the function ‘get_route_car’ and a proximity value for single points (home) using a buffer. For routes, the number of congested edges along the route is derived. For proximity, the number of congested edges within the buffer is derived.
     get_car_parking_availability(location_work) -- This function calculates the car parking availability in percent for single points (work) within a buffer.
     get_walkability(location_current, location_home, location_work) -- This function calculates a pedestrian route between pairs of points (current-home, home-work) using the functions ‘get_route_pedestrian’, and a proximity value for single points (current, home) using a buffer. For routes, the average walkability index and length of the route are derived. For proximity, the average walkability index within the buffer is derived.
     get_green_walkway(location_home, location_work) -- This function returns information on the greenness of the route to the workplace location
     get_beautiful_walkway(location_home, location_work) -- This function returns information on the attractiveness of the route to the workplace location
     get_bikeability(location_current, location_home, location_work) -- This function calculates a bicycle route between pairs of points (current-home, home-work) using the functions ‘get_route_bicycle’, and a proximity value for single points (current, home) using a buffer. For routes, the average bikeability index and length of the route are derived. For proximity, the average bikeability index within the buffer is derived.
     get_green_bicycle_way(location_home, location_work) -- This function returns information on the greenness of the bicycle route to the workplace location
     get_safe_bicycle_way(location_home, location_work) -- This function returns information on the safety of the bicycle route to the workplace location
The ‘get_nudges’ function is triggered by a schedule implemented in the interface. This interface consists of several microservices, which are orchestrated in different docker modules (all written in Python) and communicate in an event-driven architecture (EDA) style. The most important internal service is dedicated to scheduling the request and delivery of nudges and starting all nudge-related tasks. Since the service requests all the data it needs from the data hub and receives it in response, no public endpoints are required. The service can be executed any arbitrary number of times per day. For communicating with clients, an API gateway service is also implemented as part of the interface. It is publicly accessible to any client via predefined endpoints. If necessary, the data is forwarded to a specific service or local database. All internal communication between services and all communication between the interface and its clients and the data hub is based on REST and uses the JSON format.

4.4. Functional Proof

The functional proof-of-concept is integrated into a larger field study conducted in Salzburg (Austria). We monitor all delivered nudges and log the situational factors. For this, we use a simple, map-based application in which all situations can be reproduced (see Figure 5).
In the following, we present the sensitivity of the situation-aware nudging to changing conditions in three examples.
In the first example (see Table 4), two scenarios with equal input data regarding mode preference and location but different weather conditions are compared. In both cases, nudges towards bicycling are picked. However, they semantically account for the current (weather) situation. In scenario 1a, the nudge anticipates the forecasted sunshine and absence of precipitation. Alternative scenario 1b reflects the expected rainfall (similar to the situation illustrated in Figure 5) in the nudge and suggests equipping accordingly.
The second example illustrates how dynamic data from real-time sources are used to describe situations and how nudges are adapted subsequently (see Table 5). The input parameters are the same for both scenarios. Therefore, the static environment—in this case, the suitability for pedestrians (walkability)—is identical. The weather is comparable as well, with moderate temperatures and no rainfall. However, in scenario 2b, another real-time data source, namely the traffic state on the route from home to work location, outputs a value that is considered in the selection of nudges. This additional information is anticipated in the nudge, which directly mentions the congestion as a motivator to walk to work. Such semantical correspondence is facilitated by the ontologies, which link the nudge repository with the data hub.
Similar to the previous example, the third one uses dynamic data for issuing situation-aware nudges; in this case, for users who prefer public transport over other modes. Scenario 3a (see Table 6) checks the availability of public transport stops in close proximity to the home location as well as the frequency of departures. As both variables are above the predefined threshold (favorable for PT), a motivational nudge for using PT is sent out. In scenario 3b, the setting is the same, but the get_pt_occupancy request returns enough available seats, semantically reflected in the generated nudge.

5. Discussion

The review of the few examples in which nudging was used for promoting sustainable mobility revealed the lack of situational awareness in the design of digital nudges on the one hand and the huge potential that is assigned to situation-aware nudges in terms of effectivity [20]. To the best of our knowledge, this is the first paper that links concepts from behavioral psychology, GIS science, and HCI for a framework for situation-aware nudges and demonstrates the feasibility of the approach in a proof-of-concept. We found that location, together with time, is an important key to relating the nudges to the situation of the addressees.
Luger-Bazinger et al. [18] stated that nudging frameworks are commonly unrelated to established behavioral models. With the framework proposed in this paper, we address this concern by using the established COM-B model [42] as a guiding theoretical frame. Following Ton et al, Luger-Bazinger et al, as well as Luger-Bazinger and Hornung-Prähauser [16,18,28], we consider external and internal factors that shape mobility choices. The external factors or opportunities, respectively, are considered by the situation awareness of the framework. We successfully deduce context information from the spatio-temporal reference and with this, respond to the request from previous studies to embed nudges into the recipients’ specific situation [19,20]. Internal factors are addressed by motivational nudges aimed at modifying the choice architecture of individuals.
The proposed framework is set up of four components. The nudging repository, the data hub, ontologies that link the latter two, and the interface that manages client communication. This architecture facilitates great flexibility and can account for the dynamic nature of situations. The nudging repository and the data hub can be extended or adapted as needed without a necessary redesign of the entire system. Changes must then be updated in the ontologies and, in case, in the interface.
In the functional proof-of-concept, we demonstrated the feasibility of the proposed approach. We successfully implemented an architecture that automatically delivers situation-aware nudges from a rich nudging repository. The data demand defined by the nudges’ semantics or the associated conditions could be largely satisfied. However, the effort for this is still high due to a scarcity of adequate data, despite an increasing number of data sets published in machine-readable formats on open data platforms. The accessibility of road-related data for the study area is very good due to OpenStreetMap and comprehensive, authoritative data available on the national OGD portal. Although data on traffic state, both historical and real-time, is available and provided by a state agency, the access is not open but proprietarily licensed. Information related to public transport is limited to static data, comprising the location of stops and timetables. Real-time data on position and occupancy rate is not accessible in our study area (although available). Real-time and forecast weather data are accessible via standardized interfaces from various providers. As the weather is an important determinant for mode choice, the accessibility of suitable data is fundamental for situation-aware nudging toward sustainable mobility. Overall, we dealt with the different accessibility of required data sources. Smart data processing, the use of proxy variables, and the application of models—such as the applied NetAScore for calculating walkability and bikeability—as well as the definition of ontologies, allow for bypassing the partial data scarcity. However, a further push towards open data would further support and improve data-driven applications, such as the presented one.
The three presented examples show the importance of data availability and accessibility, as the nudges can be shaped better to the current situation of addresses by anticipating details that go beyond what the user knows anyway. While the built and static natural environment remains rather stable over time and people are aware of their immediate environment, dynamic data provide an additional value and thus increase the relevance and effectivity of interventions [20].
In the proof-of-concept, we showed the great potential of a digital setup for relating the digital sphere to the choice architecture of individuals. Concepts from GIS science and HCI provided the foundation for what we translated into an operating system. With the proposed framework, external factors relevant to mode choice—represented as digital data—and internal motivational factors could be merged. Based on what we know from the literature [19], we expect higher effectivity from this intervention design than situation-agnostic approaches. However, this must be tested in a separate study.

6. Conclusions

Nudging as a behavior modification technique is well established in some fields, particularly in medicine and health domains. The number of use cases that revolve around sustainable mobility is comparably low. Modifying mobility behavior is challenging as various factors need to come together. Whereas the provision of adequate infrastructure and attractive services is the backbone of any promotion of sustainable mobility regardless of individuals, the framing of sustainable mobility behavior must take the individual situation into account to become effective. Situation-aware nudging offers the opportunity to support sustainable mobility behavior while considering the respective situation of the individual. However, the conceptual background and workflows for implementing situation-aware nudging were not in place until now. Drawing upon valuable inputs from city representatives actively engaged in sustainable mobility and smart city management, we have taken a significant step by integrating established models from behavior change theory, GIS science, and HCI for the first time and translated this into a feasible technical pipeline. By incorporating these models, we aimed to enhance our understanding of how human behavior can be positively influenced and modified within the context of smart cities, particularly in the realm of sustainable mobility. With the functional proof-of-concept, we demonstrated the applicability of the proposed architecture in a real-world use case.
Further research will investigate the effectiveness of situation-aware nudges compared to global interventions. The framework’s architecture for situation-aware nudging supports the application in different settings. The use is not limited to sustainable commuting, as in the proof-of-concept, but can be adapted for any setting where location variables are decisive for individual decisions and behavior.
The feasibility of a situation-aware nudging framework is still limited by a lack of adequate and accessible data. Apart from this, the specificity of nudges could be increased if personal data are integrated into the framework. If this was done, learning components could be added to the architecture proposed here (see Figure 2). However, this would increase the effort for safe and secure systems and raises additional privacy issues, which need to be balanced with the added value. For the latter, no guiding frameworks exist. Thus, we propose to conduct further research on the tension field between the specificity of nudges, gained effects, and acceptance in terms of privacy and consent management.
With the proposed framework for situation-aware nudging, we provide an additional tool for promoting sustainable mobility. We fully acknowledge that providing a safe, comfortable, and attractive offer (infrastructure, level of service) is fundamental for the ongoing mobility transition. All these measures must be accompanied by regulatory measures. As a third element in a comprehensive, systemic promotion of sustainable mobility, targeting the choice architecture of individuals is regarded as a viable opportunity. By drawing from established concepts regarding behavioral research, GIS science, and HCI, we ensure the proposed framework is effective.

Author Contributions

M.L. wrote the manuscript, researched situation awareness, initiated the interdisciplinary research collaboration, and was involved in the grant acquisition. C.L.-B. designed the nudging repository, contributed to the manuscript, and reviewed the sections on behavior change and nudging. C.S. conducted the interviews with stakeholders. D.K., R.W. and M.S. implemented the proof-of-concept and contributed to Section 3. All authors have read and agreed to the published version of the manuscript.

Funding

The research presented in this paper has received funding within the framework of the Joint Programming Initiative (JPI) Urban Europe (project DyMoN “Dynamic Mobility Nudge” with JPI number 99950017). This project (DyMoN) has received funding from the European Union’s Horizon 2020 research and innovation program under grant agreement No. 875022. Funding was received for Austria from the Federal Ministry of Climate Action, Environment, Energy, Mobility, Innovation, and Technology (BMK), for Germany from the Federal Ministry of Education and Research (BMBF), and for Sweden, from the Swedish Energy Agency (Energimyndigheten).

Data Availability Statement

The nudging repository used for the proof-of-concept is openly available on Zenodo, together with additional materials from the DyMoN research project: https://zenodo.org/communities/dymon/ (accessed on 9 May 2023).

Acknowledgments

The authors would like to extend their sincere appreciation to the Open Access Funding by the University of Salzburg.

Conflicts of Interest

The authors declare no conflict of interest.

References

  1. Geels, F.W.; Sovacool, B.K.; Schwanen, T.; Sorrell, S. Sociotechnical transitions for deep decarbonization. Science 2017, 357, 1242–1244. [Google Scholar] [CrossRef] [PubMed]
  2. Gössling, S. Why cities need to take road space from cars—And how this could be done. J. Urban Des. 2020, 25, 443–448. [Google Scholar] [CrossRef]
  3. Banister, D. The sustainable mobility paradigm. Transp. Policy 2008, 15, 73–80. [Google Scholar] [CrossRef]
  4. Garcia-Sierra, M.; van den Bergh, J.C.J.M.; Miralles-Guasch, C. Behavioural economics, travel behaviour and environmental-transport policy. Transp. Res. Part D Transp. Environ. 2015, 41, 288–305. [Google Scholar] [CrossRef]
  5. Thaler, R.H.; Sunstein, C.R. Nudge: Improving Decisions about Health, Wealth and Happiness; Revised edition in Penguin Books; Penguin Books: London, UK, 2009. [Google Scholar]
  6. Beck, H. Was ist Behavioral Economics? In Behavioral Economics: Eine Einführung; Beck, H., Ed.; Springer Fachmedien Wiesbaden: Wiesbaden, Germany, 2014; pp. 1–24. [Google Scholar] [CrossRef]
  7. Tversky, A.; Kahneman, D. Judgment under Uncertainty: Heuristics and Biases. Science 1974, 185, 1124–1131. [Google Scholar] [CrossRef]
  8. Lehner, M.; Mont, O.; Heiskanen, E. Nudging—A promising tool for sustainable consumption behaviour? J. Clean. Prod. 2016, 134, 166–177. [Google Scholar] [CrossRef]
  9. Hummel, D.; Maedche, A. How effective is nudging? A quantitative review on the effect sizes and limits of empirical nudging studies. J. Behav. Exp. Econ. 2019, 80, 47–58. [Google Scholar] [CrossRef]
  10. Mertens, S.; Herberz, M.; Hahnel, U.J.J.; Brosch, T. The effectiveness of nudging: A meta-analysis of choice architecture interventions across behavioral domains. Proc. Natl. Acad. Sci. USA 2022, 119, e2107346118. [Google Scholar] [CrossRef]
  11. Schneider, C.; Weinmann, M.; vom Brocke, J. Digital nudging: Guiding online user choices through interface design. Commun. ACM 2018, 61, 67–73. [Google Scholar] [CrossRef]
  12. Klieber, K.; Luger-Bazinger, C.; Hornung-Prähauser, V.; Geser, G.; Wieden-Bischof, D.; Paraschivoiu, I.; Layer-Wagner, T.; Möstegl, N.; Huemer, F.; Rosan, J. Nudging sustainable behaviour: Data-based nudges for smart city innovations. In Proceedings of the ISPIM Innovation Conference, Virtual, 7–10 June 2020. [Google Scholar]
  13. Santos Silva, M. Nudging and Other Behaviourally Based Policies as Enablers for Environmental Sustainability. Laws 2022, 11, 9. [Google Scholar] [CrossRef]
  14. Lamb, W.F.; Grubb, M.; Diluiso, F.; Minx, J.C. Countries with sustained greenhouse gas emissions reductions: An analysis of trends and progress by sector. Clim. Policy 2022, 22, 1–17. [Google Scholar] [CrossRef]
  15. Schwanen, T.; Banister, D.; Anable, J. Rethinking habits and their role in behaviour change: The case of low-carbon mobility. J. Transp. Geogr. 2012, 24, 522–532. [Google Scholar] [CrossRef]
  16. Luger-Bazinger, C.; Hornung-Prähauser, V. Innovation for Sustainable Cities: The Effects of Nudging and Gamification Methods on Urban Mobility and Sustainability Behaviour. GI_Forum 2021, 9, 251–258. [Google Scholar] [CrossRef]
  17. Casquero, D.; Monzon, A.; García, M.; Martínez, O. Key Elements of Mobility Apps for Improving Urban Travel Patterns: A Literature Review. Future Transp. 2022, 2, 1–23. [Google Scholar] [CrossRef]
  18. Luger-Bazinger, C.; Geser, G.; Hornung-Prähauser, V. Digital behavioural interventions for sustainable mobility: A review of behaviour change techniques in mobile apps. In The Behavioral Economics Guide 2023; Samson, A., Ed.; Behavioral Science Solutions Ltd.: London, UK, 2023; pp. 68–75. [Google Scholar]
  19. Mont, O.; Lehner, M.; Heiskanen, E. Nudging—A Tool for Sustainable Behaviour? Swedish Environmental Protection Agency: Stockholm, Sweden, 2014.
  20. Anagnostopoulou, E.; Bothos, E.; Magoutas, B.; Schrammel, J.; Mentzas, G. Persuasive Technologies for Sustainable Mobility: State of the Art and Emerging Trends. Sustainability 2018, 10, 2128. [Google Scholar] [CrossRef] [Green Version]
  21. Sallis, J.F.; Cerin, E.; Conway, T.L.; Adams, M.A.; Frank, L.D.; Pratt, M.; Salvo, D.; Schipperijn, J.; Smith, G.; Cain, K.L.; et al. Physical activity in relation to urban environments in 14 cities worldwide: A cross-sectional study. Lancet 2016, 387, 2207–2217. [Google Scholar] [CrossRef] [Green Version]
  22. Eldeeb, G.; Mohamed, M.; Páez, A. Built for active travel? Investigating the contextual effects of the built environment on transportation mode choice. J. Transp. Geogr. 2021, 96, 103158. [Google Scholar] [CrossRef]
  23. Næss, P.; Peters, S.; Stefansdottir, H.; Strand, A. Causality, not just correlation: Residential location, transport rationales and travel behavior across metropolitan contexts. J. Transp. Geogr. 2018, 69, 181–195. [Google Scholar] [CrossRef]
  24. Gerike, R.; Koszowski, C.; Schröter, B.; Buehler, R.; Schepers, P.; Weber, J.; Wittwer, R.; Jones, P. Built Environment Determinants of Pedestrian Activities and Their Consideration in Urban Street Design. Sustainability 2021, 13, 9362. [Google Scholar] [CrossRef]
  25. Dalton, A.M.; Jones, A.P.; Panter, J.R.; Ogilvie, D. Neighbourhood, Route and Workplace-Related Environmental Characteristics Predict Adults’ Mode of Travel to Work. PLoS ONE 2013, 8, e67575. [Google Scholar] [CrossRef] [Green Version]
  26. Hamre, A.; Buehler, R. Commuter Mode Choice and Free Car Parking, Public Transportation Benefits, Showers/Lockers, and Bike Parking at Work: Evidence from the Washington, DC Region. J. Public Transp. 2014, 17, 67–91. [Google Scholar] [CrossRef] [Green Version]
  27. De Vos, J.; Cheng, L.; Kamruzzaman, M.; Witlox, F. The indirect effect of the built environment on travel mode choice: A focus on recent movers. J. Transp. Geogr. 2021, 91, 102983. [Google Scholar] [CrossRef]
  28. Ton, D.; Duives, D.C.; Cats, O.; Hoogendoorn-Lanser, S.; Hoogendoorn, S.P. Cycling or walking? Determinants of mode choice in the Netherlands. Transp. Res. Part A Policy Pract. 2019, 123, 7–23. [Google Scholar] [CrossRef]
  29. Bartoletti, S.; Chiaraviglio, L.; Fortes, S.; Kennouche, T.E.; Solmaz, G.; Bernini, G.; Giustiniano, D.; Widmer, J.; Barco, R.; Siracusano, G.; et al. Location-Based Analytics in 5G and Beyond. IEEE Commun. Mag. 2021, 59, 38–43. [Google Scholar] [CrossRef]
  30. Dix, A.; Finlay, J.; Abowd, G.D.; Beale, R. Human-Computer Interaction, 3rd ed.; Pearson Education Limited: Harlow, UK, 2004. [Google Scholar]
  31. Coutaz, J.; Crowley, J.L.; Dobson, S.; Garlan, D. Context is key. Commun. ACM 2005, 48, 49–53. [Google Scholar] [CrossRef]
  32. Potchter, O.; Cohen, P.; Lin, T.-P.; Matzarakis, A. Outdoor human thermal perception in various climates: A comprehensive review of approaches, methods and quantification. Sci. Total Environ. 2018, 631, 390–406. [Google Scholar] [CrossRef]
  33. Higgins, C.D.; Sweet, M.N.; Kanaroglou, P.S. All minutes are not equal: Travel time and the effects of congestion on commute satisfaction in Canadian cities. Transportation 2018, 45, 1249–1268. [Google Scholar] [CrossRef]
  34. Lättman, K.; Olsson, L.E.; Friman, M. A new approach to accessibility—Examining perceived accessibility in contrast to objectively measured accessibility in daily travel. Res. Transp. Econ. 2018, 69, 501–511. [Google Scholar] [CrossRef]
  35. Statistik Austria. Atlas der Erwerbspendler:Innen. Available online: https://www.statistik.at/atlas/pendler/ (accessed on 24 March 2023).
  36. Stadt Salzburg. Räumliches Entwicklungskonzept—Grundlagenbericht 2021. Available online: https://www.stadt-salzburg.at/rek-grundlagenbericht/ (accessed on 24 March 2023).
  37. Miltgen, C.L.; Peyrat-Guillard, D. Cultural and generational influences on privacy concerns: A qualitative study in seven European countries. Eur. J. Inf. Syst. 2014, 23, 103–125. [Google Scholar] [CrossRef]
  38. Hochwarter, C.; Jahnel, D.; Uhl, A. Public Perceptions, Preferences and Legal Aspects towards ATMs with Biometric Authentication in Austria. In Proceedings of the 2019 International Conference of the Biometrics Special Interest Group (BIOSIG), Darmstadt, Germany, 18–20 September 2019; pp. 1–6. [Google Scholar]
  39. Miller, H.J.; Shaw, S.-L. Geographic Information Systems for Transportation in the 21st Century. Geogr. Compass 2015, 9, 180–189. [Google Scholar] [CrossRef]
  40. Loidl, M. Datenverfügbarkeit für die räumliche Modellierung von Gefahrenbereichen im Straßenverkehr—Eine Untersuchung mittelgroßer Smart Cities in Europa. AGIT J. Angew. Geoinformatik 2021, 7, 117–123. [Google Scholar] [CrossRef]
  41. Luger-Bazinger, C.; Marquez, R.M.; Harms, C.; Loidl, M.; Kaziyeva, D.; Hornung-Prähauser, V. Ethics of digital, data-based nudges: The need for responsible innovation. In Proceedings of the XXXIII ISPIM Innovation Conference “Innovating in a Digital World”, Copenhagen, Denmark, 5–8 June 2022. [Google Scholar]
  42. Michie, S.; van Stralen, M.M.; West, R. The behaviour change wheel: A new method for characterising and designing behaviour change interventions. Implement. Sci. 2011, 6, 42. [Google Scholar] [CrossRef] [PubMed] [Green Version]
  43. Luger-Bazinger, C.; Leistner, D.; Geser, G.; Hornung-Prähauser, V.; Loidl, M.; Kaziyeva, D. Nudging Repository—Set of Nudges (DyMoN Project). Zenodo 2023. [Google Scholar] [CrossRef]
  44. Michie, S.; Richardson, M.; Johnston, M.; Abraham, C.; Francis, J.; Hardeman, W.; Eccles, M.P.; Cane, J.; Wood, C.E. The Behavior Change Technique Taxonomy (v1) of 93 Hierarchically Clustered Techniques: Building an International Consensus for the Reporting of Behavior Change Interventions. Ann. Behav. Med. 2013, 46, 81–95. [Google Scholar] [CrossRef] [PubMed]
  45. Werner, C.; Wendel, R.; Kaziyeva, D.; Stutz, P.; van der Meer, L.; Zagel, B.; Loidl, M. NetAScore—Network Assessment Score Toolbox for Sustainable Mobility. Available online: https://github.com/plus-mobilitylab/netascore (accessed on 12 May 2023).
Figure 1. Structure of the main parts of the paper.
Sustainability 15 11149 g001
Figure 2. Components of the framework for situation-aware nudging.
Sustainability 15 11149 g002
Figure 3. Layered rulesets.
Sustainability 15 11149 g003
Figure 4. Screenshot from the Atlas of Commuters [35], showing incoming commuters to the city of Salzburg.
Sustainability 15 11149 g004
Figure 5. Monitor for the functional proof-of-concept in the context of a field study. Settings for different users can be reproduced in the settings (a). Situation awareness is derived from location information, such as the weather at a particular location (b). From the set of situation-aware nudges, nudges are randomly selected and delivered (c).
Sustainability 15 11149 g005
Table 1. Fictional examples for nudge texts and conditions.
Examples
Nudge text: informative“Do you know that you can substantially reduce your risk for cardiovascular diseases by cycling to work at least three times a week?”
“Healthy diet and regular physical activity lead to higher levels of well-being. Your daily commute is a perfect opportunity for walking or cycling.”
“More than 50% of all trips are shorter than 7 km. This is the perfect distance for cycling and gaining health benefits while protecting the environment.”
Nudge text: call for action“The sun is shining, and it will stay dry today. Get on your bike and collect extra points for our incentives store.”
“Three of your colleagues are already on the train. Pick up your free ticket in the HR office and join them tomorrow.”
Nudge text: fixed vs. flexible elements“Be on the safe side, stay dry, and take the bus to work.” vs. “It is going to rain for {x} hours today. The bus stop is only {m} meters from your home.”
“Cycling is a rewarding experience for all age groups.” vs. “{age} years is the perfect age for {cycling not as preferred mode} rediscovering the joy of cycling.”
Nudge condition: situation“Today is the perfect day for getting active. Let’s go to work by bike.” → {sunshine hours > 6 AND precipitation prognosis = 0 AND bikeability = high}
“It is not far to work. Why not take a walk instead of using the car?” → {distance to work < 3 km AND walkability = high}
Nudge condition: user-specific characteristics and preferences“Ladies are free on the bus today.” → {gender = female}
“Do you know that the transport sector accounts for 30% of all GHG emissions? Better take the train.” → {car = preferred, public transport = optional, bicycle = no, walking = no}
Table 2. Examples of ontologies, which formalize information on situations. Walkability and greenness indices are dimensionless, ranging between 0 and 1.
Situational FactorQualityValueAttribute 1Range 1OperatorAttribute 2Range 2
Walkabilityroutehighmean index_walk[0, 0.5]andlength m[0, 4000]
proximityhighmean index_walk[0, 0.5]anddistance m[0, 400]
Temperature positivedaily mean temp °C[0,)
Glaze no glazedaily mean temp °C(0,)ordaily mean prec. mm[0, 0]
Green walkproximitypresentmean index green[0, 0.5]anddistance m[0, 400]
PT frequencydepartureshighdep. per hour[6,)
Table 3. Characteristics of employed nudges with number of nudges per category.
ModeTrip PurposeBehavior Change GroupBehavior Change Technique
Bicycling 73
Public transport 31
Walking 61
Commuting 62
Leisure 7
Commuting and Leisure 96
Antecedents 5
Associations 20
Comparison of behavior 24
Comparison of outcomes 5
Covert learning 5
Goals and planning 16
Identity 9
Natural consequences 20
Regulation 4
Repetition and substitution 5
Reward and threat 6
Self-belief 15
Shaping knowledge 28
Social support 4
Action planning 8
Adding objects to the environment 5
Anticipated regret 3
Behavior substitution 2
Comparative imagining of future outcomes 2
Focus on past success 3
Framing/reframing 3
Future punishment 4
Goal setting (behavior) 3
Habit formation 3
Imaginary punishment 3
Imaginary reward 2
Incompatible beliefs 3
Information about antecedents 7
Information about emotional consequences 15
Information about environmental consequences 6
Information about health consequences 6
Information about others’ approval 7
Information about social consequences 4
Instruction on how to perform a behavior 5
Mental rehearsal of successful performance 5
Monitoring of emotional consequences 2
Problem-solving 5
Prompts/cues 20
Pros and cons 3
Reduce negative emotions 4
Self-reward 2
Social comparison 17
Social support (unspecified and practical) 4
Valued self-identity 3
Verbal persuasion about capability 7
Table 4. Adapted nudges for users who prefer the bicycle under good (scenario 1a) and rainy (scenario 1b) weather conditions. The table shows requests and replies (indicated by ->).
Scenario 1a (Sunday, 8 p.m.)Scenario 1b (Wednesday, 8 p.m.)
get_nudge(‘bicycle’, ‘20230507T200000’, None, ‘POINT(13.061541 47.788699)’, ‘POINT(13.0394319 47.8219307)’)
 get_nudges(‘bicycle’, ‘20230507T200000’, None, ‘POINT(13.061541 47.788699)’, ‘POINT(13.0394319 47.8219307)’)
 
  get_weather(‘20230507T200000’, ‘POINT(13.0394319 47.8219307)’)
  -> temperature(21 °C) = ‘moderate bicycle (work) (d1)’
  -> precipitation(0 mm) = ‘no rainfall (work) (d1)’
  -> glaze(21 °C, 0 mm) = ‘no glaze (work) (d1)’
  -> wind(4 m/s) = ‘no strong winds (work) (d1)’
  -> sunshine(482 min) = ‘sunshine (work) (d1)’
  get_bikeability(None, ‘POINT(13.061541 47.788699)’, ‘POINT(13.0394319 47.8219307)’)
  -> bikeability(0.1476, 5852.88 m) = ‘high (home-work)’
 -> nudges[]
-> nudge.id = 2
-> nudge.title = ‘Tomorrow is a great day…’
-> nudge.text = ‘for taking the bike! Prepare for your trip to be on time and don’t forget anything.’
get_nudge(‘bicycle’, ‘20230510T200000’, None, ‘POINT(13.061541 47.788699)’, ‘POINT(13.0394319 47.8219307)’)
 get_nudges(‘bicycle’, ‘20230510T200000’, None, ‘POINT(13.061541 47.788699)’, ‘POINT(13.0394319 47.8219307)’)

  get_weather(‘20230510T200000’, ‘POINT(13.0394319 47.8219307)’)
  -> temperature(26 °C) = ‘positive (work) (d1)’
  -> precipitation(5 mm) = ‘rainfall (work) (d1)’
  -> glaze(26 °C, 5 mm) = ‘no glaze (work) (d1)’
  get_bikeability(None, ‘POINT(13.061541 47.788699)’, ‘POINT(13.0394319 47.8219307)’)
  -> bikeability(0.1476, 5852.88 m) = ‘high (home-work)’
 -> nudges[]
-> nudge.id = 4
-> nudge.title = ‘With your rain jacket …’
-> nudge.text = ‘you can cycle to work tomorrow despite the rain. You can do it!’
Table 5. Adapted nudges for users who prefer to walk, with high walkability (scenario 2a) and high walkability + congestion for motorized traffic (scenario 2b). The table shows requests and replies (indicated by ->).
Scenario 2a (Tuesday, 6 a.m.)Scenario 2b (Thursday, 6 a.m.)
get_nudge(‘walk’, ‘20230509T060000’, None, ‘POINT(13.04482 47.801421)’, ‘POINT(13.0394319 47.8219307)’)
 get_nudges(‘walk’, ‘20230509T060000’, None, ‘POINT(13.04482 47.801421)’, ‘POINT(13.0394319 47.8219307)’)
 
  get_weather(‘20230509T060000’, ‘POINT(13.0394319 47.8219307)’)
  -> temperature(18 °C) = ‘moderate walk (work) (d0)’
  -> precipitation(0 mm) = ‘no rainfall (work) (d0)’
  -> wind(3 m/s) = ‘no strong winds (work) (d0)’
  -> sunshine(345 min) = ‘sunshine (work) (d0)’
  get_walkability(None, ‘POINT(13.04482 47.801421)’, ‘POINT(13.0394319 47.8219307)’)
  -> walkability(0.2771, 2879.95 m) = ‘high (home-work)’
 -> nudges[]
-> nudge.id = 90
-> nudge.title = ‘How about…’
-> nudge.text = ‘incorporating a little walk into your commute today? The weather is wonderful!’
get_nudge(‘walk’, ‘20230511T060000’, None, ‘POINT(13.04482 47.801421)’, ‘POINT(13.0394319 47.8219307)’)
 get_nudges(‘walk’, ‘20230511T060000’, None, ‘POINT(13.04482 47.801421)’, ‘POINT(13.0394319 47.8219307)’)

  get_weather(‘20230511T060000’, ‘POINT(13.0394319 47.8219307)’)
  -> temperature(17 °C) = ‘moderate walk (work) (d0)’
  -> precipitation(0 mm) = ‘no rainfall (work) (d0)’
  -> wind(4 m/s) = ‘no strong winds (work) (d0)’
  get_walkability(None, ‘POINT(13.04482 47.801421)’, ‘POINT(13.0394319 47.8219307)’)
  -> walkability(0.2771, 2879.95 m) = ‘high (home-work)’
  
  get_traffic_state(‘POINT(13.04482 47.801421)’, ‘POINT(13.0394319 47.8219307)’)
  -> traffic_state(5) = ‘congested (home-work) (d0)’
 -> nudges[]
-> nudge.id = 93
-> nudge.title = ‘Congestion ahead’
-> nudge.text = ‘The streets are pretty crowded today... how about a walk to work?’
Table 6. Adapted nudges for users who prefer public transport, considering distance and service level of the next PT stop (scenario 3a) and occupancy rate in addition (scenario 3b). The table shows requests and replies (indicated by ->).
Scenario 3a (Tuesday, 6 a.m.)Scenario 3b (Friday, 6 a.m.)
get_nudge(‘public’, ‘20230509T060000’, None, ‘POINT(13.061541 47.788699)’, ‘POINT(13.0394319 47.8219307)’)
 get_nudges(‘public’, ‘20230509T060000’, None, ‘POINT(13.061541 47.788699)’, ‘POINT(13.0394319 47.8219307)’)
 
  get_pt_proximity(‘POINT(13.061541 47.788699)’)
  -> pt_proximity(6) = ‘present (home)’
  get_pt_departure_frequency(‘20230509T060000’, ‘POINT(13.061541 47.788699)’)
  -> pt_departure_frequency(26.87) = ‘high (home) (d0)’
 -> nudges[]
-> nudge.id = 32
-> nudge.title = ‘You can save a lot of CO2 on a daily basis …’
-> nudge.text = ‘if you chose to take public transport instead of your car!’
get_nudge(‘public’, ‘20230512T060000’, None, ‘POINT(13.061541 47.788699)’, ‘POINT(13.0394319 47.8219307)’)
 get_nudges(‘public’, ‘20230512T060000’, None, ‘POINT(13.061541 47.788699)’, ‘POINT(13.0394319 47.8219307)’)

  get_pt_proximity(‘POINT(13.061541 47.788699)’)
  -> pt_proximity(6) = ‘present (home)’
  get_pt_departure_frequency(‘20230512T060000’, ‘POINT(13.061541 47.788699)’)
  -> pt_departure_frequency(26.87) = ‘high (home) (d0)’
  
  get_pt_occupancy(‘POINT(13.061541 47.788699)’)
  -> pt_occupancy(50%) = ‘low (home) (d0)’
 -> nudges[]
-> nudge.id = 99
-> nudge.title = ‘A free seat is waiting for you!’
-> nudge.text = ‘How about taking public transport today?’
Disclaimer/Publisher’s Note: The statements, opinions and data contained in all publications are solely those of the individual author(s) and contributor(s) and not of MDPI and/or the editor(s). MDPI and/or the editor(s) disclaim responsibility for any injury to people or property resulting from any ideas, methods, instructions or products referred to in the content.

