Abstract
Urban seismic hazards are natural disasters caused by earthquakes in urban areas, which may lead to serious casualties, the collapse of buildings, infrastructure damage, and other impacts, require huge social resources for recovery and reconstruction, and even affect the security stability and sustainable development of the area. This paper adopts the research idea of “Risk = Hazard × Exposure × Vulnerability ÷ Emergency response and recovery capability” and constructs an evaluation system containing 24 representative indicators on this basis. The CF-logistic regression model is applied in the study to calculate the seismic hazard, while the combined weight-TOPSIS model is used to assess the vulnerability of urban hazard-bearing body. Lastly, the study conducts multi-criteria seismic risk evaluation using the GIS platform. The results show that the overall seismic risk in Songyuan is moderate, with 18.66% of the medium-risk area, 37.68% of the very low risk area, 33.96% of the low-risk area, 8.47% of the high-risk area, and 1.23% of the very high-risk area. The significance of this study is to provide a scientific basis for formulating corresponding disaster prevention and mitigation measures and emergency plans, improving urban disaster prevention and emergency response capabilities, reducing urban earthquake disaster losses, and helping to achieve safe and stable urban development.
1. Introduction
Earthquakes are a very dangerous natural phenomenon, the occurrence of which is random and unpredictable. The instantaneous release of energy from a large earthquake will directly cause the collapse of houses and changes in geography and landscape, which will make a huge impact on people’s production and life. Since the 5.4 magnitude earthquake in Xiuyan, Liaoning, in 1999, shallow-source earthquakes in northeastern China have entered their fifth active period, with ten earthquakes of magnitude 5.0 or greater occurring between January 2013 and December 2019 [1], the largest of which was the 5.8 magnitude earthquake in Qianguo County, Songyuan City, Jilin Province. Jilin Songyuan is in a geological tectonic zone, located near the Pacific Rim Volcanic Seismic Zone, with complex seismic geology and the distribution of several fracture zones, which have the geological and tectonic background for destructive earthquakes. Songyuan is the second largest chemical city in Jilin Province and is an important petrochemical, energy, and food-production city in China. In recent years, with the development of the national economy, the modernization construction of Songyuan City is changing day by day; various lifeline projects are intertwined; the city is densely populated; and there are many tall buildings. Once hit by a large earthquake, it will cause serious or catastrophic consequences to the city and important buildings and facilities, so it is of strong theoretical and practical significance to evaluate the seismic hazard risk in this area.
The UN International Decade for Disaster Reduction (IDNDR) Committee has undertaken several projects and initiatives in earthquake disaster reduction to promote earthquake prevention and mitigation worldwide, including the Earthquake Risk Assessment: a project to develop tools and methods to help governments and other stakeholders assess earthquake risks and develop effective mitigation strategies and responses.
Seismic risk assessment is an important measure to reduce the impact of earthquakes and therefore has received extensive attention from many scholars at home and abroad. These studies are broadly grouped into the following categories. One is modeling based on disaster scenarios. For example, Arianna et al. (2020) estimated the seismic risk under various scenarios by constructing damage probability matrices based on deterrent-minimum earthquake scenarios and probabilistic earthquake scenarios based on direct social and economic losses and mapped the results using a GIS system tool [2]. Antonietti et al. (2020) used a discontinuous Galerkin spectral element method to solve a three-dimensional differential model at the regional scale to describe the propagation of seismic waves through the strata to the surface and predicted the damage to buildings at the urban scale in combination with the fragility function [3]. The study by Du et al. (2020), on the other hand, explored the impact of intensity metric (IM) selection on the predictive performance of the combination level proxy demand model and on regional seismic risk estimation by modeling a virtual spatially distributed structural assemblage in scenario earthquakes, providing for more accurate and reliable regional seismic risk estimation [4]. Goda et al. (2022) conducted a scenario-based regional seismic risk analysis by considering characteristics such as shape, location, and rupture mode of faults and by combining population exposure and building vulnerability to map earthquake risk in south-central Malawi [5]. In summary, scenario-based risk assessment of earthquakes needs to consider the probability of earthquake occurrence, magnitude, and source mechanism and calculate the risk value based on the level of damage and exposure of the affected body.
The other is modeling based on the indicator system, which means that suitable indicators are selected to describe the physical and social characteristics of the study object and analyzed comprehensively by a suitable mathematical model. Robat et al. (2018) introduced the Integrated Seismic Safety Index “IESI” considering hazard, vulnerability, and responsiveness to assess the seismic risk in two districts of the city of Tehran [6]. Hou et al. (2019) used an index system-based approach combining the Delphi method (Delphi) and the hierarchical analysis method (AHP) to assess the seismic hazard risk in Zhejiang Province [7]. This work further expands the indicator system for seismic risk assessment. Guo et al. (2020) analyzed the social vulnerability of different districts and counties facing seismic hazards in Hanzhong City by using a rough hierarchical analysis and identified the most important factors affecting vulnerability through sensitivity and robustness analysis [8], which provided a reference for the study of vulnerability of disaster-bearing bodies. Sauti et al. (2021) estimated vulnerability in terms of exposure, resilience, and capacity factors to estimate vulnerability, generated a total vulnerability map by integrating the study variables through a GIS tool, and then superimposed it with the seismic hazard map to derive a seismic risk map for the study area [9]. Diana et al. (2022) analyzed seismic hazard, seismic vulnerability, and integrated seismic risk based on a geographic information system (GIS) by selecting geomorphological, geophysical, and socio-economic data and considering different seismic scenarios [10], which further expanded the index system used for seismic risk assessment.
With the development of computer science, advanced machine learning methods and neural network models have also been applied to the study of seismic risk assessment (Jena et al., 2020; Yariyan et al., 2020) [11,12]. Torres et al. (2019) used several of the machine learning techniques, namely, decision trees, SVM, logistic regression, and Bayesian networks, to assign different buildings with seismic vulnerability [13]. The work of Jena et al. (2020) represents the state-of-the-art in incorporating neural network models for seismic risk assessment. This work proposes a novel artificial neural network cross-validation (4-fold ANN-CV) with a hybrid analytic hierarchy process, which is used for hazard assessment by combining it with a technique for ranking the similarity of ideal solutions (AHP-TOPSIS), followed by vulnerability mapping based on the social and structural factors and finally multiplying the hazard index with the vulnerability index to obtain the seismic risk results [14].
In addition to the above studies, a seismic risk assessment approach combining engineering seismic studies and related modeling is also used, which focuses on modeling the vulnerability and exposure of buildings, populations, etc., within a region to assess expected losses. Silva et al. (2015) considered a combination of seismic hazard, structural vulnerability, and exposure data at a national scale, to identify areas that are more susceptible to damage from earthquakes and to estimation of expected losses [15]. The study by Crowley et al. (2020), on the other hand, aimed to construct an exposure model to characterize the distribution of the main residential, industrial, and commercial building categories across European countries, as well as their occupant populations and replacement costs [16]. Building on previous studies, Masi et al. (2021) critically reviewed and updated the hazard, exposure, and vulnerability models with reference to the six EMS-98 categories, integrating observed actual damage data with numerical simulation results (mechanistic approach) to provide a more comprehensive national risk perspective [17].
All of the above studies have laid the foundation for earthquake risk assessment and urban vulnerability studies, but there are still some limitations. For example, the scenario simulation method requires the support of large amount of data and requires high accuracy of data. The method considering engineering seismic resistance also requires very specialized knowledge and high operational requirements for researchers. In addition, the current method by constructing an evaluation index system tends to ignore the mitigating effect of pre-disaster preparation on post-disaster outcomes, while the commonly used AHP method to determine index weights is influenced by experts, and the evaluation results are also commonly used in a simple linear superposition method, which is not scientific enough. These limitations limit urban planning decision makers’ insight into an effective response to seismic risks.
To address the limitations of the above studies, this paper adopts the comprehensive hazard risk assessment theory of natural disasters proposed by Zhang et al. (2015) [18] for a multi-criteria urban earthquake risk assessment, which classifies risk into four elements: hazard, exposure, vulnerability, and urban coping capacity from the perspective of risk generation principles and, in this way, selects 24 representative indexes to construct the evaluation index system. In the selection and application of models and methods, this paper adopts two coupled models, the CF-logistic regression model and combined weights-TOPSIS model, which take into account the correlation between multiple factors and target variables and make the analysis results more interpretable. Finally, this paper calculates and visualizes the seismic risk in the study area based on the overlay analysis function and visualization function of GIS. The method of this paper is operable and enriches the index system used to evaluate the seismic risk of cities, and the indexes or other parameters can be used for the seismic risk analysis of other cities with appropriate substitutions. The results contribute to the stable development of cities, can provide an effective theoretical basis for urban planning decision makers, help identify hotspot areas when cities face disasters, and better guide urban earthquake risk management and response. The seismic risk evaluation process is shown in Figure 1.
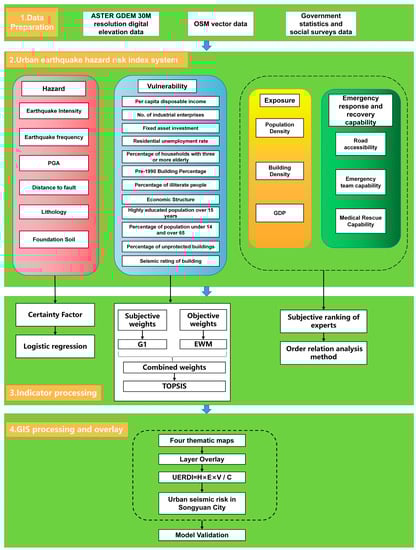
Figure 1.
Workflow of the study.
2. Study Area
Songyuan City is located in northeastern China, west-central Jilin Province, between 123°6′ and 126°11′ east longitude and between 43°59′ and 45°32′ north latitude. It is located in the combination of Heilongjiang, Inner Mongolia, and Jilin provinces, with Changchun and Siping as neighbors in the southeast, bordering Baicheng City and Inner Mongolia Autonomous Region in the west and looking north across the Songhua River, Neng River and Lalin River with Heilongjiang. As of 1 November 2020, the resident population of Songyuan City is 225,2994 people (Figure 2).
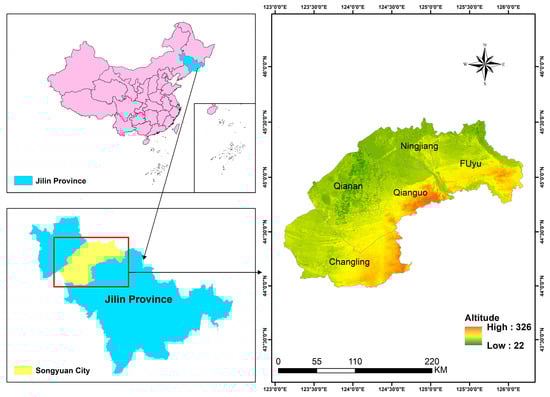
Figure 2.
Location of the study area.
Songyuan is located in the southern part of the Songnen Plain, with flat and open terrain and gentle undulations. It is mainly composed of the Songnun Alluvial Plain and the Songliao Divide Tableland Plain, with an average altitude of between 130 and 266 m. The ground in the south of Changling County is undulating and slightly uplifted and is a section of the watershed of the Songhua River and Liao River. However, the terrain is low and gentle, and the ground is only a dozen meters above the plain to the west. To the north and northeast is the plain formed by the second Songhua River, Lalin River, and Neng River alluvium.
Songyuan City has one municipal district, one county-level city, two counties, and one autonomous county, which are Ningjiang District, Fuyu City, Qianan County, Changling County, and Qianguolos Mongol Autonomous County (Hereinafter referred to as Qianguo County).
Combined with the historical seismic background of Songyuan, Songyuan and the surrounding area are the only high intensity zone of degree VIII in Jilin Province, and the area around Songyuan and Baicheng Da’an is one of the 24 key seismic surveillance and defense zones in the country identified by the State Council in 2006.
The Songyuan area has several fracture structures and possesses the conditions for destructive earthquakes. The main seismic zones (fracture zones) in Songyuan, Jilin, are the north-east oriented Nengjiang Rift, the eastern edge of the Songliao Basin Rift, the Yitong-Shulan Rift, the Dunhua-Mishan Rift, the Hun River Rift, the Yalu River Rift, and the north-west oriented Second Songhua River Rift. Figure 3 shows the main fracture structures in the Songyuan area (Figure 3).
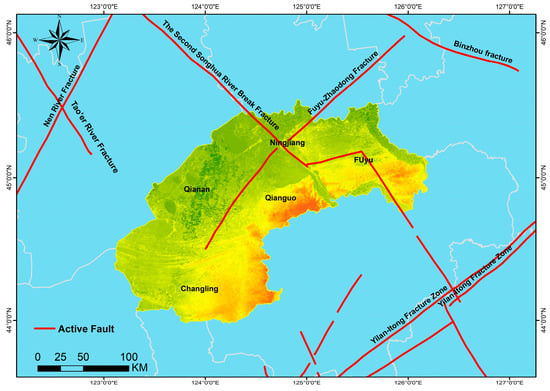
Figure 3.
Distribution of fracture zones in Songyuan City and neighboring areas.
3. Data and Methods
3.1. Data Acquisition and Preparation
To conduct a comprehensive analysis of urban seismic hazard risk, this study necessitates a substantial volume of spatial attribute data and statistical data.
By reviewing relevant research materials and consulting expert advice, a total of 24 representative indicators were selected from four aspects: hazard, exposure, vulnerability, and emergency response and recovery capability, and Table 1 summarizes the indicators and data sources selected for this study.

Table 1.
Data source.
3.2. Certainty Factor
The CF model is a probability function proposed by Shortliffe et al. [19] and improved by Heckerman [20]. Assuming that the conditions for future seismic hazards are the same as those for past seismic hazards, it is calculated as follows:
where PPa is the conditional probability of seismic hazard occurring in the factor classification data a, which is usually expressed as the ratio of the area of seismic hazard in factor classification a to the area of classification a in practical studies; PPs is the ratio of the total area of hazard in the study area to the total area of the study area. From Equation (1), the variation interval of CF is [–1, 1], where a positive value indicates an increase in the certainty of event occurrence, i.e., easy to occur seismic hazard; a negative value indicates a decrease in the certainty of event occurrence, i.e., not easy to occur seismic hazard.
3.3. Combined Weight
3.3.1. Subjective Weight
In this paper, a combination of subjective and objective weights is used, with the subjective weights using the order relation analysis method (G1 method) and the objective weights using the entropy weight method and order relation analysis method.
The G1 method is a new subjective assignment method improved on basis of hierarchical analysis (AHP) [21], which overcomes the shortcomings of hierarchical analysis while reducing the computational effort in determining the weights of each index; i.e., no judgment matrix needs to be constructed, and no consistency check is required, and its operability is strong.
The ratio judgment of relative importance between indicators is given. The ratio is used to measure the magnitude of the importance of the indicators of the backward and forward sequential relations (Table 2), and the formula for rational judgment of experts on the ratio of the importance of indicators Ak−1 to Ak is as follows:
Table 2.
rk rational assignment and description.
The ranking weights are calculated according to the ordinal relationship and the r-value, and the formula is as follows:
The next step is to calculate the indicator weight by the rational assignment rk given by the expert, which are calculated as follows:
3.3.2. Objective Weight
In this method, m samples and n indicators are set in the evaluation, and the measured value of the ith indicator in the jth sample is recorded as rij.
The entropy weighting method (EWM) [22] is used in this paper to calculate the objective weights. The main steps are as follows.
The first step is the standardization of measured values. The standardized value of the ith index in the jth sample is denoted as pij, and its calculation method is as follows:
In EWM, the entropy value ei of the ith index is defined as:
The entropy value ei is in the range of [0, 1]. The larger the ei, the greater the differentiation of index i, and more information can be derived. Therefore, the index should be given a higher weight. The formula for calculating the weights is expressed as:
3.3.3. Combined Weighting Method
The combination of subjective and objective weights is obtained by the following formula [23]:
where represents the subjective weight of indicator j, represents the objective weight of indicator j, and represents the combined weight.
3.4. TOPSIS Model
TOPSIS (Technique for Order of Preference by Similarity to Ideal Solution) is a commonly used multi-criteria decision analysis method for determining the order of the optimal solution among a set of feasible solutions. It is based on the Euclidean distance and the relative distance between positive and negative ideal solutions to calculate the relative proximity of each feasible solution [24].
The evaluation method is divided into five steps as follows:
Step 1: Standardization of index data.
For the case with m zones and n evaluation indicators, let the initial evaluation matrix be as follows:
The data were standardized, and for positive and negative indicators, the formulae were calculated as:
The final normalized matrix is obtained as
Step 2: Create a weighted decision evaluation matrix.
The weighted normalized matrix after considering the weights of each evaluation index is as follows:
W is the combined weight calculated from Equation (8).
Step 3: Determine the positive and negative ideal solutions.
Step 4: Calculate the distance of each sample from the positive and negative ideal solution.
The evaluation index to positive and negative ideal solutions is calculated by the following equation:
Step 5: Calculate the closeness of each evaluation object to the optimal solution and rank them.
The closeness of the evaluated value to the optimal value is expressed by the closeness, and the larger the value, the closer to the optimal value. The calculation formula is as follows:
3.5. Multi-Criteria Urban Seismic Hazard Risk Evaluation Model
In this paper, by reviewing a large number of relevant studies, we identified four criterion layers for evaluating urban earthquake disaster risk, which are hazard, exposure, vulnerability, and emergency response and recovery capability.
Seismic Hazard (H) is the magnitude of the probability of earthquake occurrence and the prediction of the degree of earthquake damage in a certain area, and it is one of the important indicators to assess the degree of earthquake risk in the area. In this paper, the CF-logistic regression model is used to calculate the urban seismic hazard risk. Logistic regression model is a multivariate statistical analysis method to study the relationship between dichotomous results and their influencing factors [25], which describes the relationship between a binary dependent variable and a series of independent variables (x1, x2, …, xn). In this paper, the CF value of the classification level of each influencing factor is the independent variable, and the occurrence of earthquake disaster is the dependent variable (0 means earthquake disaster does not occur; 1 means earthquake disaster occurs), and the binary logistic regression analysis is performed. The logistic regression equation is as follows:
In Equation (18), H is the probability of urban seismic hazard, H ∈ [0, 1]; the smaller the value of H, the lower the probability of urban seismic hazard. xk is the value of CF for each level; α is the regression constant; and β is the calculated regression coefficient.
Exposure (E) refers to all the properties and people that may be threatened by urban earthquake hazards and is a quantification of the value of the disaster-bearing body; i.e., the higher the population and property density, the greater the potential loss. Vulnerability (V) refers to the vulnerability of people and property in urban areas threatened by earthquakes and is a quantification of the carrying capacity; i.e., the higher the vulnerability, the greater the disaster loss. Disaster prevention and mitigation capacity (C) refer to the response and recovery capacity to disasters, which mainly include disaster-resilient material reserves, emergency management capacity, and disaster mitigation investment. The weaker the emergency response and recovery capacity, the greater the disaster risk. The calculation formula for each criterion level and is as follows [26,27]:
where E, V, and C values represent exposure, vulnerability, and emergency response and recovery capability, respectively. n is the total number of indicators; i denotes the indicator i; Wei, and Wri are the weights of each indicator obtained by the ordinal relationship method, respectively; and Wvi is the weight of the combination obtained by the combination weight method. Xei, Xvi, and Xri are the quantitative values of the indicators corresponding to exposure, vulnerability and emergency response and recovery capability.
In this study, the Urban Earthquake Risk Index (UERDI) is positively correlated with hazard (H), exposure (E), and vulnerability (V), and negatively correlated with emergency response and recovery capability (C). The Urban Earthquake Risk Index (UERDI) is calculated as follows:
All the indicators are classified according to their susceptibility to earthquakes or their amplification or reduction effect on the damage or loss results caused by earthquakes and assigned empirical values between 0 and 1. In this way, we can standardize the scale, eliminate the influence of different units of indicators, and simplify the calculation. This process is based on the overlay calculation function of the GIS platform.
4. Results
4.1. Hazard
Seismic hazard involves several indicators, including peak ground acceleration, distance to fault, intensity, earthquake frequency, lithology, and foundation soil classification, each of which has a different effect on seismic hazard [28].
4.1.1. Peak Ground Acceleration
Peak ground acceleration is the ground oscillation velocity caused by seismic waves and is an important parameter for measuring earthquake hazard [29,30]. The higher the value of acceleration, the more damaging the seismic wave is to buildings and infrastructure; therefore, peak ground acceleration is one of the critical indicators in seismic hazard assessment.
4.1.2. Distance to Fault
Distance to fault, which is the horizontal distance from an object to the fault plane, is also an important indicator of seismic hazard [31,32]. According to the study, the closer to the fault, the larger the seismic hazard is. Since the activity of the Second Songhua River Fault in the study area is doubtful, a relatively low assignment is taken. In this paper, the fault distance is graded by referring to the Japanese classification standard, which is shown in Table 3.
Table 3.
Fault hazard classification method.
4.1.3. Lithology
According to previous related studies, lithology is one of the important parameters in seismic hazard assessment. The main difference lies in the type and softness of rocks, and soft rocks are prone to disasters such as liquefaction and landslides in earthquakes [33,34].
4.1.4. Foundation Soil
Soil type has an important influence on parameters such as seismic wave propagation velocity, amplitude attenuation, and energy absorption, which in turn affect the seismic dynamics properties and the degree of earthquake damage. For example, weak clayey soils can intensify the occurrence of seismic liquefaction, leading to ground settlement and building tilt.
4.1.5. Seismic Intensity
Historical seismic intensity is an indicator that reflects the hazard of earthquakes in a particular region through the study of historical seismic events, and the higher the historical intensity, the more severe the seismic event is likely to occur in the future. In this paper, the intensity decay formula for the northeast region is used to calculate the seismic intensity [35].
4.1.6. Earthquake Frequency
Earthquake frequency is the average frequency of earthquakes occurring in a certain area at a certain time that has an important effect on the earthquake hazard. In terms of probability, the higher the seismic frequency, the higher the probability of an earthquake occurring in that region. In this paper, we use the calculation method proposed by Jian Wang [36], which is detailed in Equation (24).
where Vj is the frequency of earthquake at grid point j, ln is the natural logarithm, Di is the distance from earthquake i to grid point j, rm is the search radius centered at grid point, and n is the number of earthquakes within 30 km of grid point. The meaning of this equation is that the contribution of all earthquakes in the selected range to node j is accumulated by the inverse of the logarithm of the distance from the earthquake to the node, which is also called the density value, and it reflects the number of earthquakes and the sparsity in a comprehensive way.
The influence of the above six indicators on the seismic hazard was analyzed and evaluated, and the processing such as reclassification was performed in GIS. The results of the processing of each index are plotted as follows (Figure 4).
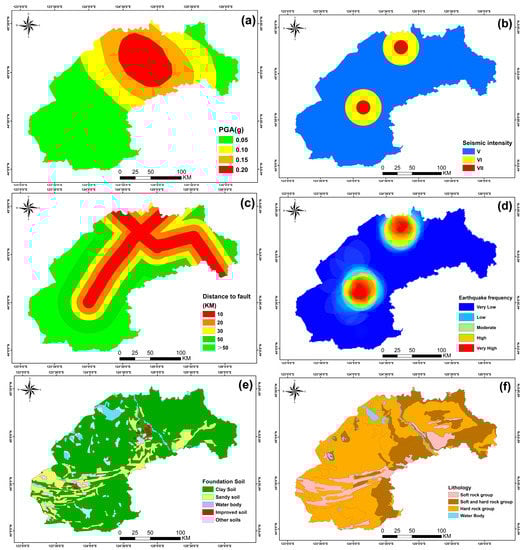
Figure 4.
Hazard index maps (a) PGA; (b) seismic intensity; (c) distance to fault; (d) earthquake frequency; (e) foundation soil; (f) lithology.
The CF model was used to calculate the CF values of each classification level of the six influencing factors. The model not only compares the relative importance of each classification level under the same evaluation factor but also compares the classification levels of different evaluation factors. The CF values of each influence factor classification level are shown in Table 4.
Table 4.
Certainty Factor.
A total of 584 image element values were randomly selected as training samples for 80% of the occurrence and non-occurrence of seismic hazards, and binary logistic regression analysis was performed as Table 5.
Table 5.
Logistic regression result.
Bringing the regression results into Equation (18), the expression of the constructed logistic regression function is as follows:
4.2. Vulnerability
4.2.1. Urban Earthquake Vulnerability Index System
In this paper, urban seismic vulnerability is divided into three aspects: demographic vulnerability, economic vulnerability, and building vulnerability. The evaluation system of urban seismic vulnerability is based on a combination of domestic and international research results and the actual situation in the study area. The specific indicators selected for the evaluation system are shown in Table 6.
Table 6.
Urban seismic hazard vulnerability evaluation index system.
Per Capita Disposable Income
Disposable income per capita is an important indicator of the economic status of a city’s residents. In an earthquake disaster, the higher the per capita disposable income, the higher the quality of life of the residents, and the better they can prepare for and recover from the disaster.
Amount of Fixed Asset Investment
The amount of investment in fixed assets can reflect the level of economic development and infrastructure construction of a city. In an earthquake disaster, the higher the investment in fixed assets, the more likely it is that the city will receive better economic support and recover faster [37].
Number of Industrial Enterprises
The number of large-scale industrial enterprises serves as a significant indicator that reflects a city’s level of industrial development. During an earthquake disaster, a higher count of such enterprises signifies a stronger industrial structure and an enhanced capacity for industrial transformation within the city. This, in turn, facilitates economic recovery, including the process of post-disaster reconstruction.
Resident Unemployment Rate
The resident unemployment rate is an important indicator reflecting the employment and social security situation in cities. In earthquake disasters, cities with lower unemployment rates and higher employment inputs are able to achieve faster post-disaster economic recovery and social stability [38,39,40,41].
Economic Structure
The economic structure of cities has an important impact on their vulnerability to earthquake disasters. The more diversified the economic structure, the higher the industrial level, and the stronger the innovation capacity, the stronger the resilience and self-healing capacity of cities facing earthquake disasters.
Percentage of Illiterate Population
A high percentage of the illiterate population affects the level of disaster knowledge and disaster resilience of urban population. In an earthquake disaster, the urban residents with a high percentage of the illiterate population have more difficulty adapting to the disaster environment and taking effective self-help measures [42].
Percentage of High Education
Cities with a higher percentage of people who have completed four years or more of higher education have residents who have a higher level of disaster knowledge and are more knowledgeable about how to take effective self-rescue actions [43]. In an earthquake disaster, residents of cities with a high percentage of higher education are better equipped to adapt to the disaster environment and can recover from the disaster more quickly.
Percentage of the Population under 14 and over 65 Years Old
An increase in the proportion of the population under the age of 14 and over the age of 65 in the age structure increases earthquake vulnerability because these two age groups are relatively more vulnerable and susceptible to earthquakes, leading to a decrease in overall resilience [44,45,46].
Percentage of Households with Three and More Elderly People
The high percentage of households with three and more elderly people reflects the high percentage of elderly people in the city, and the life safety, livelihood security and psychological health of these people need special attention after the disaster.
Percentage of Buildings with Unprotected Structures
A high percentage of buildings with unprotected structures reflects that some buildings in the city have poor or nonexistent seismic facilities and will be more vulnerable to damage in the event of an earthquake.
Percentage of Buildings before 1990
Buildings built before 1990 may have relatively weak structures and poor seismic protection facilities and are prone to damage or collapse in an earthquake [47]. The presence of many vulnerable parts and fragile points in buildings, coupled with the lagging design standards, can easily lead to human casualties and economic losses after earthquakes.
Seismic Rating of Buildings
The seismic protection level is an important indicator of the seismic capability of a building [48]. The higher the seismic protection level, the stronger the seismic resistance of the building structure, the smaller the damage, and the less people and goods will be affected, and the damage and impact of earthquake disasters will be smaller.
4.2.2. Combined Weight-TOPSIS Model Evaluation Process
The matrix P is obtained from the initial matrix after normalization:
The subjective and objective weights of the indicators were calculated by the G1 method and the entropy weight method in Section 3.3, respectively, and the results were substituted into Equation (8) to obtain the combined weights. Table 7 shows the calculated weight values. The combined weight values lie between the subjective and objective weights, indicating the information integration effect of the combined weights.
Table 7.
Indicator weights.
The standardized evaluation matrix P is weighted to obtain the weighted decision evaluation matrix V as follows:
The positive ideal solution V+ and the negative ideal solution V− are the maximum and minimum values of the column vectors in the weighted decision matrix V. The results are as follows:
From Equations (15) and (16), the distances D+ and D− for each evaluation cell to the positive and negative ideal points, respectively, are as follows.
The relative closeness T of each study unit was calculated using the combined weight-TOPSIS model as:
The greater the relative closeness means the greater the vulnerability. The vulnerability ranking results of each district and county obtained by using the combined weight TOPSIS evaluation model are that Ningjiang District is the highest, Fuyu City is the second, Qianguo County is the third, Changling County is the fourth, and the lowest is Qianan County (Figure 5).
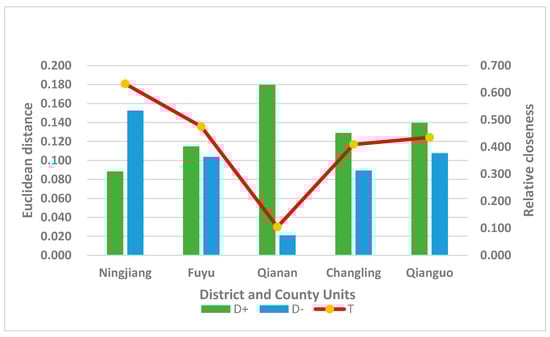
Figure 5.
Relative closeness of Euclidean distance by district and county in Songyuan City.
4.3. Exposure
In this paper, we analyze seismic hazard exposure from three perspectives: demographic, economic, and architectural.
4.3.1. Population Density
Population exposure is an important indicator of seismic hazard exposure [49,50]. The number and distribution of the population directly determines the extent of seismic hazard exposure and the number of people affected. In high-density population areas, such as cities, the effects of seismic hazards are more severe. In addition, the mobility of the population can also have an impact on the exposure of seismic hazards. For example, in some economically developed areas, there is a large influx of foreign populations, and if these populations are in disaster-prone areas when an earthquake occurs, the impact of the disaster will be more severe [51].
4.3.2. Per Capita GDP
GDP reflects the density of human economic activities to some extent. Higher GDP in a certain region indicates that more economic factors exist in it, increasing the exposure in an earthquake [52].
4.3.3. Building Density
Building exposure is another important aspect of earthquake hazard exposure. The structure and materials of a building determine its seismic performance in an earthquake [53]. In areas with high seismicity, if the seismic performance of buildings is inadequate, the effects of earthquake hazards will be more severe. Therefore, the seismic design and seismic strengthening of buildings are one of the key measures to mitigate the effects of seismic hazards. In this paper, the building’s density index is used to characterize the building exposure to earthquakes.
The weights of each of these indica tors were obtained from the G1 method as 0.3956, 0.3297, and 0.2747, respectively.
The graphs of the indicators of exposure are shown in Figure 6.
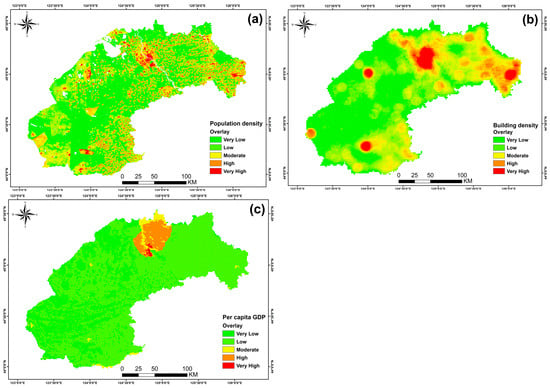
Figure 6.
Map of exposure indicators (a) population density; (b) building density; (c) per capita GDP.
4.4. Emergency Response and Recovery Capability
Emergency response and recovery capability is an important task to ensure the safety of society and protect the public and people’s property. To take advantage of earthquake disaster mitigation, emergency response capability and accessibility of rescue agencies such as medical and firefighting [54] are two important areas. In earthquake research and emergency management, they have also attracted extensive attention and research.
4.4.1. Emergency Response Team Capacity
The number and size of emergency teams is a key factor in guaranteeing a city’s timely restoration of order in the face of a disaster, and it includes professional emergency forces such as firefighting teams. The stronger the rescue capability of a city’s emergency response team, the stronger the city’s disaster prevention and mitigation capability in the face of an earthquake.
4.4.2. Road Density
The quality and density of the road network determines the transportation of rescue and relief supplies after an earthquake [55]. Higher road density improves urban disaster preparedness and mitigation because it facilitates the efficiency of rescue and evacuation operations and allows emergency services to arrive more quickly.
4.4.3. Medical Rescue Level
The level of medical care is a critical aspect of an urban emergency response capability and is even more critical for earthquake disasters [56]. Earthquake disasters usually result in a large number of casualties and require timely and effective medical treatment as well as an adequate reserve of medical resources. A high level of medical care can help reduce mortality and disability rates.
The weights of each of these indicators were obtained from the G1 method as 0.3750, 0.3409, and 0.2841, respectively.
The map of each disaster prevention and mitigation capacity indicator is shown in Figure 7.
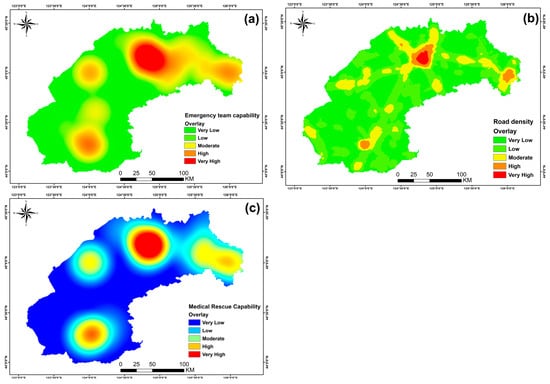
Figure 7.
Map of Emergency response and recovery capability indicators (a) emergency response team capacity; (b) road accessibility; (c) medical rescue capability.
4.5. Hazard, Exposure, Vulnerability, and Emergency Responses and Recovery Capability Map
The results of the four criterion layers are calculated from Equations (18)–(21) and visualized using GIS. Figure 8 shows the visualization results.
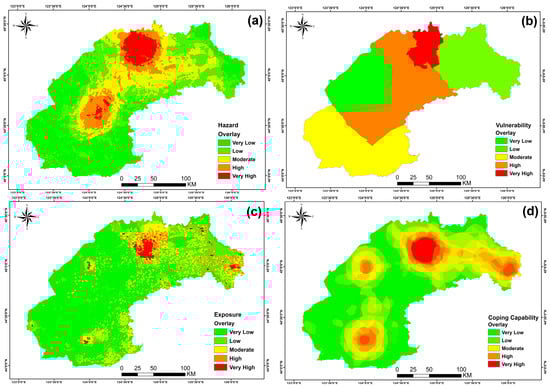
Figure 8.
(a) Hazard; (b) vulnerability; (c) exposure; (d) emergency responses and recovery capability.
4.6. Urban Seismic Hazard Risk
The weight of each criterion layer was determined by the G1 method, with hazard weight of 0.3729, vulnerability weight of 0.2664, exposure weight of 0.2220, and emergency response and recovery capability weight of 0.1387.
The final seismic risk map is calculated from Equation (22), and the natural interruption point method is used to classify the risk into five classes: very low, low, moderate, high, and very high. The grading results are shown in Figure 9.
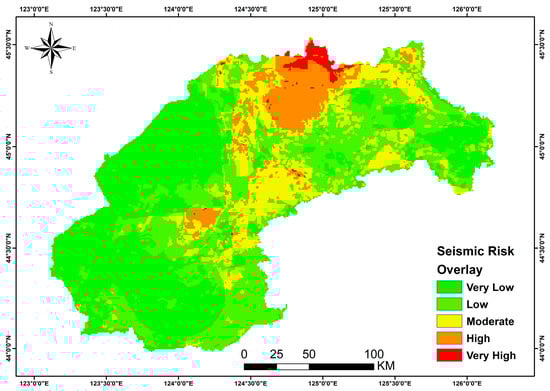
Figure 9.
Seismic risk map.
The results show that the overall seismic risk in Songyuan City is moderate, with 18.66% of the medium-risk area, 37.68% of the very low-risk area, 33.96% of the low-risk area, 8.47% of the high-risk area, and 1.23% of the very high-risk area.
5. Discussion
5.1. Analysis of Results
It is easy to find that the high- and very high-risk areas are mainly concentrated in Ningjiang District and some areas in the southern part of Qianguo County through the final obtained seismic risk map (Figure 10). We can interpret the distribution of risks presented in the risk map according to the geographical conditions, urban structure, and development status of the study area.
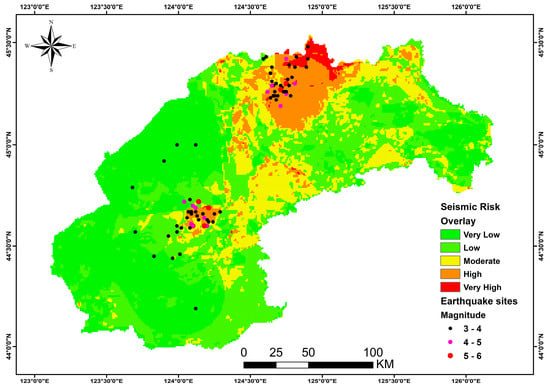
Figure 10.
Seismic risk map of Songyuan City.
(1) Analysis from the perspective of seismic hazard, vulnerability, and exposure
Ningjiang District is located near the seismically active zone of Changbai Mountain, with more developed seismic faults and frequent seismic activity at the intersection of the Fuyu North Rift and the Second Songhua River Rift, and the southern area of Qianguo County is located near the Lone Store Rift, which recent studies have shown may be the active rupture that caused the great earthquake in Xiangguo County in 1119, so the above-mentioned areas have a higher seismic hazard. At the same time, the geological structure is complex with loose lithology and soil types, and seismic waves are easily propagated. On the other hand, the northern part of Qianguo County and Ningjiang District have become the political, economic, and cultural centers of Songyuan City, with rapid economic development, high population mobility, and high building density, which are exposed to higher risk of seismic hazard.
Fuyu City is located in the mountainous area at the southern edge of the Songliao Basin, with complex terrain and high population and building densities. At the same time, the buildings in some parts of central Fuyu City are not sufficiently resistant to earthquakes, which will cause more serious damage in the event of an earthquake.
The reason for the low seismic risk in most parts of Qian’an County is mainly because the area is located in a plain or hilly area with a gentle topography, simple geological formations, and relatively hard lithology, mostly limestone and gravel, which has good seismic stability and is not prone to liquefaction. The buildings in Qian’an County are mostly low-rise country houses with low population density and a smaller population compared to other districts and counties, which may help to mitigate the threat to residents’ lives from earthquakes. Economically, Qian’an County’s economy is in a poorer position in Songyuan City and has fewer economic elements exposed to earthquake hazards.
(2) Analysis from the perspective of pre-disaster preparedness and post-disaster response:
Urban planning and urban medical capacity are also important factors that influence the consequences of earthquake disasters. In the relatively small cities of Qian’an and Changling counties, urban planning is relatively simple, and medical facilities are weak, which may lead to insufficient rescue supplies and medical treatment if an earthquake disaster occurs, which will make the local earthquake resistance lower. The relatively developed Ningjiang District, on the other hand, has better urban planning and more complete medical facilities, and the government has timely invested funds to purchase emergency rescue equipment and organize training for emergency rescue teams to improve the ability to respond to natural disasters such as earthquakes, and these measures have effectively improved the disaster prevention and mitigation capacity of Ningjiang District. However, due to the high risk of earthquakes in these areas, the disaster prevention and mitigation capacity is relatively weak. Qian’an County has a certain scale of rescue forces and is able to cope with a certain degree of earthquakes due to the relatively high disaster prevention and mitigation capacity in these areas due to their low earthquake risk.
To sum up, for areas such as hazard and exposure in Ningjiang District, buildings should meet the seismic requirements, adopt appropriate technical means and materials to improve their seismic performance and plan the layout of buildings reasonably to avoid over-concentration of buildings as much as possible, and also achieve a good job of planning safe evacuation sites. In contrast, areas with lower seismic risk, such as Qian’an County, should also take corresponding measures such as increasing the number of medical institutions and improving their earthquake risk management capabilities to ensure proper response in the event of an earthquake, reduce earthquake disaster losses, and ensure sustainable urban development.
5.2. Model Verification
The ROC curve is one of the common tools used to assess the predictive effectiveness of classification models and can be used to verify the applicability of geohazard risk assessment results. The AUC (Area Under the Curve) refers to the area under the ROC curve, and models with AUC values between 0.9 and 1 are usually considered to have very good predictions; models between 0.8 and 0.9 have good predictions; models between 0.7 to 0.8 predicts fairly; models between 0.6 and 0.7 predict poorly; and models between 0.5 and 0.6 predict very poorly [57]. The false positive rate refers to the number of negative case samples incorrectly determined as positive cases as a proportion of the number of all negative case samples, while the true positive rate refers to the number of positive case samples correctly determined as positive cases as a proportion of the number of all positive case samples. Figure 11 shows the ROC curve of this study, and its final AUC value is 0.8399, which is close to 1. It can be seen that the model has a relatively good prediction effect, indicating that the model can distinguish well between risky and non-risky areas of earthquake hazards.
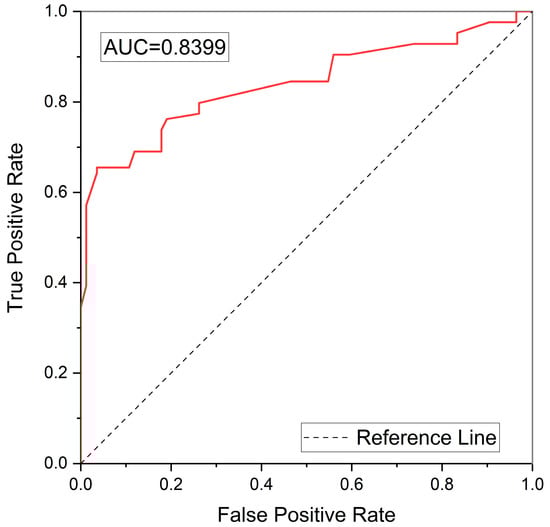
Figure 11.
ROC curve of risk assessment results.
5.3. Result Verification
The frequency ratio method is a simple and commonly used quantitative analysis method for predicting the probability of natural hazards and for assessing the correlation between selected impact factors and the occurrence of hazards [58]. In this paper, the risk results are validated using historical earthquakes with magnitude greater than 3 collected by the National Center for Earthquake Science and Data (https://data.earthquake.cn/index.html (accessed on 20 October 2022)) in China from 1970 to 2020. The formula for the frequency ratio method can be expressed as follows:
Fi represents the number of hazard points within a risk level zone; F represents the total number of hazard points within the study area; Li represents the area of a risk level zone; and L represents the total area of the study area. FR > 1 indicates a high probability of seismic hazard occurrence, while FR < 1 indicates a low correlation with seismic hazard occurrence.
Table 8 shows the FR values corresponding to each risk level and the main calculation process. The results show that the FR values corresponding to the high-risk and very high-risk zones are greater than 1, while the FR values for the medium-risk, low-risk, and very low-risk zones are less than 1. The results of the frequency ratio method validate the risk analysis results of this paper.
Table 8.
Frequency ratio.
6. Conclusions
In this study, we used a multi-criteria evaluation method to evaluate urban earthquake risk from four aspects, including hazard, exposure, vulnerability, and emergency response and recovery capability, and integrated multi-dimensional indicators such as geophysical, socio-economic, and demographic households. In the hazard evaluation segment, we adopt the CF model, which is commonly used in current geohazard research, and combine it with the logistic regression model. In the vulnerability evaluation session, we applied the combined weight TOPSIS method to evaluate the urban vulnerability in detail. Finally, overlay analysis and visualization functions based on the GIS platform are used to obtain the earthquake risk map. With the final seismic risk map, we comprehensively showed the spatial distribution of urban seismic risk. The results show that: The overall seismic risk of Songyuan City is moderate, with 18.66% of the medium-risk area, 37.68% of the very low-risk area, 33.96% of the low-risk area, 8.47% of the high-risk area, and 1.23% of the very high-risk area.
This study has practical reference value for urban earthquake risk management and provides new ideas and methods for related research, which ultimately serves the development and risk management of the city. The comprehensive analysis results show that urban earthquake risk is mainly influenced by the combination of factors such as earthquake hazard, social exposure, vulnerability, and disaster prevention and mitigation capacity. Among them, vulnerability is the more critical factor and has a significant contribution to urban seismic risk. Therefore, in the vulnerability assessment link, we adopt the combination of combined weighting method and TOPSIS method, combining the advantages of subjective empowerment and objective empowerment, which not only avoids the evaluation results from being too subjective but also eliminates the influence of unreasonable data and carries out a refined assessment of urban vulnerability, providing an important support for the final results. In calculating the seismic hazard, we also used a logistic regression model and combined it with the CF model commonly used in geological hazards. The coupled model can combine both linear and nonlinear relationships, reflecting the influence of each contributing factor on the overall hazard risk. The method used in this paper is highly operable and scientific and can be used in other cities for seismic risk studies to create seismic risk maps, but it is necessary to select more representative indicators considering the actual local conditions and determine the respective weights for different regions or different purposes of assessment to obtain more accurate assessment results.
However, there are some limitations and shortcomings in this study. For example, limited by the availability and completeness of data, some important urban vulnerability factors and indicators may be overlooked, and the division of urban zoning is not fine enough. In addition, the choice of different indicators and dimensions may also have an impact on the assessment results. Therefore, there is a need to further improve the assessment methods and evaluation indicators based on more data and information, as well as to focus on the application of urban seismic vulnerability assessment in policy and practice.
Author Contributions
Conceptualization, J.Z. (Jiale Zhu); Data curation, J.Z. (Jiale Zhu), Y.L., and H.L.; Formal analysis, J.Z. (Jiale Zhu) and Y.Z.; Methodology, J.Z. (Jiale Zhu) and J.Z. (Jiquan Zhang); Writing—Original draft, J.Z. (Jiale Zhu); Funding acquisition, Y.Z.; Writing—Review and editing, J.Z. (Jiale Zhu) and Y.C. All authors have read and agreed to the published version of the manuscript.
Funding
This work was funded by a project for the medium- and long-term development planning of earthquake and disaster prevention and mitigation in Songyuan City.
Informed Consent Statement
Not applicable.
Data Availability Statement
The data for this article are freely available at https://www.gscloud.cn/ (accessed on 18 November 2022), https://www.guihuayun.com/ (accessed on 10 January 2023), https://www.databox.store/ (accessed on 16 January 2023), http://www.resdc.cn/ (accessed on 15 December 2022).
Conflicts of Interest
The authors declare that they have no known competing financial interest or personal relationships that could have appeared to influence the work reported in this paper.
References
- Gao, L.X.; Dai, Y. Characteristics of Activity Periods for Shallow Earthquakes in Northeast China. Earthquake 2017, 37, 115–125. [Google Scholar]
- Guardiola-Víllora, A.; Basset-Salom, L. Earthquake risk scenarios of the Ciutat Vella District in Valencia, Spain. Bull. Earthq. Eng. 2020, 18, 1245–1284. [Google Scholar] [CrossRef]
- Antonietti, P.F.; Mazzieri, I.; Melas, L.; Paolucci, R.; Quarteroni, A.; Smerzini, C.; Stupazzini, M. Three-dimensional physics-based earthquake ground motion simulationsfor seismic risk assessment in densely populated urban areas. Math. Eng. 2020, 3, 1–31. [Google Scholar] [CrossRef]
- Du, A.; Padgett, J.E.; Shafieezadeh, A. Influence of intensity measure selection on simulation-based regional seismic risk assessment. Earthq. Spectra 2020, 36, 647–672. [Google Scholar] [CrossRef]
- Goda, K.; Novelli, V.; De Risi, R.; Kloukinas, P.; Giordano, N.; Macdonald, J.; Kafodya, I.; Ngoma, I.; Voyagaki, E. Scenario-based earthquake risk assessment for central-southern Malawi: The case of the Bilila-MtakatakaFault. Int. J. Disaster Risk Reduct. 2022, 67, 102655. [Google Scholar] [CrossRef]
- Robat Mili, R.; Amini Hosseini, K.; Izadkhah, Y.O. Developing a holistic model for earthquake risk assess-ment and disaster management interventions in urban fabrics. Int. J. Disaster Risk Reduct. 2018, 27, 355–365. [Google Scholar] [CrossRef]
- Hou, L.F.; Li, D.; Zhou, X. Earthquake Risk Assessment in Zhejiang Province Based on Index System. North China Earthq. Sci. 2019, 37, 23–28. [Google Scholar]
- Guo, X.; Kapucu, N. Assessing social vulnerability to earthquake disaster using rough analytic hierarchy process method: A case study of Hanzhong City, China. Saf. Sci. 2020, 125, 104625. [Google Scholar] [CrossRef]
- Sauti, N.S.; Daud, M.E.; Kaamin, M.; Sahat, S. GIS spatial modelling for seismic risk assessment based on exposure, resilience, and capacity indicators to seismic hazard: A case study of Pahang, Malaysia. Geomat. Nat. Hazards Risk 2021, 12, 1948–1972. [Google Scholar] [CrossRef]
- Jaimes, D.L.; Escudero, C.R.; Flores, K.L.; Zamora-Camacho, A. Multicriteria seismic hazard and social vulnerability assessment in the Puerto Vallarta metropolitan area, Mexico: Toward a comprehensive seismic risk analysis. Nat. Hazards 2022, 116, 2671–2692. [Google Scholar] [CrossRef]
- Thaysen, J.; Boisen, A.; Hansen, O.; Bouwstra, S. Integrated model for earthquake risk assessment using neural network and analytic hierarchy process: Aceh province, Indonesia. Geosci. Front. 2020, 11, 613–634. [Google Scholar]
- Yariyan, P.; Zabihi, H.; Wolf, I.D.; Karami, M.; Amiriyan, S. Earthquake risk assessment using an integrated Fuzzy Analytic Hierarchy Process with Artificial Neural Networks based on GIS: A case study of Sanandaj in Iran. Int. J. Disaster Risk Reduct. 2020, 50, 101705. [Google Scholar] [CrossRef]
- Torres, Y.; Arranz, J.J.; Gaspar-Escribano, J.M.; Haghi, A.; Martínez-Cuevas, S.; Benito, B.; Ojeda, J.C. Integration of LiDAR and multispectral images for rapid exposure and earthquake vulnerability estimation. Application in Lorca, Spain. Int. J. Appl. Earth Obs. 2019, 81, 161–175. [Google Scholar] [CrossRef]
- Jena, R.; Pradhan, B. Integrated ANN-cross-validation and AHP-TOPSIS model to improve earthquake risk assessment. Int. J. Disaster Risk Reduct. 2020, 50, 101723. [Google Scholar] [CrossRef]
- Silva, V.; Crowley, H.; Varum, H.; Pinho, R. Seismic risk assessment for mainland Portugal. Bull. Earthquake Eng. 2015, 13, 429–457. [Google Scholar] [CrossRef]
- Crowley, H.; Despotaki, V.; Rodrigues, D.; Silva, V.; Toma-Danila, D.; Riga, E.; Karatzetzou, A.; Fotopoulou, S.; Zugic, Z.; Sousa, L.; et al. Exposure model for European seismic risk assessment. Earthq. Spectra 2020, 36, 252–273. [Google Scholar] [CrossRef]
- Masi, A.; Lagomarsino, S.; Dolce, M.; Manfredi, V.; Ottonelli, D. Towards the updated Italian seismic risk assessment: Exposure and vulnerability modelling. Bull. Earthq. Eng. 2021, 19, 3253–3286. [Google Scholar] [CrossRef]
- Zhang, J.-Q.; Liang, J.-D.; Liu, X.-P.; Tong, Z.-J. GIS-Based Risk Assessment of Ecological Disasters in Jilin Province, Northeast China. Hum. Ecol. Risk Assess. 2009, 15, 727–745. [Google Scholar] [CrossRef]
- Shortliffe, E.H.; Buchanan, B.G. A model of inexact reasoning in medicine. Math. Biosci. 1975, 23, 351–379. [Google Scholar] [CrossRef]
- Heckerman, D. Probabilistic Interpretations for Mycin’s Certainty Factors. In Machine Intelligence and Pattern Recognition; Kanal, L.N., Lemmer, J.F., Eds.; North-Holland: Amsterdam, The Netherlands, 1986; pp. 167–196. [Google Scholar] [CrossRef]
- Wang, X.J.; Guo, Y.J. Analyzing the Consistency of Comparison Matrix Based on G1 Method. Chin. J. Manag. Sci. 2006, 3, 65–70. [Google Scholar]
- Zhu, Y.; Tian, D.; Yan, F. Effectiveness of entropy weight method in decision-making. Math. Probl. Eng. 2020, 2020, 3564835. [Google Scholar] [CrossRef]
- Wang, L.; Ke, Q.; Li, Y.L.; Wu, Y. Risk evaluation of check dam system in a small watershed of loess plateau using combined weight-TOPSIS method. Chin. J. Appl. Mech. 2022, 39, 698–706. [Google Scholar] [CrossRef]
- Xiao, Y.; Tang, X.; Li, Y.; Huang, H.; An, B.-W. Social vulnerability assessment of landslide disaster based on improved TOPSIS method: Case study of eleven smalltowns in China. Ecol. Indic. 2022, 143, 109316. [Google Scholar] [CrossRef]
- Lavalley, M.P. Logistic regression. Circulation 2008, 117, 2395–2399. [Google Scholar] [CrossRef]
- Duan, C.; Zhang, J.; Chen, Y.; Lang, Q.; Zhang, Y.; Wu, C.; Zhang, Z. Comprehensive Risk Assessment of Urban Waterlogging Disaster Based on MCDA-GIS Integration: The Case Study of Changchun, China. Remote Sens. 2022, 14, 3101. [Google Scholar] [CrossRef]
- Zhijun, T.; Jiquan, Z.; Xingpeng, L. GIS-based risk assessment of grassland fire disaster in western Jilin province, China. Stoch. Env. Res. Risk A 2009, 23, 463–471. [Google Scholar] [CrossRef]
- Jena, R.; Pradhan, B.; Beydoun, G. Earthquake vulnerability assessment in Northern Sumatra province by using a multi-criteria decision-making model. Int. J. Disaster Risk Reduct. 2020, 46, 101518. [Google Scholar] [CrossRef]
- Sinha, N.; Priyanka, N.; Joshi, P. Using spatial multi-criteria analysis and ranking tool (SMART) in earthquake risk assessment: A case study of Delhi region, India. Geomat. Nat. Hazards Risk 2016, 7, 680–701. [Google Scholar] [CrossRef]
- Rezaie, F.; Panahi, M. GIS modeling of seismic vulnerability of residential fabrics considering geotechnical, structural, social and physical distance indicators in Tehran using multi-criteria decision-making techniques. Nat. Hazards Earth Syst. Sci. 2015, 15, 461–474. [Google Scholar] [CrossRef]
- Ayele, A.; Woldearegay, K.; Meten, M. A review on the multi-criteria seismic hazard analysis of Ethiopia: With implications of infrastructural development. Geoenviron. Disasters 2021, 8, 9. [Google Scholar] [CrossRef]
- binti Abd Razak, J.A.; bin Rambat, S.; binti Che Ros, F.; Shi, Z.; bin Mazlan, S.A. Seismic Vulnerability Assessment in Ranau, Sabah, Using Two Different Models. ISPRS Int. J. Geo-Inf. 2021, 10, 271. [Google Scholar] [CrossRef]
- Sadrykia, M.; Delavar, M.R.; Zare, M. A GIS-Based Fuzzy Decision Making Model for Seismic Vulnerability Assessment in Areas with Incomplete Data. ISPRS Int. J. Geo-Inf. 2017, 6, 119. [Google Scholar] [CrossRef]
- Malakar, S.; Rai, A.K. Earthquake vulnerability in the Himalaya by integrated multi-criteria decision models. Nat. Hazards 2022, 111, 213–237. [Google Scholar] [CrossRef]
- Hu, Y.X.; Wang, S.Y.; Liu, H.X.; Zhu, L. Attenuation relationship of ground motionfor north China partly based on data from Tangshan earthquake. China Civ. Eng. J. 1986, 3, 1–10. [Google Scholar]
- Wang, J. Seismic pattern treatment method through calculation of seismic density at grid nodes. Acta Seismol. Sin. 2001, 14, 274–279. [Google Scholar] [CrossRef]
- Cerchiello, V.; Ceresa, P.; Monteiro, R.; Komendantova, N. Assessment of social vulnerability to seismic hazard in Nablus, Palestine. Int. J. Disaster Risk Reduct. 2018, 28, 491–506. [Google Scholar] [CrossRef]
- Armaş, I.; Ionescu, R.; Gavriş, A.; Toma-Danila, D. Identifying seismic vulnerability hotspots in Bucharest. Appl. Geogr. 2016, 77, 49–63. [Google Scholar] [CrossRef]
- Agrawal, N.; Gupta, L.; Dixit, J. Assessment of the Socioeconomic Vulnerability to Seismic Hazards in the National Capital Region of India Using Factor Analysis. Sustainability 2021, 13, 9652. [Google Scholar] [CrossRef]
- Hejazi, S.J.; Sharifi, A.; Arvin, M. Assessment of social vulnerability in areas exposed to multiple hazards: A case study of the Khuzestan Province, Iran. Int. J. Disaster Risk Reduct. 2022, 78, 103127. [Google Scholar] [CrossRef]
- Zebardast, E. Constructing a social vulnerability index to earthquake hazards using a hybrid factor analysis and analytic network process (F’ANP) model. Nat. Hazards 2013, 65, 1331–1359. [Google Scholar] [CrossRef]
- Martins, V.N.; e Silva, D.S.; Cabral, P. Social vulnerability assessment to seismic risk using multicriteria analysis: The case study of Vila Franca do Campo (São Miguel Island, Azores, Portugal). Nat. Hazards 2012, 62, 385–404. [Google Scholar] [CrossRef]
- Frigerio, I.; Ventura, S.; Strigaro, D.; Mattavelli, M.; De Amicis, M.; Mugnano, S.; Boffi, M. A GIS-based approach to identify the spatial variability of social vulnerability to seismic hazard in Italy. Appl. Geogr. 2016, 74, 12–22. [Google Scholar] [CrossRef]
- Armas, I.; Gavris, A. Social vulnerability assessment using spatial multi-criteria analysis (SEVI model) and the Social Vulnerability Index (SoVI model)—A case study for Bucharest, Romania. Nat. Hazards Earth Syst. Sci. 2013, 13, 1481–1499. [Google Scholar] [CrossRef]
- Ferreira, T.M.; Vicente, R.; da Silva, J.A.R.M.; Varum, H.; Costa, A. Seismic vulnerability assessment of historical urban centres: Case study of the old city centre inSeixal, Portugal. Bull. Earthq. Eng. 2013, 11, 1753–1773. [Google Scholar] [CrossRef]
- Zhang, W.; Xu, X.; Chen, X. Social vulnerability assessment of earthquakedisaster based on the catastrophe progression method: A Sichuan Province case study. Int. J. Disaster Risk Reduct. 2017, 24, 361–372. [Google Scholar] [CrossRef]
- Lee, S.; Oh, S. A comprehensive seismic risk assessment map of South Korea based on seismic, geotechnical, and social vulnerability. Environ. Earth Sci. 2022, 81, 33. [Google Scholar] [CrossRef]
- Alizadeh, M.; Hashim, M.; Alizadeh, E.; Shahabi, H.; Karami, M.R.; Beiranvand Pour, A.; Pradhan, B.; Zabihi, H. Multi-Criteria Decision Making (MCDM) Model for Seismic Vulnerability Assessment (SVA) of Urban Residential Buildings. ISPRS Int. J. Geo-Inf. 2018, 7, 444. [Google Scholar] [CrossRef]
- Alam, M.S.; Haque, S.M. Multi-dimensional earthquake vulnerability assessment of residential neighborhoods of Mymensingh City, Bangladesh: A spatial multi-criteria analysis based approach. J. Urban. Manag. 2022, 11, 37–58. [Google Scholar] [CrossRef]
- Peng, Y. Regional earthquake vulnerability assessment using a combination of MCDM methods. Ann. Oper. Res. 2015, 234, 95–110. [Google Scholar] [CrossRef]
- Kamranzad, F.; Memarian, H.; Zare, M. Earthquake Risk Assessment for Tehran, Iran. ISPRS Int. J. Geo-Inf. 2020, 9, 430. [Google Scholar] [CrossRef]
- Noy, I.; Yonson, R. Economic Vulnerability and Resilience to Natural Hazards: A Survey of Concepts and Measurements. Sustainability 2018, 10, 2850. [Google Scholar] [CrossRef]
- Alizadeh, M.; Ngah, I.; Hashim, M.; Pradhan, B.; Pour, A.B. A hybrid analytic network process and artificial neural network (ANP-ANN) model for urban earthquake vulnerability assessment. Remote Sens. 2018, 10, 975. [Google Scholar] [CrossRef]
- Banica, A.; Rosu, L.; Muntele, I.; Grozavu, A. Towards Urban Resilience: A Multi-Criteria Analysis of Seismic Vulnerability in Iasi City (Romania). Sustainability 2017, 9, 270. [Google Scholar] [CrossRef]
- Bakioğlu, G.; Karaman, H. Accessibility of medical services following an earthquake: A case study of traffic and economic aspects affecting the Istanbul roadway. Int. J. Disaster Risk Reduct. 2018, 31, 403–418. [Google Scholar] [CrossRef]
- Ceferino, L.; Mitrani-Reiser, J.; Kiremidjian, A.; Deierlein, G.; Bambarén, C. Effective plans for hospital system response to earthquake emergencies. Nat. Commun. 2020, 11, 4325. [Google Scholar] [CrossRef]
- Swets, J.A. Measuring the Accuracy of Diagnostic Systems. Science 1988, 240, 1285–1293. [Google Scholar] [CrossRef]
- Han, J.; Kim, J.; Park, S.; Son, S.; Ryu, M. Seismic Vulnerability Assessment and Mapping of Gyeongju, South Korea Using Frequency Ratio, Decision Tree, and Random Forest. Sustainability 2020, 12, 7787. [Google Scholar] [CrossRef]


Disclaimer/Publisher’s Note: The statements, opinions and data contained in all publications are solely those of the individual author(s) and contributor(s) and not of MDPI and/or the editor(s). MDPI and/or the editor(s) disclaim responsibility for any injury to people or property resulting from any ideas, methods, instructions or products referred to in the content. |
© 2023 by the authors. Licensee MDPI, Basel, Switzerland. This article is an open access article distributed under the terms and conditions of the Creative Commons Attribution (CC BY) license (https://creativecommons.org/licenses/by/4.0/).