Urban Waste Management and Prediction through Socio-Economic Values and Visualizing the Spatiotemporal Relationship on an Advanced GIS-Based Dashboard
Abstract
:1. Introduction
2. Review of Urban Waste Relationships, Digital Platforms, and Policies
3. Materials and Methods
3.1. Study Area and Data
3.2. Methods
3.2.1. Data Preparation and Processing
3.2.2. Relationship Map
3.2.3. Regression Analysis
- (1)
- Pearson correlation
- (2)
- Spearman regression
3.2.4. Development of a GIS-Based SWVD
4. Results
4.1. Spatial Data Visualization of Multiple Metrics
4.2. Spatiotemporal Relationships with Other Metrics
4.3. Urban Waste Dashboard Development
5. Discussion
5.1. Contributions
5.2. Novelty
5.3. Specific Findings
5.4. Value of the Findings
5.5. Practical and Theoretical Implications of the Study
5.6. Future Research Directions
6. Conclusions
6.1. Relationship Map and Correlation Analysis
6.2. Dashboard Development
Author Contributions
Funding
Institutional Review Board Statement
Informed Consent Statement
Data Availability Statement
Conflicts of Interest
References
- Ferreira, D.C.; Caldas, P.; Varela, M.; Marques, R.C. A geometric aggregation of performance indicators considering regulatory constraints: An application to the urban solid waste management. Expert Syst. Appl. 2023, 218, 119540. [Google Scholar] [CrossRef]
- Liao, N.; Lü, F.; Zhang, H.; He, P. Life cycle assessment of waste management in rural areas in the transition period from mixed collection to source-separation. Waste Manag. 2023, 158, 57–65. [Google Scholar] [CrossRef] [PubMed]
- Kaza, S.; Yao, L.C.; Bhada-Tata, P.; Van Woerden, F. What a Waste 2.0: A Global Snapshot of Solid Waste Management to 2050; World Bank, Urban Development: Washington, DC, USA, 2018. [Google Scholar]
- WHO. Sanitation. Available online: https://www.who.int/news-room/fact-sheets/detail/sanitation (accessed on 27 April 2023).
- Rachal, M. Latest UN Climate Change Report Highlights Urban Mitigation Strategies, Circular Materials Management. SMARTCITIESDIVE. 2022. Available online: https://www.wastedive.com/news/ipcc-climate-mitigation-report-circular-materials-management/621649/ (accessed on 8 April 2021).
- Webster, K. Learning Path. The Circular Economy in Detail; Ellen Macarthur Foundation: Isle of Wight, UK, 2022; Available online: https://archive.ellenmacarthurfoundation.org/explore/the-circular-economy-in-detail#:~:text=A%20circular%20economy%20is%20a,the%20consumption%20of%20finite%20resources (accessed on 30 May 2021).
- DCCEEW. National Waste Stream Profiles. Available online: https://www.dcceew.gov.au/environment/protection/waste/publications/national-waste-reports/2013/national-waste-stream (accessed on 11 September 2022).
- Neves, D.; Baptista, P.; Gomes, R.; Cunha, S.; Sandoval-Reyes, M.; Fernandes, D.V.; Rolim, C.; Silva, C.A. MetaExplorer: Collaborative development of urban metabolism platform for decision making support. Energy Strategy Rev. 2023, 45, 101041. [Google Scholar] [CrossRef]
- The University of Sydney; The University of Newcastle; Regional Growth NSW Development Corp.; CSIRO; Macquarie University; UTS; Clean Core Development. Embedding Circular Economy Principles within Precincts and Infrastructure Business Case Processes in NSW; A Rapid Review Prepared for NSW Circular; NSW Circular: Sydney, Australia, 2022; p. 74. [Google Scholar]
- Niska, H.; Serkkola, A. Data analytics approach to create waste generation profiles for waste management and collection. Waste Manag. 2018, 77, 477–485. [Google Scholar] [CrossRef] [PubMed]
- Pickin, J.; Randell, P.; Trinh, J.; Grant, B. National Waste Report 2018; The Department of Climate Change, Energy, the Environment and Water, Ed.; Blue Environment Pty Ltd.: Docklands, Australia, 2018; p. 126.
- Pickin, J.; Wardle, C.; O’Farrell, K.; Nyunt, P.; Donovan, S. National Waste Report 2020; The Department of Climate Change, Energy, the Environment and Water, Ed.; Blue Environment Pty Ltd.: Docklands, Australia, 2020; p. 156.
- Pickin, J.; Wardle, C.; O’Farrell, K.; Stovell, L.; Nyunt, P.; Guazzo, S.; Lin, Y.; Caggiati-Shortell, G.; Chakma, P.; Edwards, C.; et al. National Waste Report 2022; The Department of Climate Change, Energy, the Environment and Water, Ed.; Blue Environment Pty Ltd.: Docklands, Australia, 2023; p. 142.
- DCCEEW. National Waste Policy Action Plan for 2019; The Department of Climate Change, Energy, the Environment and Water, Ed.; Australian Government, Waste Publications and Data: Canberra, Australia, 2019.
- DCCEEW. National Waste Policy Action Plan. Available online: https://www.dcceew.gov.au/environment/protection/waste/publications/national-waste-policy-action-plan (accessed on 23 April 2023).
- DCCEEW. Waste and Resource Recovery Data Hub-National Waste Data Viewer. Available online: https://www.dcceew.gov.au/environment/protection/waste/how-we-manage-waste/data-hub/data-viewer (accessed on 11 December 2022).
- Xiao, W.; Liu, T.; Tong, X. Assessing the carbon reduction potential of municipal solid waste management transition: Effects of incineration, technology, and sorting in Chinese cities. Resour. Conserv. Recycl. 2023, 188, 106713. [Google Scholar] [CrossRef]
- Xiao, L.; Lin, T.; Chen, S.; Zhang, G.; Ye, Z.; Yu, Z. Characterizing Urban Household Waste Generation and Metabolism Considering Community Stratification in a Rapid Urbanizing Area of China. PLoS ONE 2015, 10, e0145405. [Google Scholar] [CrossRef]
- Yang, W.; Fan, B.; Desouza, K.C. Spatial-temporal effect of household solid waste on illegal dumping. J. Clean Prod. 2019, 227, 313–324. [Google Scholar] [CrossRef]
- Burton, W.R.; John, R.P. Visualization and Waste Collection Route Heuristics of Smart Bins Data using Python Big Data Analytics. In Proceedings of the 2021 The 4th International Conference on Software Engineering and Information Management, Yokohama, Japan, 16–18 January 2021. [Google Scholar]
- Smith, K.I.; Shirowzhan, S. A GIS-Based Spatiotemporal Analysis of the Relationship between the Outbreak of COVID-19, Delta Variant and Construction in Sydney and Melbourne. ISPRS Int. J. Geo-Inf. 2022, 11, 617. [Google Scholar] [CrossRef]
- He, W.; Shirowzhan, S.; Pettit, C.J. GIS and Machine Learning for Analysing Influencing Factors of Bushfires Using 40-Year Spatio-Temporal Bushfire Data. ISPRS Int. J. Geo-Inf. 2022, 11, 336. [Google Scholar] [CrossRef]
- Kontokosta, C.E.; Hong, B.; Johnson, N.E.; Starobin, D. Using machine learning and small area estimation to predict building-level municipal solid waste generation in cities. Comput. Environ. Urban Syst. 2018, 70, 151–162. [Google Scholar] [CrossRef]
- Ghasemi-Mobtaker, H.; Kaab, A.; Rafiee, S.; Nabavi-Pelesaraei, A. A comparative of modeling techniques and life cycle assessment for prediction of output energy, economic profit, and global warming potential for wheat farms. Energy Rep. 2022, 8, 4922–4934. [Google Scholar] [CrossRef]
- Nabavi-Pelesaraei, A.; Rafiee, S.; Hosseini-Fashami, F.; Chau, K.-W. Artificial neural networks and adaptive neuro-fuzzy inference system in energy modeling of agricultural products. In Predictive Modelling for Energy Management and Power Systems Engineering; Elsevier: Amsterdam, The Netherlands, 2021; pp. 299–334. [Google Scholar] [CrossRef]
- Khanali, M.; Ghasemi-Mobtaker, H.; Varmazyar, H.; Mohammadkashi, N.; Chau, K.-W.; Nabavi-Pelesaraei, A. Applying novel eco-exergoenvironmental toxicity index to select the best irrigation system of sunflower production. Energy 2022, 250, 123822. [Google Scholar] [CrossRef]
- Glad, W. Spaces for waste: Everyday recycling and sociospatial relationships. Scott. Geogr. J. 2018, 134, 141–157. [Google Scholar] [CrossRef]
- Skill, K. (Re)creating Ecological Action Space: Householders’ Activities for Sustainable Development in Sweden. Ph.D. Thesis, Linköping University Electronic Press, Linköping, Sweden, 2008. [Google Scholar]
- CoS. Order New Rubbish, Recycling and Garden Organics Bins. Available online: https://www.cityofsydney.nsw.gov.au/waste-recycling-services/order-new-rubbish-recycling-garden-organics-bins (accessed on 2 March 2023).
- Richter, A.; Ng, K.T.W.; Vu, H.L.; Kabir, G. Waste disposal characteristics and data variability in a mid-sized Canadian city during COVID-19. Waste Manag. 2021, 122, 49–54. [Google Scholar] [CrossRef] [PubMed]
- Yadav, H.; Soni, U.; Kumar, G. Analysing challenges to smart waste management for a sustainable circular economy in developing countries: A fuzzy DEMATEL study. Smart Sustain. Built Environ. 2023, 12, 361–384. [Google Scholar] [CrossRef]
- Agovino, M.; Musella, G. Separate waste collection in mountain municipalities. A case study in Campania. Land Use Policy 2020, 91, 104408. [Google Scholar] [CrossRef]
- Richter, A.; Ng, K.T.W.; Karimi, N. Meshing Centroidal Voronoi Tessellation with spatial statistics to optimize waste management regions. J. Clean. Prod. 2021, 295, 126465. [Google Scholar] [CrossRef]
- Tilley, I.; Pettit, C. A Dashboard for the Unexpected: Open Data for Real-Time Disaster Response. In Open Cities|Open Data: Collaborative Cities in the Information Era; Hawken, S., Han, H., Pettit, C., Eds.; Springer: Singapore, 2020; pp. 265–286. [Google Scholar] [CrossRef]
- Pettit, C.; Leao, S. Dashboard. In Encyclopedia of Big Data; Schintler, L.A., McNeely, C.L., Eds.; Springer International Publishing: Cham, Switzerland, 2017; pp. 1–6. [Google Scholar] [CrossRef]
- Pettit, C.; Lieske, S.N.; Jamal, M. CityDash: Visualising a changing city using open data. In Proceedings of the International Conference on Computers in Urban Planning and Urban Management, Adelaide, Australia, 11–14 July 2017; pp. 337–353. [Google Scholar]
- Dong, E.; Du, H.; Gardner, L. An interactive web-based dashboard to track COVID-19 in real time. Lancet Infect. Dis. 2020, 20, 533–534. [Google Scholar] [CrossRef]
- Recycling Victoria. Victoria’s Waste Projection Model. Available online: https://www.vic.gov.au/victorias-waste-projection-model-dashboard (accessed on 4 May 2023).
- Recycling Victoria. Victorian Local Government Waste Data Dashboard. Available online: https://www.vic.gov.au/victorian-local-government-waste-data-dashboard (accessed on 4 May 2023).
- Western Australia. Domestic Waste and Recycling Dashboard. Available online: https://www.wasteauthority.wa.gov.au/publications/view/domestic-waste-and-recycling-dashboard (accessed on 11 November 2021).
- Shetty, V. Smart City Waste Management with SAP Analytics Cloud. Available online: https://blogs.sap.com/2020/02/17/smart-city-waste-management-with-sap-analytics-cloud/ (accessed on 11 November 2022).
- City of Gold Coast. Waste & Recycling Centres Map. Available online: https://www.goldcoast.qld.gov.au/Services/Waste-recycling/Waste-recycling-centres-map (accessed on 11 August 2022).
- MIT; AMS. Waste Streams. Available online: http://senseable.mit.edu/waste-streams/ (accessed on 11 November 2021).
- DCCEEW. National Waste Reporting Mapping Tool. Available online: https://www.dcceew.gov.au/environment/protection/waste/publications/national-waste-reports/2013/mapping-tool (accessed on 20 August 2022).
- GOV.UK. August 2022 Waste Metrics Dashboard. Available online: https://www.gov.uk/government/collections/waste-metric-dashboards (accessed on 9 September 2022).
- Australian Circular. NSW Jobs & Businesses in Waste Management & Recycling. Available online: https://australiancircularbenchmarks.org/ (accessed on 11 September 2022).
- City of Boulder. Zero Waste Data Dashboard. Available online: https://bouldercolorado.gov/zero-waste-data-dashboard (accessed on 11 October 2022).
- Vogt, M. Solid Waste Tonnage Dashboard. Tool for Haulers and Facility Operators. Metro News: The Government of Oregon, 10 May 2022. [Google Scholar]
- Berry, L. What Is a Relationship Map? Available online: https://www.esri.com/arcgis-blog/products/arcgis-online/mapping/what-is-a-relationship-map/ (accessed on 7 April 2023).
- Paradis, E. Moran’s Autocorrelation Coefficient in Comparative Methods; R Foundation for Statistical Computing: Vienna, Austria, 2009. [Google Scholar]
- Shirowzhan, S.; Lim, S.; Trinder, J. Enhanced Autocorrelation-Based Algorithms for Filtering Airborne Lidar Data Over Urban Areas. J. Surv. Eng. 2016, 142, 04015008. [Google Scholar] [CrossRef] [Green Version]
- Sun, G.; Webster, C.; Ni, M.Y.; Zhang, X. Measuring high-density built environment for public health research: Uncertainty with respect to data, indicator design and spatial scale. Geospat. Health 2018, 13, 35–47. [Google Scholar] [CrossRef]
- Li, X.; Li, P.; Wang, D.; Wang, Y. Assessment of temporal and spatial variations in water quality using multivariate statistical methods: A case study of the Xin’anjiang River, China. Front. Environ. Sci. Eng. 2014, 8, 895–904. [Google Scholar] [CrossRef]
- ESRI. What Is ArcGIS Experience Builder? Available online: https://doc.arcgis.com/en/experience-builder/latest/get-started/what-is-arcgis-experience-builder.htm (accessed on 2 June 2023).
- ESRI. Web Maps. Available online: https://doc.arcgis.com/en/arcgis-online/reference/what-is-web-map.htm (accessed on 1 October 2022).
- ABS. Waste Account, Australia, Experimental Estimates. Available online: https://www.abs.gov.au/statistics/environment/environmental-management/waste-account-australia-experimental-estimates/latest-release (accessed on 10 May 2022).
- Trang, P.T.T.; Dong, H.Q.; Toan, D.Q.; Hanh, N.T.X.; Thu, N.T. The Effects of Socio-economic Factors on Household Solid Waste Generation and Composition: A Case Study in Thu Dau Mot, Vietnam. Energy Procedia 2017, 107, 253–258. [Google Scholar] [CrossRef]
- Madden, B.; Florin, N.; Mohr, S.; Giurco, D. Spatial modelling of municipal waste generation: Deriving property lot estimates with limited data. Resour. Conserv. Recycl. 2021, 168, 105442. [Google Scholar] [CrossRef]
- Delaney, E.L.; McKinley, J.M.; Megarry, W.; Graham, C.; Leahy, P.G.; Bank, L.C.; Gentry, R. An integrated geospatial approach for repurposing wind turbine blades. Resour. Conserv. Recycl. 2021, 170, 105601. [Google Scholar] [CrossRef]
- Catarinucci, L.; Colella, R.; Consalvo, S.I.; Patrono, L.; Salvatore, A.; Sergi, I. IoT-oriented Waste Management System based on new RFID-Sensing Devices and Cloud Technologies. In Proceedings of the 2019 4th International Conference on Smart and Sustainable Technologies, SpliTech 2019, Split, Croatia, 18–21 June 2019. [Google Scholar]
- Hassanzadehkermanshahi, K.; Shirowzhan, S. Measuring Urban Sustainability over Time at National and Regional Scale for Addressing United Nations Sustainable Development Goal (SDG) 11: Iran and Tehran as Case Studies. Sustainability 2022, 14, 7402. [Google Scholar] [CrossRef]
- DPE. Net Zero Emissions Guidance for NSW Councils. The State of NSW and Department of Planning, Industry and Environment. 2020. Available online: environment.nsw.gov.au (accessed on 5 August 2022).

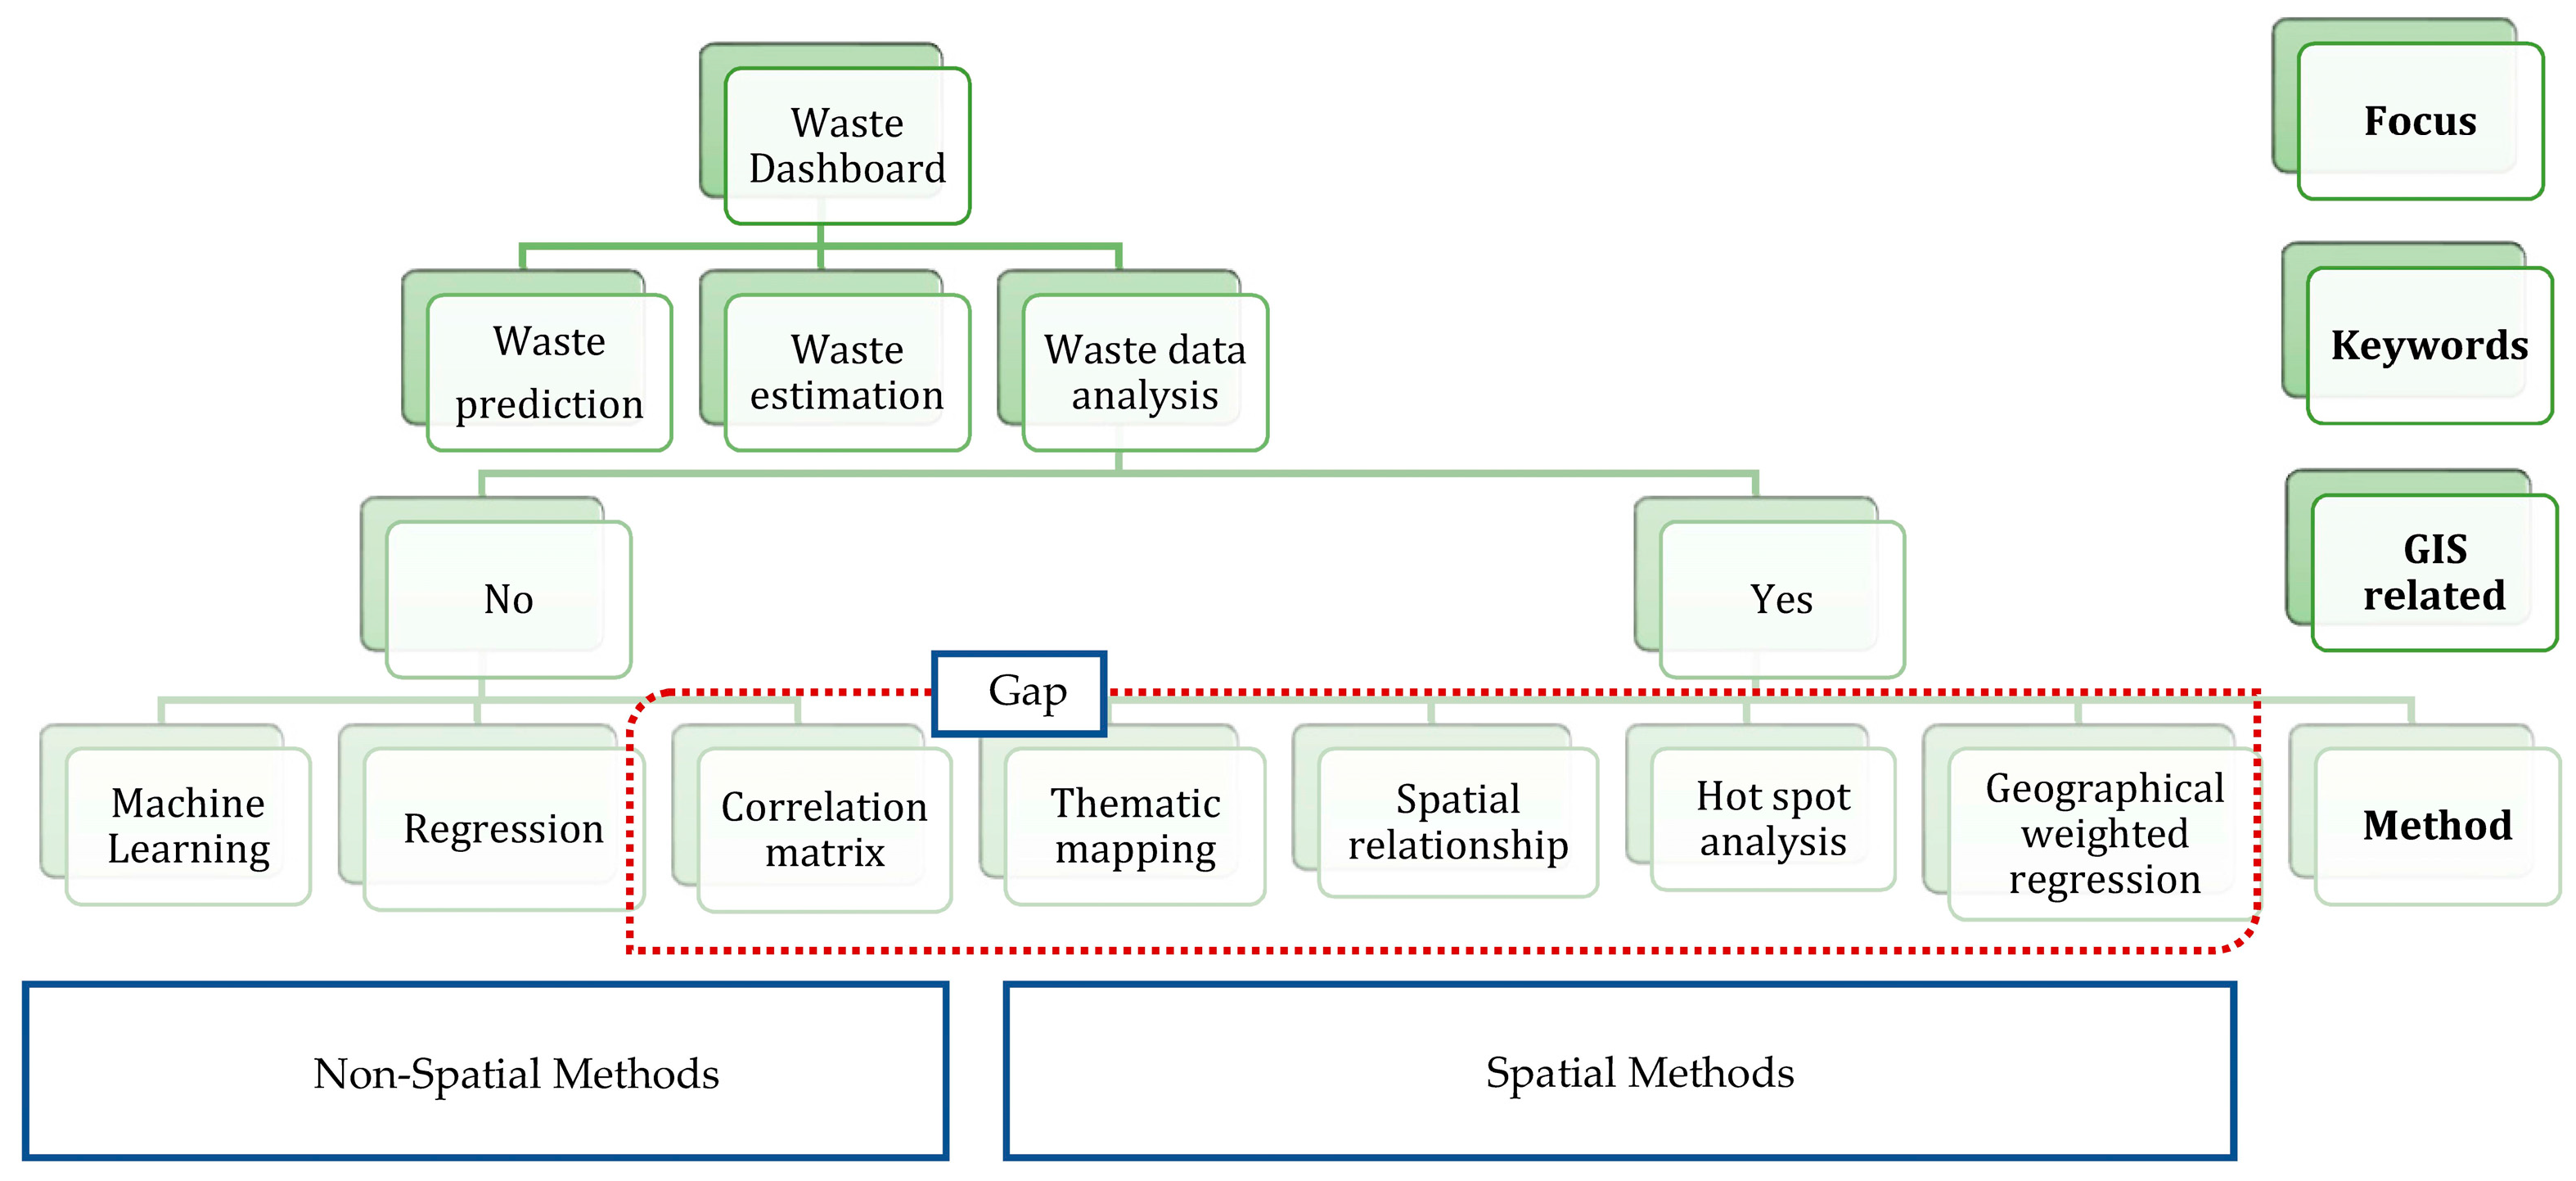
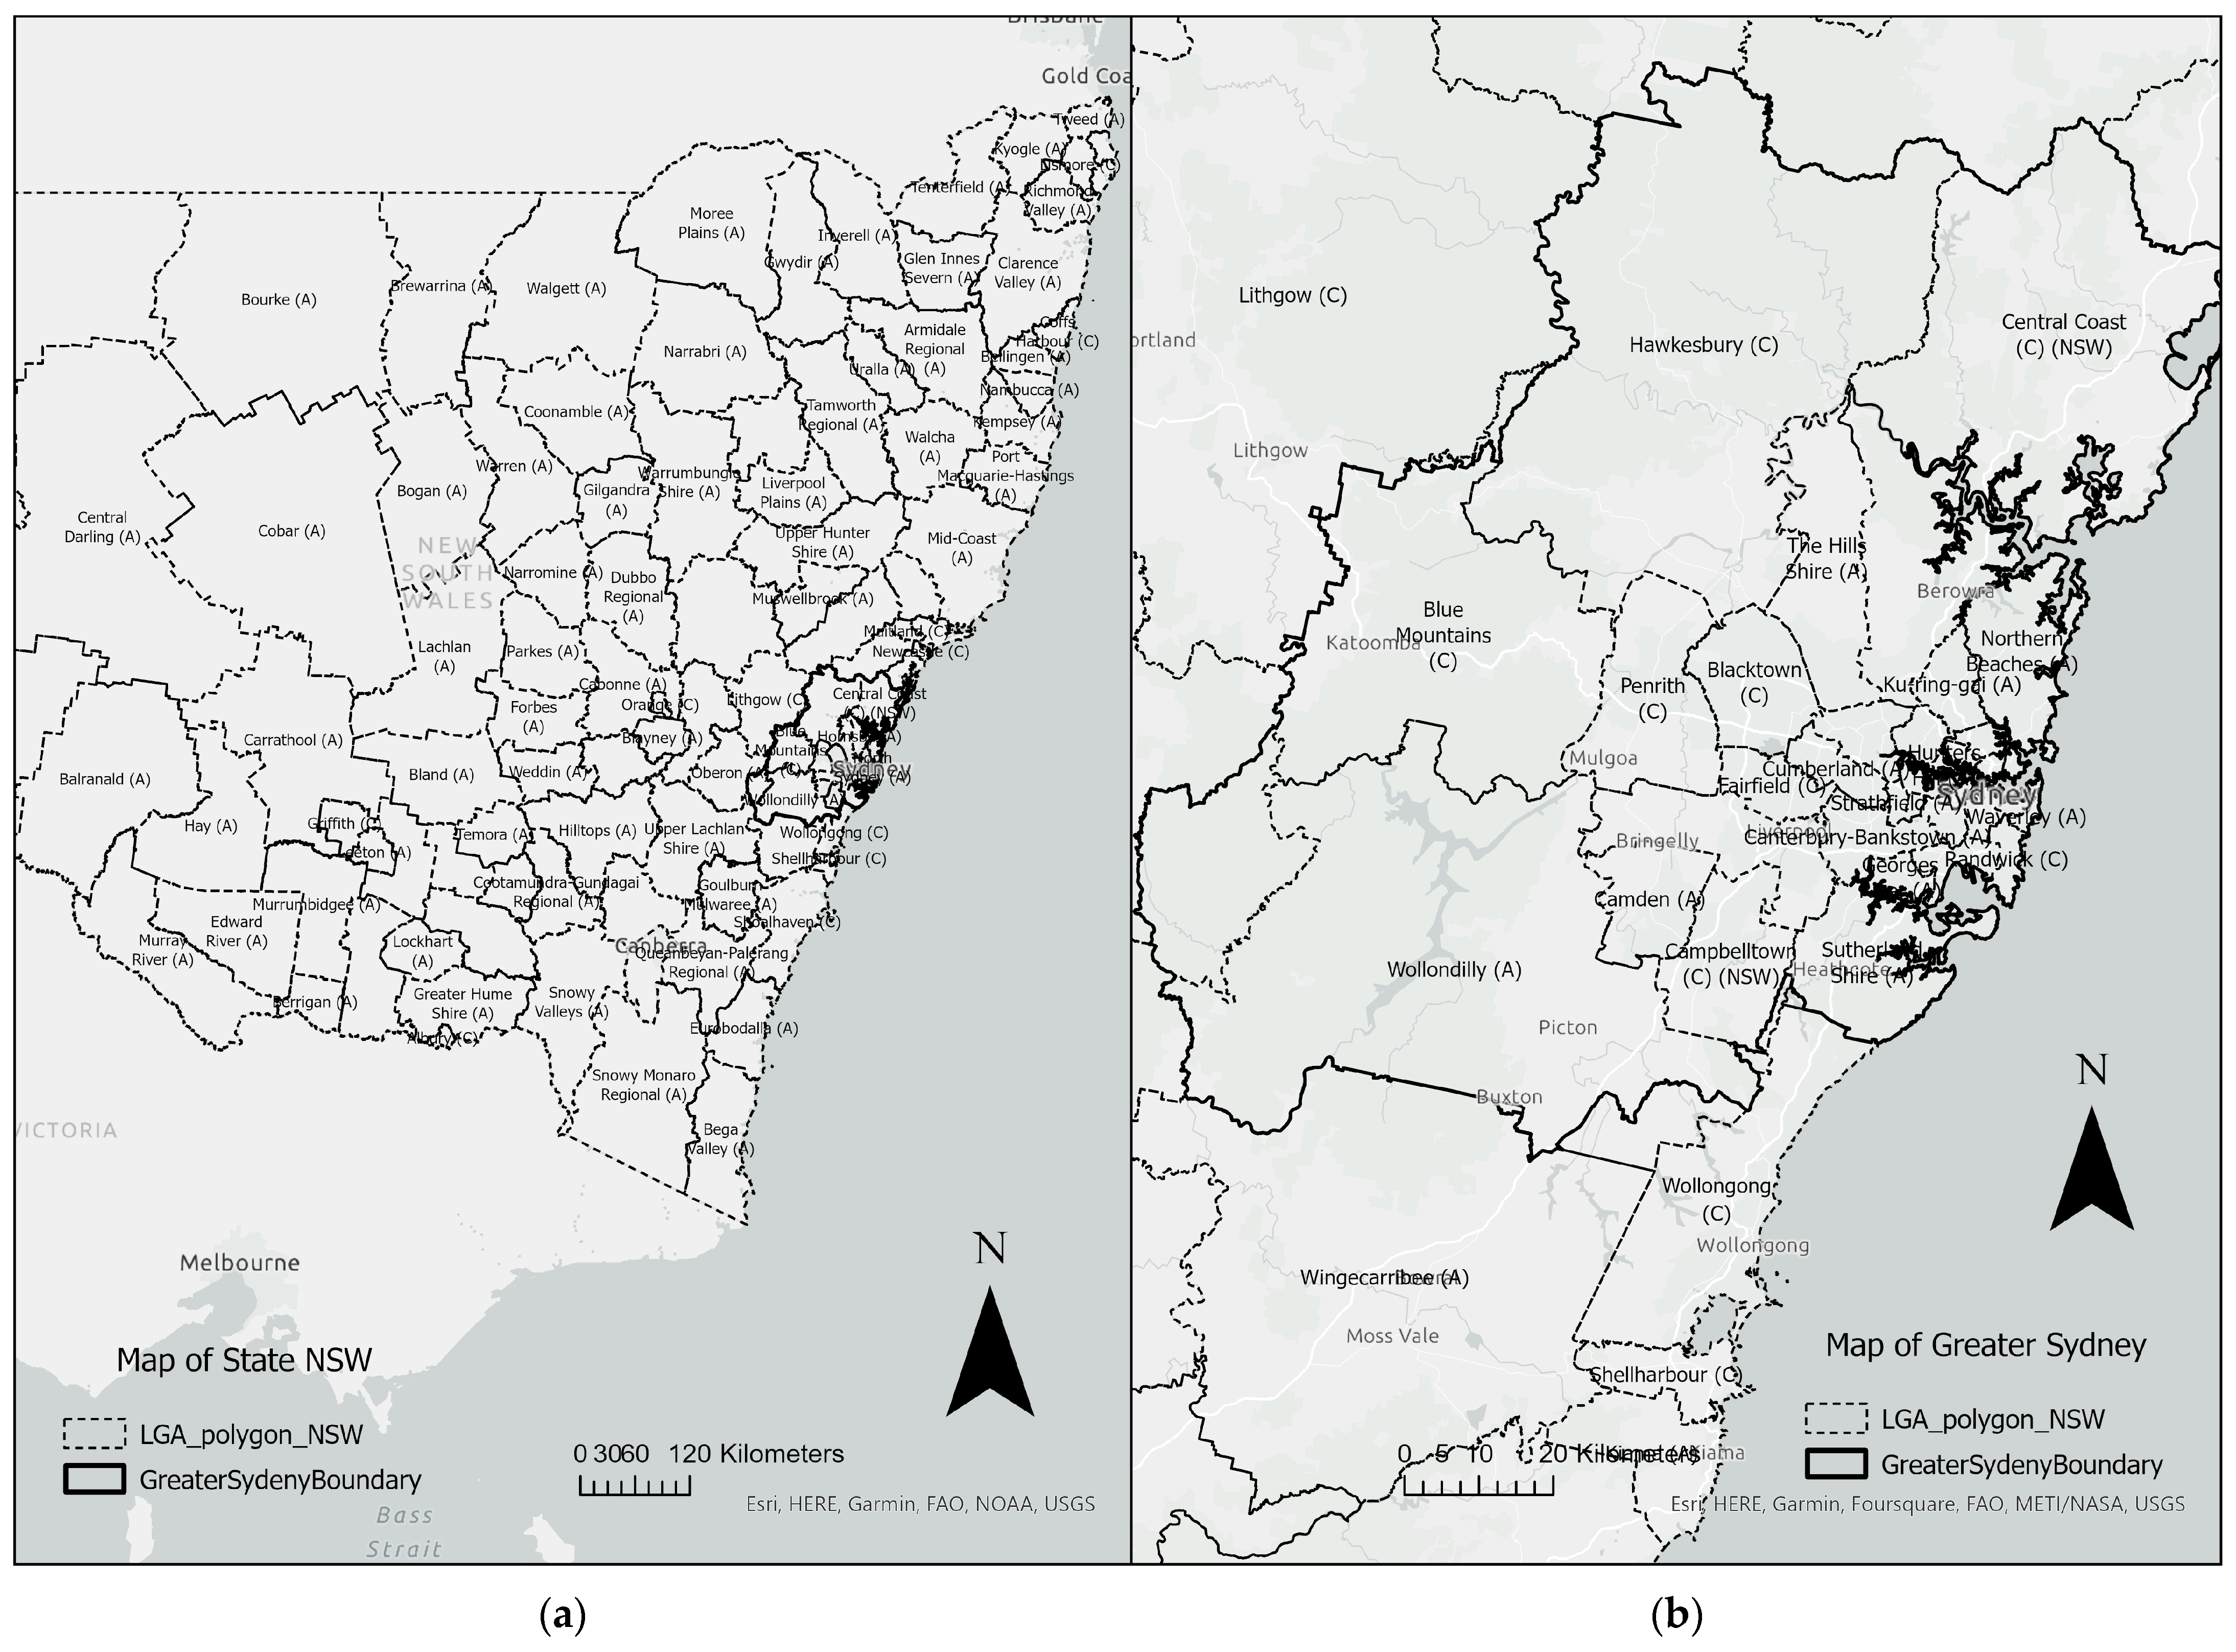
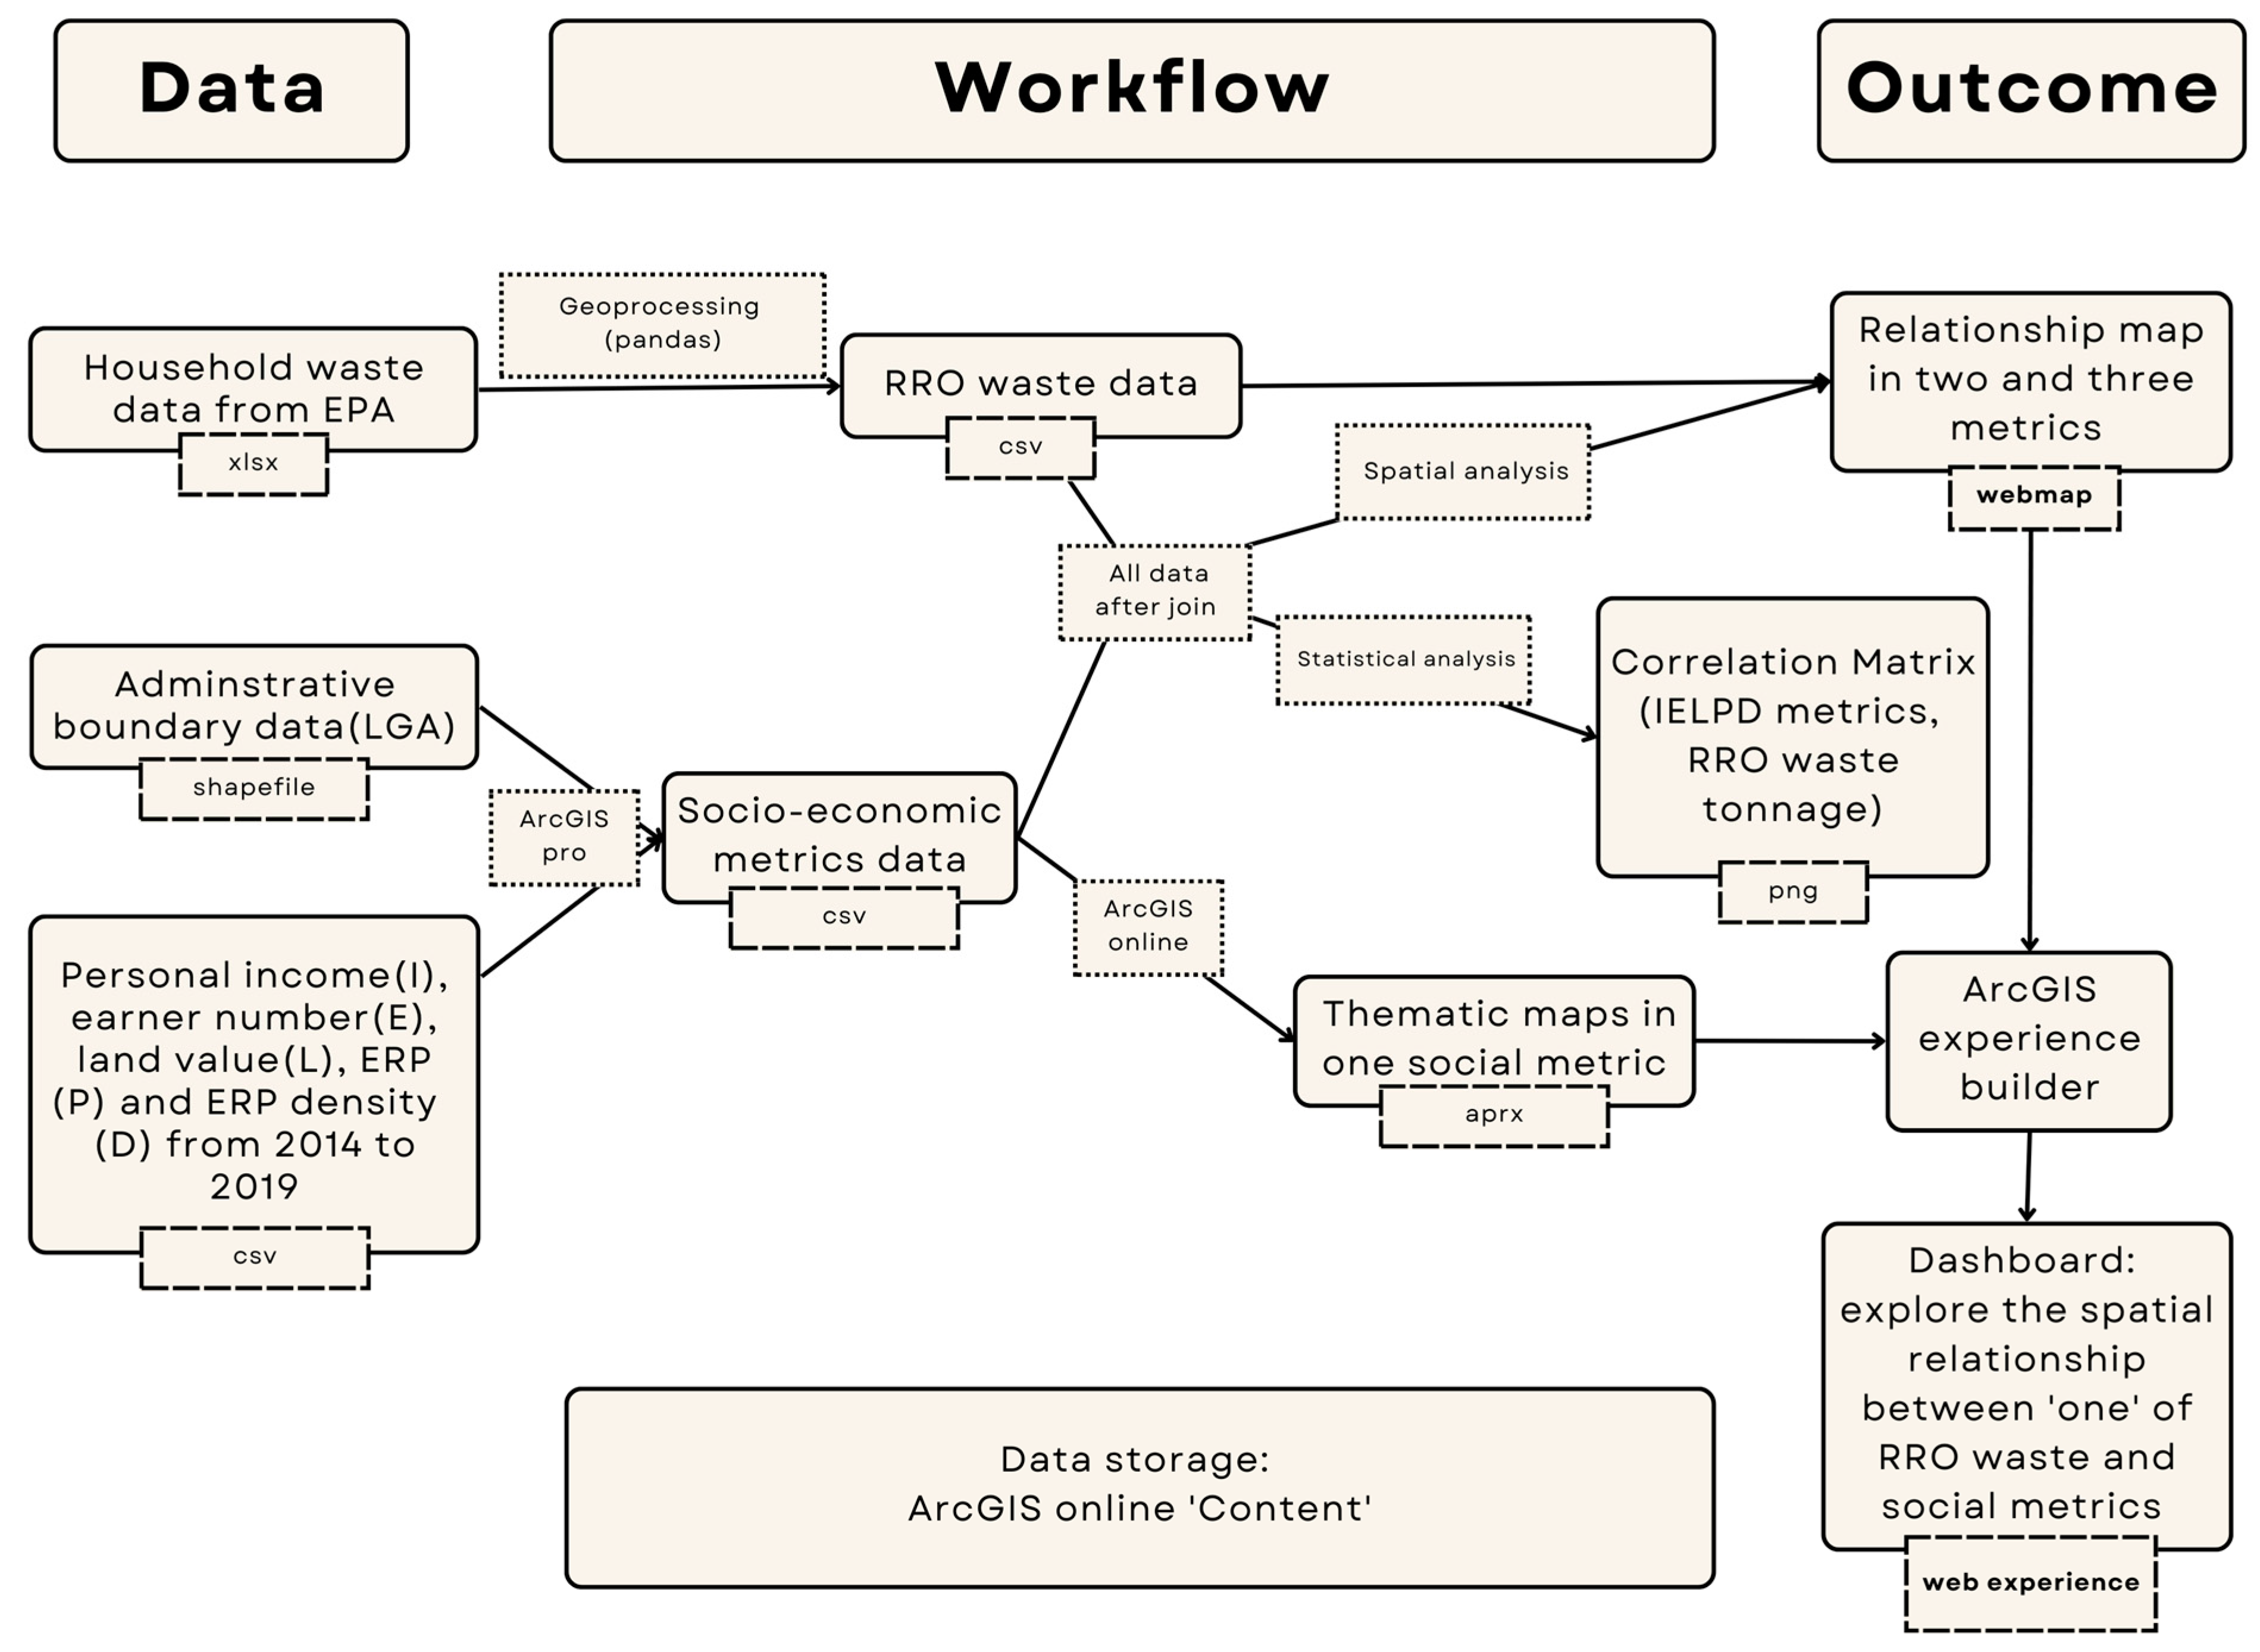
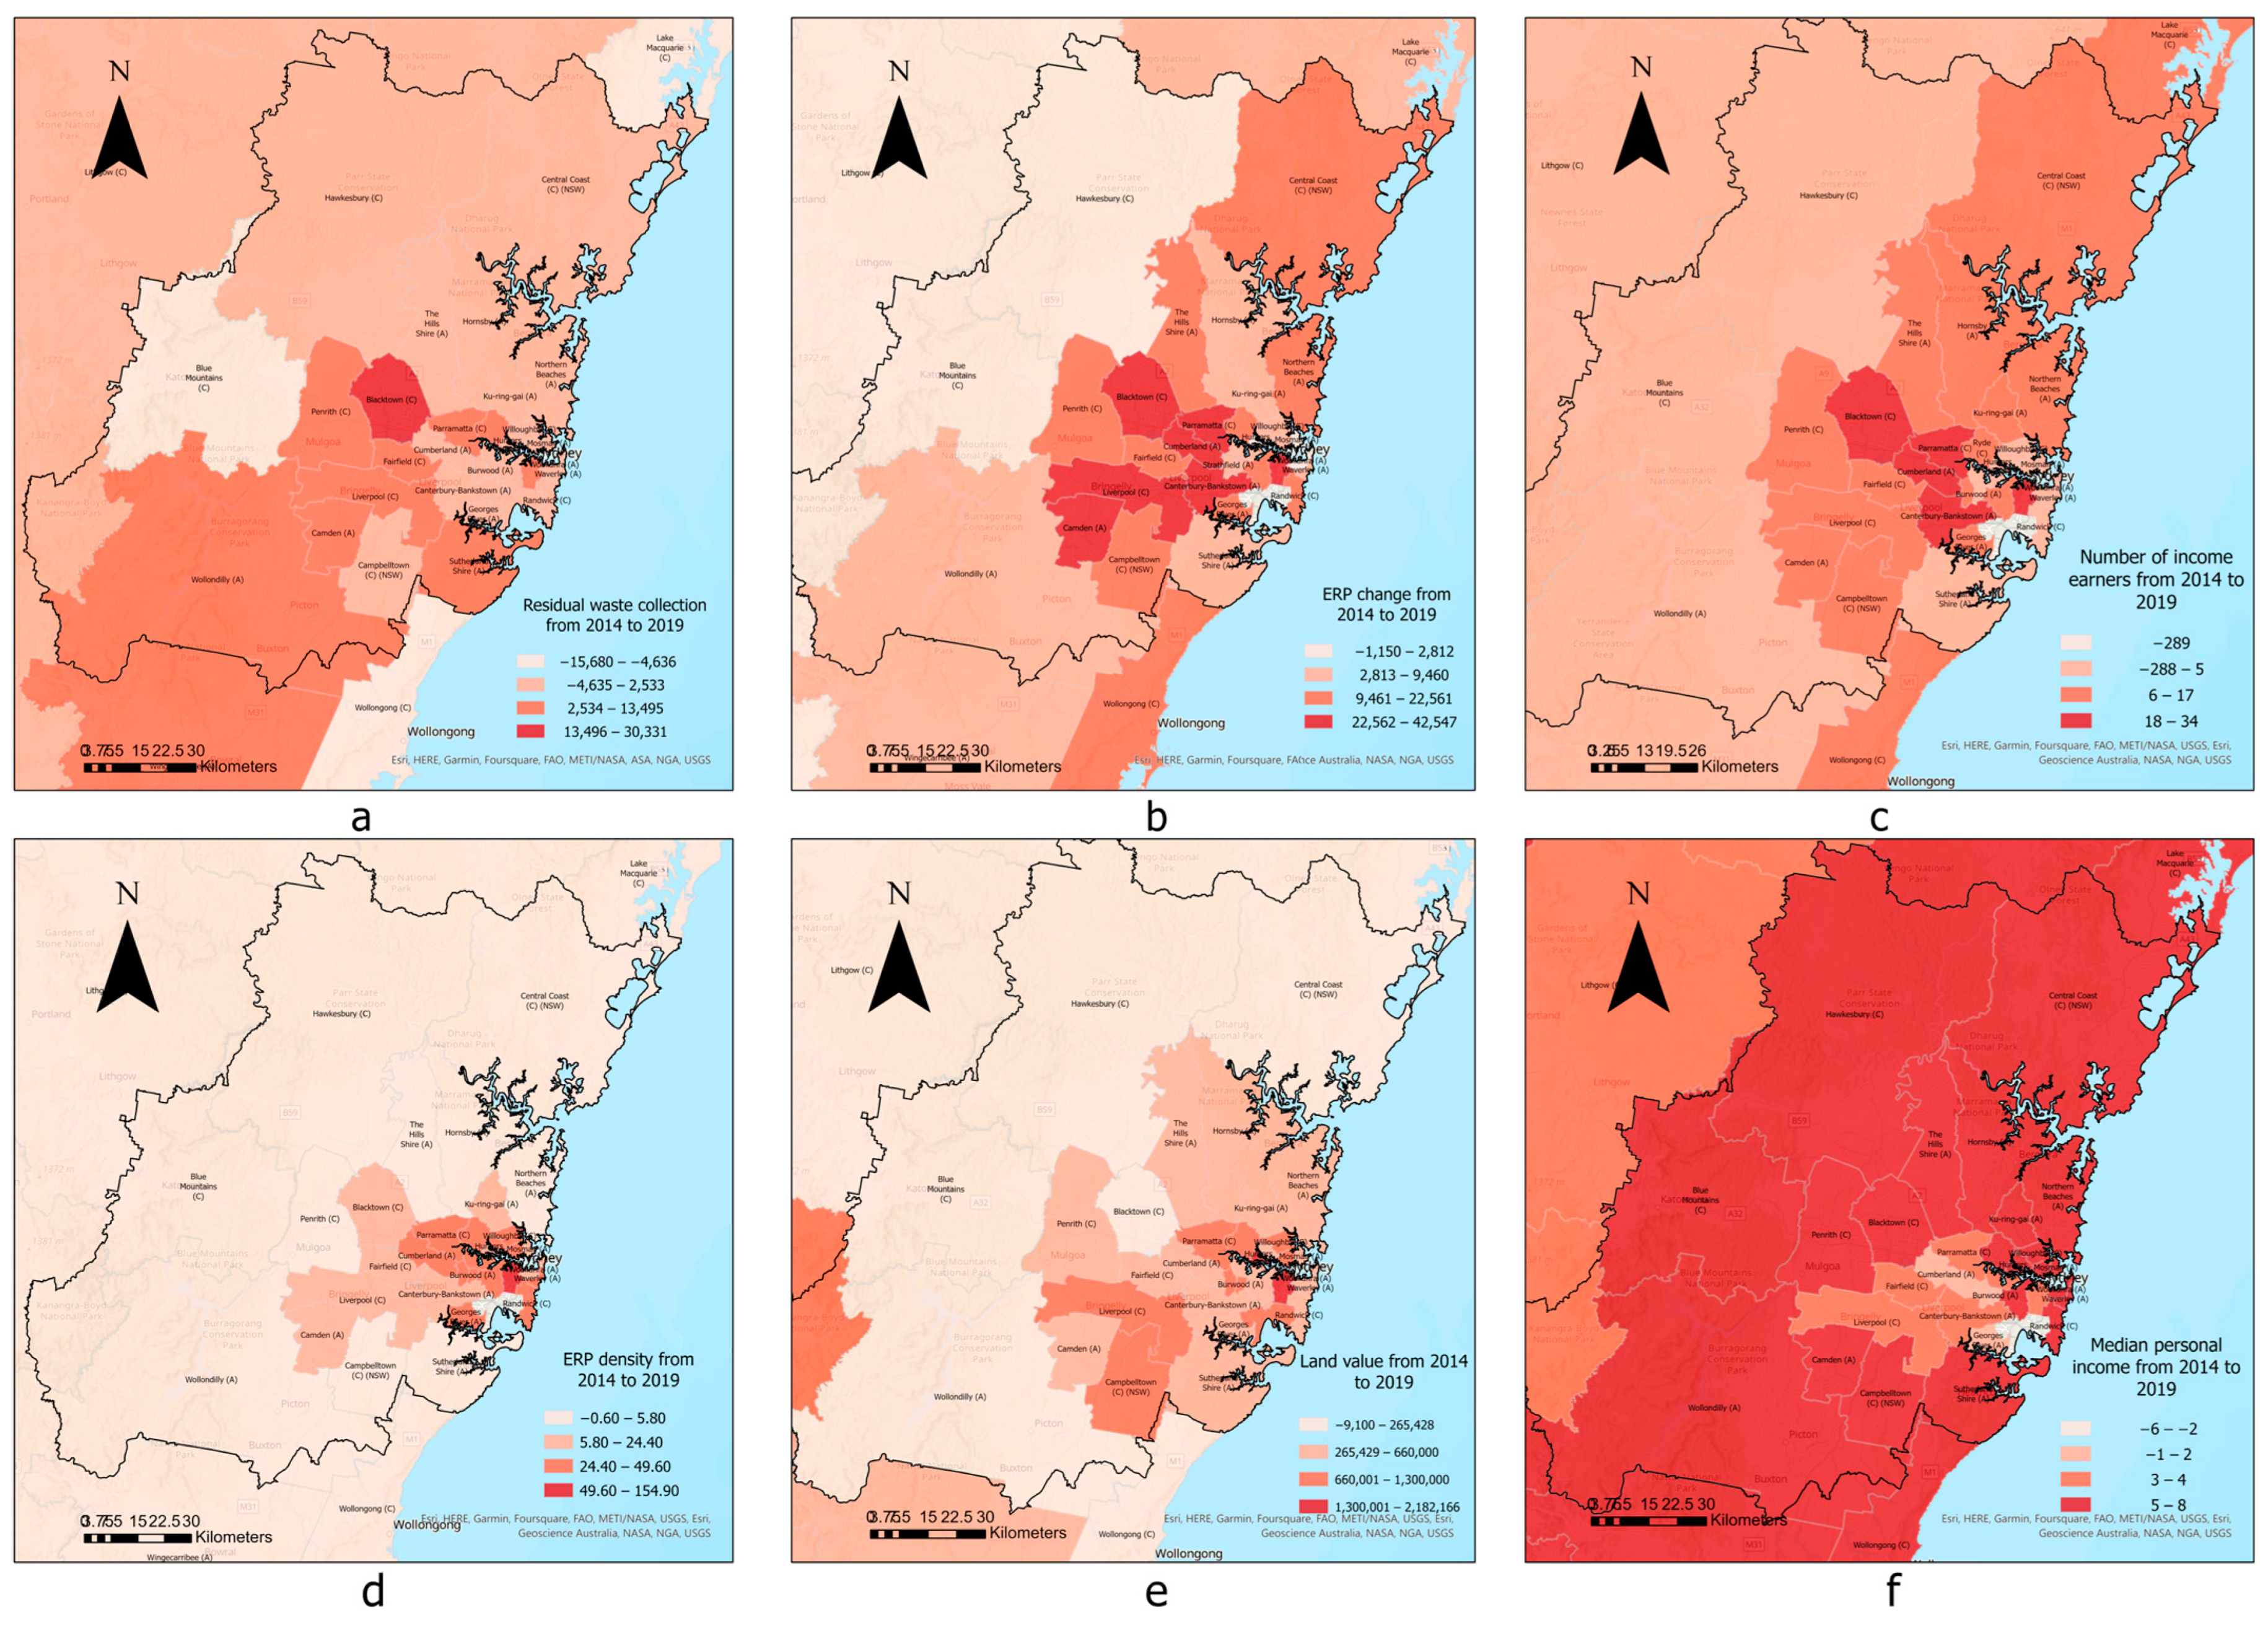
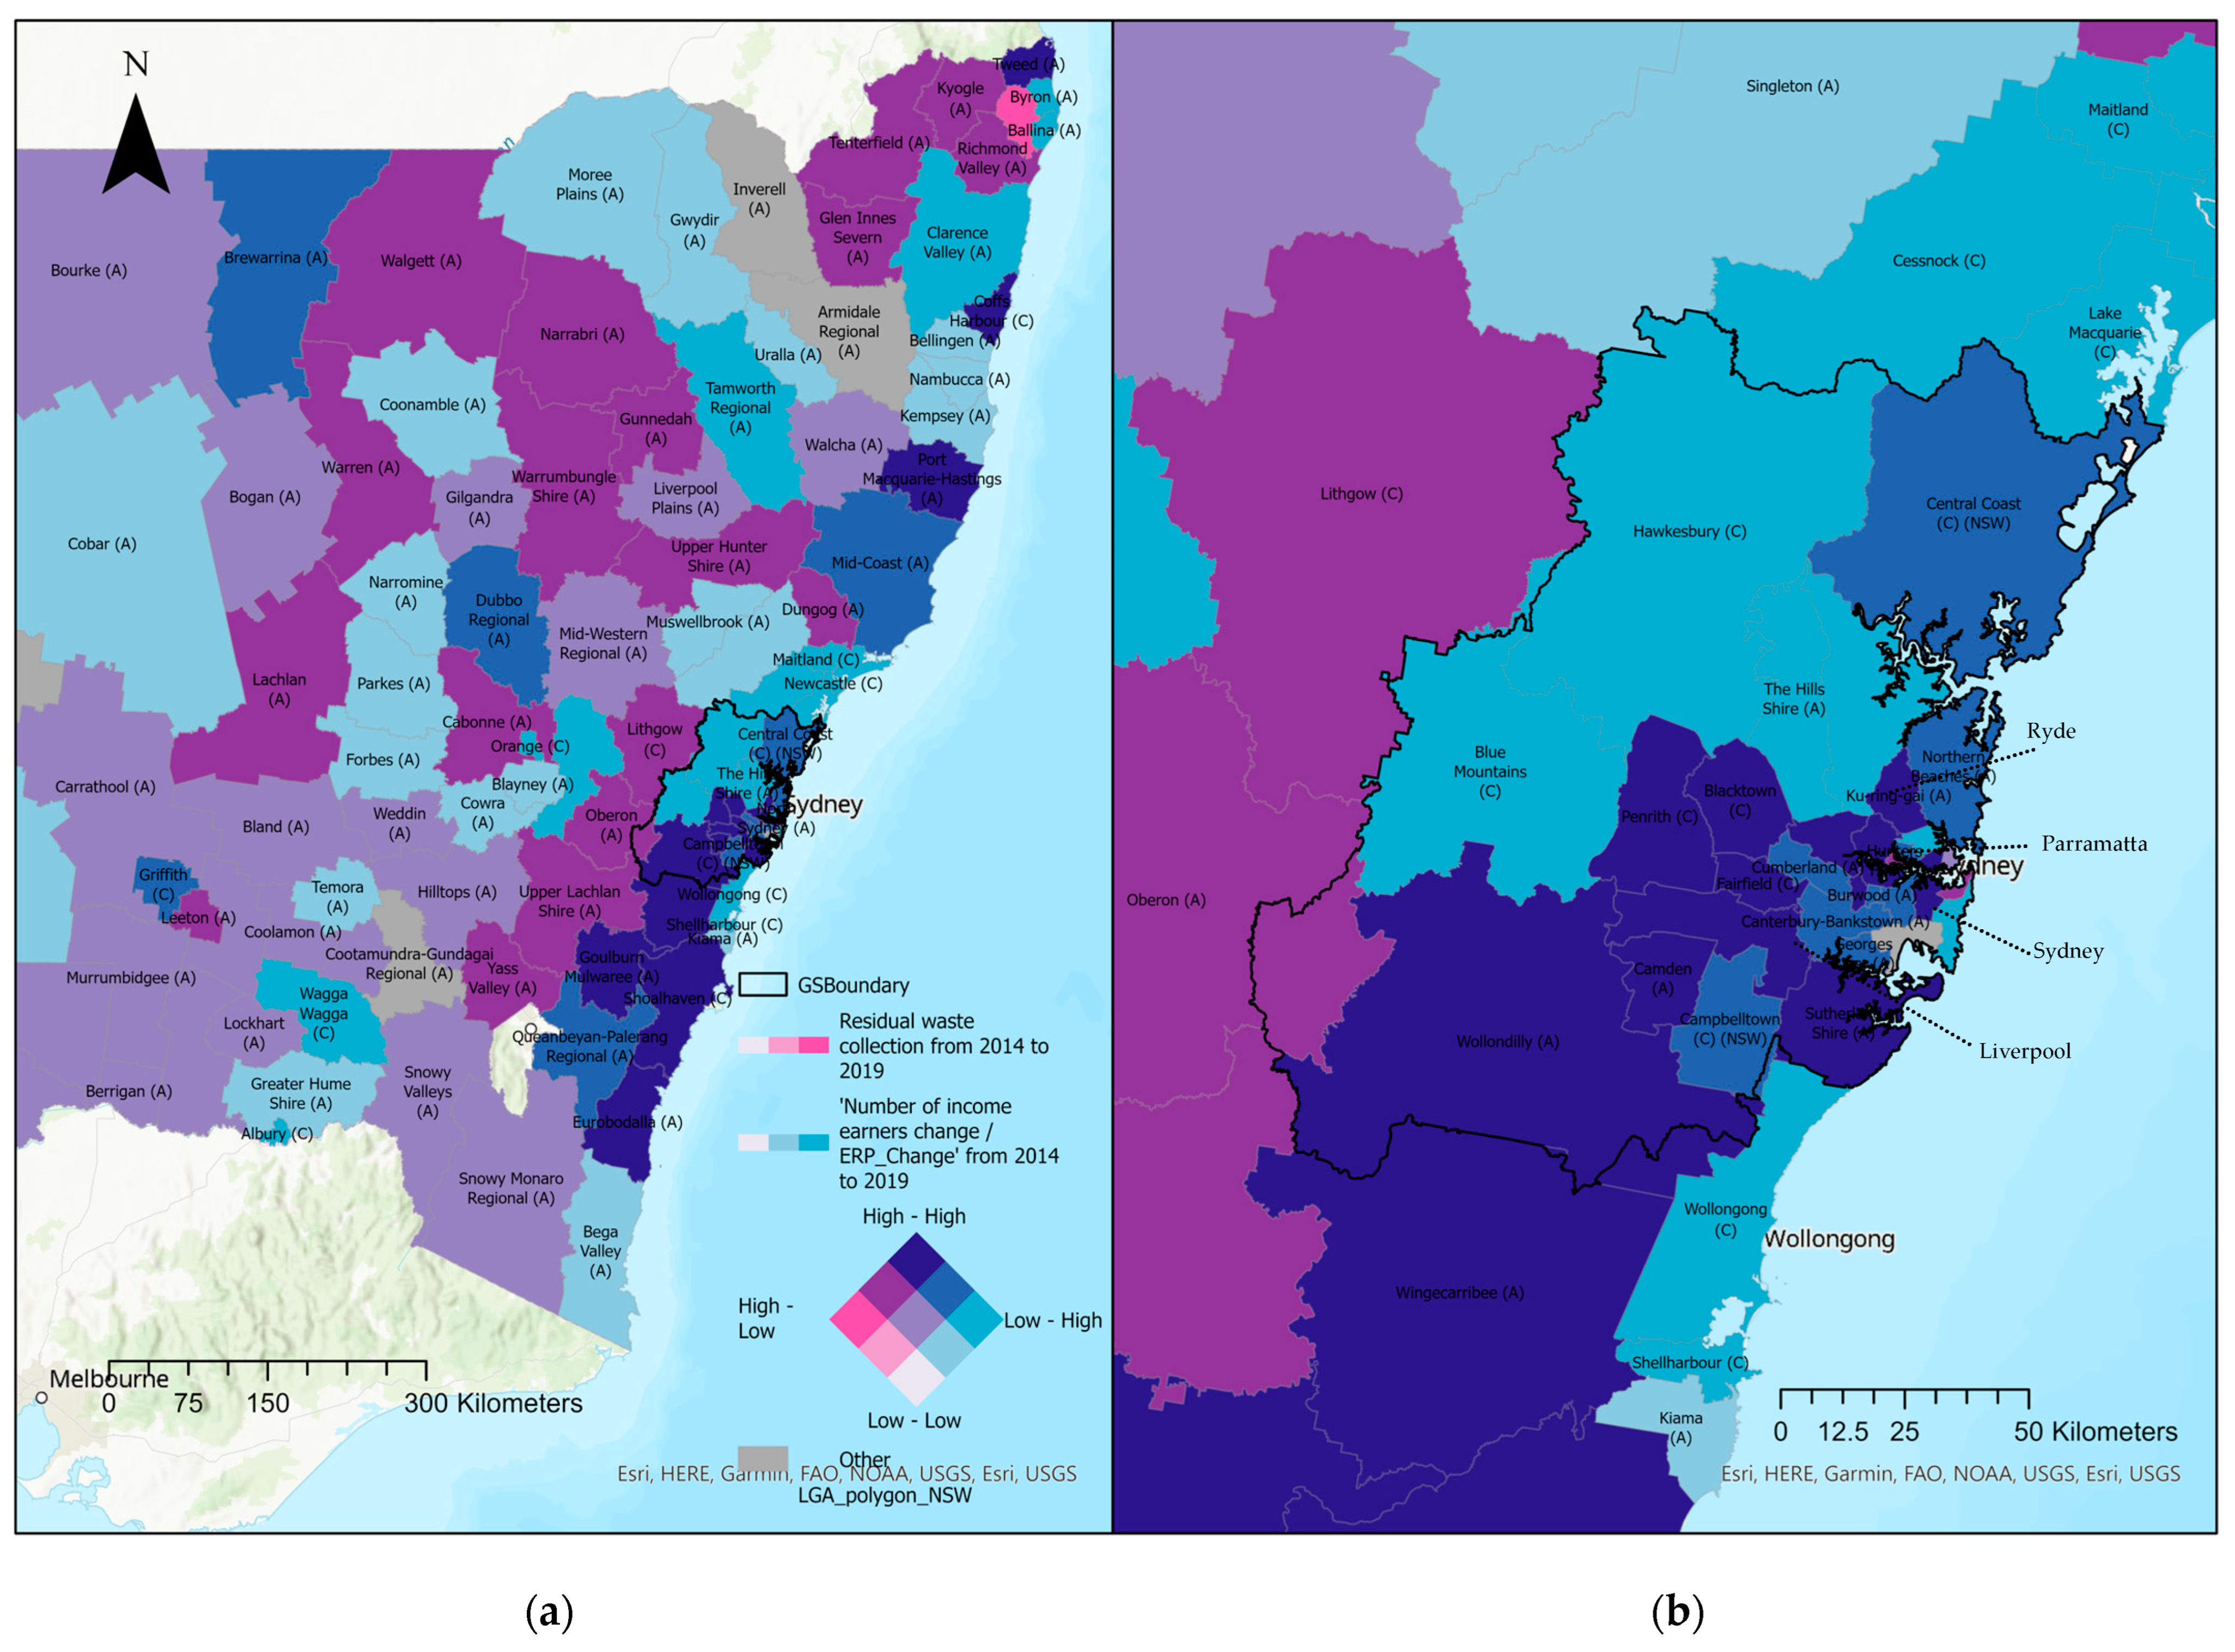


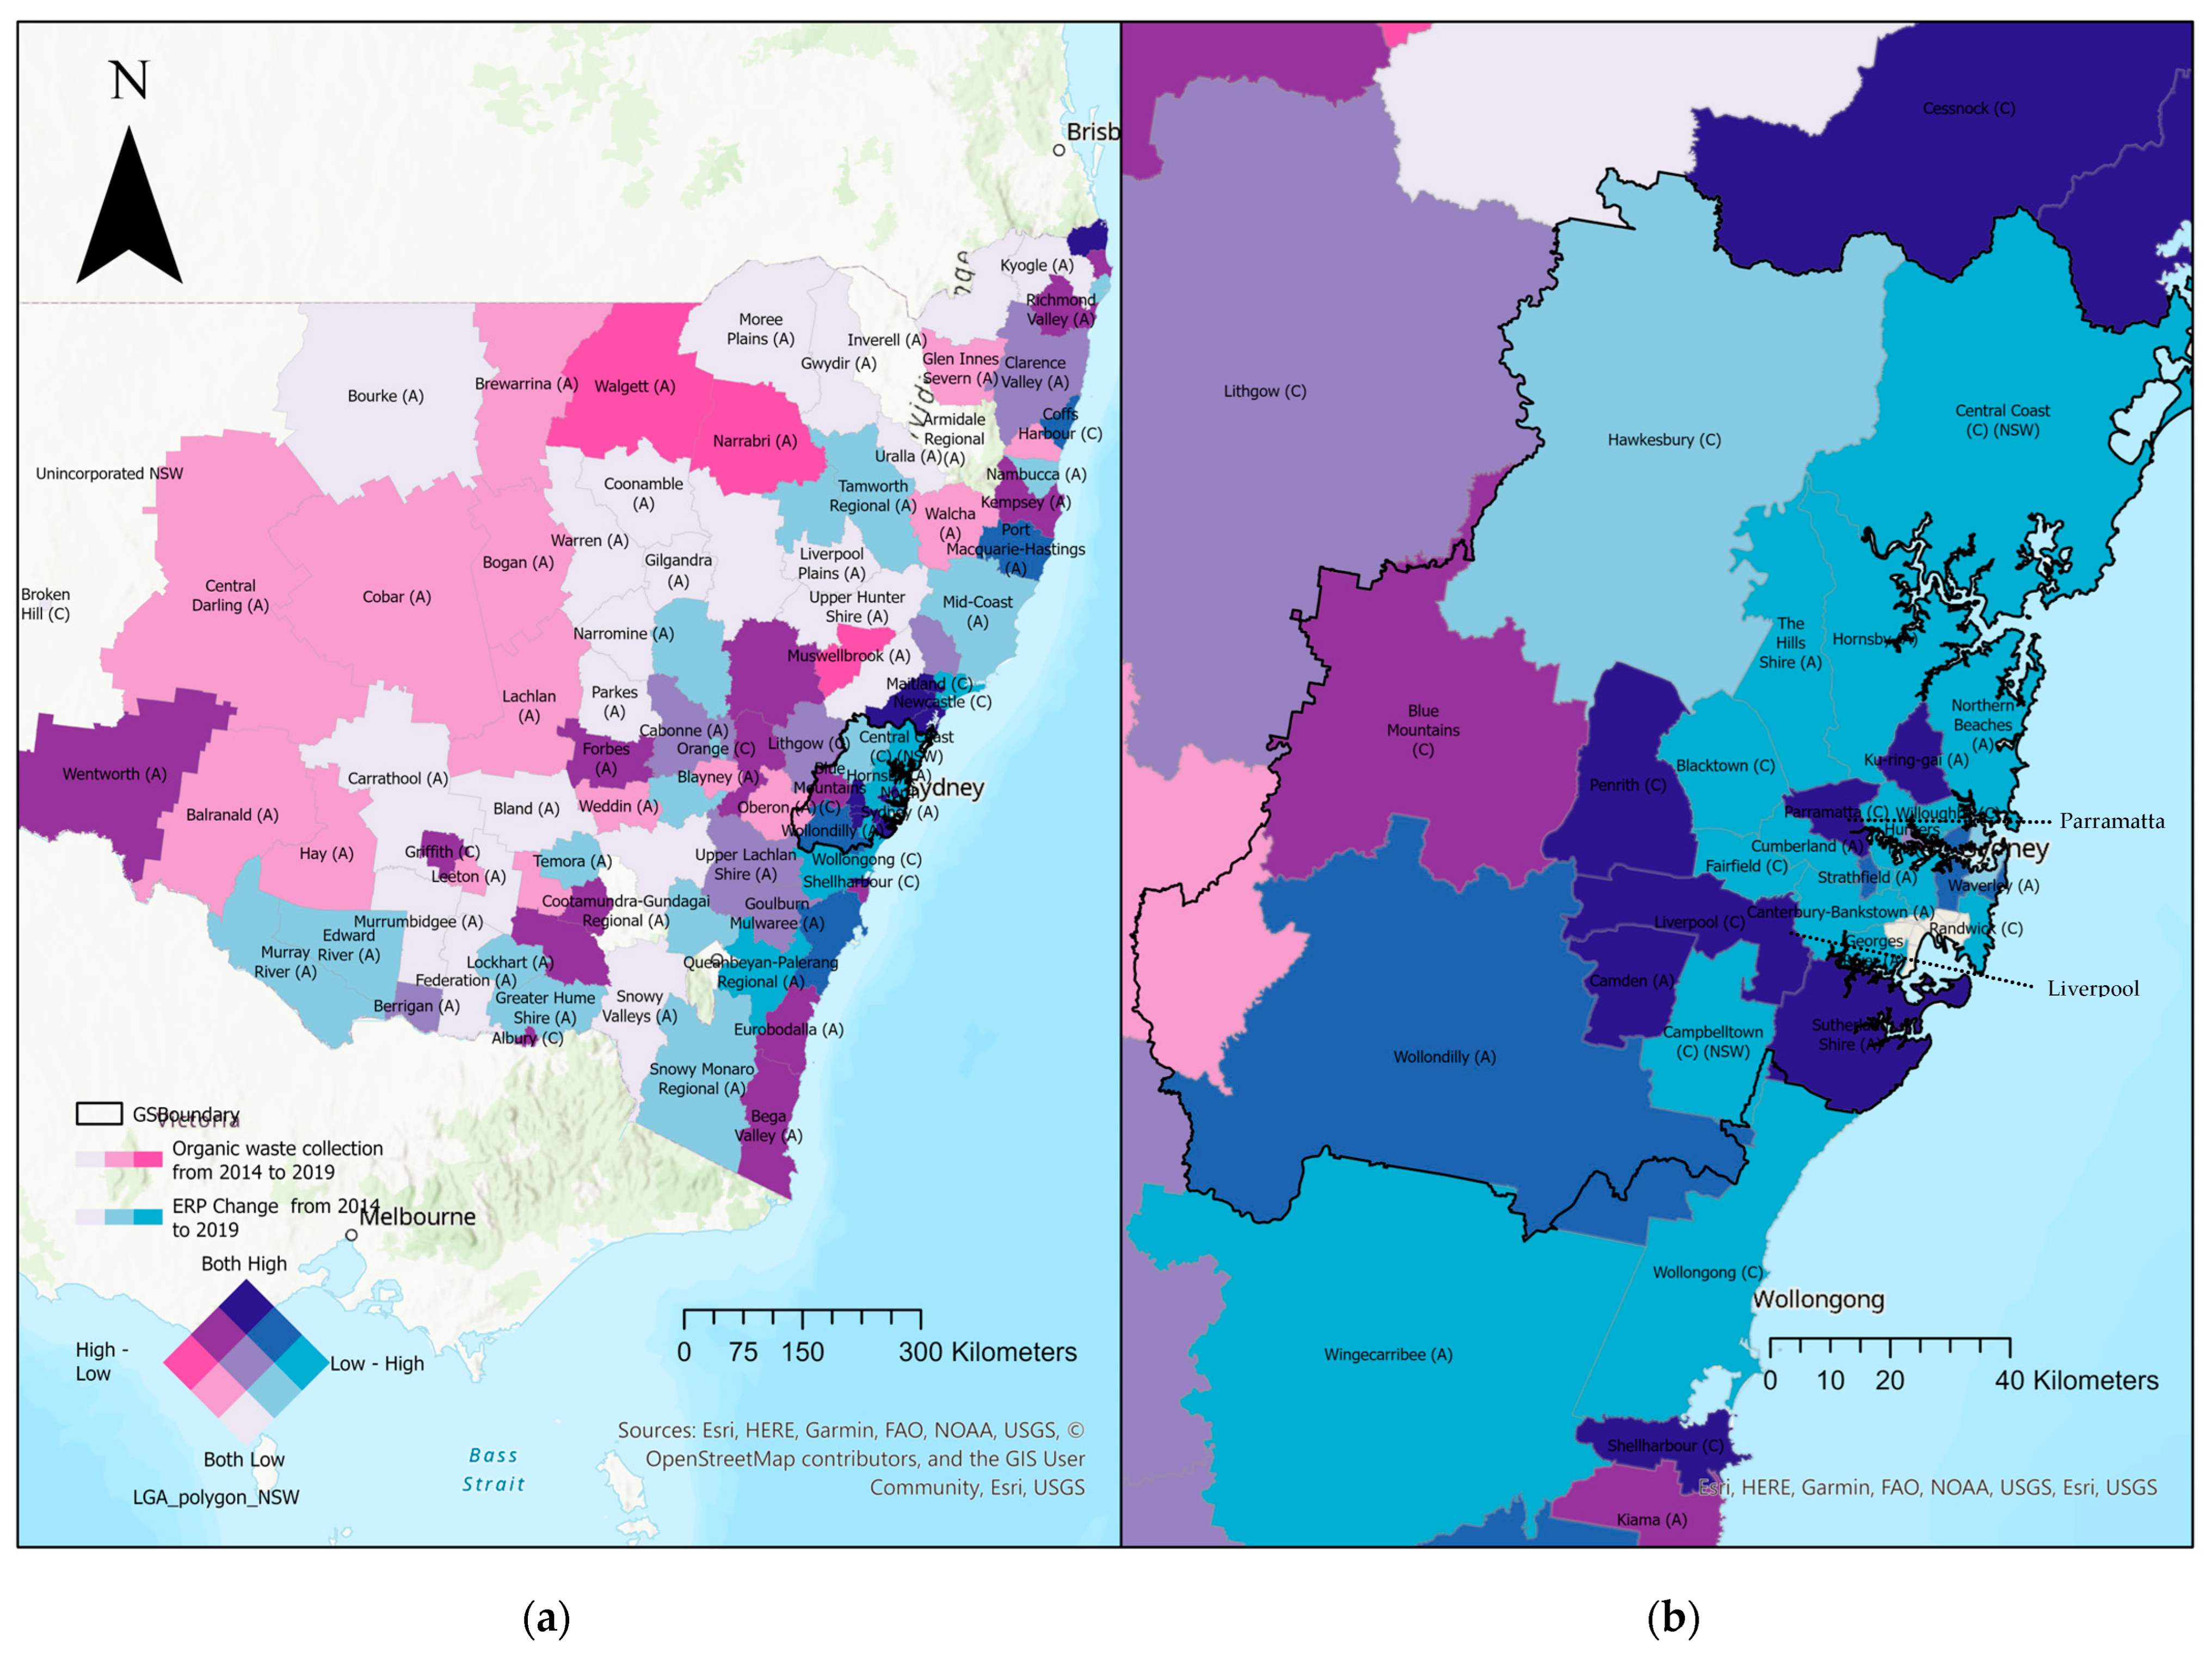


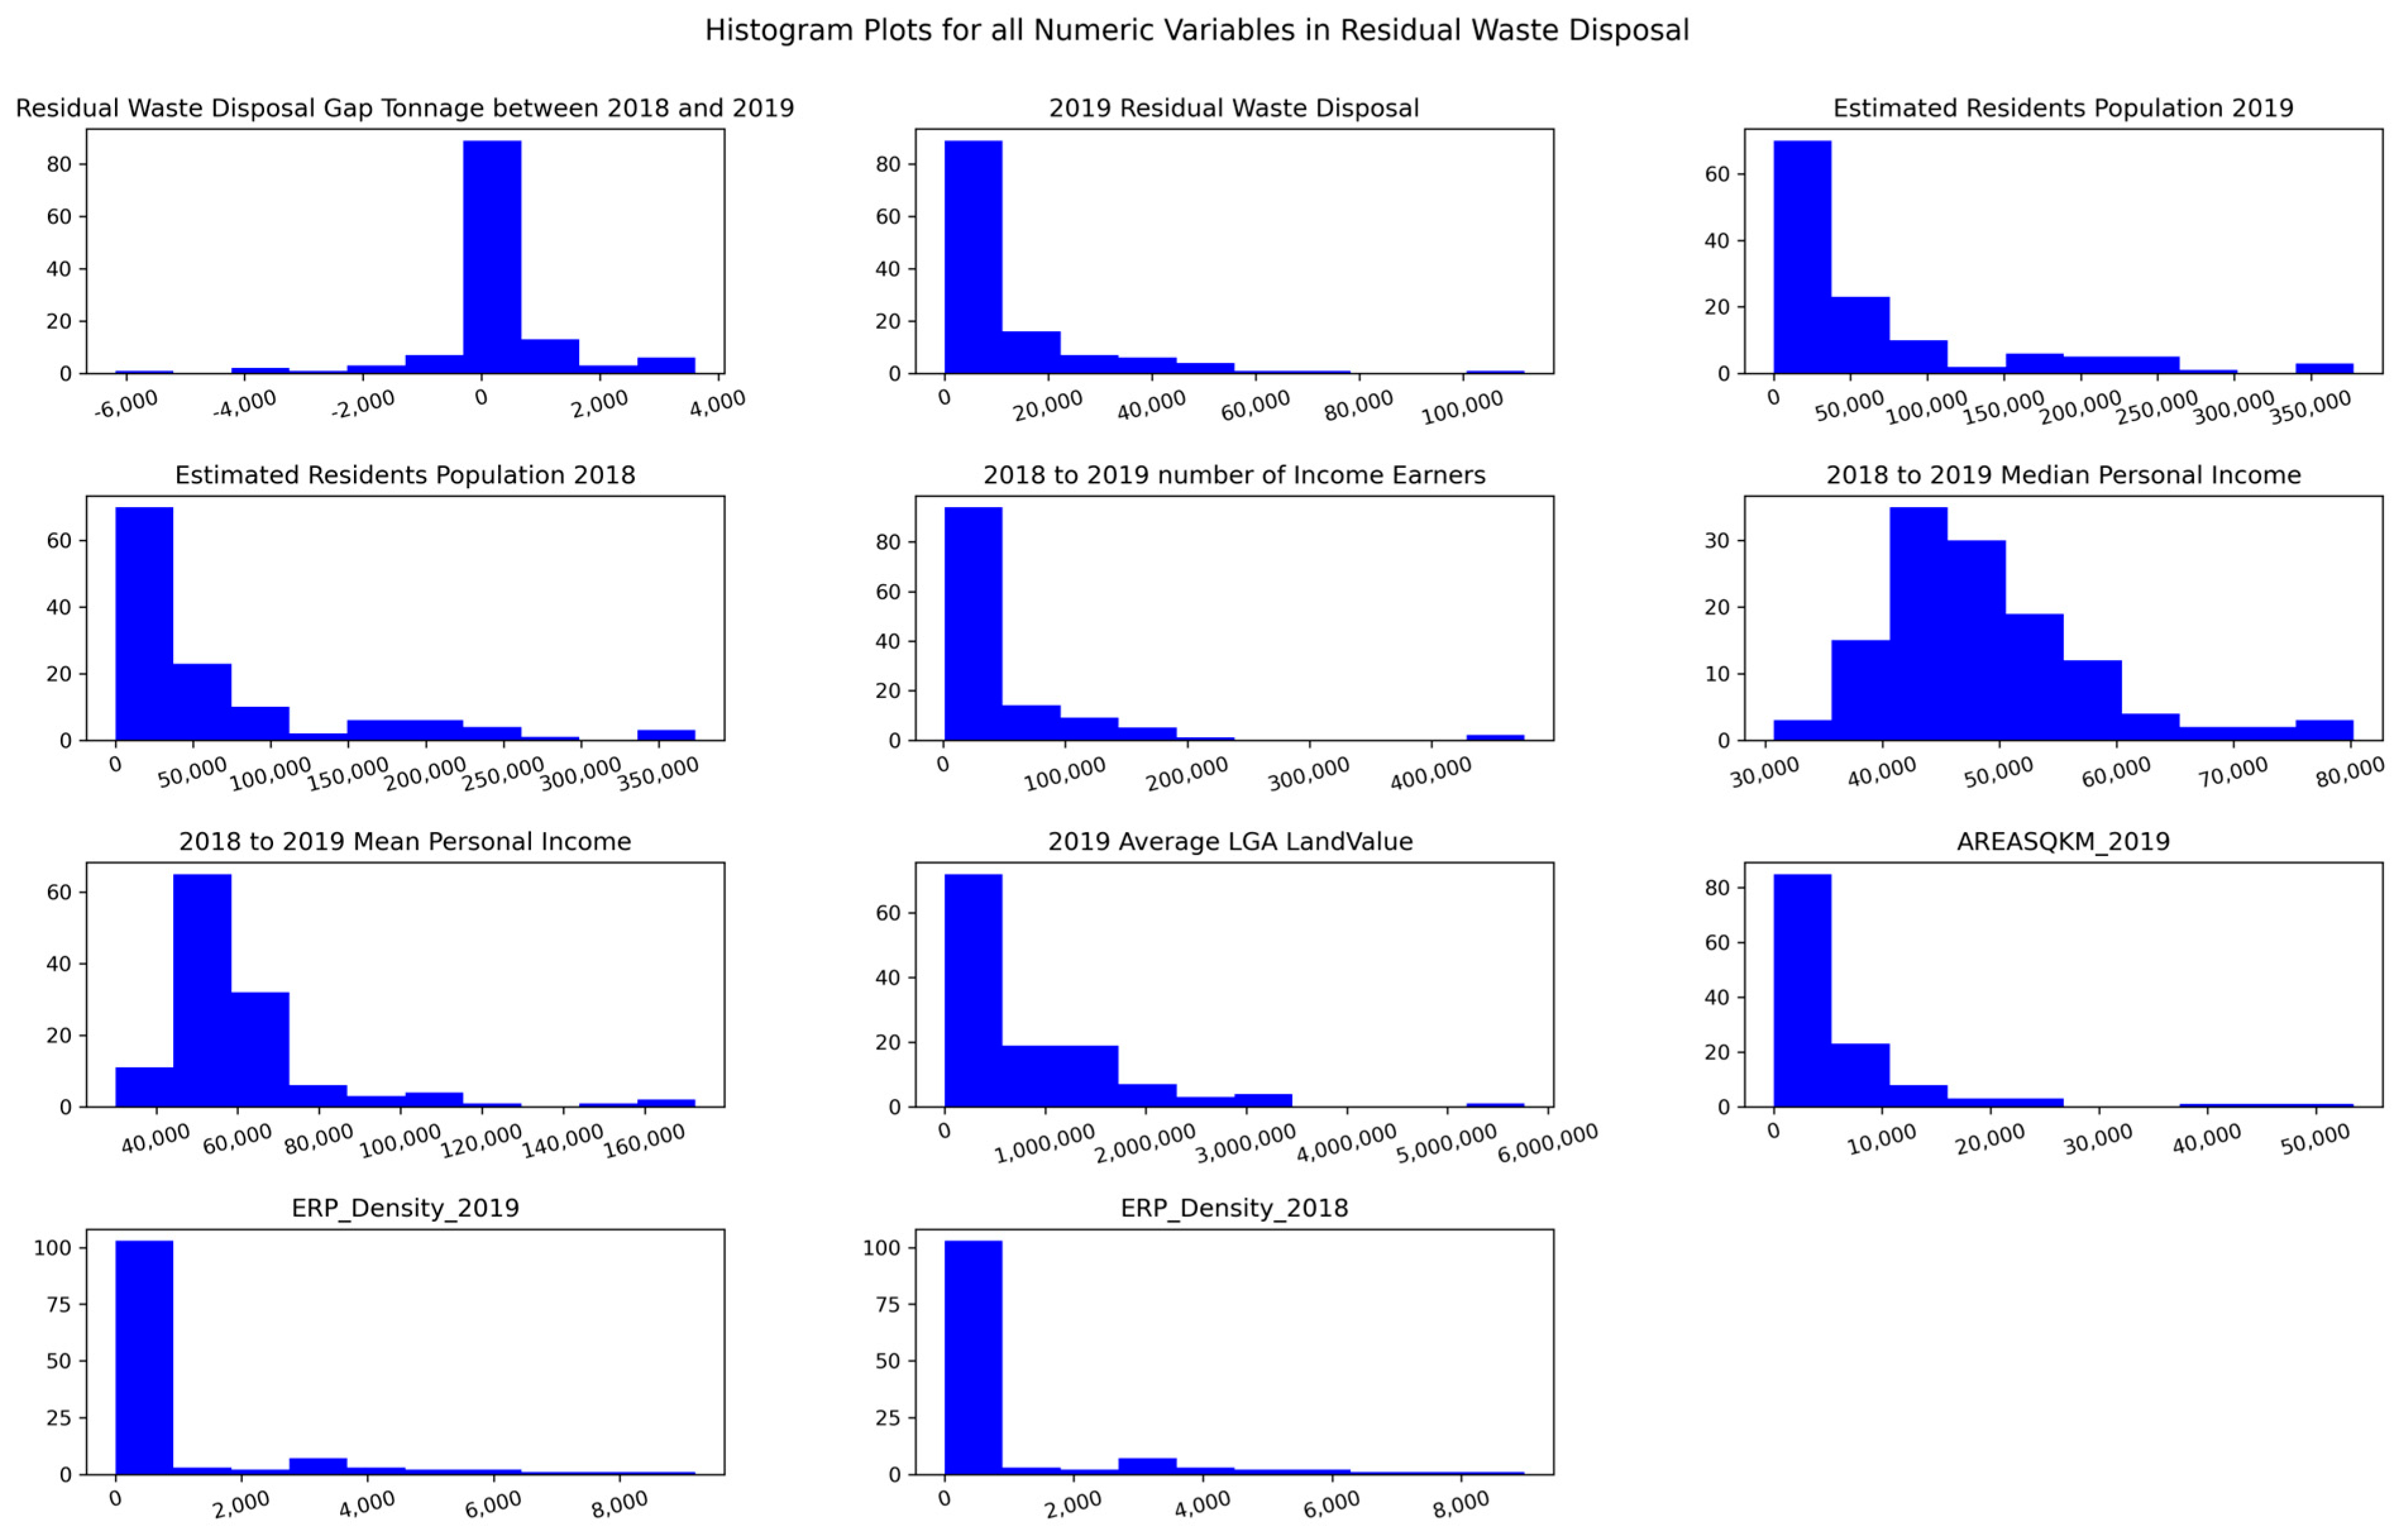
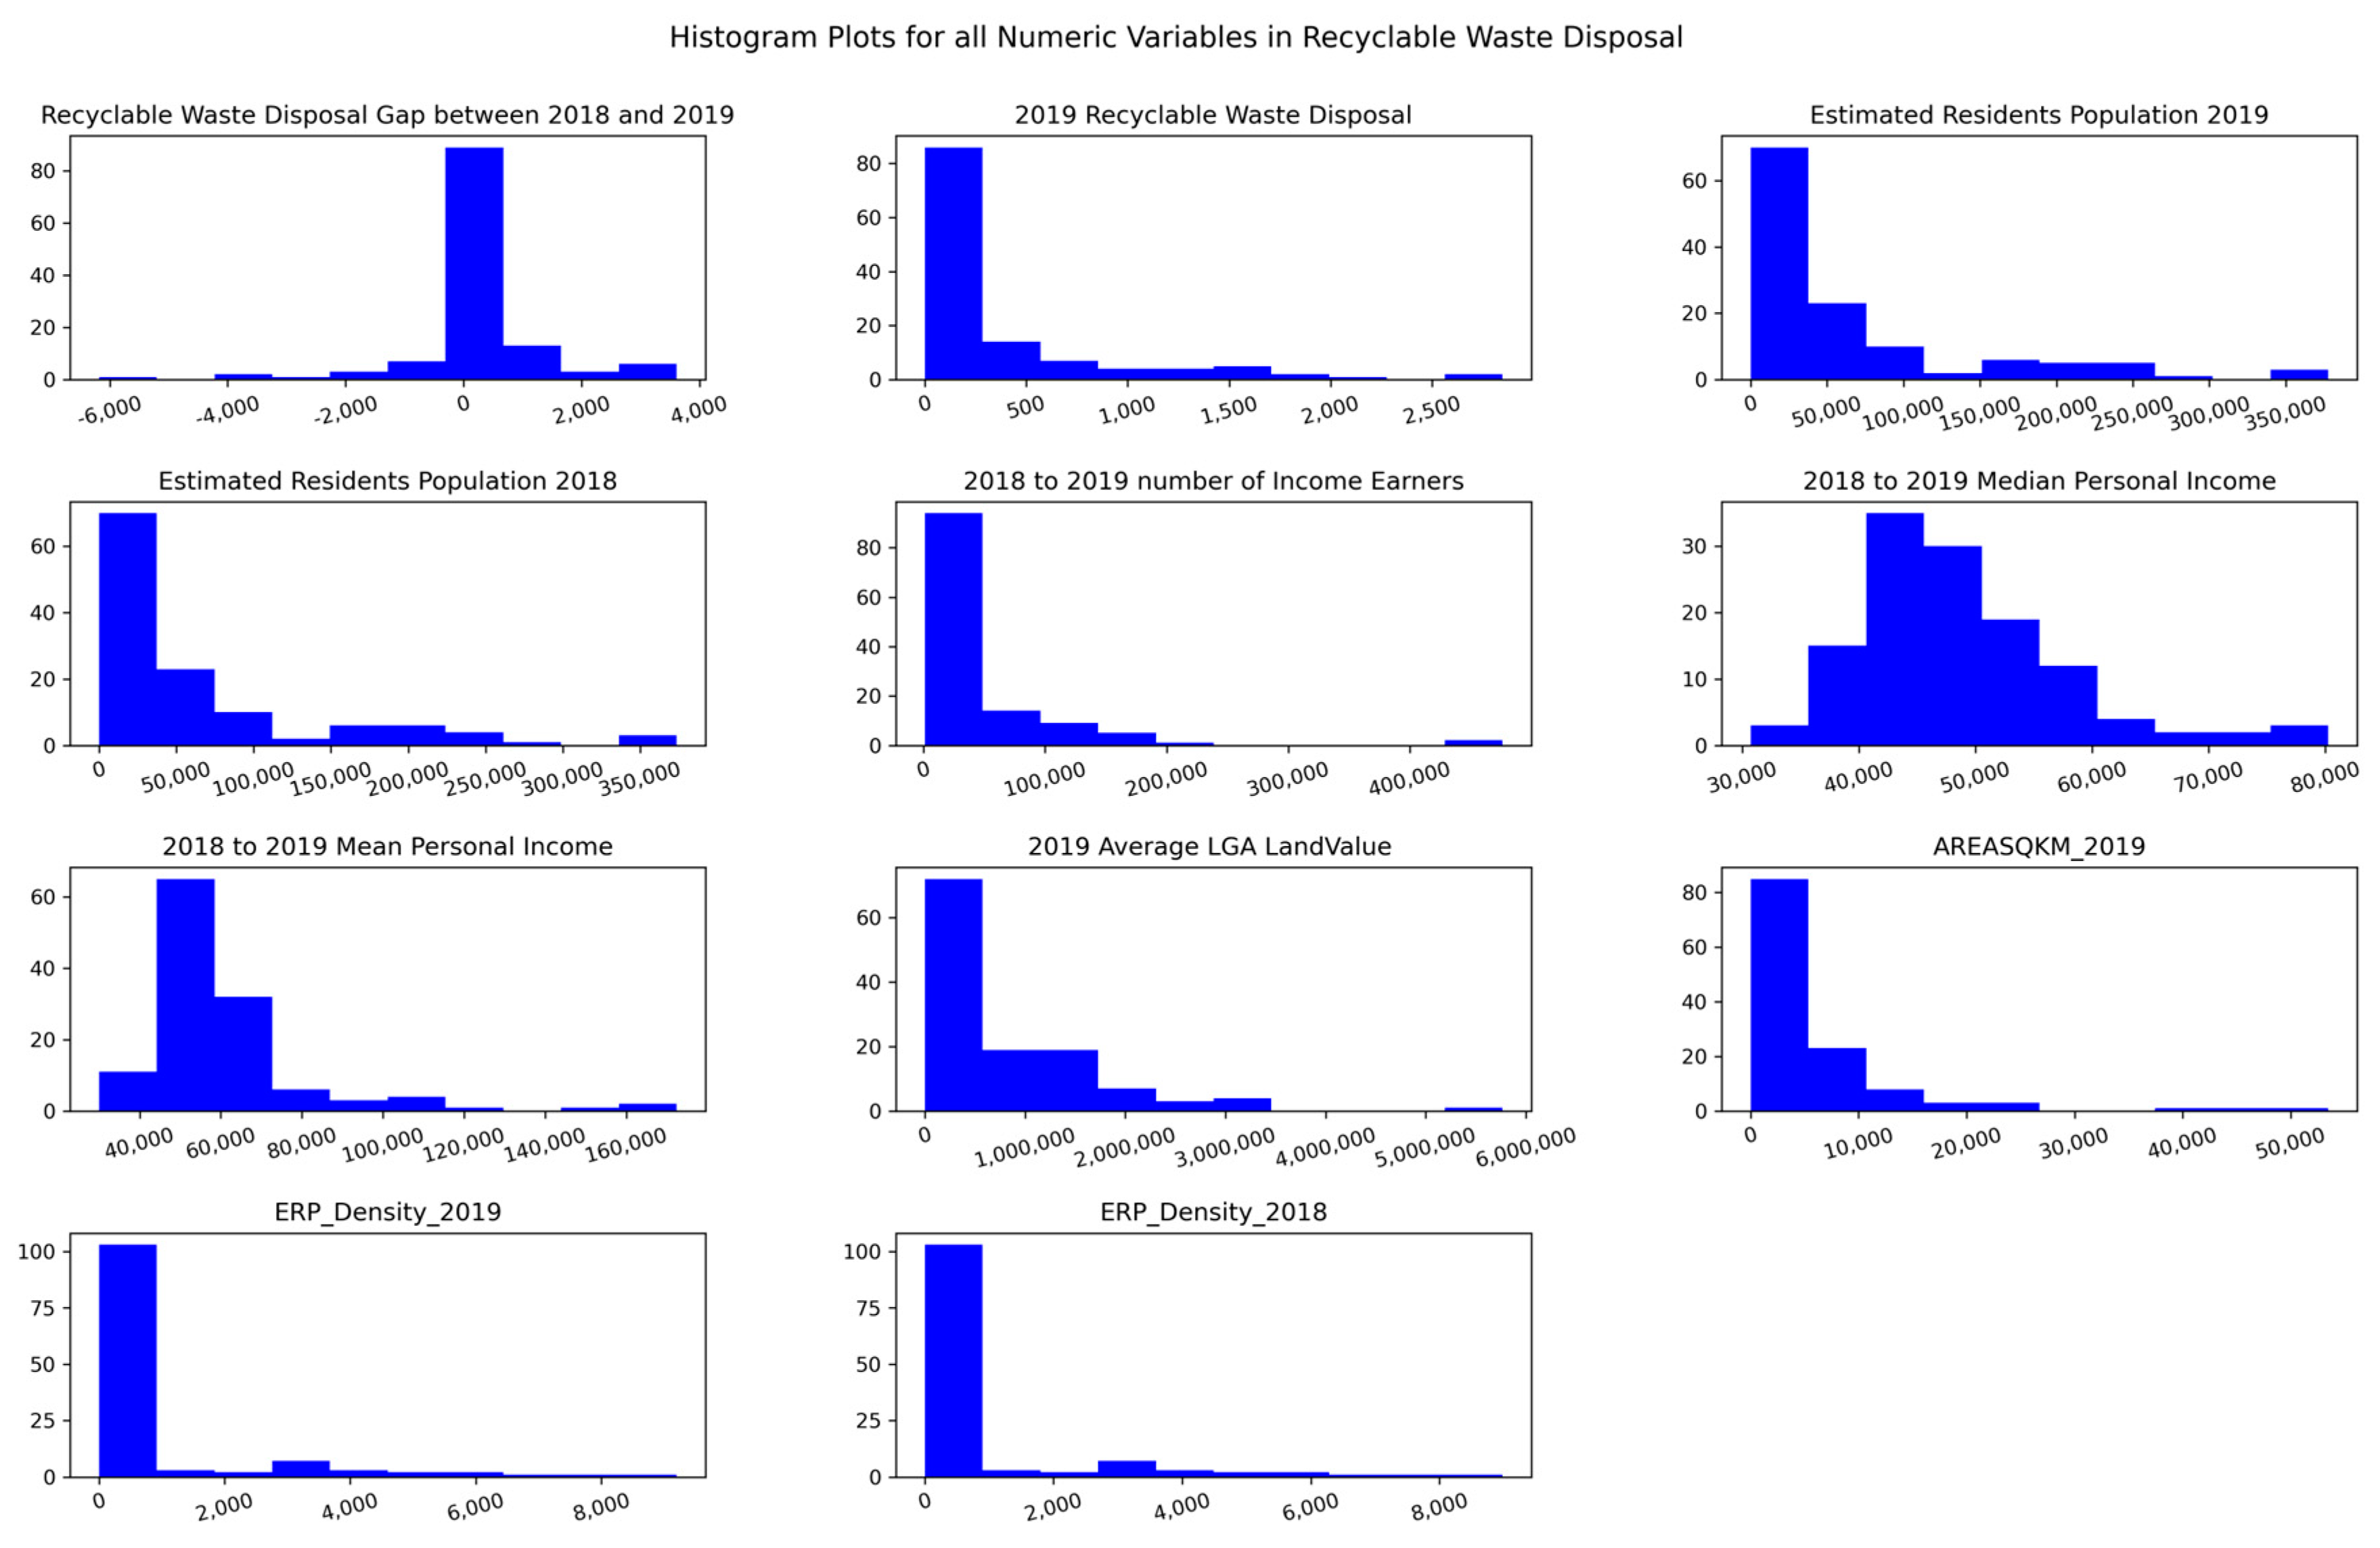

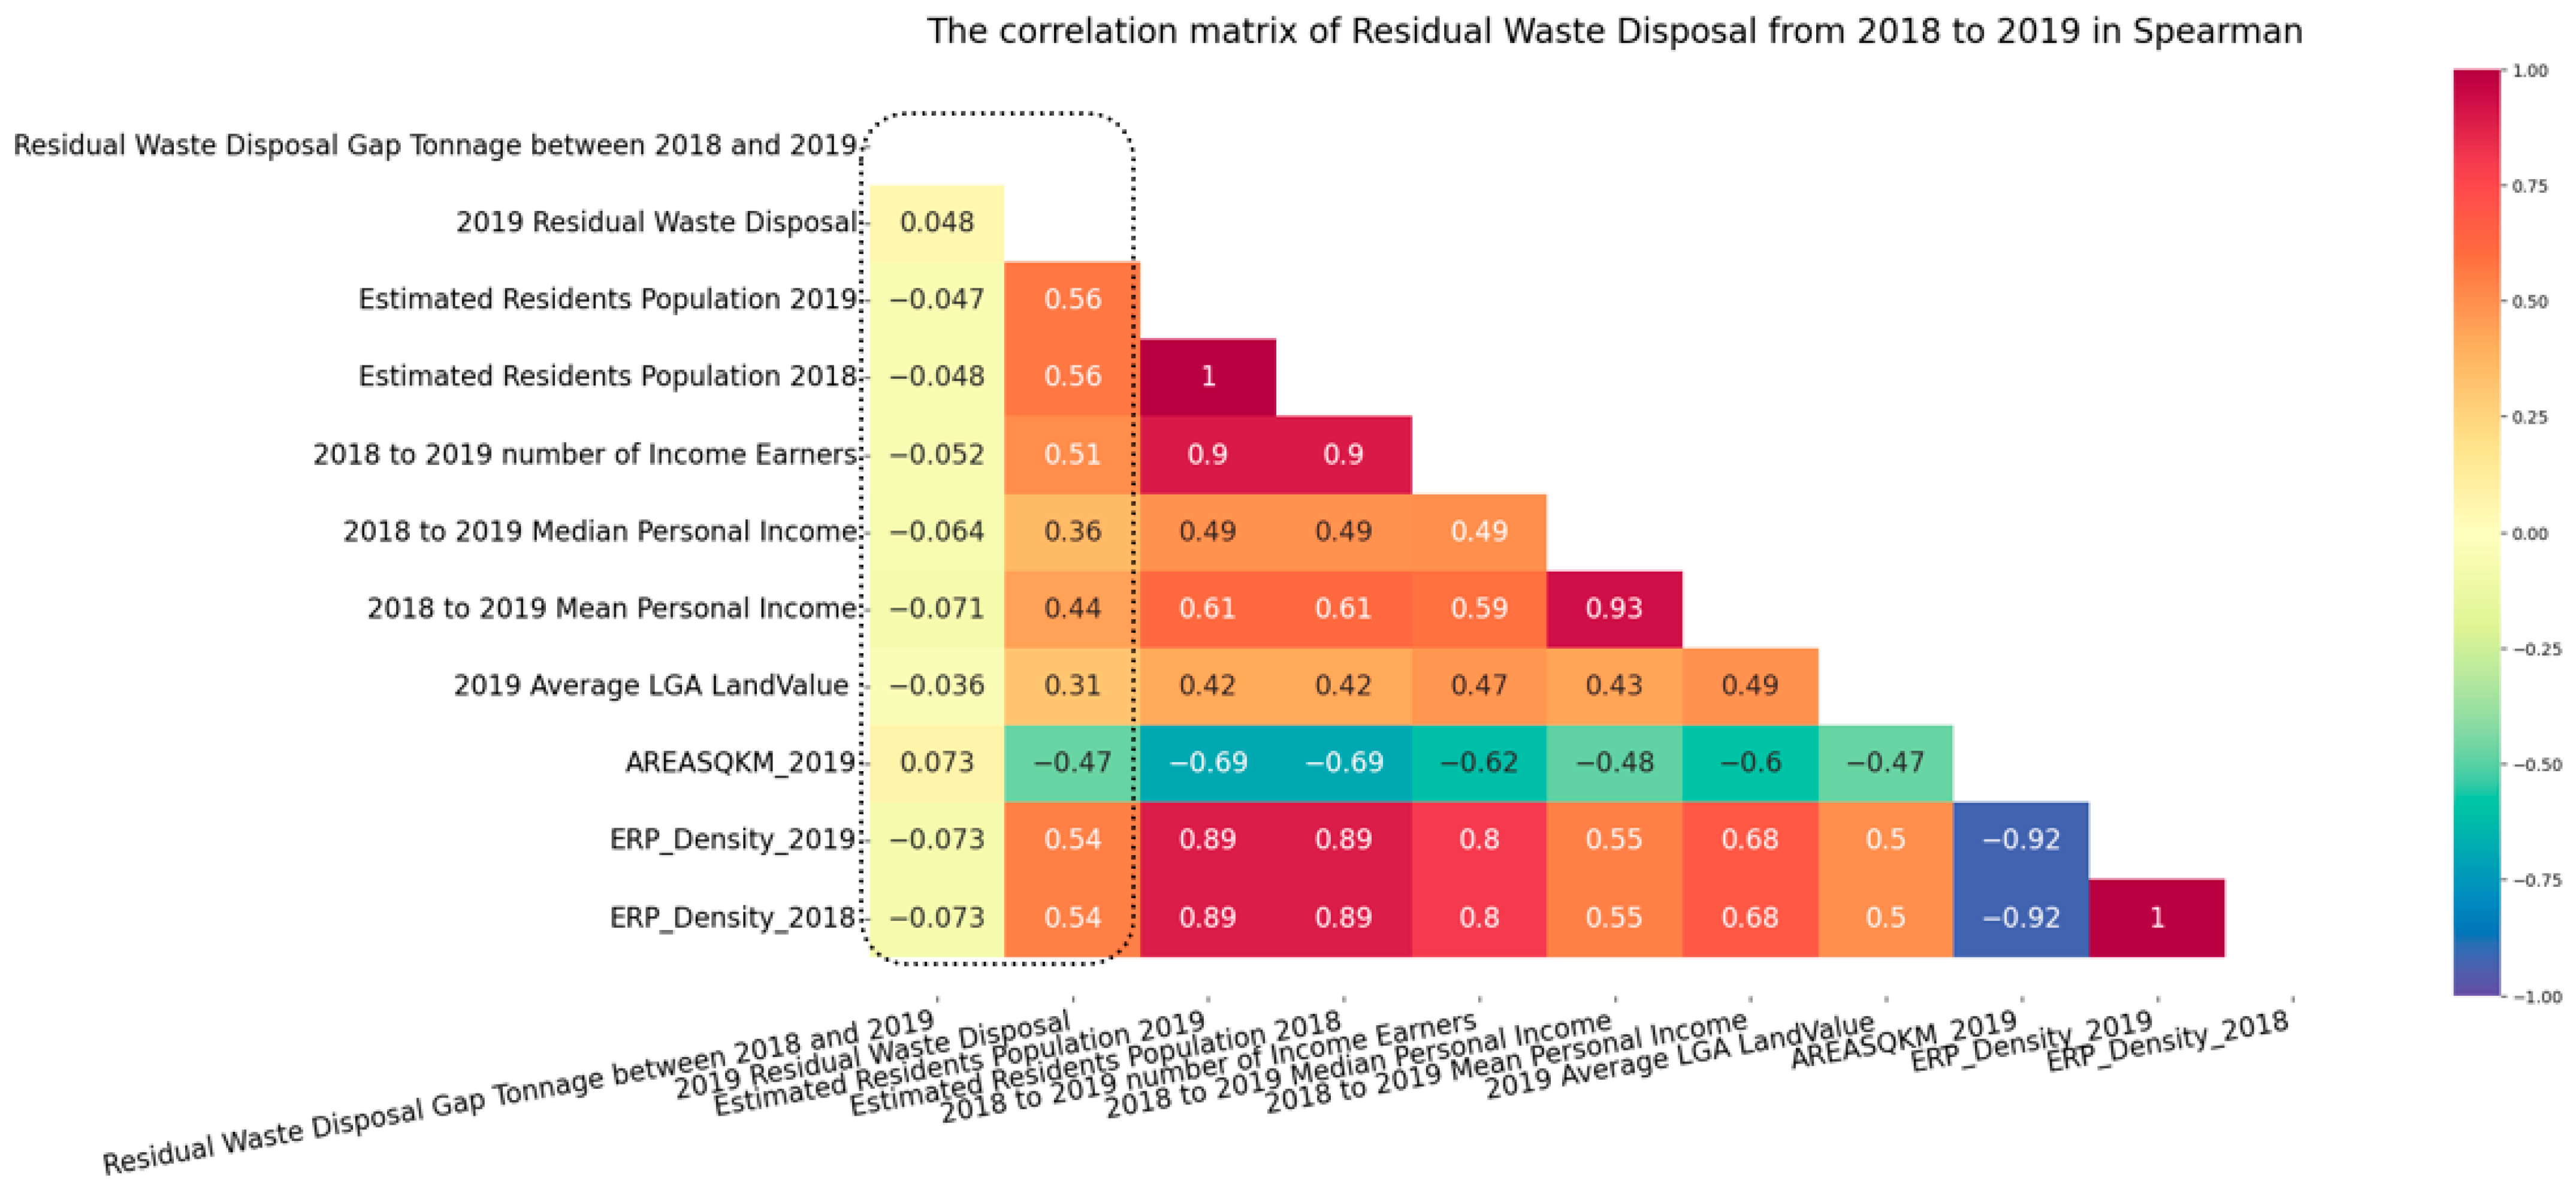
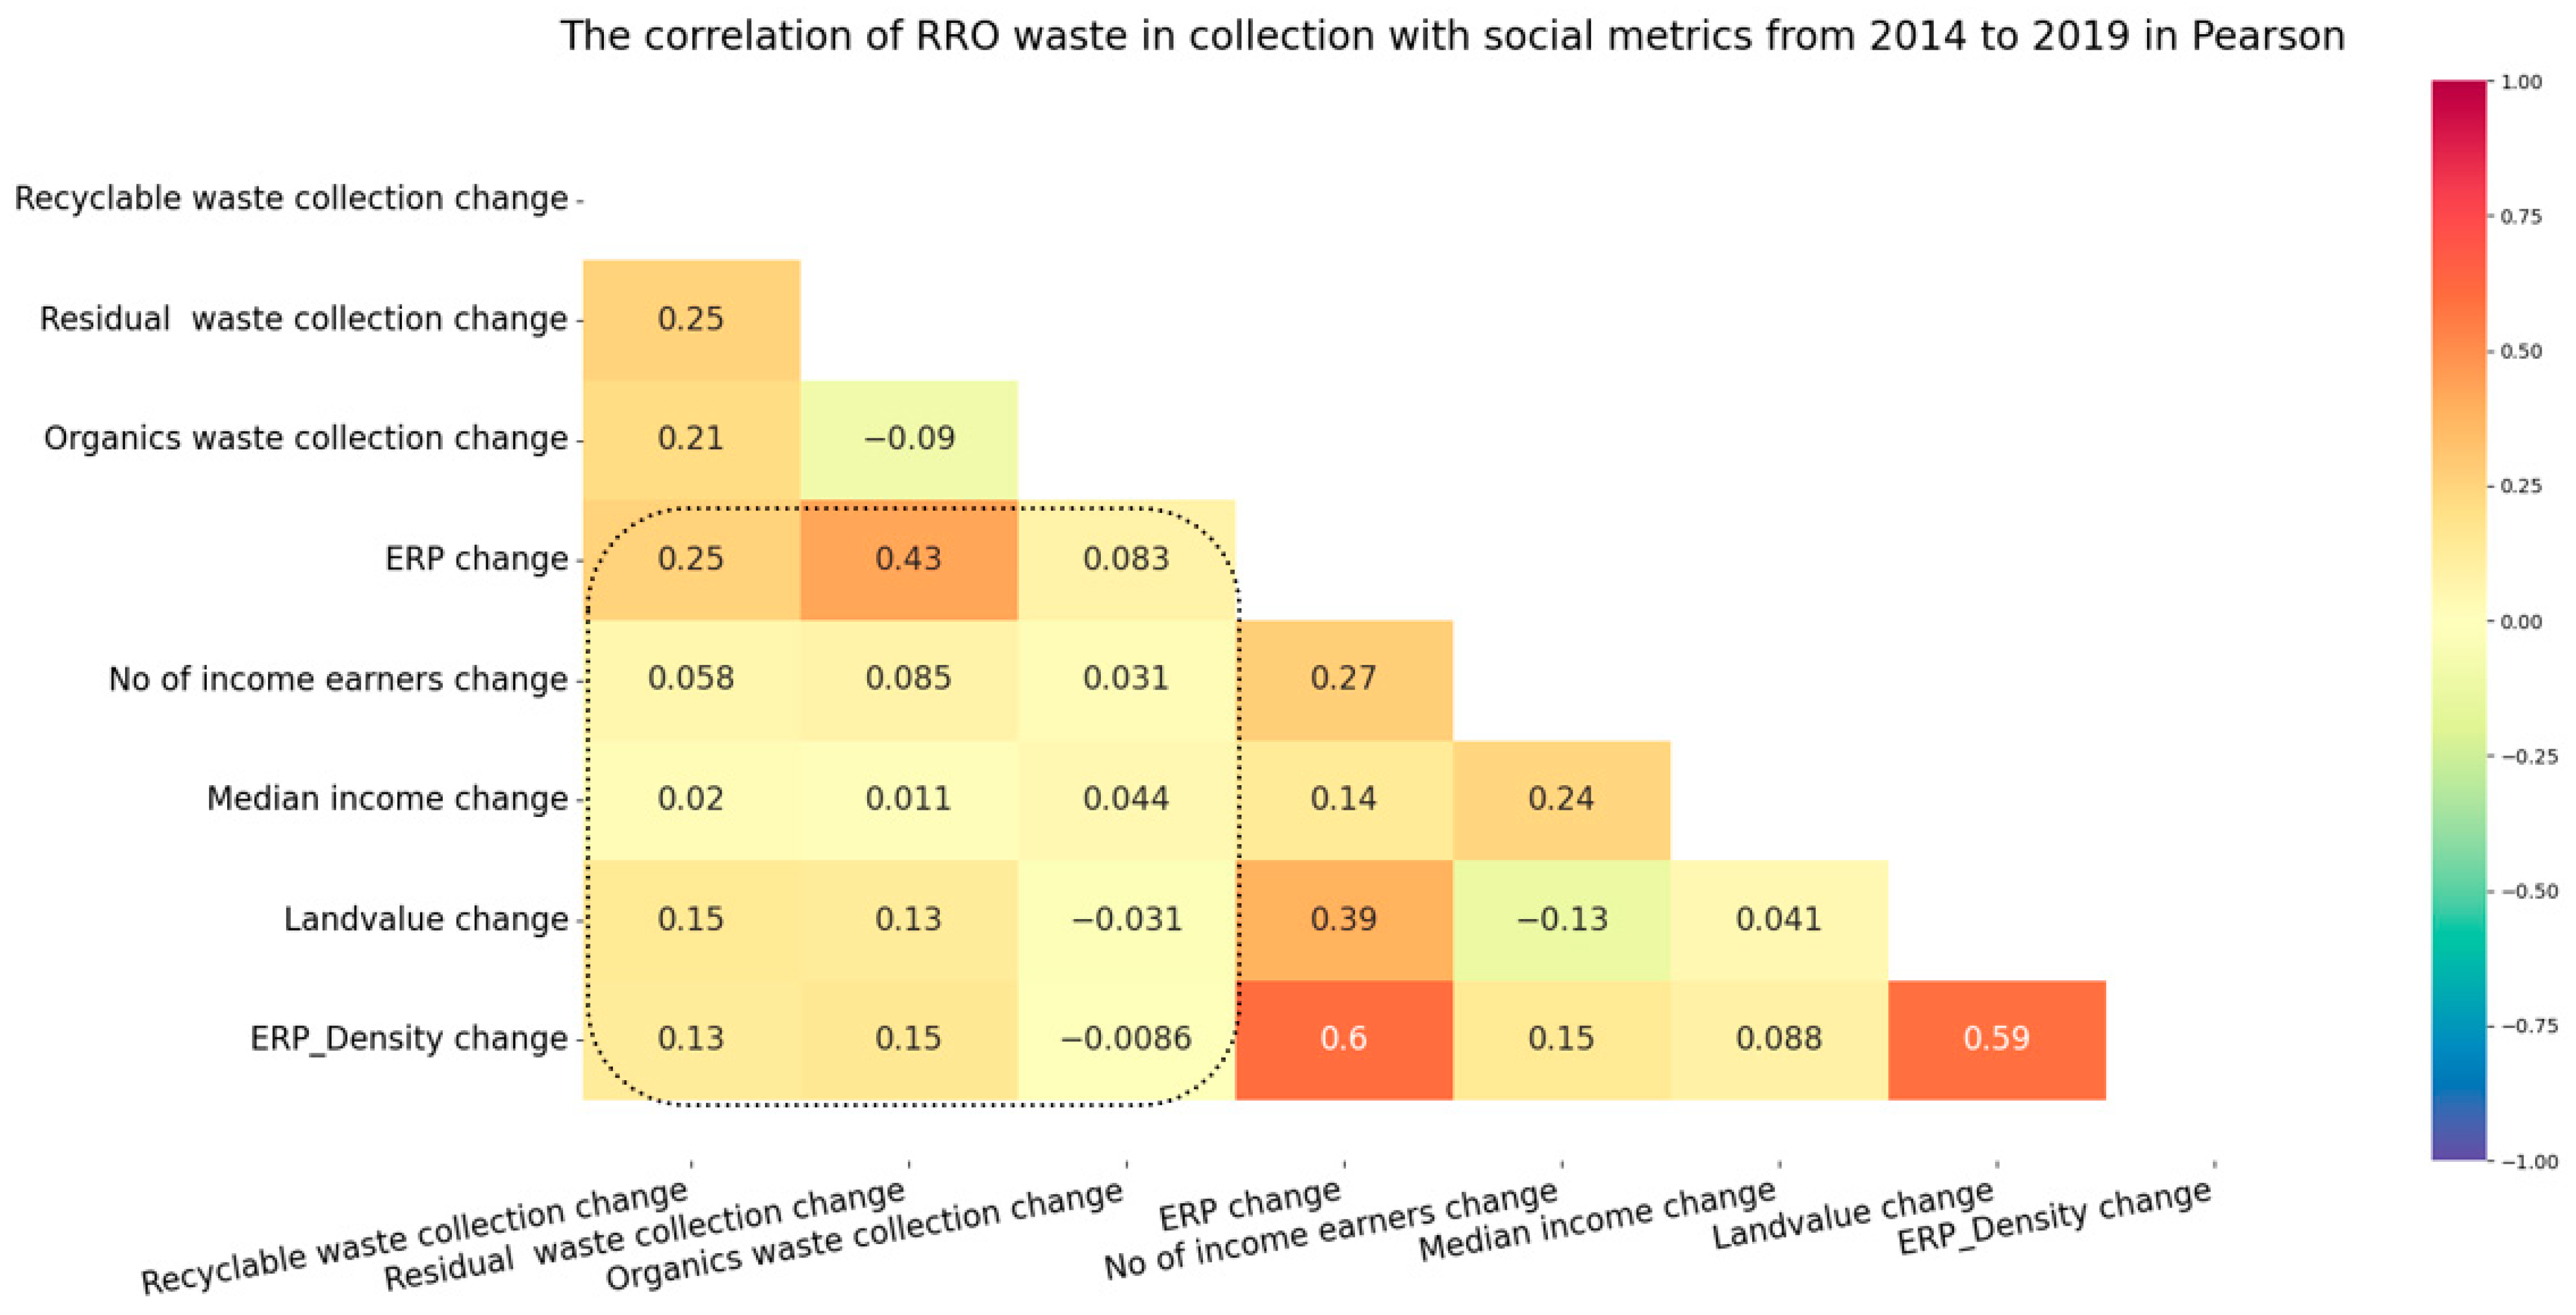
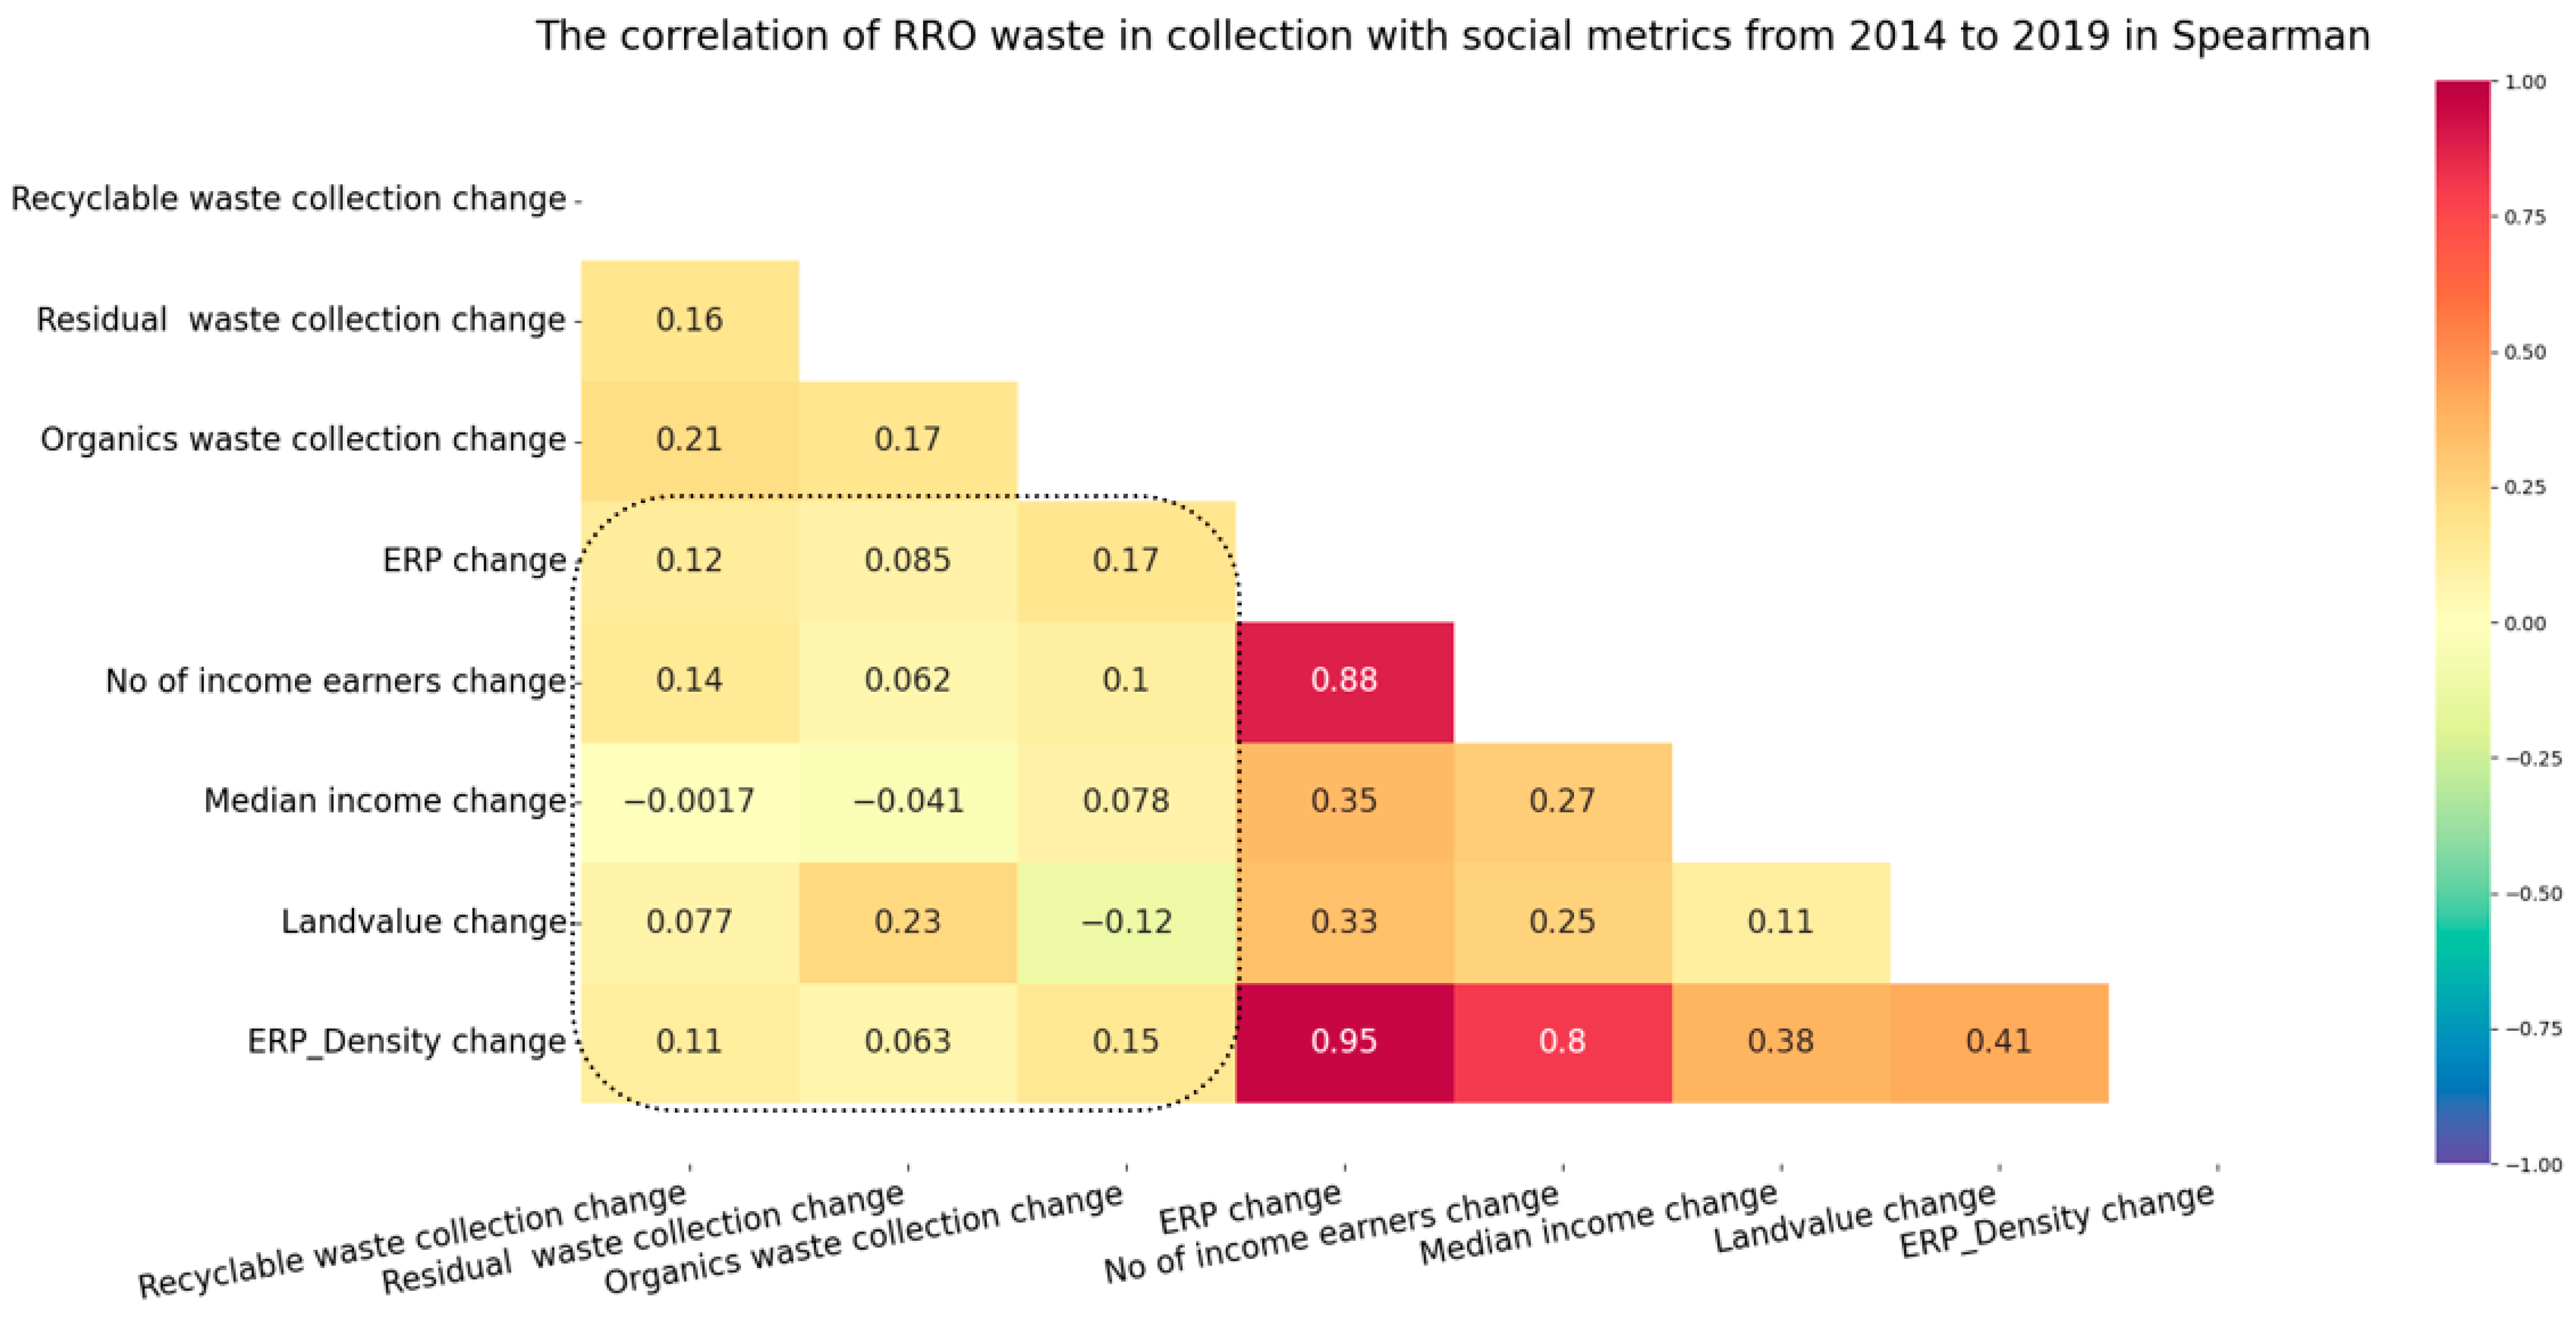
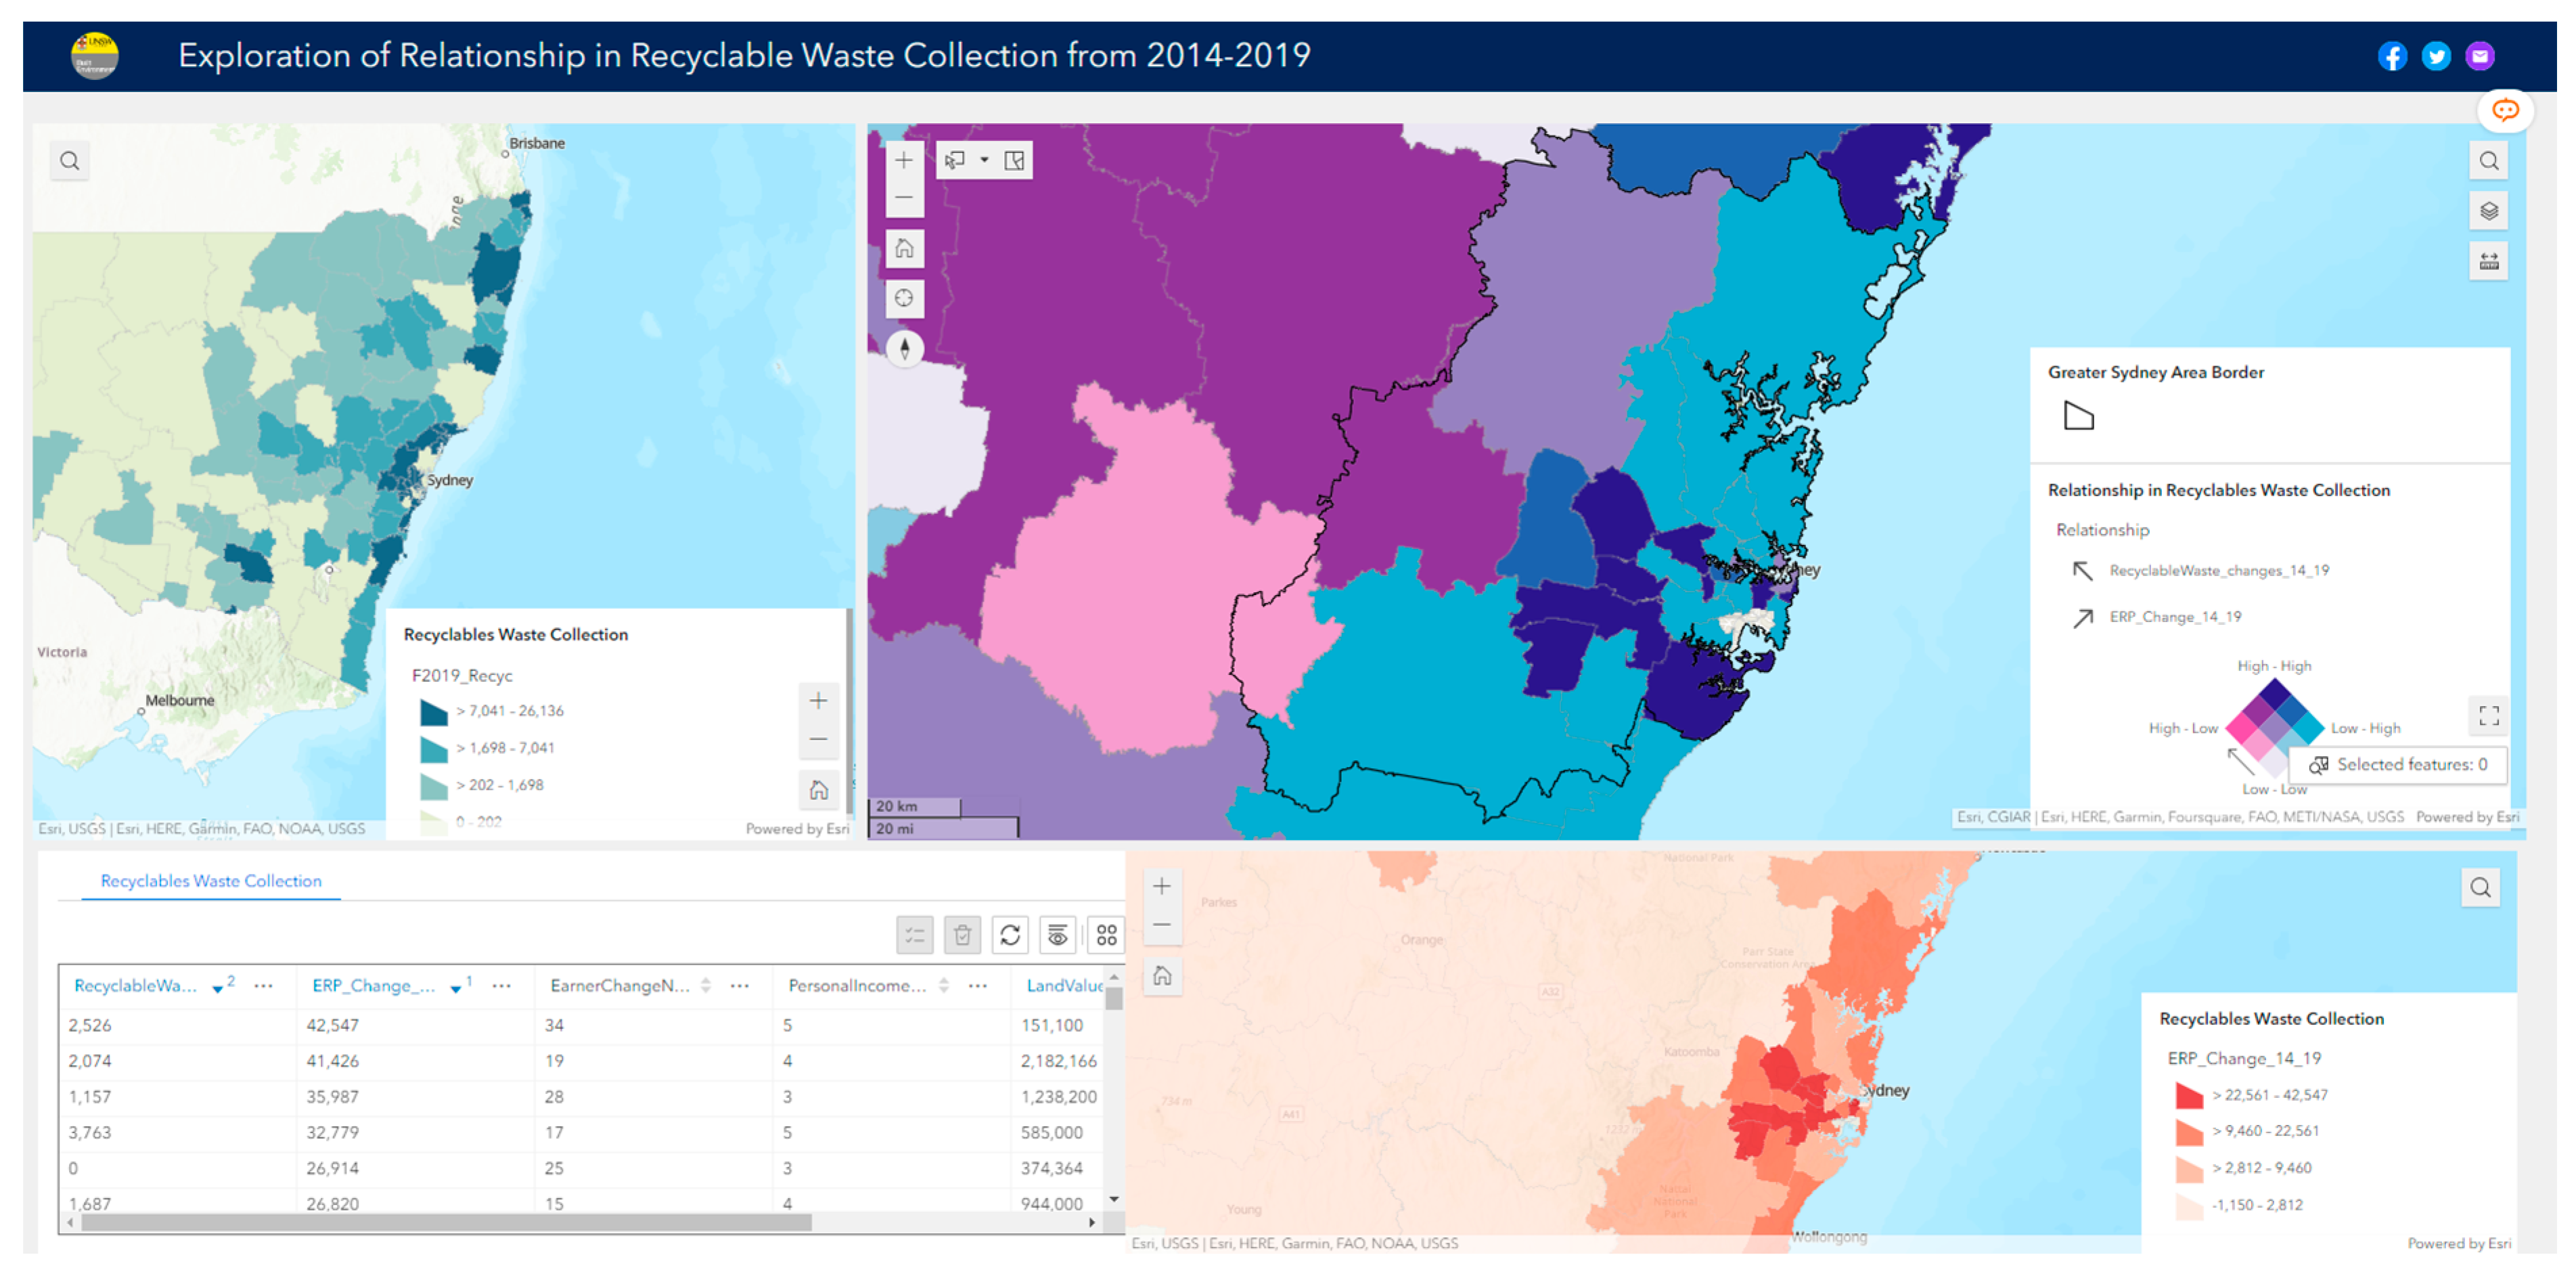
| Name | Dash or Map with ‘Tools’ | 1D/2D/3D 1 + Real-Time/Historical | Limitations and Deficiencies | With Social Metrics |
|---|---|---|---|---|
| Victoria’s waste projection model [38] | Dash, Microsoft Power BI | 2D + Historical | Without spatiotemporal analysis | Yes |
| Victoria’s local government waste data dashboard [39] | Dash, Microsoft Power BI | 2D + Historical | Without spatiotemporal analysis | No |
| Domestic waste and recycling dashboard in WA [40] | Dash, Microsoft Power BI | 1D + Historical | Without spatial analysis | No |
| Smart city waste management with SAP Analytics Cloud [41] | Dash, SAP Analytics and ESRI | 2D + Real-time | Without spatiotemporal analysis | No |
| Map of waste and recycling centres [42] | Map, Google Map | 2D + Historical | Without temporal analysis | No |
| Waste streams (Roboat) [43] | Dash, Mapbox+ OSM | 2D + 3D + Realtime | Without spatiotemporal analysis | No |
| National waste reporting mapping tool [44] | Map, Geoscience Australia tool | 2D + Historical | Without temporal analysis, more qualitative | No |
| Waste and resource recovery data hub—national waste data viewer [16] | Dash, Microsoft Power BI | 2D + Historical | Without spatiotemporal analysis | No |
| August 2022 waste metrics dashboard [45] | Dash, report PDF | 2D + Historical | With spatiotemporal analysis, but display without interactivities | No |
| NSW Jobs and Businesses In waste management and recycling [46] | Dash, Flourish Studio | 2D + Historical | Without temporal analysis | Yes |
| Zero waste data dashboard [47] | Dash, Microsoft Power BI | 1D + Historical | Without spatial analysis | No |
| Solid waste tonnage dashboard [48] | Dash, Microsoft Power BI | 1D + Historical | Without spatial analysis | No |
| Name | Format | Data Source | Location Information in the Dataset | Temporal Information in a Period |
|---|---|---|---|---|
| Local council waste and resource recovery data 1* | XLSX | Environmental Protection Authority of NSW | Polygon-LGA | 2014–2019 |
| Land values | XLSX | NSW Spatial Services | Point-Suburb | 1996–2021 |
| Estimated resident population (ERP) | CSV/XLSX | Australian Bureau of Statistics (ABS) | Polygon-LGA | 2001–2021 |
| The personal income and number of earners | CSV/XLSX | ABS Income (Including government allowances), LGAs, 2014–2019 | Polygon-LGA | 2014–2019 |
| ERP density 2* | CSV/XLSX | ABS | Polygon-LGA | 2001–2021 |
| Research Objectives | Data | Methods and Tools |
|---|---|---|
| Analyse the variance of waste-related social metrics and RRO waste between 2014 and 2020 by location at the LGA level. | Residual, organic, recyclable | Thematic mapping (Jenks natural break) |
| Identify the spatial relationship between the level of IEPLD, and the amount of produced waste in the three types of RRO waste. | Residual, organic, recyclable | Relationship map (Quantile breaks), Pearson correlation, Spearman correlation |
| Develop a dashboard with visualization, cross-interactive maps, and insights from waste stream data. | Personal income, number of income earners, land values, ERP, ERP density, residual, organic, and recyclable. | ArcGIS experience builder |
| Figure Number/Metrics | Number of Neighbourhoods | The List of LGAs with Special Features |
|---|---|---|
| Figure 5a, Residual waste collection | Second shaded: 10 | The second top shaded group: Wollondilly, Camden, Liverpool, Penrith, Liverpool, Fairfield, Parramatta, and Ryde, City of Sydney. |
| Figure 5b ERP changes | Top shaded: 7 | Top shaded group: Camden, Liverpool, Canterbury–Bankstown, Cumberland, Blacktown, Parramatta, Sydney. |
| Figure 5c Number of earners’ change | Top shaded: 4 | Top shaded group LGAs: Sydney, Canterbury–Bankstown, Parramatta, and Blacktown. |
| Figure 5d Population density change (ERP density) | Top shaded: 1 Second shaded: 12 | Top shaded: Sydney The second shaded: North Sydney, Burwood, Strathfield, Land Cove, Parramatta, Inner West, Ryde, Canada Bay, Waverley, Cumberland, Willoughby, Randwick. |
| Figure 5e Land values change | Top shaded: 1 | Top shaded group: Sydney |
| Figure 5f Median personal income change | Top shaded: 22 Second shaded: 2 | Top shaded group: Blue Mountains and Hawkesbury, and Wollondilly, Penrith, Blacktown, Camden, Campbelltown, Penrith, Central Coast, and others. The second shaded group: Sydney and Parramatta. |
| Figure Number | Range/Special Features | Number of Neighbourhoods | LGAs |
|---|---|---|---|
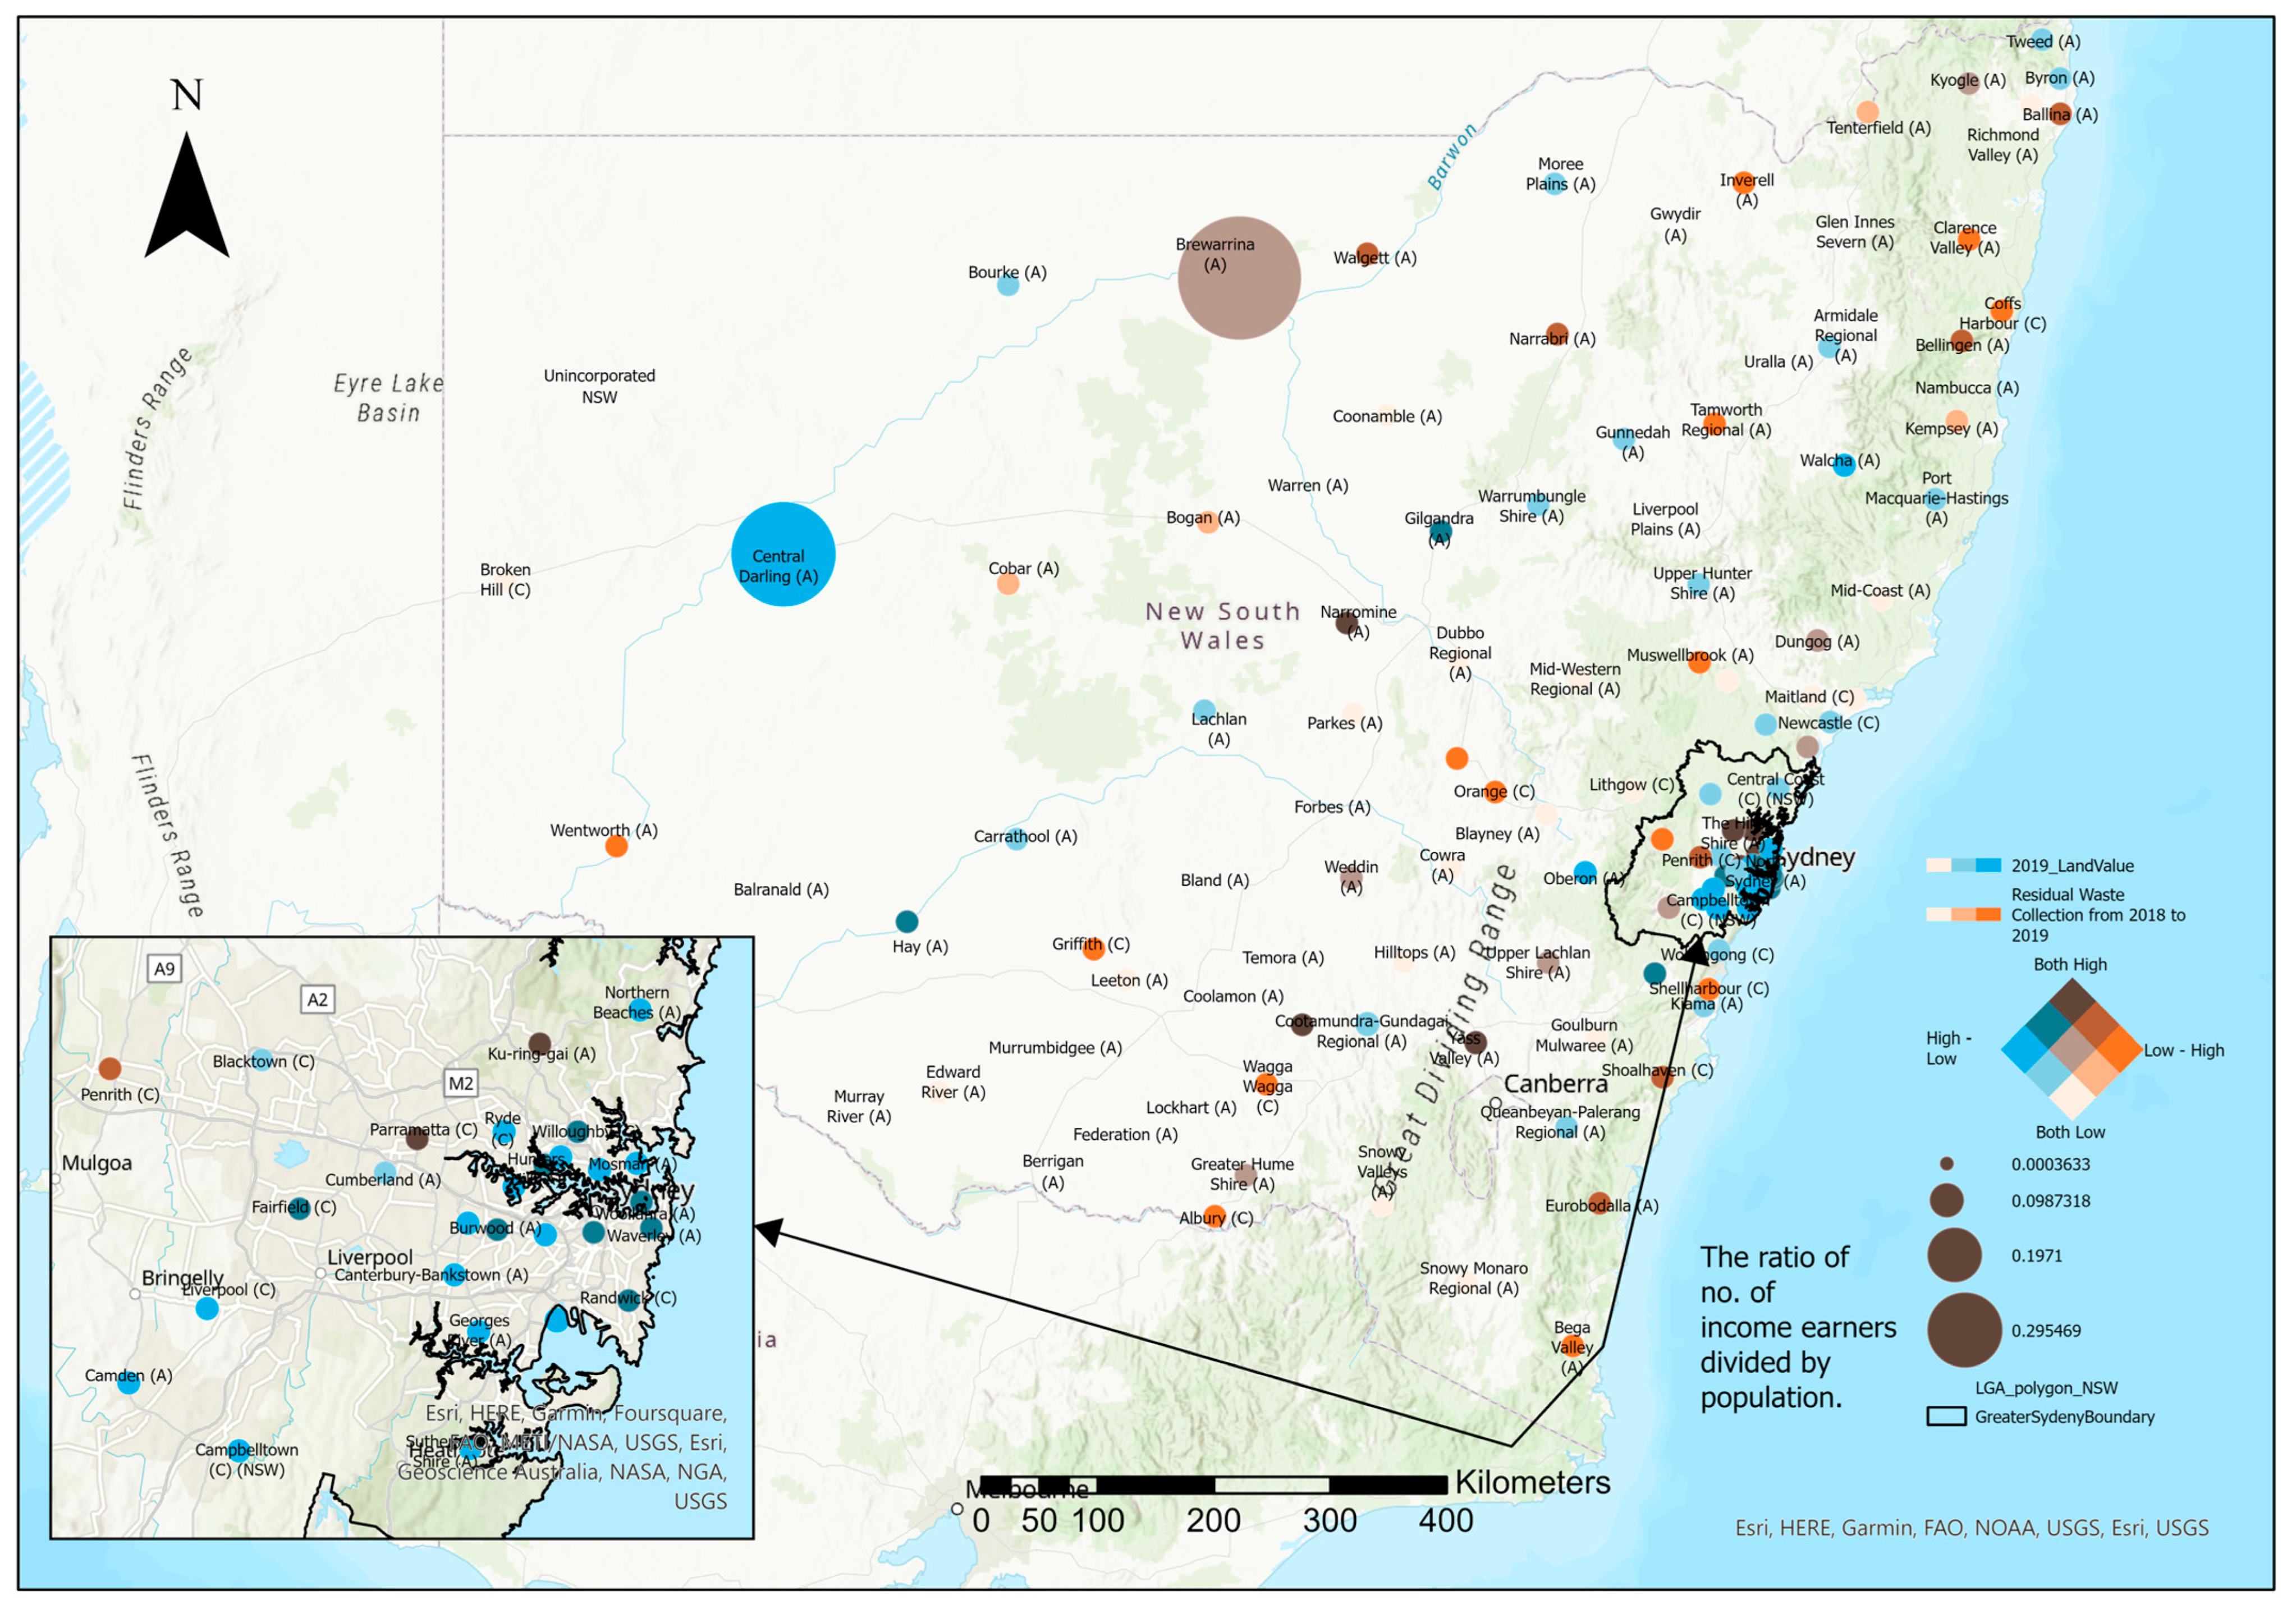
| Figure 6 | Greater Sydney/significant ratio of the number of income earners to residents | 8 (Greater Sydney) + 2 (Regional NSW) | Greater Sydney: Wingecarribee, Camden, Liverpool, Fairfield, The Hills Shire, Hornsby, Ku-ring-gai, and Ryde Regional NSW: Central Darling and Brewarrina |
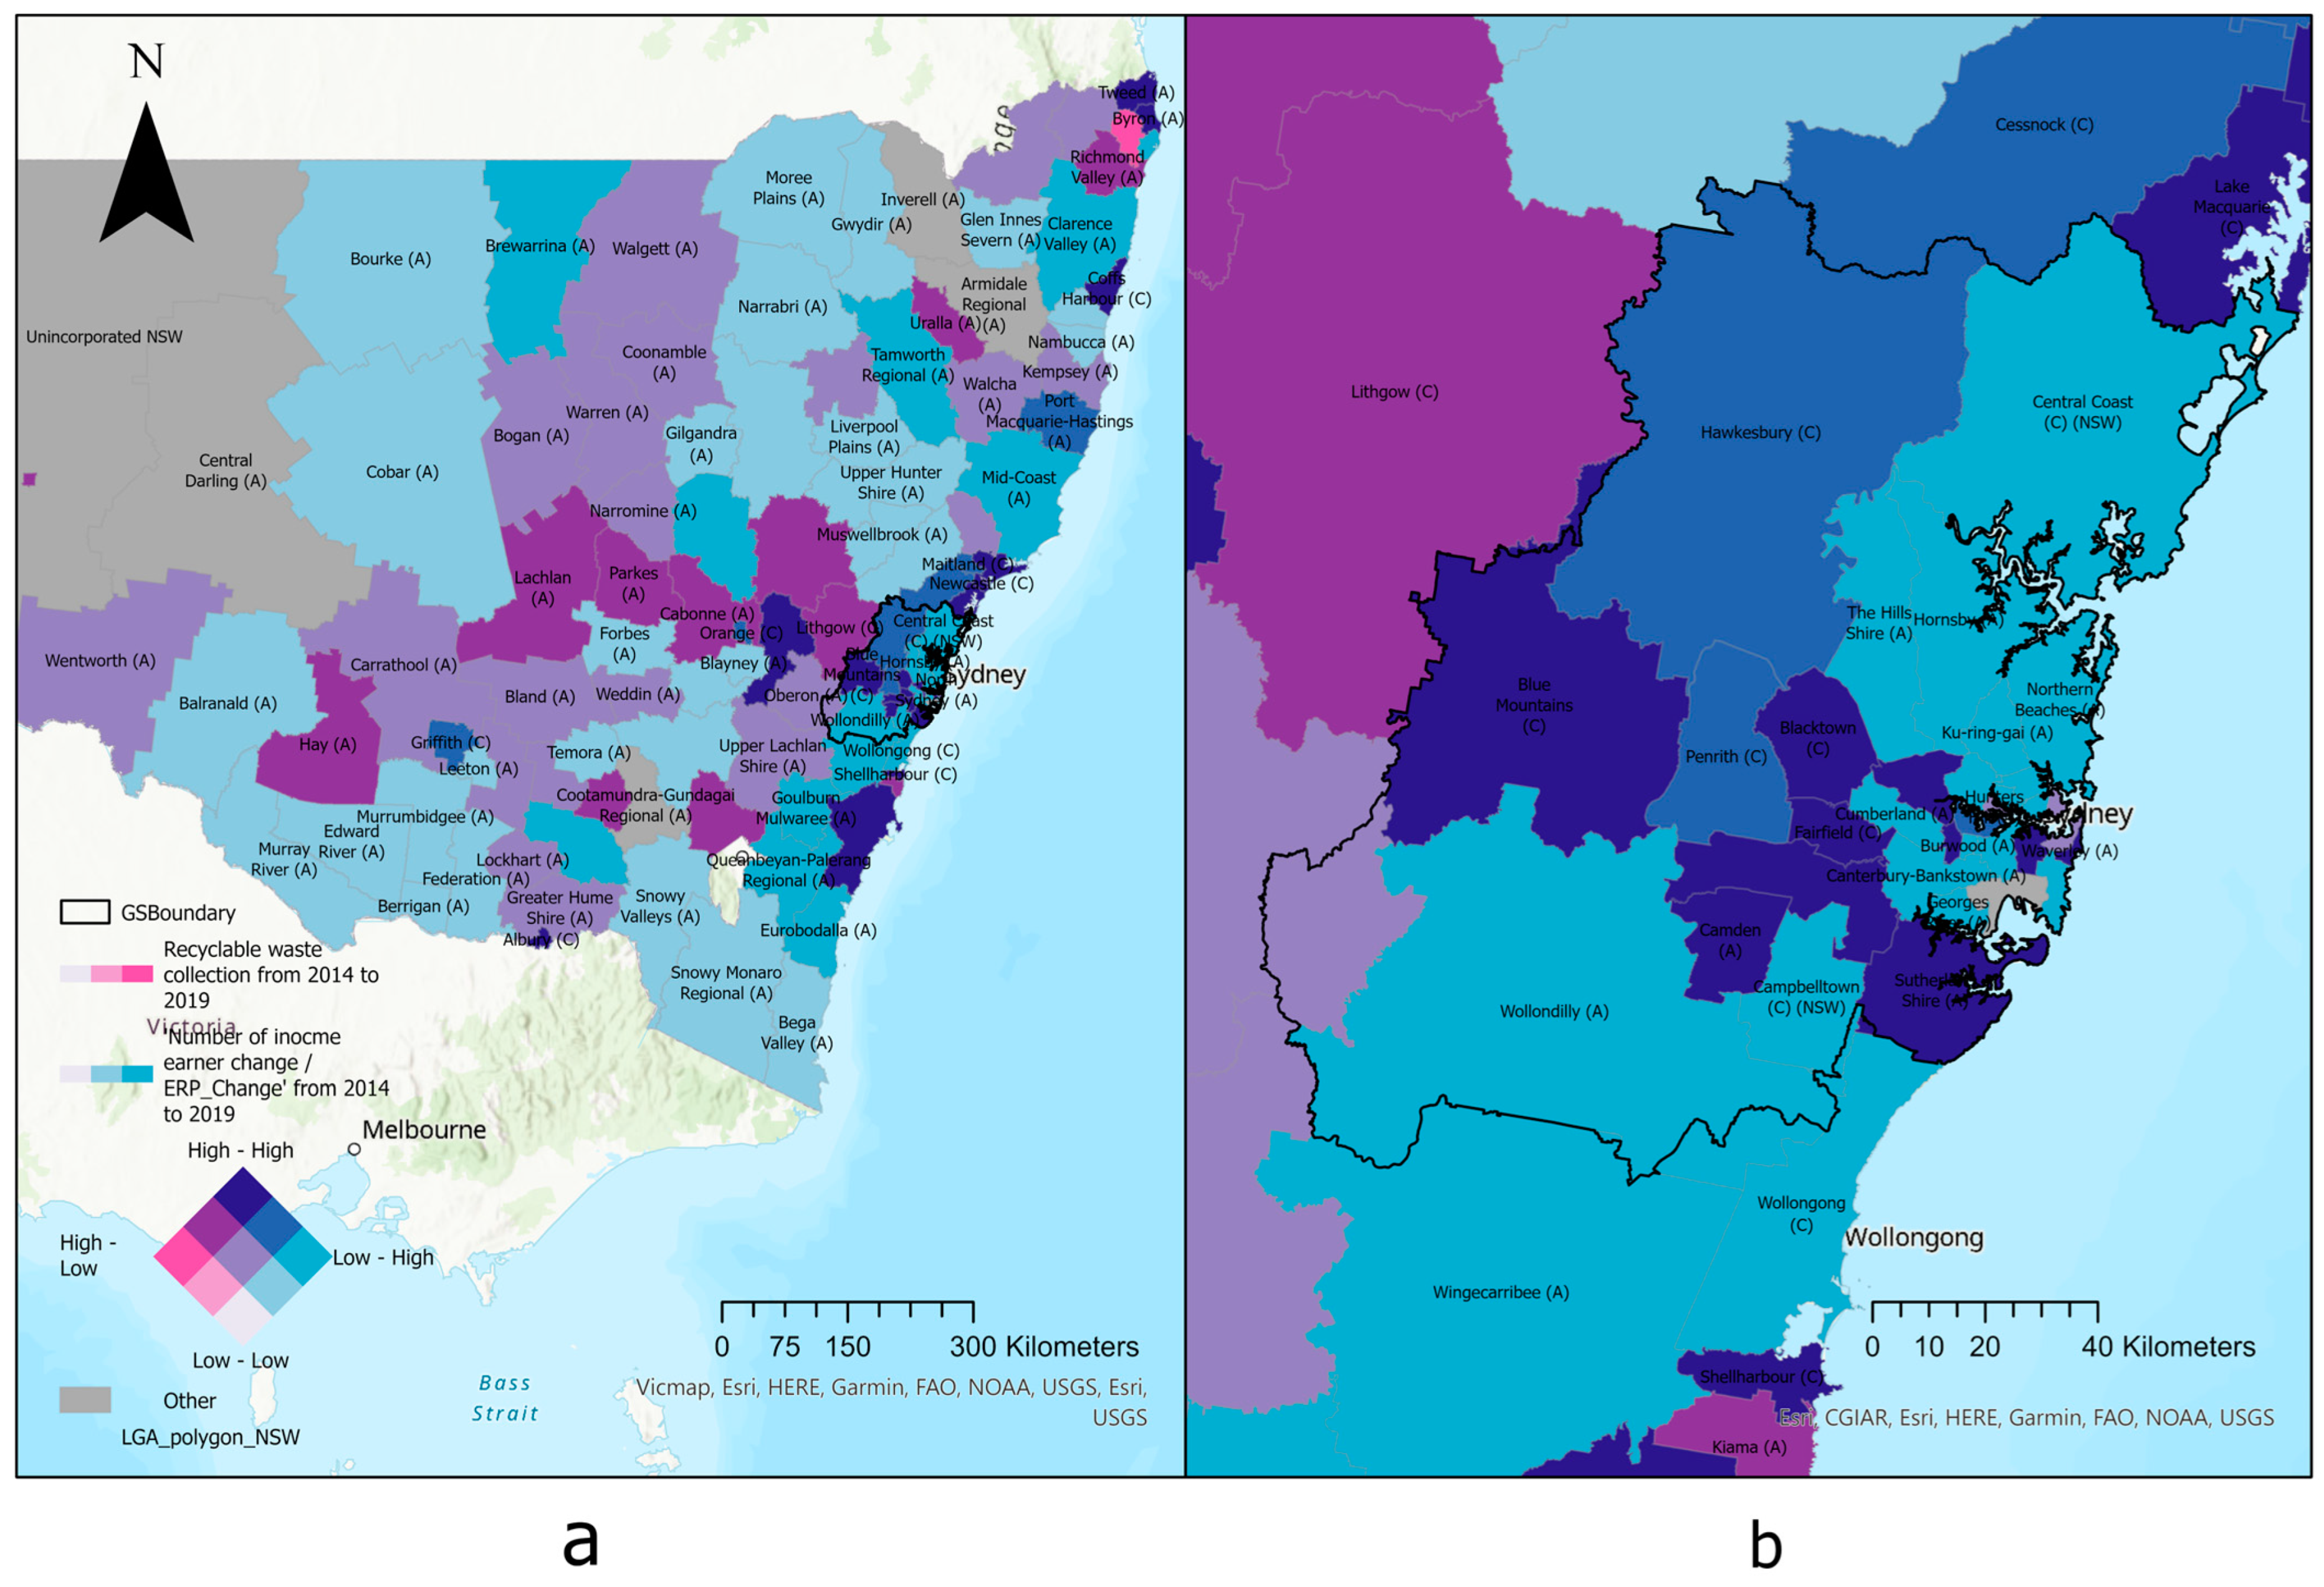
| Figure 7a,b | High-High areas: Significant top-shaded areas, showing a positive correlation with high significance, located in areas among tonnage change in recyclable waste collection and change in number of income earners divided by change in ERP | 10 (Greater Sydney) 8 (Regional NSW) | Greater Sydney: Blue Mountains, Blacktown, Parramatta, Strathfield, Sydney, Waverley, Fairfield, Liverpool, Camden, and Sutherland Shire. Regional NSW: Shoalhaven, Bathurst Regional, Lake Macquarie, Newcastle, Port Stephen, Coffs Harbour, Byron, and Tweed. |
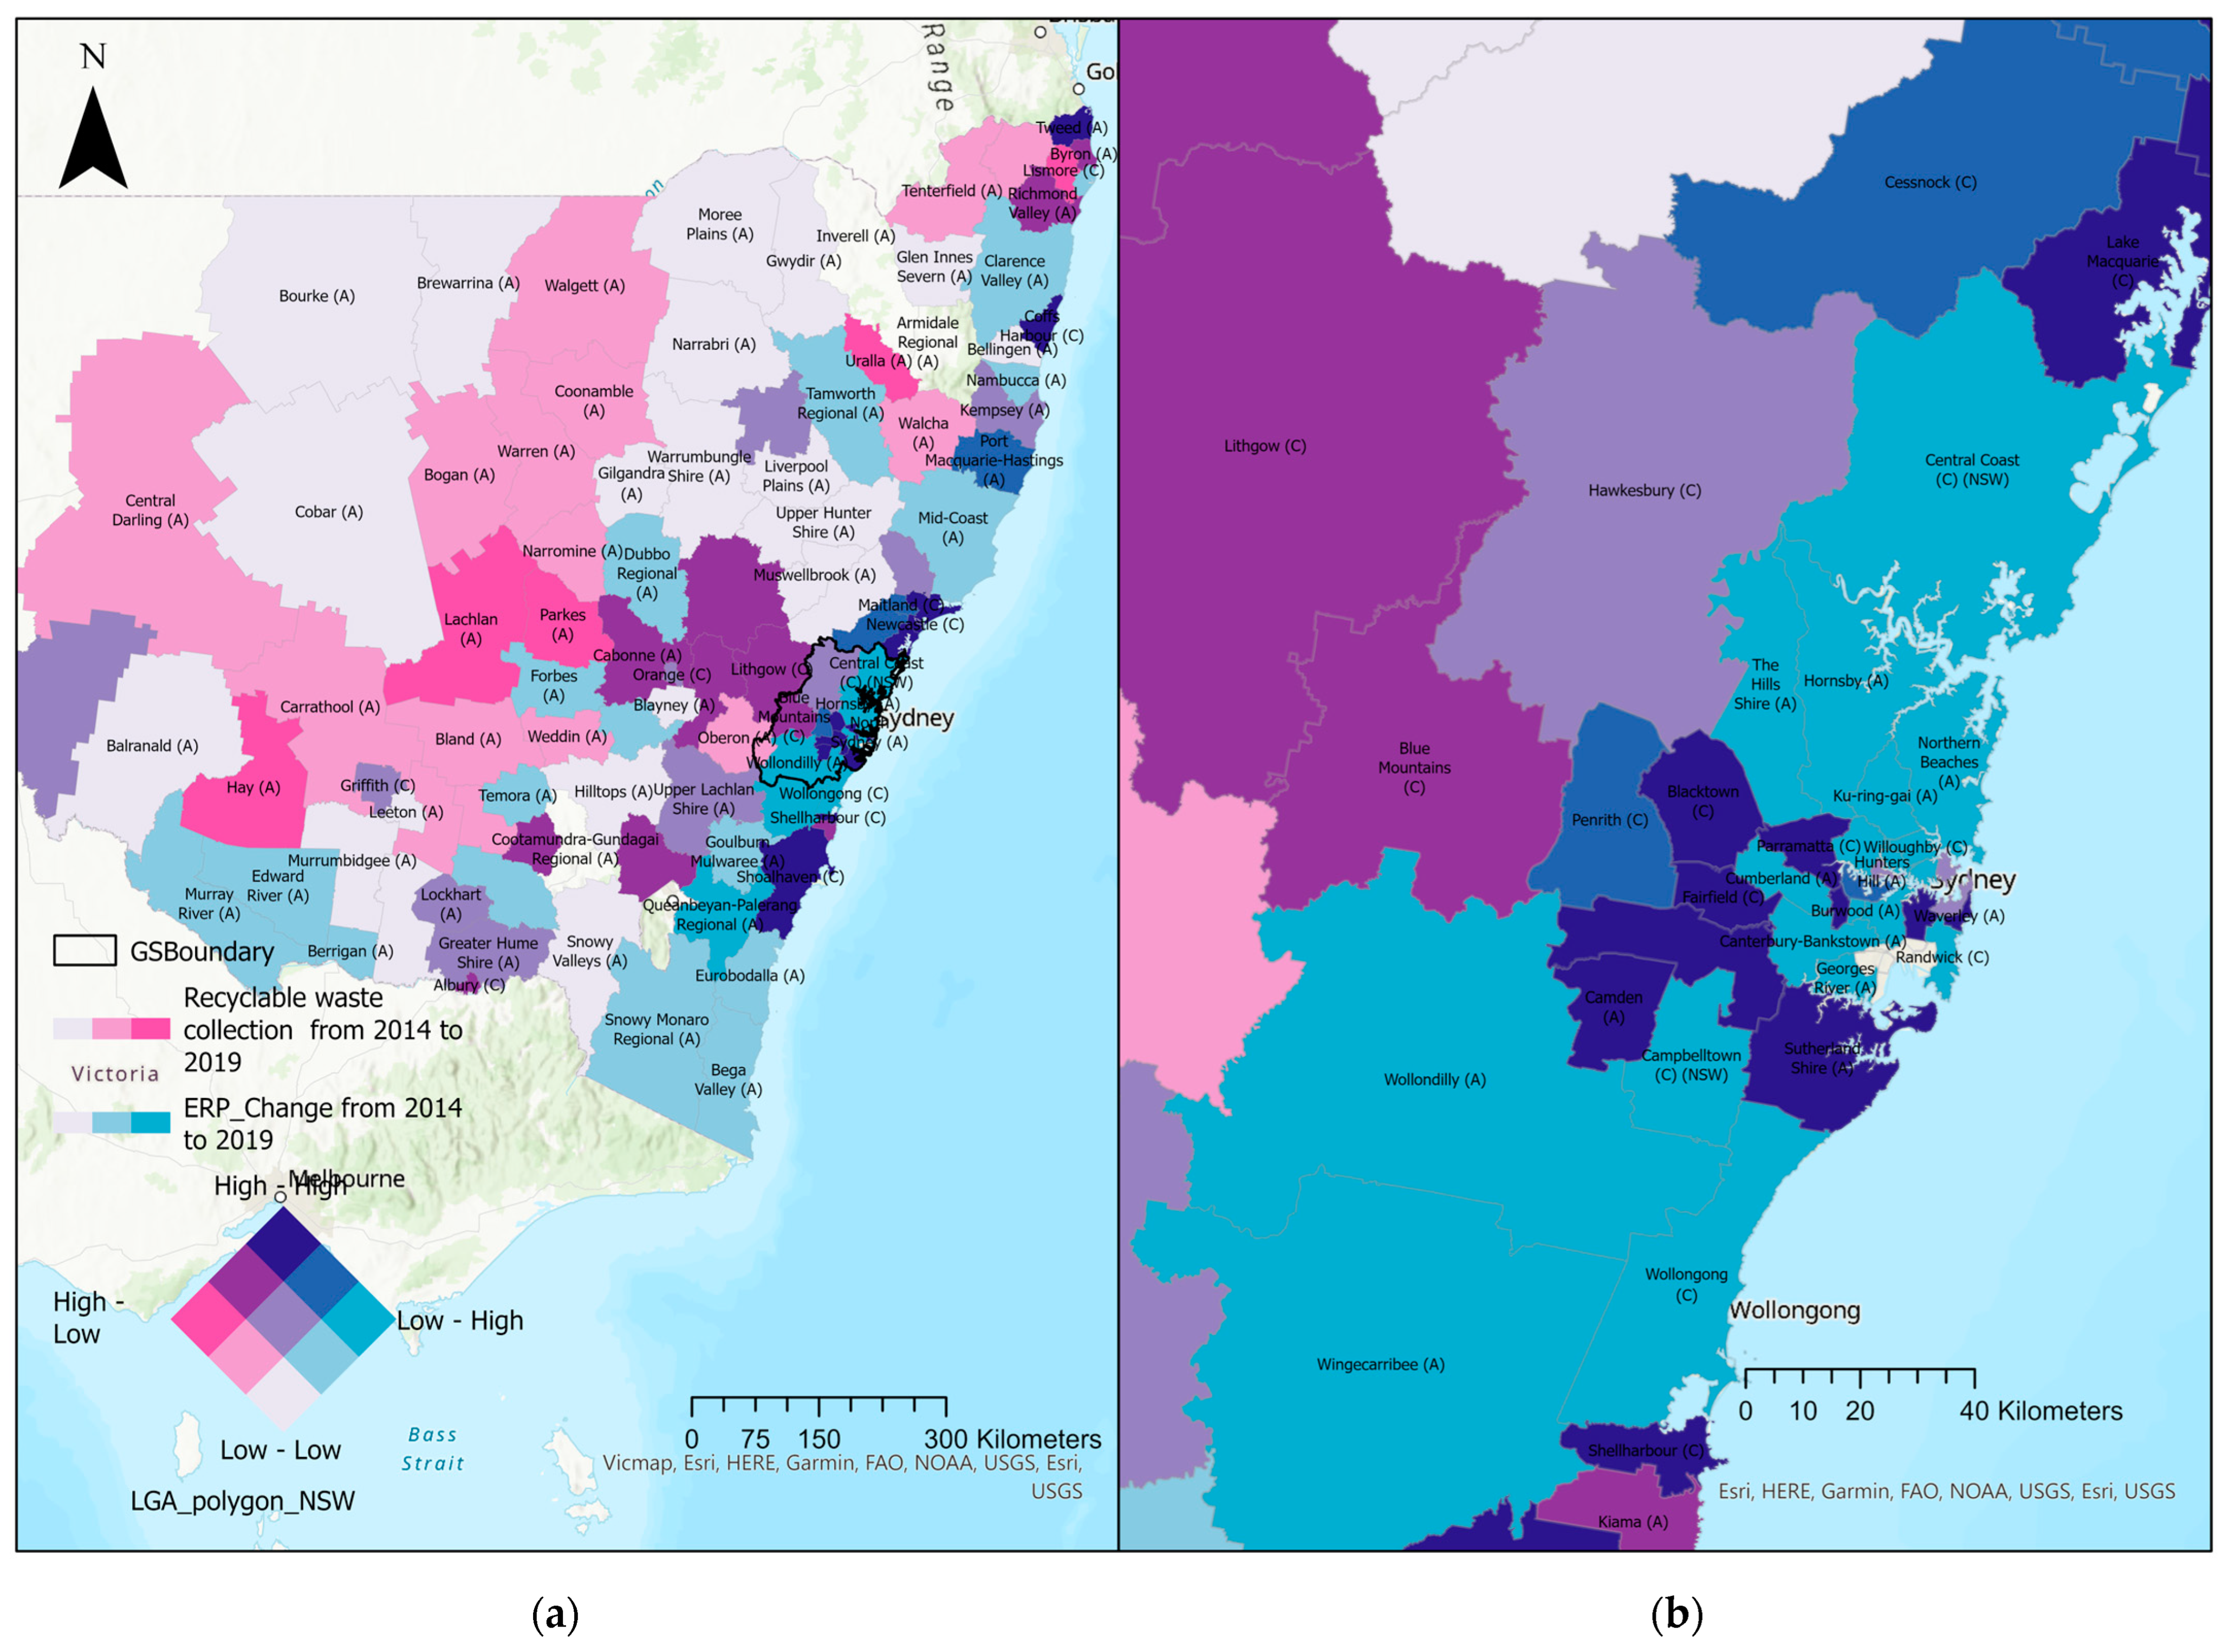
| Figure 8a,b | High-High areas: Significant top shaded areas, positive correlation with high significance located in areas among recyclable waste collection and ERP changes | 9 (Greater Sydney) 7 (Regional NSW) | Regional NSW: Shoalhaven, Shellharbour, Port Stephens, Lake Macquarie, Newcastle, Coffs Harbour, and Tweed. Greater Sydney: Sutherland Shire, Liverpool, Camden, Fairfield, Blacktown, Parramatta, Strathfield, Sydney, and Waverley. |
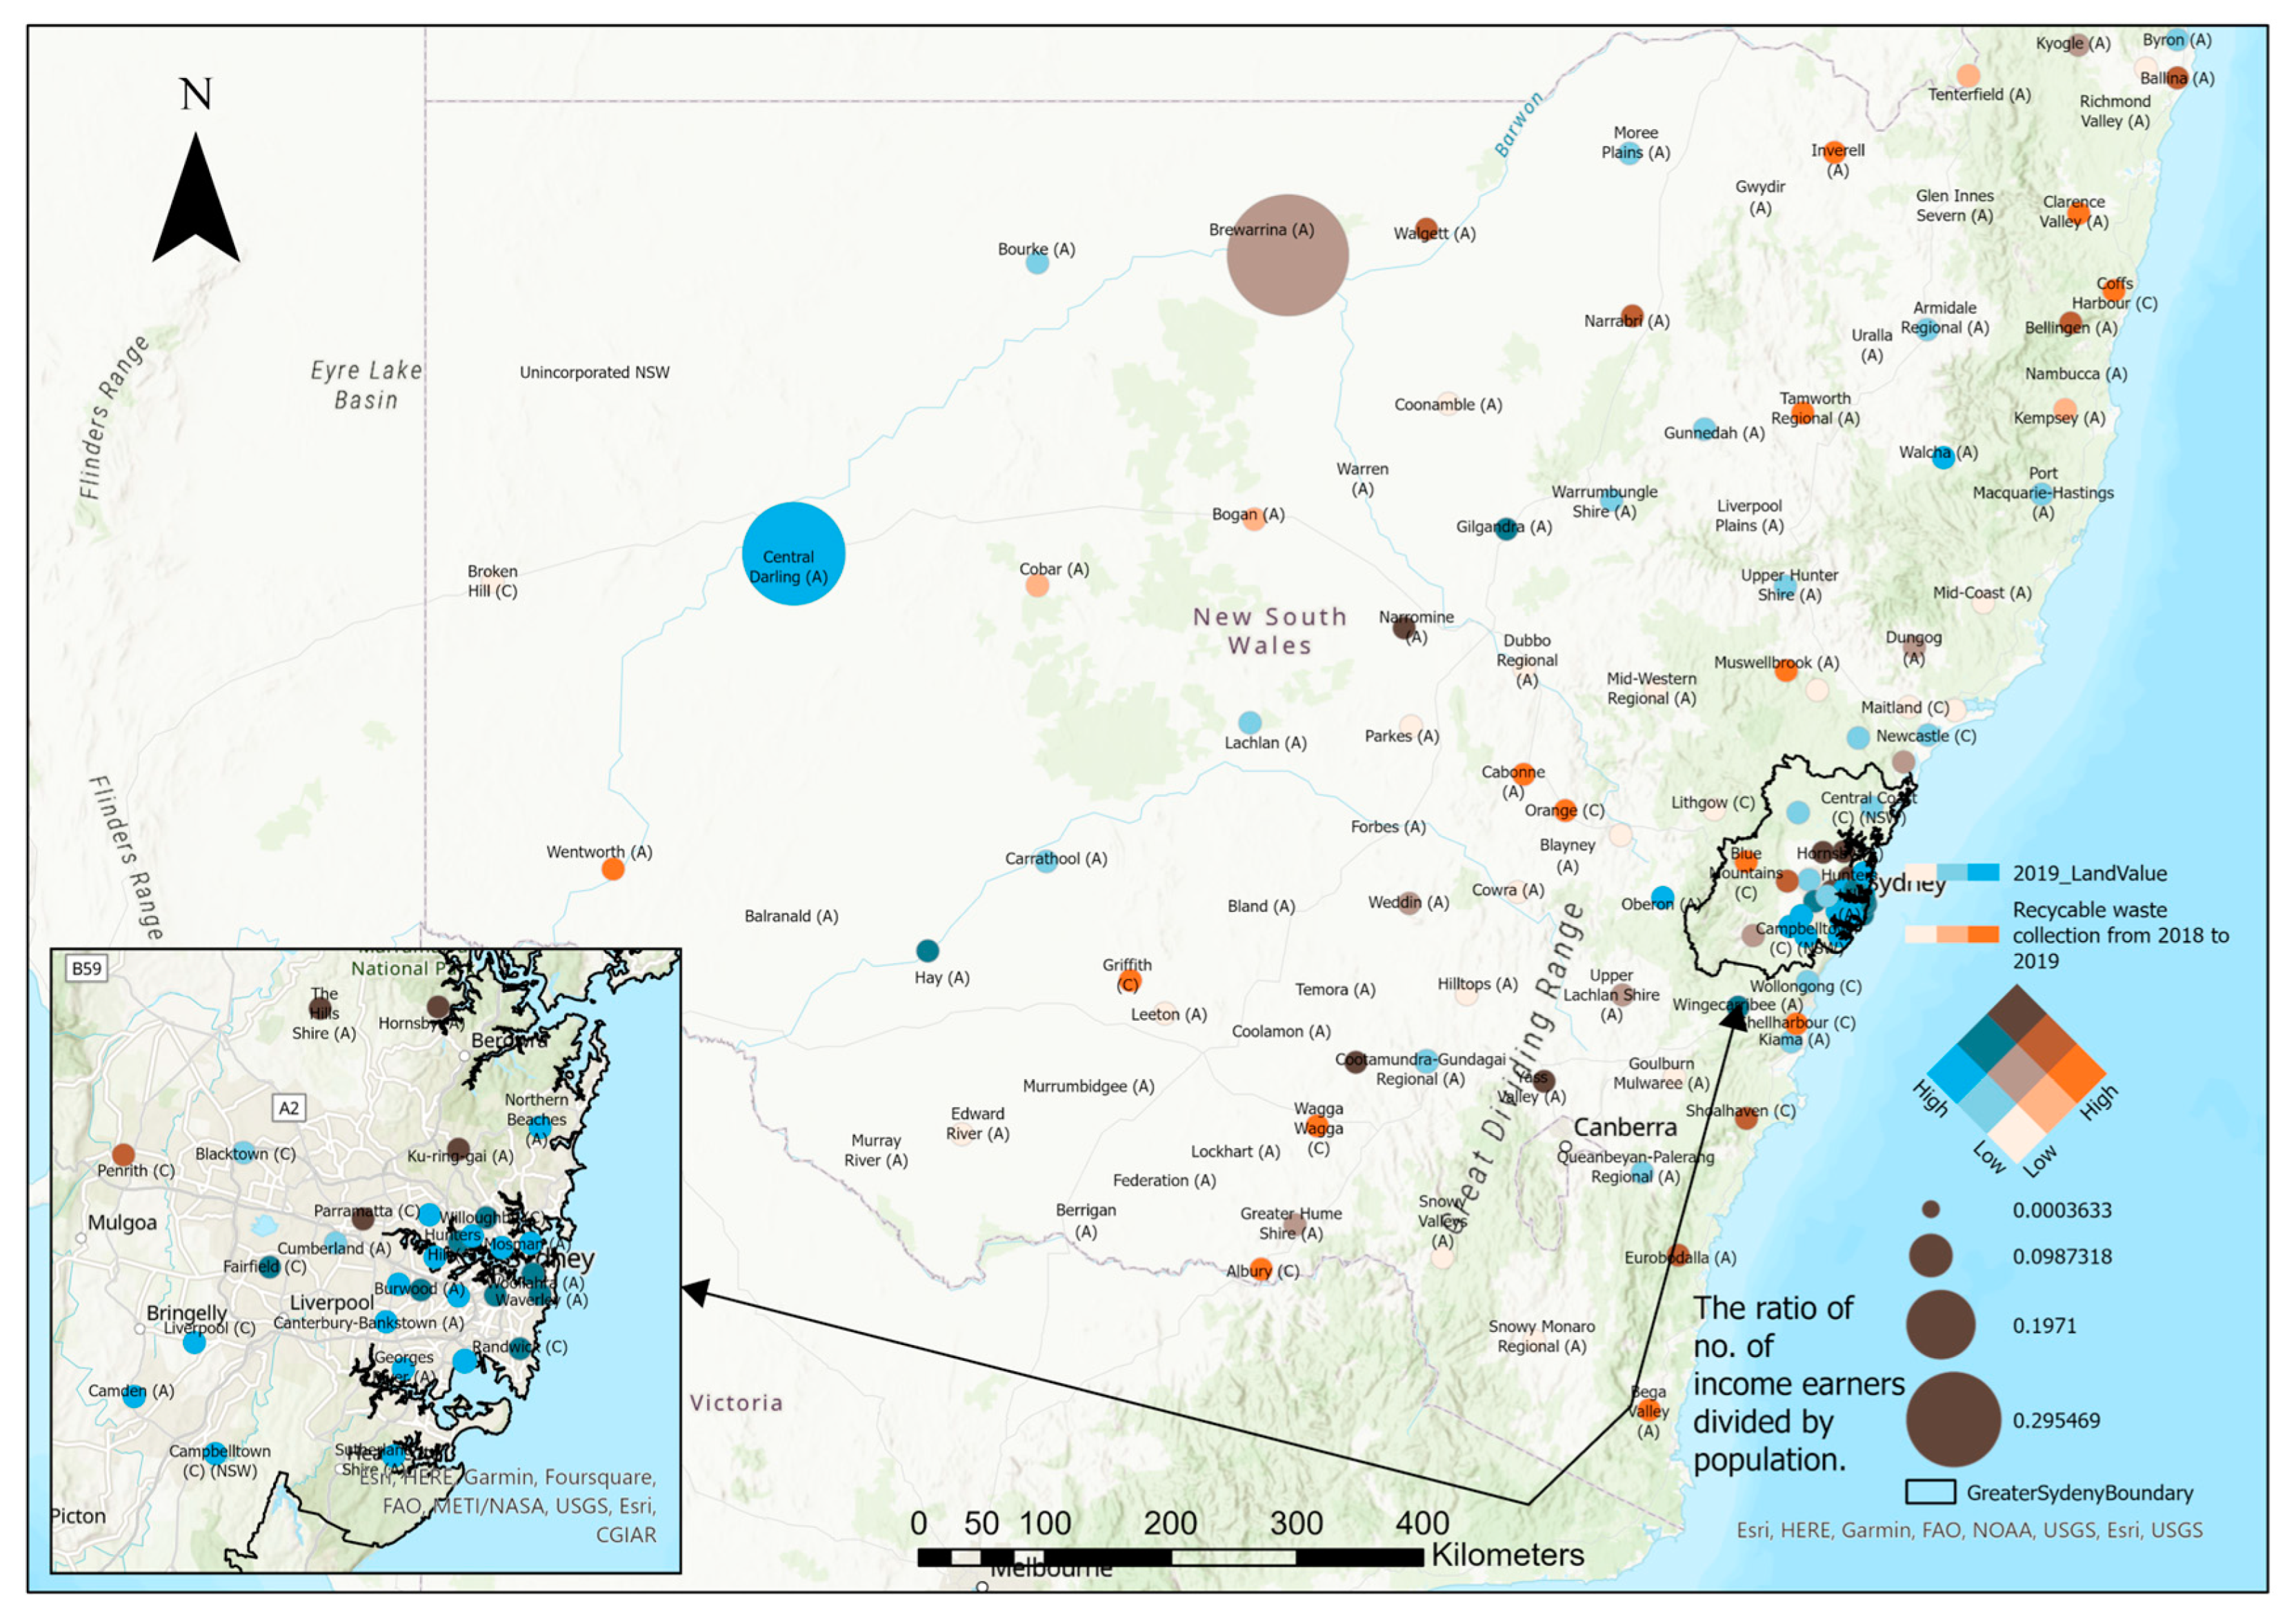
| Figure 9 | A positive correlation between land value, number of income earners and residential waste | 6 | Parramatta. Ku-ring-gai, Hornsby, Narromine, Junee, Yass Valley |
| Figure 10a,b | A positive correlation with the ratio among number of income earners and ERP (population) in NSW. Greater Sydney: higher employment rates (number of income earners/population) and high awareness of residual waste behaviour | 14 (Greater Sydney) 6 (Regional NSW) | Greater Sydney: Wollondilly, Penrith, Canada Bay, Ryde, North Sydney, Blue Mountains, Blacktown, Parramatta, Strathfield, Sydney, Fairfield, Liverpool, Camden, Sutherland Shire Regional NSW: Eurobodalla, Goulburn Mulwaree, Wingecarribee, Port Macquarie-Hastings, Coffs Harbour, and Tweed; |
| Figure 11a,b | High-High areas: Significant top shaded areas: positive correlation with high significance located in areas among tonnage change areas among residual waste collection and ERP. | 14 (Greater Sydney) 6 (Regional NSW) | Greater Sydney: Wollondilly, Sutherland Shire, Camden, Liverpool, Fairfield, Penrith, Blacktown, Parramatta, Canada Bay, Strathfield, Ryde, Ku-ring-gai, North Sydney, Sydney. Regional NSW: Shoalhaven, Wingecarribee, Port Macquarie, Hastings, Coffs Harbor, and Tweed |
| Figure 12a,b | Positive correlations with the ratio among the number of income earners and ERP (population) | 7 (Greater Sydney) 11 (Regional NSW), | Greater Sydney: Blue Mountains, Penrith, Liverpool, Camden, Sutherland Shire, Parramatta, and Ku-ring-gai. Regional NSW: Albury, Eurobodalla, Wagga Wagga, Griffith, Shellharbour, Bathurst Regional, Cessnock, Lake Macquarie, Maitland, Byron, and Tweed. |
| Figure 13a,b | High-High areas: Significant top shaded areas, positive correlation with high significance between LGAs with organic waste collection and ERP changes. | 6 (Greater Sydney) 3 (Regional NSW) | Greater Sydney areas: Camden, Liverpool, Penrith, Sutherland Shire, Parramatta, and Ku-ring-gai. Regional NSW: Cessnock, Lake Macquarie, and Tweed |
| Figure 14 | The largest recyclable waste tonnage | 6 | Narromine, Junee, Yass Valley, The Hills Shire, Hornsby, Ku-ring-gai, and Parramatta |
| Waste Categories | Material Transferred | Links | Access Date |
|---|---|---|---|
| Residual | Collection | https://arcg.is/0TuWaX | 18 April 2023 |
| Recyclable | Collection | https://arcg.is/19vnuf0 | 30 April 2023 |
| Organics | Collection | https://arcg.is/8b4180 | 30 April 2023 |
Disclaimer/Publisher’s Note: The statements, opinions and data contained in all publications are solely those of the individual author(s) and contributor(s) and not of MDPI and/or the editor(s). MDPI and/or the editor(s) disclaim responsibility for any injury to people or property resulting from any ideas, methods, instructions or products referred to in the content. |
© 2023 by the authors. Licensee MDPI, Basel, Switzerland. This article is an open access article distributed under the terms and conditions of the Creative Commons Attribution (CC BY) license (https://creativecommons.org/licenses/by/4.0/).
Share and Cite
Xu, S.; Shirowzhan, S.; Sepasgozar, S.M.E. Urban Waste Management and Prediction through Socio-Economic Values and Visualizing the Spatiotemporal Relationship on an Advanced GIS-Based Dashboard. Sustainability 2023, 15, 12208. https://doi.org/10.3390/su151612208
Xu S, Shirowzhan S, Sepasgozar SME. Urban Waste Management and Prediction through Socio-Economic Values and Visualizing the Spatiotemporal Relationship on an Advanced GIS-Based Dashboard. Sustainability. 2023; 15(16):12208. https://doi.org/10.3390/su151612208
Chicago/Turabian StyleXu, Shixiong, Sara Shirowzhan, and Samad M. E. Sepasgozar. 2023. "Urban Waste Management and Prediction through Socio-Economic Values and Visualizing the Spatiotemporal Relationship on an Advanced GIS-Based Dashboard" Sustainability 15, no. 16: 12208. https://doi.org/10.3390/su151612208
APA StyleXu, S., Shirowzhan, S., & Sepasgozar, S. M. E. (2023). Urban Waste Management and Prediction through Socio-Economic Values and Visualizing the Spatiotemporal Relationship on an Advanced GIS-Based Dashboard. Sustainability, 15(16), 12208. https://doi.org/10.3390/su151612208


