Fused Filament Fabrication Three-Dimensional Printing: Assessing the Influence of Geometric Complexity and Process Parameters on Energy and the Environment


Abstract
:1. Introduction
- Hands-on learning: 3DP provides students with a hands-on learning experience, allowing them to design and create their own objects. This hands-on approach fosters better concept visualization, creativity, and problem-solving skills.
- Prototyping and design thinking: 3DP facilitates the iterative design process, empowering students to create rapid prototypes of their ideas, test them, and make improvements. This fosters a culture of innovation, creativity, and an entrepreneurial mindset.
- Special Education: 3DP holds immense potential for producing tactile models, assistive devices, visual aids, and customized learning materials for students with special needs. This actively engages students and enhances the accessibility of inclusive education.
- Entrepreneurship and innovation: 3DP nurtures the entrepreneurial spirit among students by enabling them to design and manufacture their own products. This encourages creative thinking, the identification of market needs, and the exploration of business opportunities, and promotes innovation and self-initiative.
- Investigate the impact of part geometric complexity and printing process parameters on the energy consumption of FFF.
- Conduct a life-cycle assessment for multiple parts with different characteristics and process parameters based on eight main impact categories: climate change, human toxicity, cumulative energy demand, ozone depletion, water depletion, freshwater ecotoxicity, fossil depletion, and agricultural land occupation.
- Provide guidelines for 3DP users in education, STEM initiatives, and Fab Labs, aiming to promote efficient resource utilization and sustainable technology practices.
2. Materials and Methods
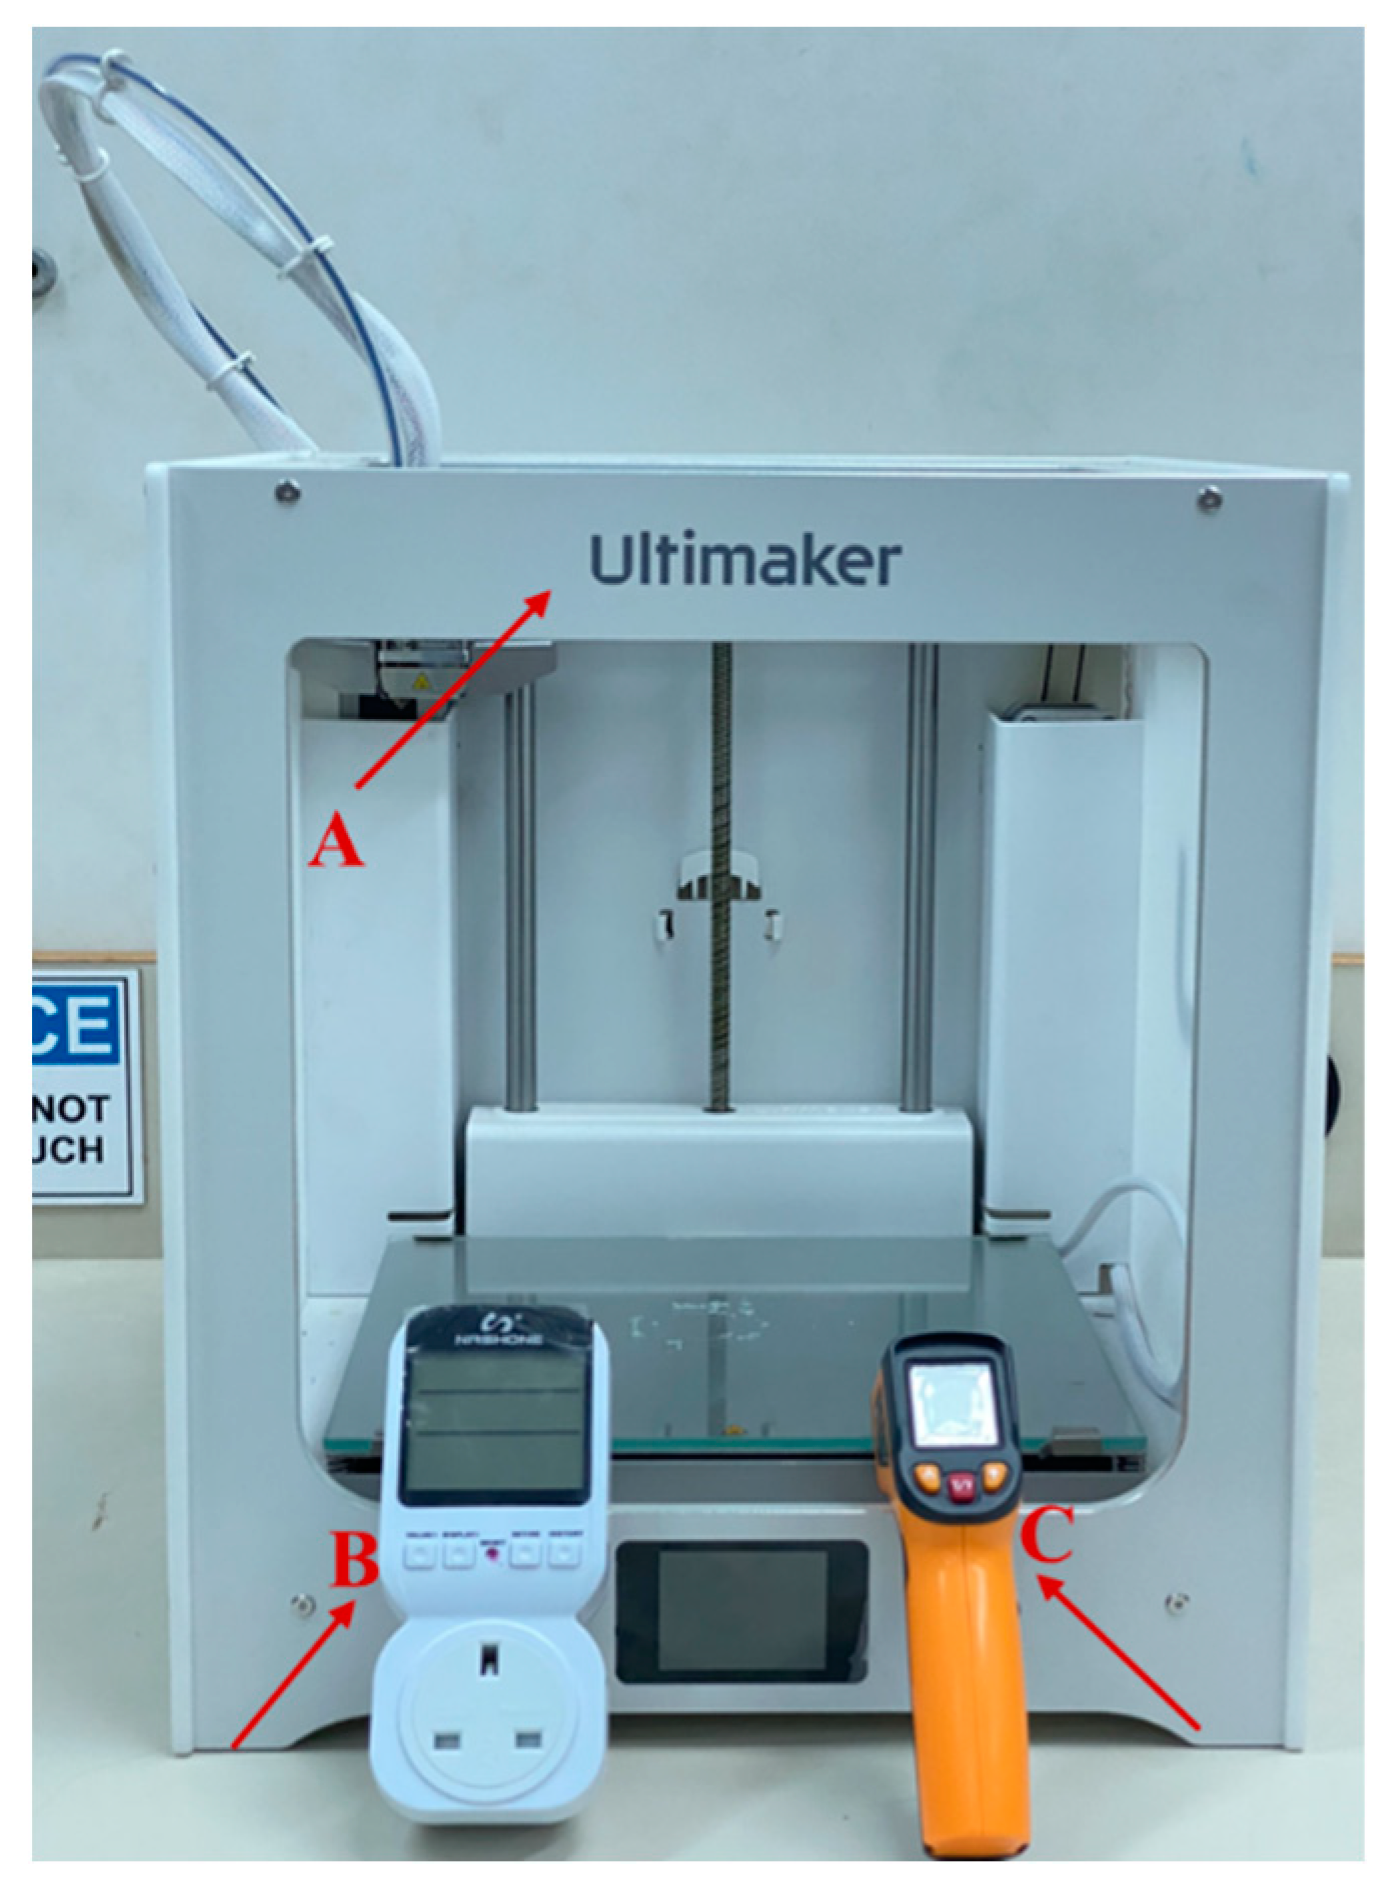
2.1. Experimental Setup and Design
- Layer height: The layer height, also known as the layer thickness, represents the vertical dimension of each deposited layer along the z-axis [25]. It is recommended that the layer height should not be less than 20% or exceed 80% of the nozzle diameter. In our study, the printer we used has a nozzle diameter of 0.4 mm, which sets the range of the layer height to be [0.08, 0.32] mm. Therefore, the selected variations for the layer height were 0.1 mm, 0.2 mm, and 0.3 mm.
- Infill density: The infill density represents the total amount of printing material inside the printed part’s periphery and is measured as a percentage [26]. The selected variations for the infill percentage were 30%, 60%, and 90%.
- Printing temperature: The printing temperature is determined by the processing temperature of the consumable material used. Higher printing temperatures promote better fluidity of the material during the printing process [17]. In this study, printing temperatures were varied based on the range provided by the manufacturer.
- Printing speed: The printing speed refers to the horizontal speed of the nozzle on the build platform during extrusion and deposition [13]. Printing speeds were varied by ±10 mm in this experiment.
2.2. Environmental Life-Cycle Assessment
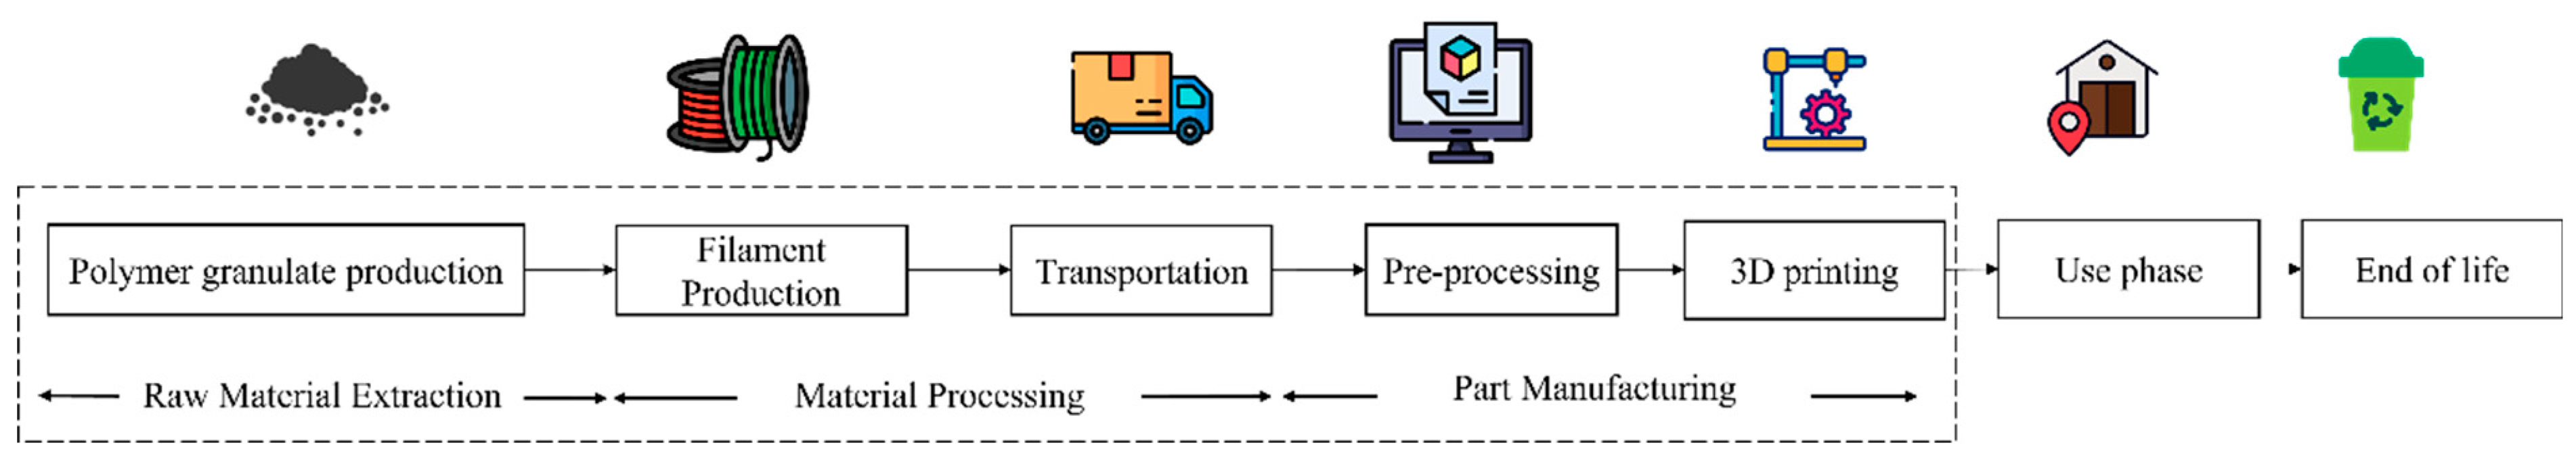
2.2.1. Goal and Scope Definition
2.2.2. LCI
2.2.3. LCIA
3. Results and Discussion
3.1. Experimental and Energy Results
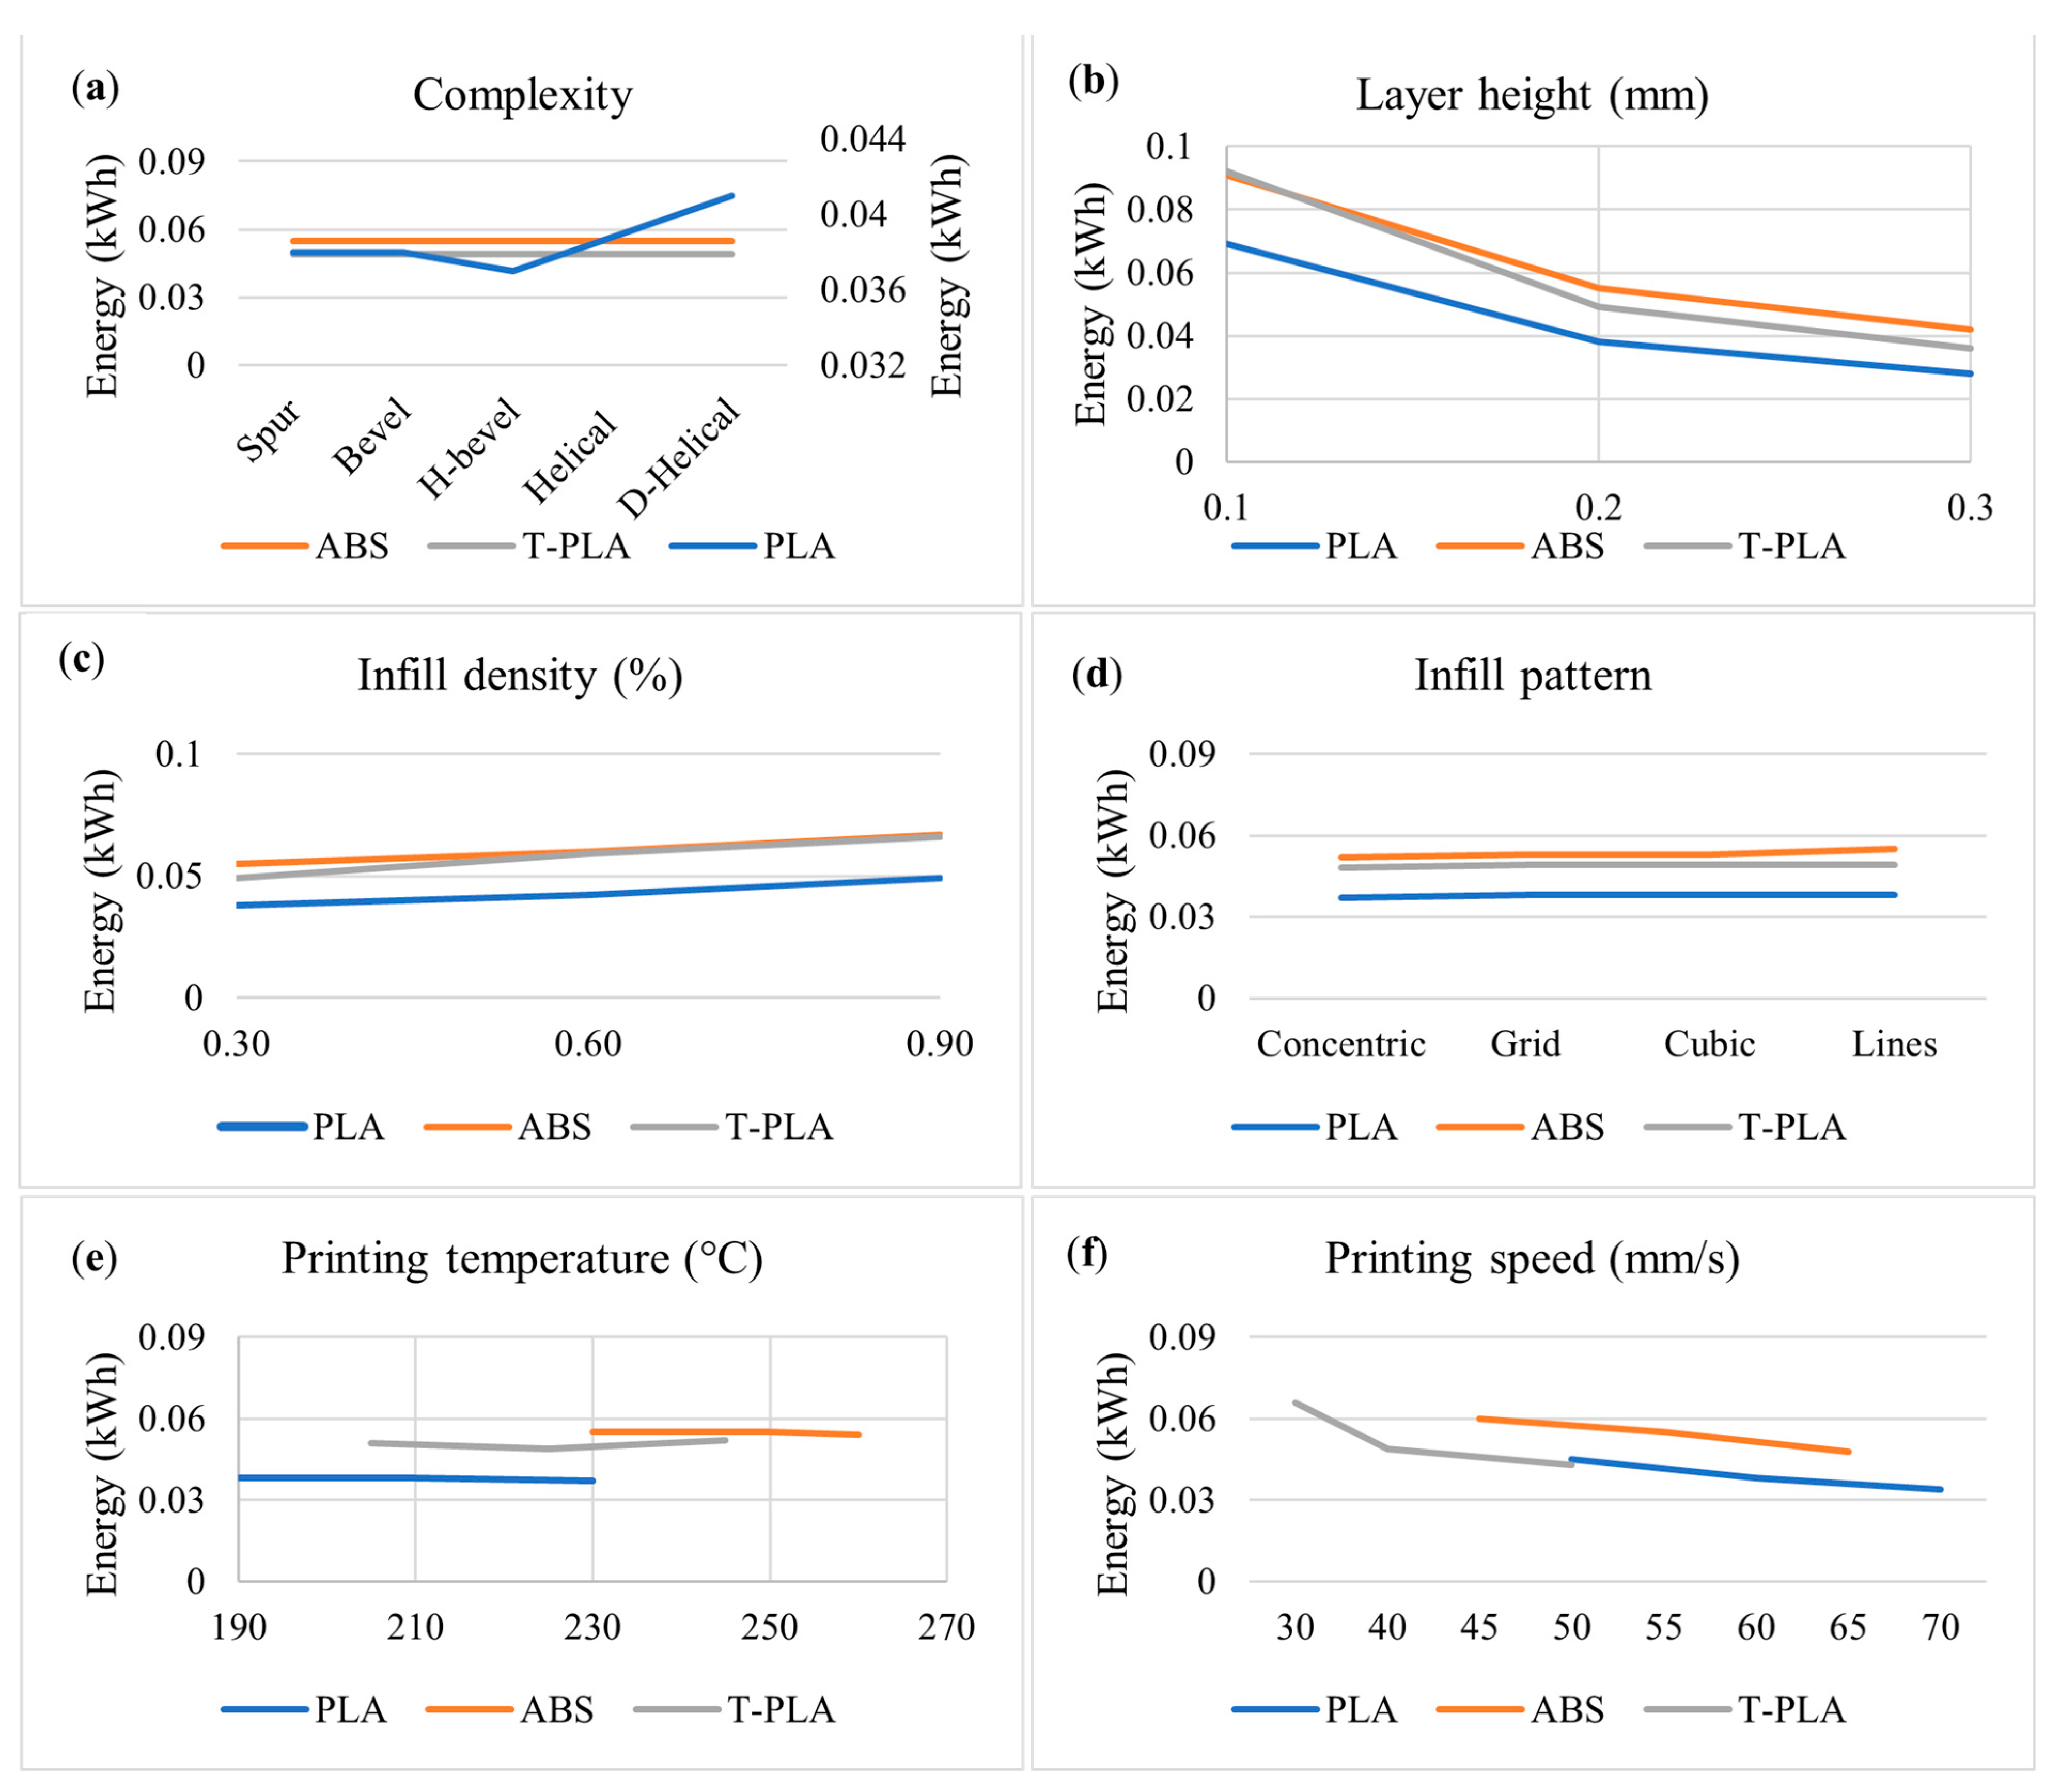
- Layer height: According to the findings presented in Table S1, a noticeable increase in energy consumption can be observed as the layer height decreases for all materials. Thinner layer heights resulted in an improved surface finish but required higher energy input. On average, the energy values decreased by approximately 59% for PLA, 62% for T-PLA, and 54% for ABS with an increase in the layer height. A visual representation of the relationship between the layer height and energy consumption is provided in Figure 7b. It can be seen that when the layer height is set to 0.1 mm, the energy values for ABS and T-PLA are almost identical, whereas PLA consistently exhibits the lowest energy consumption. As mentioned earlier, when the layer height is increased to 0.3 mm, the energy values for ABS and T-PLA remain relatively similar across different geometries. However, a significant change in energy values can be observed when the layer height is set to 0.1 mm. Therefore, it can be concluded that the ABS and T-PLA materials are more sensitive to changes in geometric complexity when using lower layer heights. Similarly, for PLA, a 9% increase in energy consumption can be observed between the simple spur gear and the complex D-helical gear when the layer height is 0.1 mm, which is lower compared to the 14.2% increase observed when the layer height is 0.3 mm. So, changes in energy due to geometric complexity are more sensitive when adopting higher layer heights.
- Infill density: The relationship between infill density and energy consumption is relatively straightforward. As the density increases, more material is used, which leads to longer printing times and, consequently, higher energy consumption. Table S2 reveals an interesting observation: when the infill density reaches 90%, the energy consumption becomes less sensitive to geometric complexity. This is evident from the similar energy values for the spur and d-helical gears at a density of 90% across all three materials. When the infill density is set at 30%, ABS prints require more energy compared to T-PLA. However, as the density increases, the energy consumption for both materials becomes roughly equivalent. This can be attributed to the fact that as the infill density increases, the printed part requires more heat energy to melt and fuse the additional material.
- Infill Pattern: In Table S3, it is evident that the energy consumption shows little sensitivity to changes in the infill pattern. This is indicated by the fact that energy values fall within a similar range when different infill patterns are used across all three materials. Furthermore, Figure 7d demonstrates that the line infill pattern has the greatest impact on energy consumption, followed by the cubic infill pattern, compared to the other patterns. However, it is worth noting that, in general, the choice of infill pattern does not have a significant effect on energy consumption.
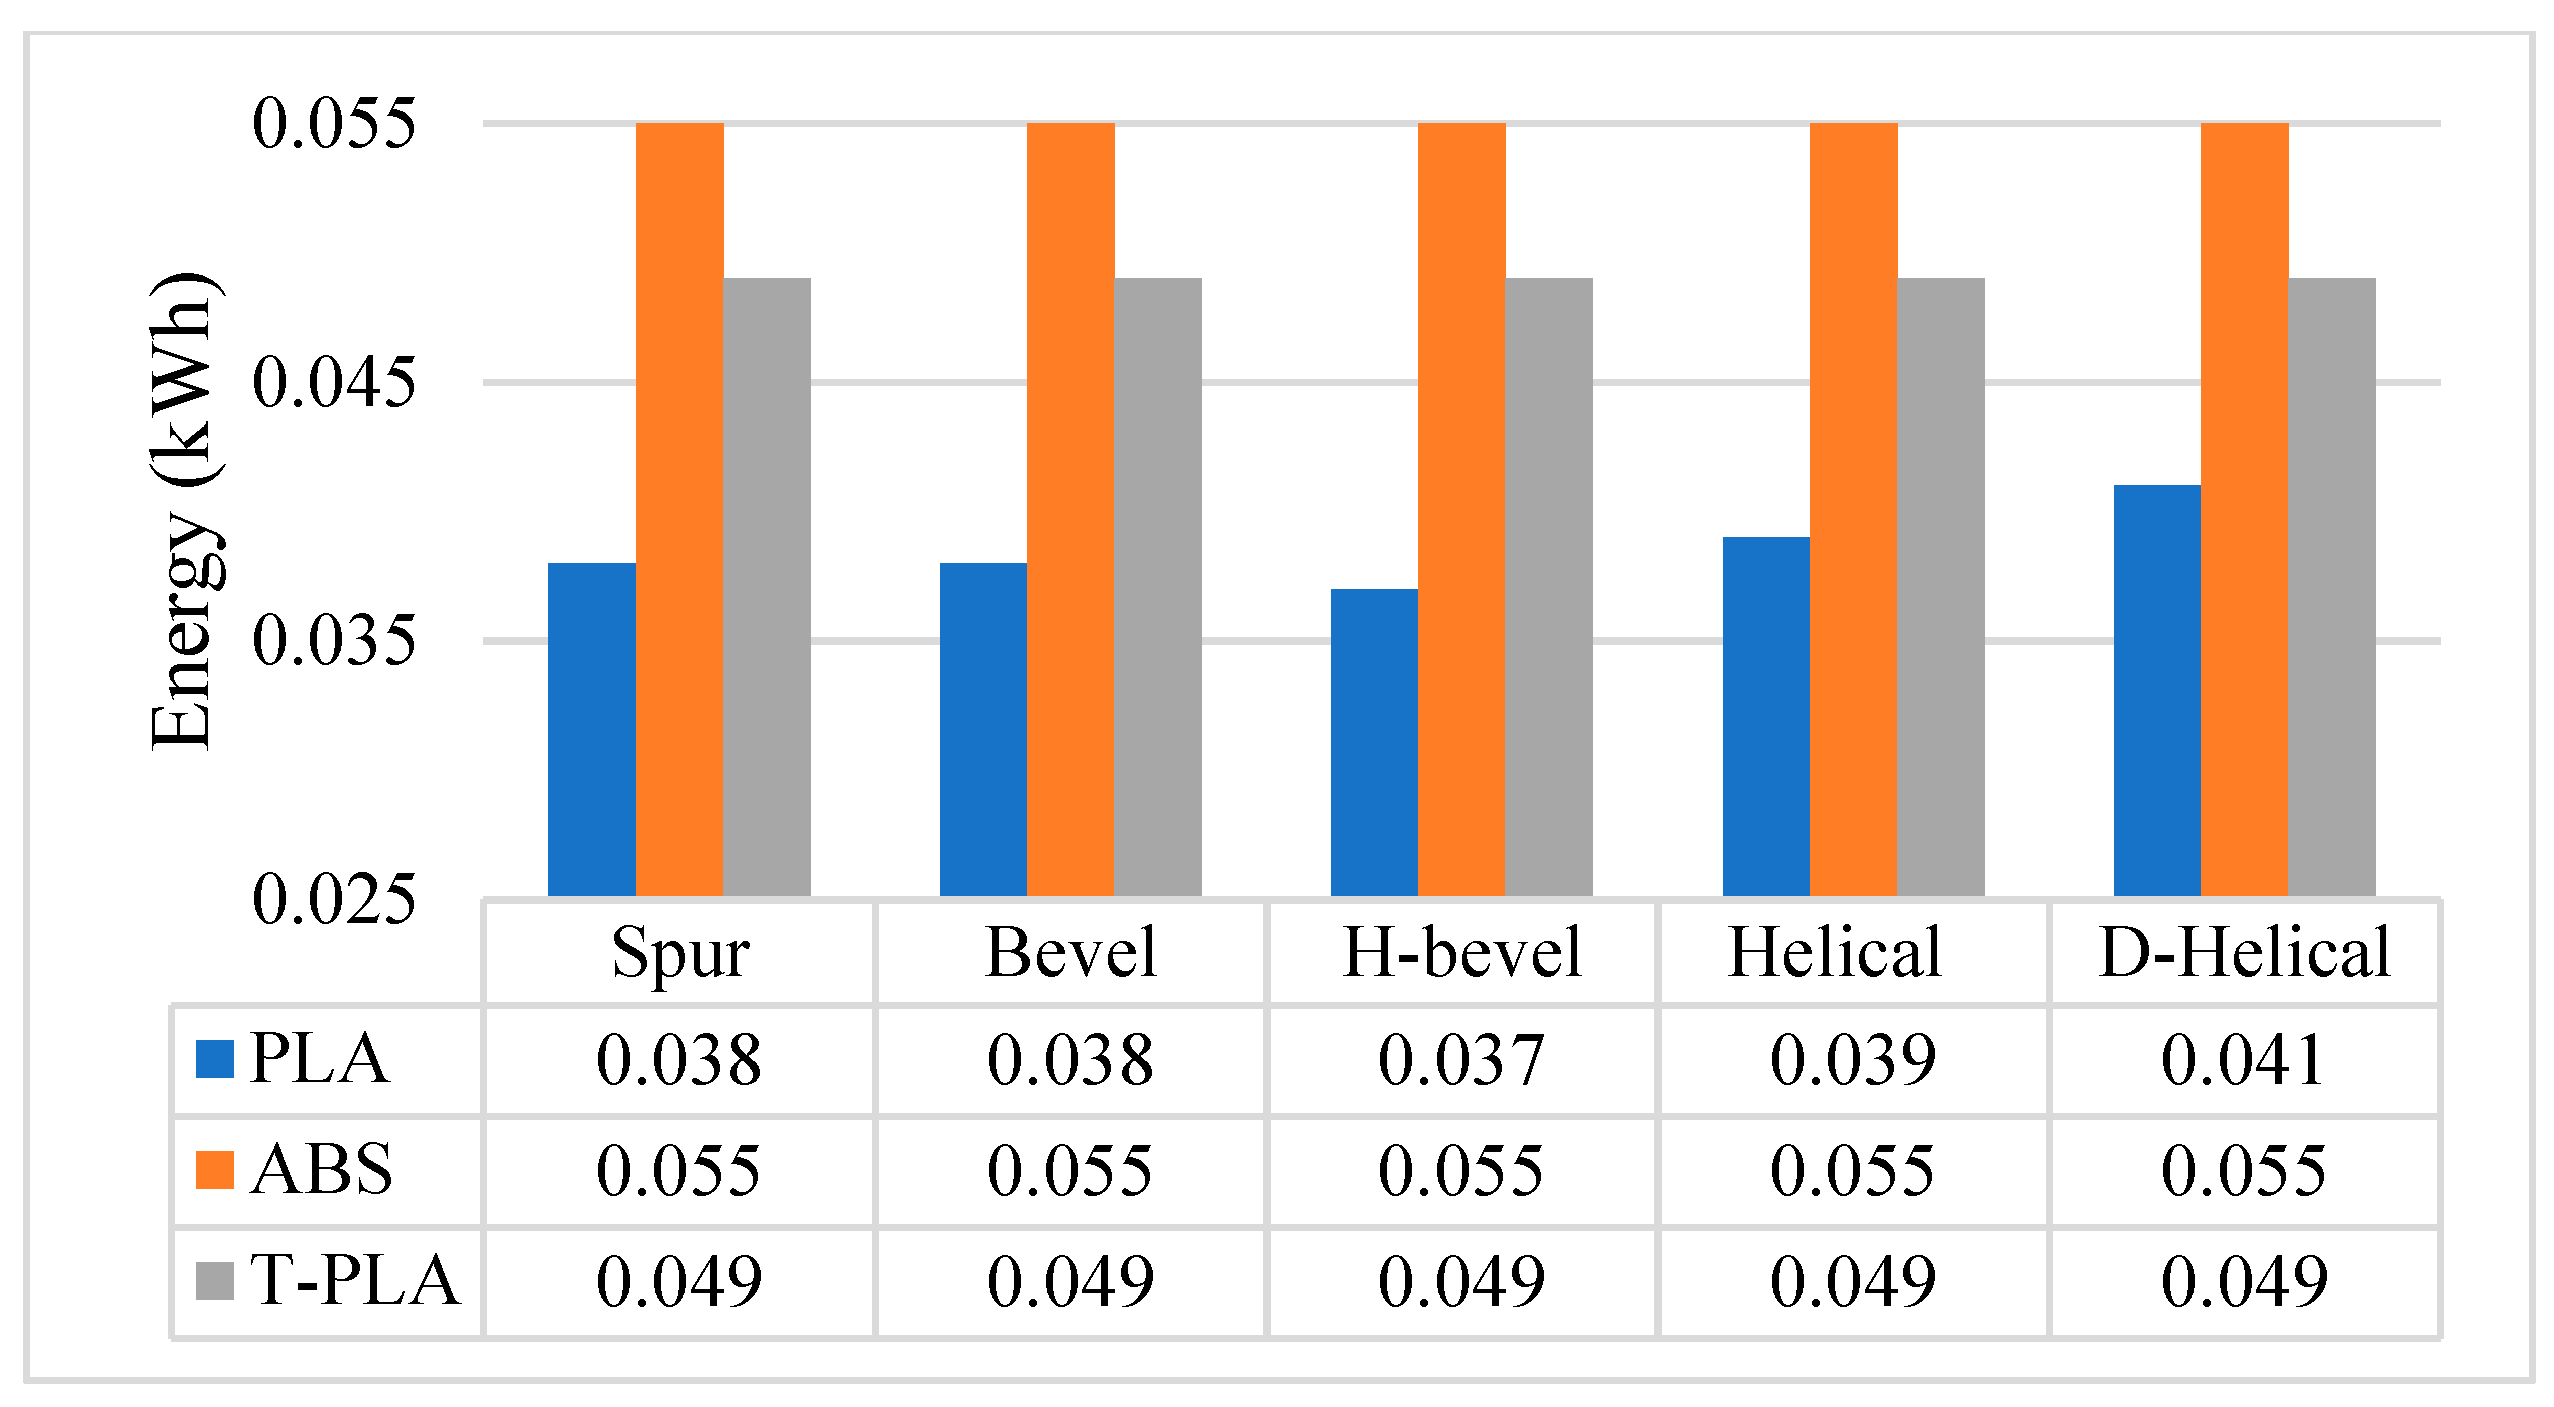
- Printing temperature: Table S4 provides insights into the relationship between temperature and energy consumption for the three materials. A marginal change in energy consumption can be observed as the temperature increases. Specifically, for PLA, there appears to be an inversely proportional relationship between temperature and energy consumption, with only an 8% increase in energy recorded for a temperature variation of 40 °C. Similarly, ABS and T-PLA exhibit only slight changes in energy values. Figure 7e further illustrates the consistent behavior of energy values across different temperatures. These findings align with previous research conducted by Elkaseer et al. [34] and Vidakis et al. [35], where they mentioned that the change in energy consumption due to temperature variation is insignificant and considered marginal for ABS and PLA thermoplastics. It is worth noting that PLA exhibited the lowest energy values, whereas ABS exhibited the highest. This observation was expected, as ABS has a higher melting temperature compared to PLA and T-PLA.
- Printing speed: The relationship between printing speed and energy consumption can be described as inversely proportional. In other words, higher printing speeds correspond to lower energy consumption. According to Table S5, increasing the speed by 20 mm/s resulted in an average decrease in energy consumption of 20%, 36%, and 16% for PLA, T-PLA, and ABS, respectively. It is worth noting the interesting observation that the energy values for printing PLA and T-PLA were equivalent at a speed of 50 mm/s, despite T-PLA having a higher melting temperature. This finding suggests that T-PLA can be a beneficial choice for achieving low energy consumption during the printing process. The results highlight the significant impact of printing speed on energy consumption, with higher speeds leading to reduced energy requirements.
3.2. LCA Results
LCA Results per Parameter
- Complexity
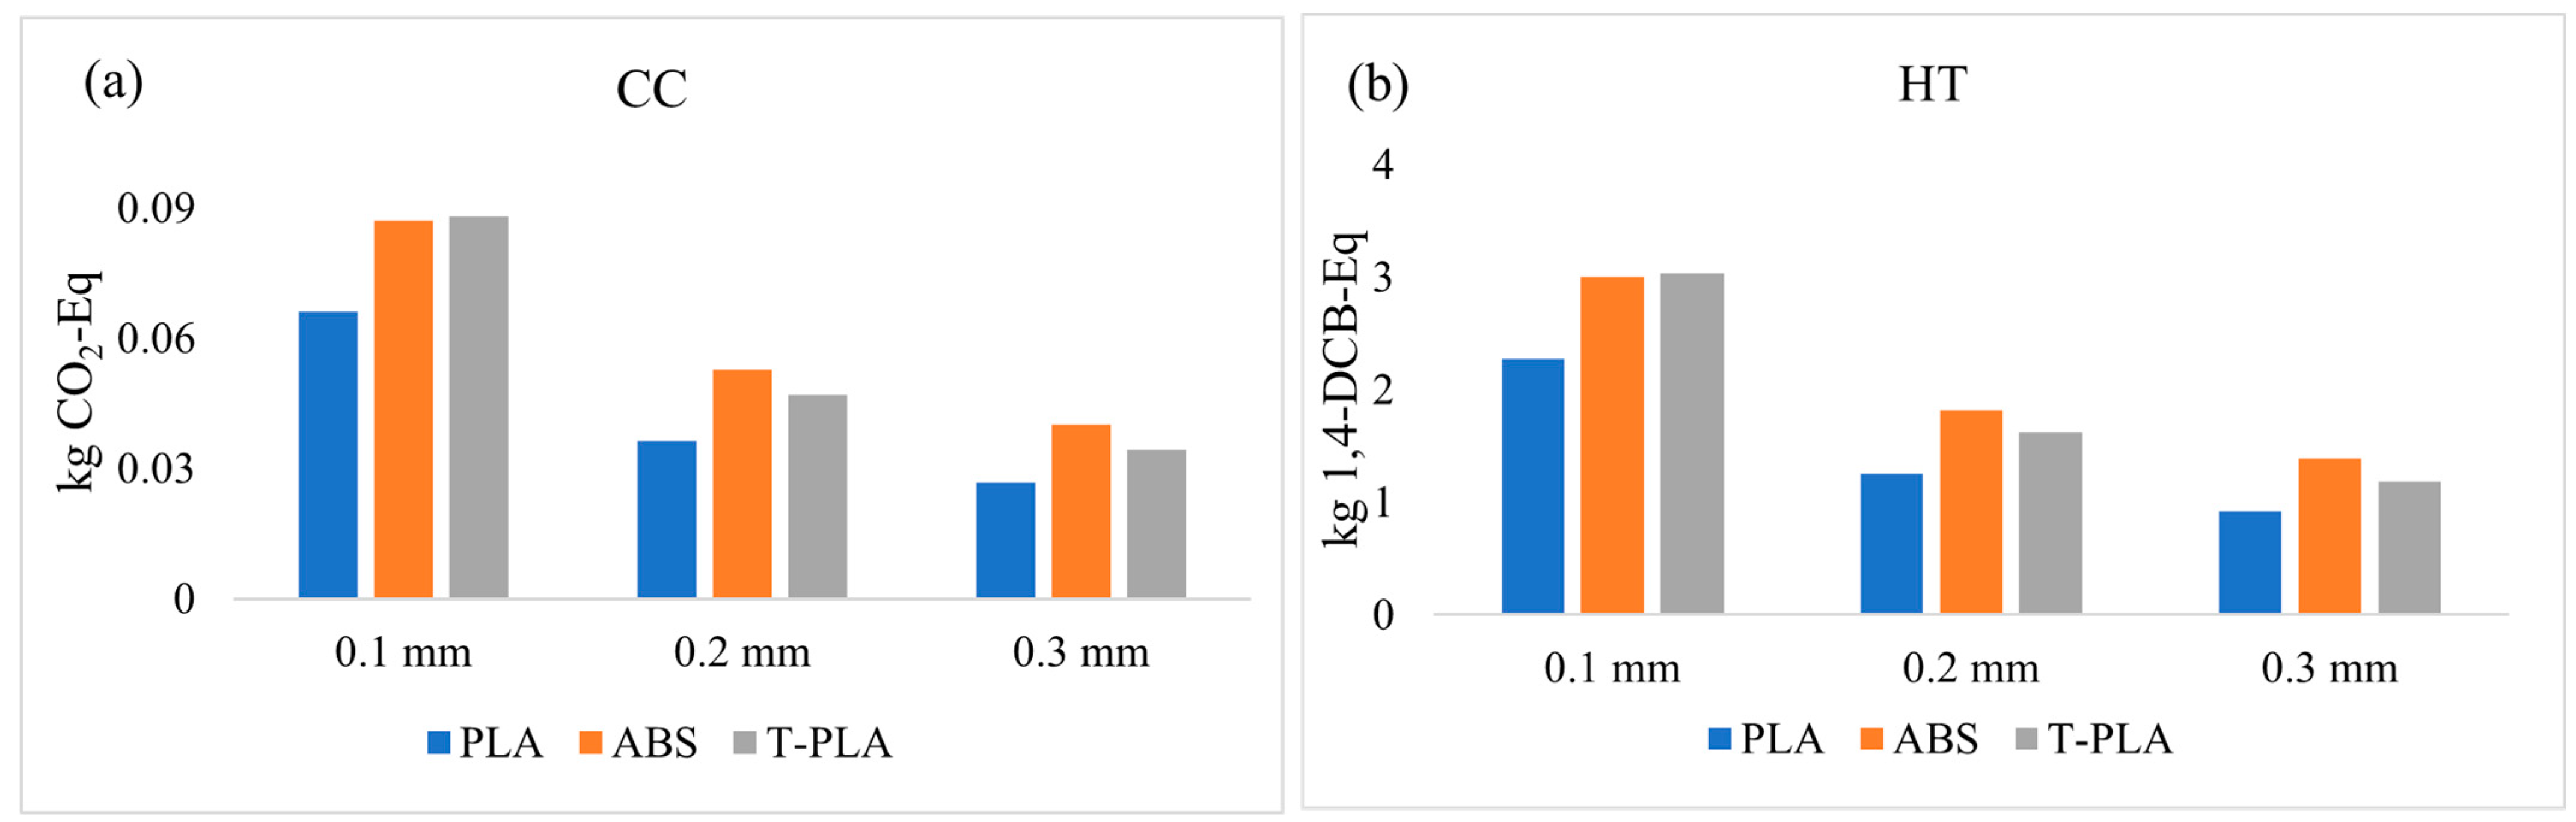
- Layer height
- Infill density
- Infill pattern
- Printing speed
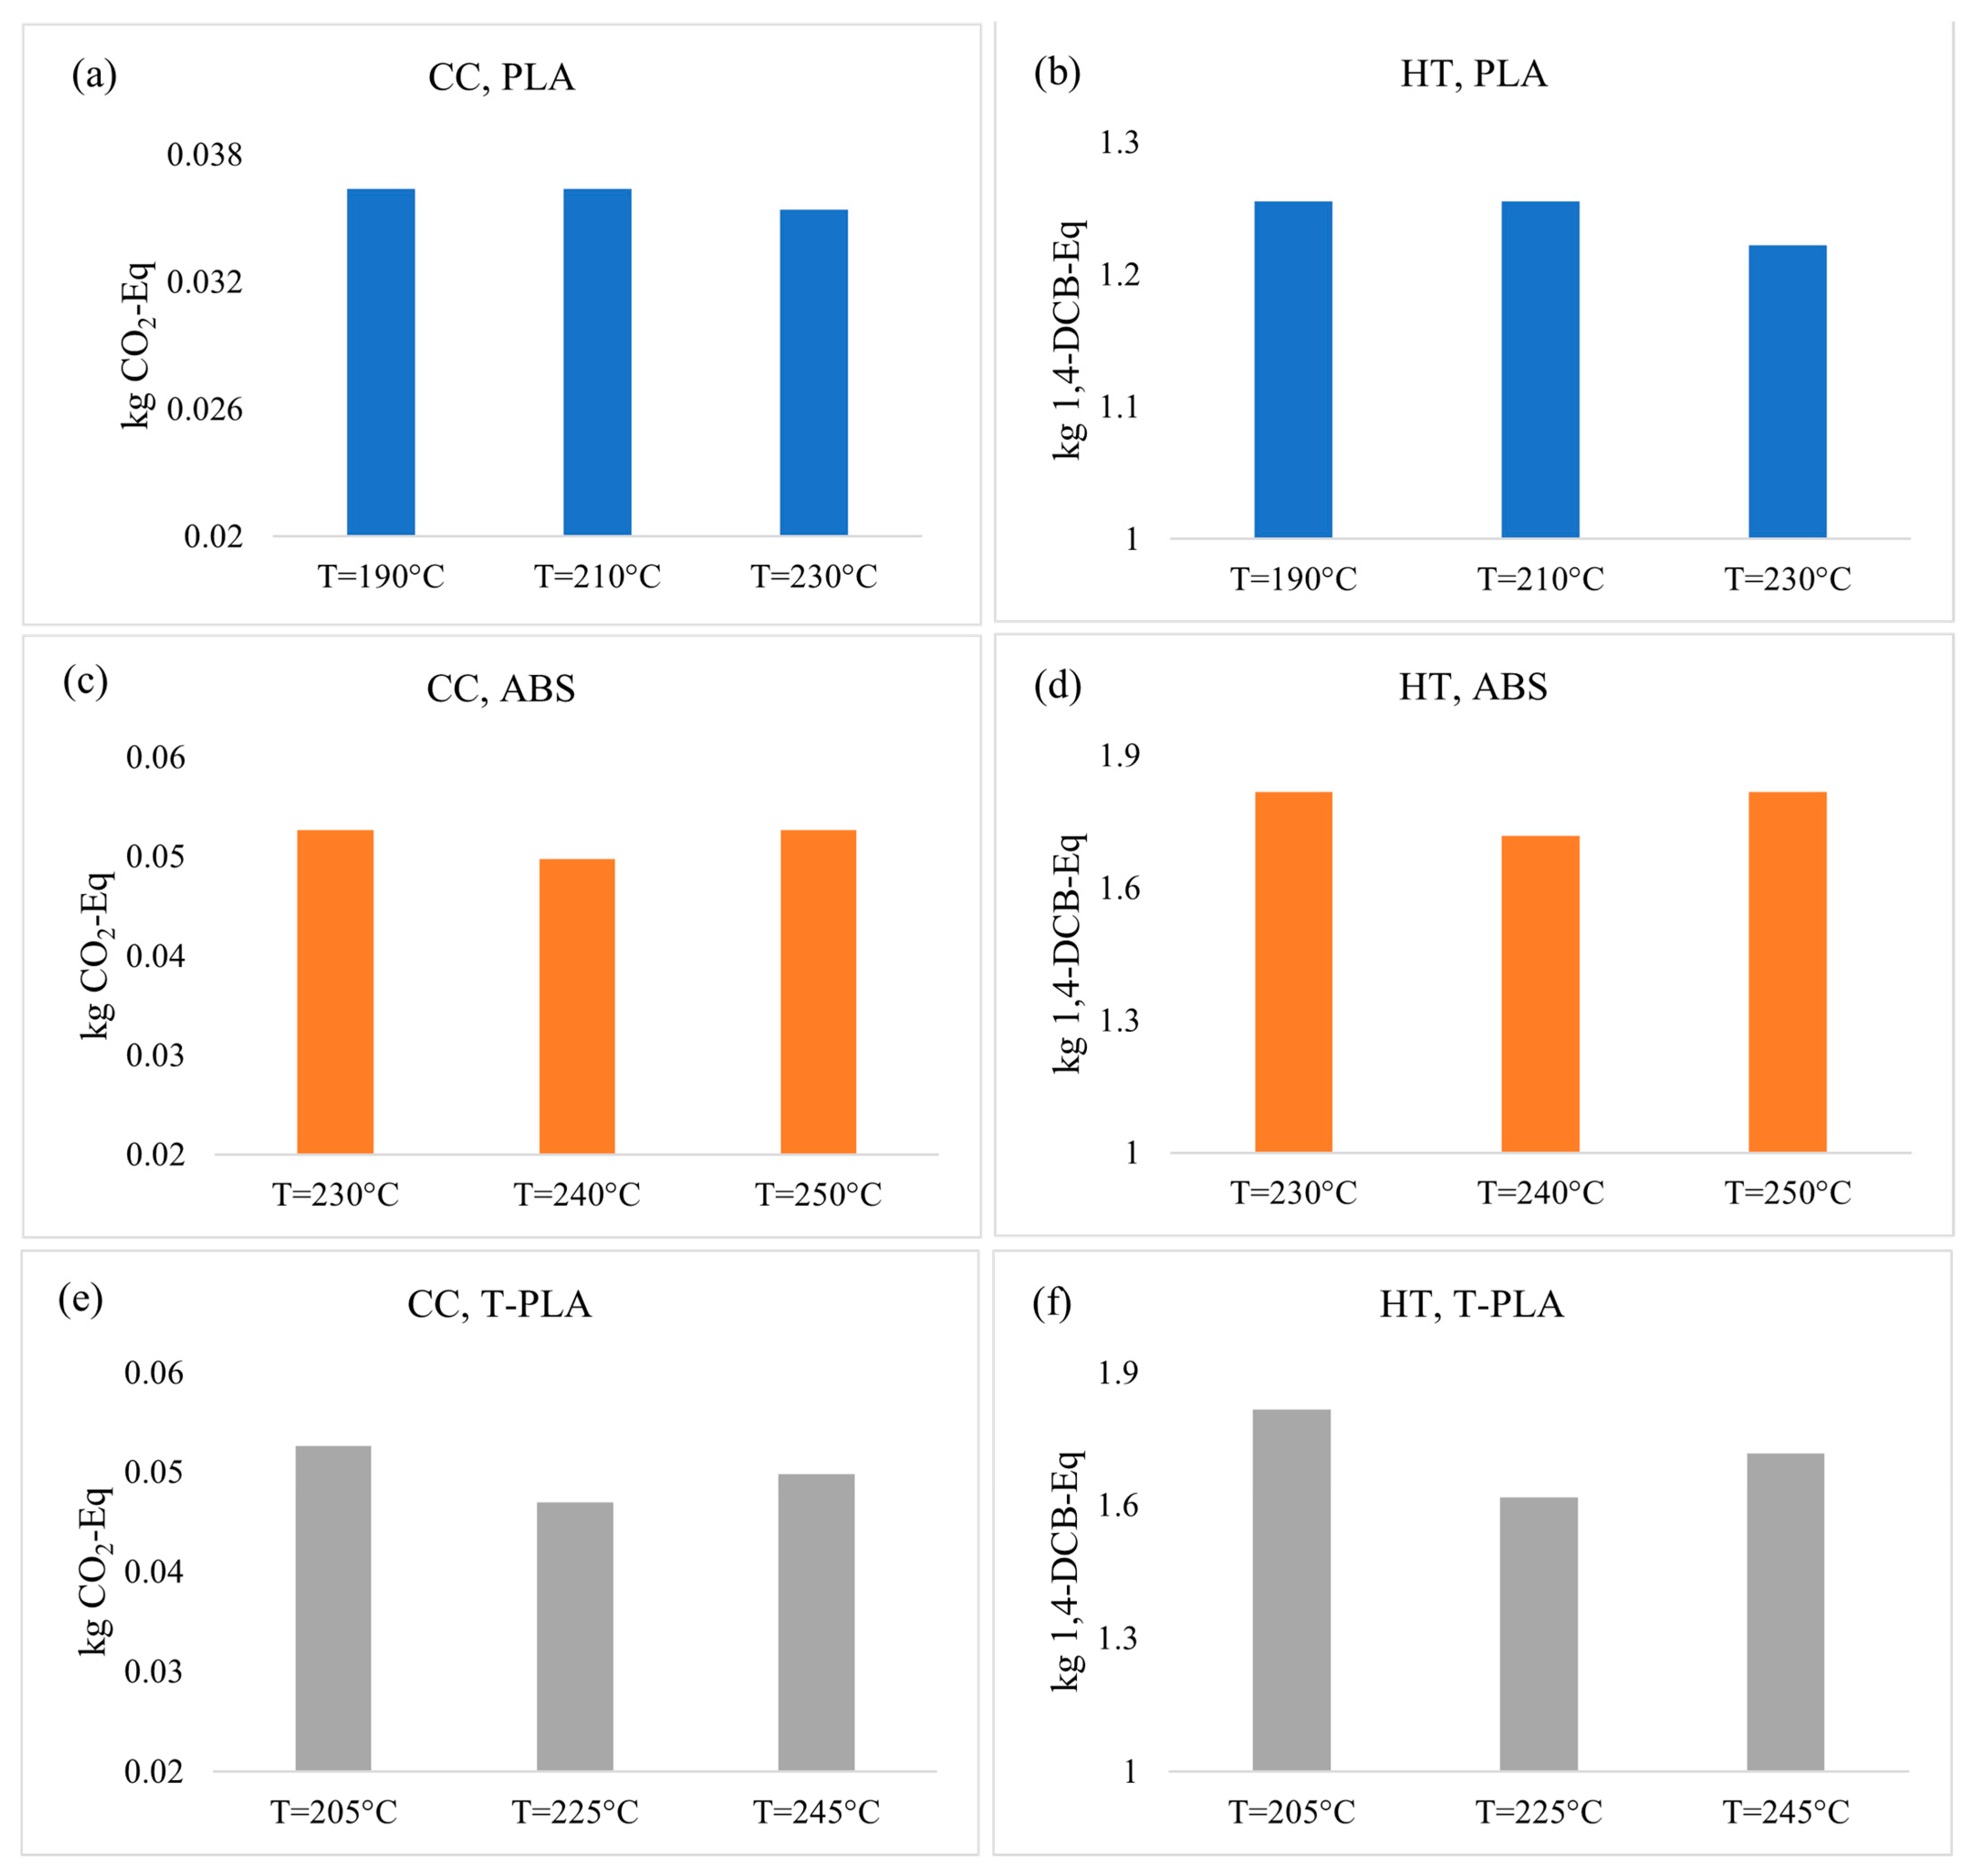
- Printing temperature
3.3. Discussion
3.4. Guidelines for 3DP Users in Education
- Safety and Ventilation: Considerations for public safety and health are crucial when dealing with any machinery or equipment, including 3D printers. It is important to operate 3D printers with optimal controls and adhere to safety regulations, as this technology can release hazardous particles and vapors into the air [36]. Moreover, the emitted particulate matter from 3D printers, which can contribute to air pollution, should be filtered by incorporating particulate air filters.
- To mitigate the risk of environmental pollution and control emissions and promote a safe and healthy environment for users of 3D printing, it is essential to implement proper exhaust ventilation and air filter systems in the classroom or laboratory where the 3D printer is located. Additionally, ensuring adequate airflow will help maintain a safe and healthy environment.
- Material Selection: The choice of printing material filament directly impacts the environmental footprint. Through conducted experiments, it has been determined that PLA is the least harmful material to the environment. This is due to its biodegradability and its composition of natural sources such as corn and sugarcane. Therefore, adopting PLA as the printing material is highly recommended. However, if the printed object requires functionality and strength, then T-PLA or ABS should be used. For example, when students utilize 3D printing to fabricate parts for a manufacturing design project or create end-use parts, ABS can be employed for complex and functional components, whereas T-PLA is particularly beneficial for functional prototypes and larger-sized tooling. Conversely, if an educator is solely printing a demonstration for students to visualize a concept, PLA is the recommended choice to minimize environmental impact.
- Waste, Recycling, and Reuse: 3DP users should consider the safe and proper disposal of waste material, including failed prints and support structures. An advantageous aspect of thermoplastics is their ability to be reused. Filament material waste can be recycled, melted, reformed into new filament spools, and utilized as raw material for printing. This practice can significantly reduce the carbon footprint associated with waste disposal, landfill, and incineration, as well as the extraction and processing of raw materials. Consequently, it allows for both resource conservation and energy savings.
- Energy Efficiency: Energy efficiency can be achieved by implementing optimized process parameters. Additionally, increasing the batch size number and consolidating multiple small prints into a single print job can save energy related to the electric heating of the nozzle and bed. Increasing the batch size leads to lower environmental impacts [37].
- Printer Operation and Maintenance: All printers should undergo regular maintenance and inspections to ensure the optimal efficiency of the 3D printer’s operation. Well-maintained printers are less likely to experience issues that result in excessive energy consumption. For example, lubricating the printer’s moving parts and cleaning and replacing worn-out or clogged components can help reduce energy waste and minimize friction. In addition, it is advisable to adopt energy-saving measures such as utilizing standby mode and turning off the printer during idle times. Furthermore, it is recommended to use the minimum number of 3D printers necessary for maximum activity, as this helps to reduce the energy impact of non-active printers [38].
- Print Process Parameters: A balance of print quality, speed, layer height, and density is necessary, depending on the intended purpose of the print, to ensure resource efficiency and minimize energy consumption. Optimizing the process parameters can reduce printing time, energy usage, and the overall environmental impact. According to this study, which was conducted with an FFF UltiMaker printer, the following optimized process parameters are recommended for minimizing energy consumption:
- -
- Adjust the layer height according to the printer’s nozzle. For a highly detailed surface finish, a lower layer height is recommended. As a rule of thumb, set the layer height to between 20% and 80% of the printer nozzle’s diameter.
- -
- The infill density directly affects material consumption and the weight of the printed part. Higher infill percentages enhance the strength and mechanical properties of the part, making it suitable for end-use applications. For most visual purpose models, a 20% infill density is commonly used.
- -
- Different infill pattern geometries have minimal impact on energy and the environment, as observed in the conducted study. However, the concentric infill pattern exhibits the lowest energy values. For prints requiring high ultimate tensile strength, cubic and grid patterns are recommended [13].
- -
- Follow the recommended temperature guidelines provided by the filament manufacturer (UltiMaker, in this case) for each material. Based on the conducted experiments, the effect of temperature changes on energy and the environment is found to be marginal.
- -
- Printing speed is inversely correlated with energy consumption. It is advisable to use higher printing speeds to minimize the environmental impact. Start by adjusting the speed according to the manufacturer’s guidelines and gradually increase it in small increments while monitoring print quality to avoid stringing and poor adhesion to the print bed.
- Educational Sustainability Focus: One initiative that aims to promote energy efficiency and environmental sustainability in relation to 3D printing is introducing the concept of sustainability and circular economy to students. By doing so, students will become more aware of the environmental implications associated with their designs and adopt eco-friendly 3D-printing practices. Furthermore, incorporating discussions and workshops focused on sustainability and the environment will encourage students to practice responsible consumption in 3D printing and contribute to a more sustainable future.
- Different FFF printer models, such as Prusa, MakerBot, Stratasys Fortus, etc., have different temperature control systems, layer resolutions, extrusion rates, slicing software profiles, and hardware specifications, including extruder type, nozzle size, and build volume. These variations could result in different material consumption and energy usage, and consequently, different environmental impacts.
- There are various 3D-printing technologies like selective laser sintering (SLS), multi-jet fusion (MJF), electron beam melting (EBM), and direct metal laser sintering (DMLS). Tagliaferri et al. [39] compared different additive manufacturing technologies by adopting different 3D-printer models. Their results revealed that the Fortus 450mc 3D printer has a lower production capacity due to its inability to build multiple objects simultaneously. Economically, the authors stated that the raw material cost of fused deposition modeling (FDM) 3D printers was higher compared to that of SLS and MJF machines. FDM technology was the highest contributor to the environmental impact categories, followed by SLS and MJF. Notably, the MFJ machine had lower electricity consumption compared to the others.
- Polymer filament materials can vary from one manufacturer or supplier to another [40]. Although the filaments share the same general category, e.g., ABS, PLA, polyether ether ketone (PEEK), the manufacturing processes and formulations employed by different companies lead to different characteristics, including:
- Material composition, where manufacturers use additives and different blends to achieve particular filament material properties
- Filament diameter varies slightly between manufacturers. The standard diameter is 1.75 mm or 2.85 mm; however, a few micrometers’ variation can affect the print quality and extrusion consistency.
- Printing temperature ranges from one filament to another. Manufacturers design filaments with narrow or broad temperature ranges.
4. Conclusions and Future Work
Future Work
- The current study has considered a limited range of geometric complexity levels. However, incorporating a more diverse and broader range of geometric shapes and sizes would yield different outcomes and provide a deeper understanding of the energy consumption and environmental impacts of FFF 3D printing.
- A future direction could involve the consideration and comparative analysis of additional filament materials, such as thermoplastic polyurethane (TPU), polyether ether ketone (PEEK), and polyethylene terephthalate glycol (PETG). This would provide comprehensive guidelines and profound insights into sustainable 3D-printing practices.
- In this study, UltiMaker 2+ Connect was adopted to conduct the experiments. Extending this work to a comparative analysis with multiple 3D-printer models using different 3D-printing technologies would lead to more comprehensive and accurate results.
- In this paper, we have proposed guidelines for the education sector to effectively integrate 3D printing. However, expanding the scope of this work considering different 3D-printing application scenarios in various industry sectors, such as the biomedical field, consumer products sector, and manufacturing, would provide useful insights and more specific and practical recommendations for the optimal utilization of 3D printing across various sectors, empowering industries with cutting-edge technologies and fostering innovation.
Supplementary Materials
Author Contributions
Funding
Institutional Review Board Statement
Informed Consent Statement
Data Availability Statement
Acknowledgments
Conflicts of Interest
References
- Lolli, F.; Coruzzolo, A.M.; Peron, M.; Sgarbossa, F. Age-based preventive maintenance with multiple printing options. Int. J. Prod. Econ. 2021, 243, 108339. [Google Scholar] [CrossRef]
- Mecheter, A.; Pokharel, S.; Tarlochan, F. Additive Manufacturing Technology for Spare Parts Application: A Systematic Review on Supply Chain Management. Appl. Sci. 2022, 12, 4160. [Google Scholar] [CrossRef]
- Khaki, S.; Rio, M.; Marin, P. Characterization of Emissions in Fab Labs: An Additive Manufacturing Environment Issue. Sustainability 2022, 14, 2900. [Google Scholar] [CrossRef]
- Peron, M.; Sgarbossa, F.; Ivanov, D.; Dolgui, A. Impact of Additive Manufacturing on Supply Chain Resilience During COVID-19 Pandemic. In Supply Network Dynamics and Control; Springer: Berlin/Heidelberg, Germany, 2022; pp. 121–146. [Google Scholar] [CrossRef]
- Mecheter, A.; Pokharel, S.; Tarlochan, F.; Tsumori, F. A multi-period multiple parts mixed integer linear programming model for AM adoption in the spare parts supply Chain. Int. J. Comput. Integr. Manuf. 2023. [Google Scholar] [CrossRef]
- Troxler, P. Fabrication Laboratories (Fab Labs). In The Decentralized and Networked Future of Value Creation: 3D Printing and its Implications for Society, Industry, and Sustainable Development; Springer: Berlin/Heidelberg, Germany, 2016; pp. 109–127. ISBN 9783319316864. [Google Scholar]
- D Printing Market in Education Sector Growth, Size, Trends, Analysis Report by Type, Application, Region and Segment Forecast 2022–2026. Available online: https://www.technavio.com/report/3d-printing-market-in-education-sector-industry-analysis (accessed on 16 May 2023).
- Lavicza, Z.; Weinhandl, R.; Prodromou, T.; Anđić, B.; Lieban, D.; Hohenwarter, M.; Fenyvesi, K.; Brownell, C.; Diego-Mantecón, J.M. Developing and Evaluating Educational Innovations for STEAM Education in Rapidly Changing Digital Technology Environments. Sustainability 2022, 14, 7237. [Google Scholar] [CrossRef]
- Ford, S.; Minshall, T. Invited review article: Where and how 3D printing is used in teaching and education. Addit. Manuf. 2019, 25, 131–150. [Google Scholar] [CrossRef]
- Scaradozzi, D.; Guasti, L.; Di, M.; Beatrice, S.; Monteriù, A. Learning by Making. 3D Printing Guidelines for Teachers. In Makers at School, Educational Robotics and Innovative Learning Environments Research and Experiences From; Springer International Publishing: Berlin/Heidelberg, Germany, 2019; ISBN 9783030770396. [Google Scholar]
- Chong, S.; Pan, G.-T.; Chin, J.; Show, P.L.; Yang, T.C.K.; Huang, C.-M. Integration of 3D Printing and Industry 4.0 into Engineering Teaching. Sustainability 2018, 10, 3960. [Google Scholar] [CrossRef] [Green Version]
- To, T.T.; Al Mahmud, A.; Ranscombe, C. Teaching Sustainability Using 3D Printing in Engineering Education: An Observational Study. Sustainability 2023, 15, 7470. [Google Scholar] [CrossRef]
- Algarni, M.; Ghazali, S. Comparative Study of the Sensitivity of PLA, ABS, PEEK, and PETG’s Mechanical Properties to FDM Printing Process Parameters. Crystals 2021, 11, 995. [Google Scholar] [CrossRef]
- Pulipaka, A.; Gide, K.M.; Beheshti, A.; Bagheri, Z.S. Effect of 3D printing process parameters on surface and mechanical properties of FFF-printed PEEK. J. Manuf. Process. 2023, 85, 368–386. [Google Scholar] [CrossRef]
- Naveed, N. Investigating the Material Properties and Microstructural Changes of Fused Filament Fabricated PLA and Tough-PLA Parts. Polymers 2021, 13, 1487. [Google Scholar] [CrossRef] [PubMed]
- Kumar, R.; Sharma, H.; Saran, C.; Tripathy, T.S.; Sangwan, K.S.; Herrmann, C. A Comparative Study on the Life Cycle Assessment of a 3D Printed Product with PLA, ABS & PETG Materials. Procedia CIRP 2022, 107, 15–20. [Google Scholar] [CrossRef]
- Ma, H.; Zhang, Y.; Jiao, Z.; Yang, W.; He, X.; Xie, G.; Li, H. Comprehensive Assessment of the Environmental Impact of Fused Filament Fabrication Products Produced Under Various Performance Requirements. J. Inst. Eng. Ser. C 2020, 102, 59–73. [Google Scholar] [CrossRef]
- Warke, S.; Puranik, V.S. Materials Today: Proceedings Comparison of Energy Consumption of ABS and PLA While 3 D Printing with Fused Deposition Modeling Process. Mater. Today Proc. 2022, 66, 2098–2103. [Google Scholar] [CrossRef]
- Enemuoh, E.U.; Duginski, S.; Feyen, C.; Menta, V.G. Effect of Process Parameters on Energy Consumption, Physical, and Mechanical Properties of Fused Deposition Modeling. Polymers 2021, 13, 2406. [Google Scholar] [CrossRef]
- Ulkir, O. Energy-Consumption-Based Life Cycle Assessment of Additive-Manufactured Product with Different Types of Materials. Polymers 2023, 15, 1466. [Google Scholar] [CrossRef]
- Song, M.J.; Ha, E.; Goo, S.-K.; Cho, J. Design and Development of 3D Printed Teaching Aids for Architecture Education. Int. J. Mob. Blended Learn. 2018, 10, 58–75. [Google Scholar] [CrossRef]
- Torres-Carrillo, S.; Siller, H.R.; Vila, C.; López, C.; Rodríguez, C.A. Environmental analysis of selective laser melting in the manufacturing of aeronautical turbine blades. J. Clean. Prod. 2020, 246, 119068. [Google Scholar] [CrossRef]
- GrabCAD Making Additive Manufacturing at Scale Possible. Available online: https://grabcad.com/ (accessed on 29 May 2023).
- UltiMaker Cura. Available online: https://ultimaker.com/software/ultimaker-cura/ (accessed on 29 May 2023).
- Cojocaru, V.; Frunzaverde, D.; Miclosina, C.-O.; Marginean, G. The Influence of the Process Parameters on the Mechanical Properties of PLA Specimens Produced by Fused Filament Fabrication—A Review. Polymers 2022, 14, 886. [Google Scholar] [CrossRef]
- Ahmed, S.W.; Hussain, G.; Altaf, K.; Ali, S.; Alkahtani, M.; Abidi, M.H.; Alzabidi, A. On the Effects of Process Parameters and Optimization of Interlaminate Bond Strength in 3D Printed ABS/CF-PLA Composite. Polymers 2020, 12, 2155. [Google Scholar] [CrossRef]
- Rajan, K.; Samykano, M.; Kadirgama, K.; Harun, W.S.W.; Rahman, M. Fused deposition modeling: Process, materials, parameters, properties, and applications. Int. J. Adv. Manuf. Technol. 2022, 120, 1531–1570. [Google Scholar] [CrossRef]
- Ultimaker. Available online: https://ultimaker.com/ (accessed on 28 May 2023).
- ASTM52900-15; Standard Terminology for Additive Manufacturing—General Principles—Terminology. ASTM International: West Conshohocken, PA, USA, 2015.
- Hou, H.; Wang, H.; Ren, A.; Zhang, Y.; Liu, Y. Comparative Life Cycle Assessment of the Manufacturing of Conventional and Innovative Aerators: A Case Study in China. Sustainability 2022, 14, 15115. [Google Scholar] [CrossRef]
- Wernet, G.; Bauer, C.; Steubing, B.; Reinhard, J.; Moreno-Ruiz, E.; Weidema, B. The ecoinvent database version 3 (part I): Overview and methodology. Int. J. Life Cycle Assess. 2016, 21, 1218–1230. [Google Scholar] [CrossRef]
- Minetola, P.; Eyers, D. Energy and Cost Assessment of 3D Printed Mobile Case Covers. Procedia CIRP 2018, 69, 130–135. [Google Scholar] [CrossRef]
- KGupta; Jain, N.K.; Laubscher, R. Advanced Gear Manufacturing and Finishing: Classical and Modern Processes; Academic Press: London, UK, 2017; pp. 167–196. [Google Scholar]
- Elkaseer, A.; Schneider, S.; Scholz, G. Experiment-Based Process Modeling and Optimization for High-Quality and Resource-E Ffi Cient. Appl. Sci. 2020, 10, 2899. [Google Scholar] [CrossRef] [Green Version]
- Vidakis, N.; Kechagias, J.; Petousis, M.; Vakouftsi, F.; Mountakis, N. The effects of FFF 3D printing parameters on energy consumption. Mater. Manuf. Process. 2022, 38, 915–932. [Google Scholar] [CrossRef]
- Stefaniak, A.B.; Bowers, L.N.; Cottrell, G.; Erdem, E.; Knepp, A.K.; Martin, S.B.; Pretty, J.; Duling, M.G.; Arnold, E.D.; Wilson, Z.; et al. Towards sustainable additive manufacturing: The need for awareness of particle and vapor releases during polymer recycling, making filament, and fused filament fabrication 3-D printing. Resour. Conserv. Recycl. 2022, 176, 105911. [Google Scholar] [CrossRef]
- Garcia, F.L.; Nunes, A.O.; Martins, M.G.; Belli, M.C.; Saavedra, Y.M.; Silva, D.A.L.; Moris, V.A.D.S. Comparative LCA of conventional manufacturing vs. additive manufacturing: The case of injection moulding for recycled polymers. Int. J. Sustain. Eng. 2021, 14, 1604–1622. [Google Scholar] [CrossRef]
- Nyika, J.; Mwema, F.M.; Mahamood, R.M.; Akinlabi, E.T.; Jen, T.C.; Mwema, F.M.; Mahamood, R.M.; Akinlabi, E.T.; Jen, T.C. Advances in 3D printing materials processing-environmental impacts and alleviation measures. Adv. Mater. Process. Technol. 2021, 8, 1275–1285. [Google Scholar] [CrossRef]
- Tagliaferri, V.; Trovalusci, F.; Guarino, S.; Venettacci, S. Environmental and Economic Analysis of FDM, SLS and MJF Additive Manufacturing Technologies. Materials 2019, 12, 4161. [Google Scholar] [CrossRef] [Green Version]
- Andronov, V.; Beránek, L.; Krůta, V.; Hlavůňková, L.; Jeníková, Z. Overview and Comparison of PLA Filaments Commercially Available in Europe for FFF Technology. Polymers 2023, 15, 3065. [Google Scholar] [CrossRef] [PubMed]


| Material | Melting Temp Range (°C) | Thermal Resistance (°C) | ||
|---|---|---|---|---|
| UltiMaker PLA | [200, 210] | 1.24 | 2.85 ± 0.10 | 59 |
| UltiMaker ABS | [225, 260] | 1.1 | 87 | |
| UltiMaker Tough PLA | [210, 220] | 1.24 | 58 |
| Parameter | Value | ||
|---|---|---|---|
| Layer Height (mm) | 0.2 | ||
| Infill pattern | lines | ||
| Infill density | 30% | ||
| Material consumption (g) | 3 | ||
| Build plate adhesion type | Skirt | ||
| Material | PLA | T-PLA | ABS |
| Temperature (°C) | 210 | 225 | 250 |
| Printing speed (mm/s) | 60 | 40 | 55 |
| Process Parameter | Range of Change | ||
|---|---|---|---|
| Material | PLA | T-PLA | ABS |
| Printing temperature (°C) | [190–230] | [205–245] | [240–260] |
| Printing speed (mm/s) | [50–70] | [30–50] | [45–65] |
| Layer height (mm) | [0.1–0.3] | ||
| Infill percentage | [30–90%] | ||
| Infill pattern | Lines, grid, cubic and concentric | ||
| Material/Activity | Unit | PLA | ABS | T-PLA |
|---|---|---|---|---|
| Raw material production | kg | 0.003 | 0.003 | 0.003 |
| Extrusion of filament | kWh | 5 × 10⁻⁶ | 5.07 × 10⁻⁶ | 2.75 × 10⁻⁴ |
| Transportation | tkm | 0.0146 | 0.0146 | 0.0146 |
| 3D printing | kWh | 0.038 | 0.055 | 0.049 |
| PLA | T-PLA | ABS | |
|---|---|---|---|
| Complexity | 8% | 0% | 0% |
| Layer height (mm) | 59% | 61% | 54% |
| Infill density (%) | 29% | 35% | 22% |
| Temperature (°C) | 3% | 2% | 4% |
| Speed (mm/s) | 24% | 35% | 20% |
Disclaimer/Publisher’s Note: The statements, opinions and data contained in all publications are solely those of the individual author(s) and contributor(s) and not of MDPI and/or the editor(s). MDPI and/or the editor(s) disclaim responsibility for any injury to people or property resulting from any ideas, methods, instructions or products referred to in the content. |
© 2023 by the authors. Licensee MDPI, Basel, Switzerland. This article is an open access article distributed under the terms and conditions of the Creative Commons Attribution (CC BY) license (https://creativecommons.org/licenses/by/4.0/).
Share and Cite
Mecheter, A.; Tarlochan, F. Fused Filament Fabrication Three-Dimensional Printing: Assessing the Influence of Geometric Complexity and Process Parameters on Energy and the Environment. Sustainability 2023, 15, 12319. https://doi.org/10.3390/su151612319
Mecheter A, Tarlochan F. Fused Filament Fabrication Three-Dimensional Printing: Assessing the Influence of Geometric Complexity and Process Parameters on Energy and the Environment. Sustainability. 2023; 15(16):12319. https://doi.org/10.3390/su151612319
Chicago/Turabian StyleMecheter, Asma, and Faris Tarlochan. 2023. "Fused Filament Fabrication Three-Dimensional Printing: Assessing the Influence of Geometric Complexity and Process Parameters on Energy and the Environment" Sustainability 15, no. 16: 12319. https://doi.org/10.3390/su151612319