Article

The Impact of Land Use Changes on Carbon Flux in the World’s 100 Largest Cities

School of Earth and Environmental Sciences, The University of Queensland, St. Lucia, QLD 4067, Australia
*
Author to whom correspondence should be addressed.
These authors contributed equally to this work.
Sustainability 2023, 15(16), 12497; https://doi.org/10.3390/su151612497
Submission received: 4 July 2023 / Revised: 11 August 2023 / Accepted: 14 August 2023 / Published: 17 August 2023
(This article belongs to the Section Sustainable Urban and Rural Development)

Abstract

:
Urbanization has become an important player in the global carbon cycle, and land use change is the second largest source of carbon emissions. However, despite great advances in remote sensing and satellite imagery, there is no reliable estimate of the impact of land use change on changes in land carbon stock in global cities. This paper quantified the impact of land use change on land carbon flux in the world’s 100 largest cities by using annual land cover data based on LandSat 8 images and land carbon stock parameters provided by the IPCC (Intergovernmental Panel on Climate Change). It was found that significant urban expansion could be observed in 83 cities, while 29 cities showed a deforestation trend, and croplands in 42 cities have shrunk. Carbon stock reduced by more than 112 million tons in the 100 selected cities from 2013 to 2022 due to land cover change. A total of 39 cities showed significant negative trends in land carbon stock that were mainly caused by urban sprawl and shrinkage in forest or cropland, among which Kolkata, Chongqing, Seoul, Guangzhou, and Hefei showed the greatest decline. Because of the growth of forest and cropland, or reduction in barren land and grassland, 28 cities showed clear positive trends in land carbon stock. In order to increase urban land carbon stock, the urban planning of most cities should focus on the protection of forests or afforestation that replace barren land or grassland and should avoid mindless urban expansion.

1. Introduction

One of the most influential factors in human-induced global environmental change over the past two hundred years has been the shift in land and resource use associated with urbanization and the expansion of low density development [1,2,3]. Currently, over 50% of the world’s population lives in urban areas, and this is going to reach 70% by 2050 [4]. This proportion has already reached 81% in the US and 95% in California [5]. With urban population growth, global urban land cover may increase by 1.2 million km2 in 2030, nearly tripling the world’s urban area in 2000 [6]. The creation and expansion of cities and urban areas are typically associated with significant carbon emissions through the removal of vegetation, the addition of impervious surfaces, and increases in local fossil fuel usage. Around the globe, rates of land cover change and losses in terrestrial carbon storages are expected to increase significantly in the coming decades as the population continues to grow [7,8,9,10]. Accurate quantification and mapping of these stocks are critical for integrating urban forestry in local climate action plans, carbon offset markets, and urban planning for sustainable development.
Currently, several studies have evaluated carbon flux caused by land cover change in several cities worldwide. For instance, Ghaffar et al. [11] assessed the change of carbon sources and sinks through land cover change in Bangkok, Thailand. This article discovered rapid urbanization and shrinkage of cropland in Bangkok Metropolitan Area; however, it did not form a quantitative analysis between the growth of carbon release and significant changes of urban land cover. Studies of Xu et al. [12], Wang et al. [13], and Gao et al. [14] only considered the loss of carbon sequestration capacity caused by the decline of greenspace when analyzing regional carbon balance in Guangzhou, Beijing-Tianjin-Hebei region, and Hubei province in China, respectively. However, excluding the amount of carbon dioxide greenspace absorbed by photo-synthesis, land carbon flux mainly refers to the change of carbon stored in biomass and soil [15]. At present, land use change is the second largest source of carbon emissions, after energy consumption [16]. Globally, about 1.1 Pg of carbon is released into the atmosphere each year from net land use change [17]. Although much research has analyzed land carbon flux (land carbon emission or sink) by calculating the difference of total land carbon stock caused by land cover change in respective regions [15,18,19,20], these current studies only focused on a single city/region to analyze land carbon flux using different data source and methods, and their conclusions are only associated with their case study area. Therefore, the results these studies produced may prove difficult to compare with other results. While the study of Churkina [21] summarized carbon flux in major urban areas globally, actual land cover datasets were not applied. This happened because, despite great advances in remote sensing technology, it was still difficult to obtain global land cover datasets with high spatial and temporal resolution. Without a global estimate, we cannot explain the variations in urban land cover amongst countries, nor can we predict the amount of land use change that will be needed to mitigate carbon emission in many of these countries.
This study aimed to understand the impact of land use changes on carbon stocks in global cities based on uniformed datasets and methods. Using the world’s 100 largest cities as case studies from 2013 to 2022, the Landsat 8 (30 m) database was used to identify the land use patterns of these cities in time. The carbon stocks of these cities were estimated with land use type coefficients under different climate zones provided by IPCC. Multivariate linear regression was used to estimate the extent to which land use changes have impacted the carbon stocks in these cities. The results from this study provide new estimates and insights into the impact of urban expansion and the effect of associated land cover changes on terrestrial carbon stocks.

2. Materials and Methods

The method flowchart applied in this study is demonstrated in Figure 1 below.

2.1. Selection of Cities

Both the population density and size of urban areas were used to choose global cities in this study. In previous studies, spatial datasets of population density were widely applied as the base to extract urban areas in a global or national range [22,23,24]. Among these, studies of Weiss et al. [23] and Mori et al. [24] extracted urban area worldwide based on the Land Scan 2020 global population density database [25], where areas with a population density greater than 1000/km2 and a total population of at least 10,000 within a continuous area were identified as urban areas. According to the same database, we added the size of urban area as another metric because if only population density was used, most of the selected top cities would be only in Asia. As there is a high population density in rural regions of India, Bangladesh, Pakistan, and Indonesia, these areas were excluded. In addition, the urban areas with limited availability of remote sensing images because of high cloud cover were excluded to ensure the quality of the analysis. Consequently, the top 100 largest cities selected covered seven continents, although Asia and North America included more cities than other continents (Figure 2a).
To better capture the pattern of land use change in all cities, 15 km buffers were created around the selected urban areas to include the land use changes in the adjacent areas rather than the administrative divisions. In addition, spatially interconnected cities were treated as a single study area. For instance, the largest study site among the 100 cities is a delta city cluster of the Pearl River in China that is headed by Guangzhou but also contains four nearby cities: Dongguan, Shenzhen, Foshan, and Zhuhai (Figure 2b). Three other selected study sites that contain more than one city are as follows: Wuxi and Changzhou, Hangzhou and Shaoxing in China; Essen and Dortmund in Germany.

2.2. Land Use Classification

The study period of this research was set from 2013 to 2022 to reflect the land use change in recent decades. Most of the existing global land cover datasets were generated based on SPOT or MODIS satellite images, which have low spatial resolution (300 m–1 km) [26,27]. Land use datasets based on higher resolution images, such as Landsat (30 m resolution), have insufficient temporal span and are only available in specific years. For example, the only available global land use datasets based on Landsat images are FROM-GLC produced by Tsinghua University [28], which only include data from 2010, 2015, and 2017. This study classified land cover into 16 classes (Table 1) based on Landsat 8 (30 m) using a pre-trained deep learning package in the ArcGIS Pro 3.0 environment [29]. Landsat 8 images were selected within the same period (within two months each year) to reduce the impact of seasonal variation. This method can not only produce land use data with a high spatial resolution for continuous years, but it also has an acceptable classification accuracy. The classification accuracy was tested for land cover data in Brisbane in 2017, which featured an overall accuracy of 86.08% and a Kappa coefficient of 0.804. These two indicators were 61.18% and 0.487 from FROM-GLC. (Refer to the distribution of accuracy test points and confusion matrices in Appendix A).
To generalize land use change in all study sites, 16 land cover types were grouped into six land cover groups. Specifically, developed area includes four subclasses, forest includes three subclasses, grassland includes shrub and herbaceous, cropland includes pasture and cultivated crops, wetland includes two subclasses, and barren land is its own group. Perennial snow/ice and waterbody were omitted since they occupied small areas and varied slightly.
After generating land use datasets for each city, Pearson correlation was applied between area of each land use group and time to detect trends of land use changes. Correlations with a coefficient above 0.3 were considered evidence of a strong trend [30].

2.3. Carbon Stock Calculation

The unified carbon stock calculation technique recommended by IPCC was adopted in this study to calculate and analyze carbon stock changes of different land use types in cities, which has been widely applied and justified in previous studies [11,22,31]. According to IPCC 2019 [32], carbon stock changes for each land cover type can contain one or more carbon stock/emission component, such as above-ground biomass, mineral soil, waste carbon stock, dead wood carbon stocks, and CO2 emission in wetland. Specifically:
C s o i l   ( W e t l a n d ) = ( S O C M s S O C E ) × A W e t l a n d
C s o i l   ( S e t t l e m e n t ) = S O C A B × A S e t t l e m e n t
C s o i l   ( F o r e s t ) = ( S O C A B + S O C M S + S O C L C + S O C D W ) × A F o r e s t
C s o i l   ( G r a s s l a n d ) = S O C M S × A G r a s s l a n d
C s o i l   ( C r o p l a n d ) = ( S O C A B + S O C M S ) × A C r o p l a n d
In Equations (1) to (5) above, Csoil refers to the annual carbon stocks of different land-use soils; A represents the area of corresponding land use type; SOCMS represents the carbon stock of mineral soil at a 0–30 cm depth; SOCE means carbon emission component from wetland; SOCAB represents carbon stock from above-ground biomass; SOCLC represents the carbon stock component of waste; SOCDW represents the carbon stock of dead wood.
Datasets from the Reports of the Intergovernmental Panel on Climate Change [32], the 2013 Supplement (wetlands) [33], and the research of Godwin et al. [34] were used to calculate carbon stock/emission components mentioned above for each land use type in different continents and in different climate zones. As a result, Table 2 was used to calculate the carbon stock/emission components for different land use types. It should be noted that barren land was not included in the calculation above since it does not contain any carbon stock component and its carbon stock is considered to be zero [32].
For each city, the carbon stock was calculated each year during the study period based on annual land cover datasets. Pearson correlation was applied again between land carbon stock and time to detect the trend of changes. Correlations with a coefficient above 0.3 were considered evidence of a strong trend [30].

2.4. Evaluation of the Impacts of Land Use Change on Carbon Stocks

According to the correlation analyses in Section 2.2 and Section 2.3, cities that showed a significant trend in carbon stock change were further analyzed by stepwise multiple regression. For these cities, area changes of land use groups with a clear trend were selected as independent variables, and they were introduced into the model one by one. The annual land carbon flux was set as the dependent variable. After eliminating land use groups with insignificant influence, the multivariable regression models with a p value lower than 0.05 [35] were generated and classified into several groups to generalize how land use changes impact carbon flux in the selected cities.

3. Results

3.1. Average Annual Change of Six Land Use Types of 100 Cities from 2013 to 2022

The area of 100 study sites around the world ranges from 19,548 km2 (the Pearl River Delta city cluster) to 1687 km2 (Cape Town in South Africa). There are seven cities with areas exceeding 7500 km2. Five of them are located in Asia: Guangzhou (Pearl River Delta city group), Tokyo, Kolkata, Dhaka, and Jakarta. The areas of 20 cities range from 5000 to 7500 km2 and are mainly in North America, China, and Southeast Asia. The other 73 cities with areas less than 5000 km2 are distributed throughout all continents in the world.
Most cities that were selected (83 out of 100 cities) had a significant trend of urban expansion during the 10 years (Figure 3). A total of 25 cities showed a relatively high urban expansion speed, with an average annual growth of 20 to 50 km2, mainly located in China, India, and the US. Rapid urban expansion could be found in 19 cities that are also mainly distributed in China and India. Among them, Guangzhou (Pearl River Delta city group) had the highest rate of urban expansion, which was 193 km2 annually. The annual urban expansion area of 39 cities was less than 20 km2. These are mainly located in Europe, the Middle East, and America. Three cities in South Africa and two cities in Australia showed slower growth speeds (10.4 km2 and 6.9 km2 annually in Sydney and Brisbane, respectively). Compared with the study of Novotný et al. [36] that predicted urban expansion in 43 megacities from 2015 to 2030, the annual urban expansion rates produced by our study are similar in corresponding cities.
It seems that only Tokyo, Japan, where the developed areas decreased by around 31 km2 annually during the study period, showed that the city was well developed, and the urban green space showed a slight expansion trend. The urban areas in 16 cities had no obvious trends of change, and they are mainly distributed in Europe and in North/South America.
Significant change trends in the forest were observed for half of the cities studied. A total of 16 cities showed slight forest expansion, ranging from 0.2 to 17.7 km2. Five cities experienced significant forest expansion, with Beijing, China, experiencing the highest forest growth rate of 41.3 km2 annually. Eleven cities had high forest decreasing rates, whose forests reduced below 20 km2. Kolkata in India had the highest reduction rate, with a −193.7 km2 decrease of forest annually. Moderate forest reduction (−20 to −1.5 km2 annually) during the study period was shown in 18 cities that are scattered in all continents. Moreover, the other 50 cities had no significant trend of change in forest in the given period.
A relatively significant increase trend of grassland was observed in 15 cities that are mainly located in Europe, among which the grassland expanded by 140.7 km2 annually in Cairo, the most rapid growth. A decrease trend of grassland was shown in 39 cities, with most of them distributed in India and China. For 17 cities, the reduction area was above 30 km 2 each year. New Delhi in India had the highest annual reduction, with −217.3 km2 of grassland shrinkage annually. The other 46 cities had no obvious trend in grassland change.
There was a relatively significant increase/decrease trend of cropland in 57 cities. Among these, cropland expanded by 105.4 km2 each year in New Delhi, much higher than all other cities. The area of cropland in 25 cities showed a moderate decrease trend, with an average annual decrease of less than 20 km2. The other 17 cities had a higher decreasing rate, with the fastest shrinkage in cropland being in Beijing, with a 109.1 km2 decline each year.
Wetlands tend to be distributed in coastal cities or cities with waterbodies of a certain scale, where clear trends of change are more likely to be observed. An increase trend was shown in 25 cities, of which Kolkata expanded the most, with an annual increase of 111.2 km2. There was an obvious shrinking trend in 22 cities, among which wetland in Dhaka in Bangladesh featured the fastest reduction, with an annual decrease of 178 km2, while 53 cities had no obvious trend of wetland change.
Among the 49 cities showing relatively obvious trends in barren land, slow barren land expansion was identified in 24 cities that are scattered around the world. Seoul in South Korea had the fastest expansion, reaching 9.8 km2 each year. Only five cities had an annual decrease of more than 10 km2, including Cairo, Amman, Riyadh in the Middle East, Karachi in Pakistan, and Chongqing in China. In contrast, more than half (51) of the 100 cities had no clear trend of change in the barren land.

3.2. Average Annual Change in Carbon Stock within 100 Cities

According to Equations (1) through (5) and Table 2, land carbon stocks per unit area in forest, grassland, cropland, and wetland vary due to different climate conditions. In general, forests had the highest carbon stocks on a global scale, followed by cropland and wetland. The stock volumes were the lowest in developed area and grassland, except for barren land, whose land carbon stock is zero. The land use changes that led to carbon fluxes varied in 100 cities. The expansion of land use types with higher carbon stocks was used to occupy land use types with lower carbon stocks, resulting in increased land carbon stocks; in contrast, negative land carbon fluxes tend to result from increases in developed area or grassland and decreases of forest, cropland, or wetland.
The total volume of carbon stock in all study sites decreased by 112,211,487.9 tons in the past ten years due to land cover change. Specifically, 39 cities had significant decrease trends in carbon stock from 2013 to 2022 that are distributed in all continents in the world and mainly in China (Figure 4). A total of 21 cities showed a relatively low rate of decline (within 300,000 tons of carbon stock per year). In these cities, Houston, Dallas, Milan, Budapest, and Phoenix, they lost cropland, which was mainly transformed into developed area. In New York, Monterrey, and Sydney, urban expansion mainly occupied the original area of forest. Both forest and cropland decreased in Guatemala, Santiago, and Denver. The land carbon stock decreased by 135 tons km2 per year in San Francisco, which is close to an average of 1.2 Mg C ha−1 yr−1 in Seattle produced by the study of Hutyra et al. [18]. Among the remaining 18 cities whose decrease rates were higher than 300,000 tons, Kolkata in India had the sharpest downtrend in carbon stock, with 2,503,007 tons of net carbon release per year caused by shrinkage in forest and cropland. Forest reduction was one of the main reasons that caused negative carbon fluxes in these cities.
In contrast, a significant increase trend could be observed in 28 cities, with many of them located in India and the Middle East, while others are scattered across the US, China, South Africa, and Australia. There were 17 cities with growth rates lower than 300,000 tons annually. Among them, carbon stock increased since the land cover converted from grassland to developed area in San Diego, Tehran, Tashkent, Bengaluru, Hyderabad, Ankara, and Johannesburg. In cities with an arid climate, including Las Vegas, Riyadh, Karachi, and Amman, the replacement of barren land with developed area also resulted in carbon stock increase in a moderate rate. In the other 11 cities with a higher increase (rate more than 300,000 tons each year), Xi’an had the highest growth rate in carbon stock where developed area and forest expanded significantly and replaced grassland, reaching an average of 803,478 tons annually. Significant carbon stock growth in Beijing, Moscow, Tokyo, and Paris was also caused by forest expansion.
The volumes of carbon stock in 33 cities did not show a significant trend of change. They are mainly distributed in North America and Europe, and a few cities are in Northern China. Grassland shrinkage could be observed in nine cities, among which grassland in Qingdao, Istanbul, Asuncion, Jinan, Austin, Bogota, and Kabul were mainly converted to urban areas. Cropland in Quanzhou, Taiyuan, Guadalajara, St Petersburg, Toronto, and Fukuoka was reduced significantly and changed to other land cover types. (Refer to Appendix B for specific data of average annual carbon flux changes and land use changes in all cities).

3.3. Regression Models between Carbon Flux and Land Cover Change in the Selected Cities

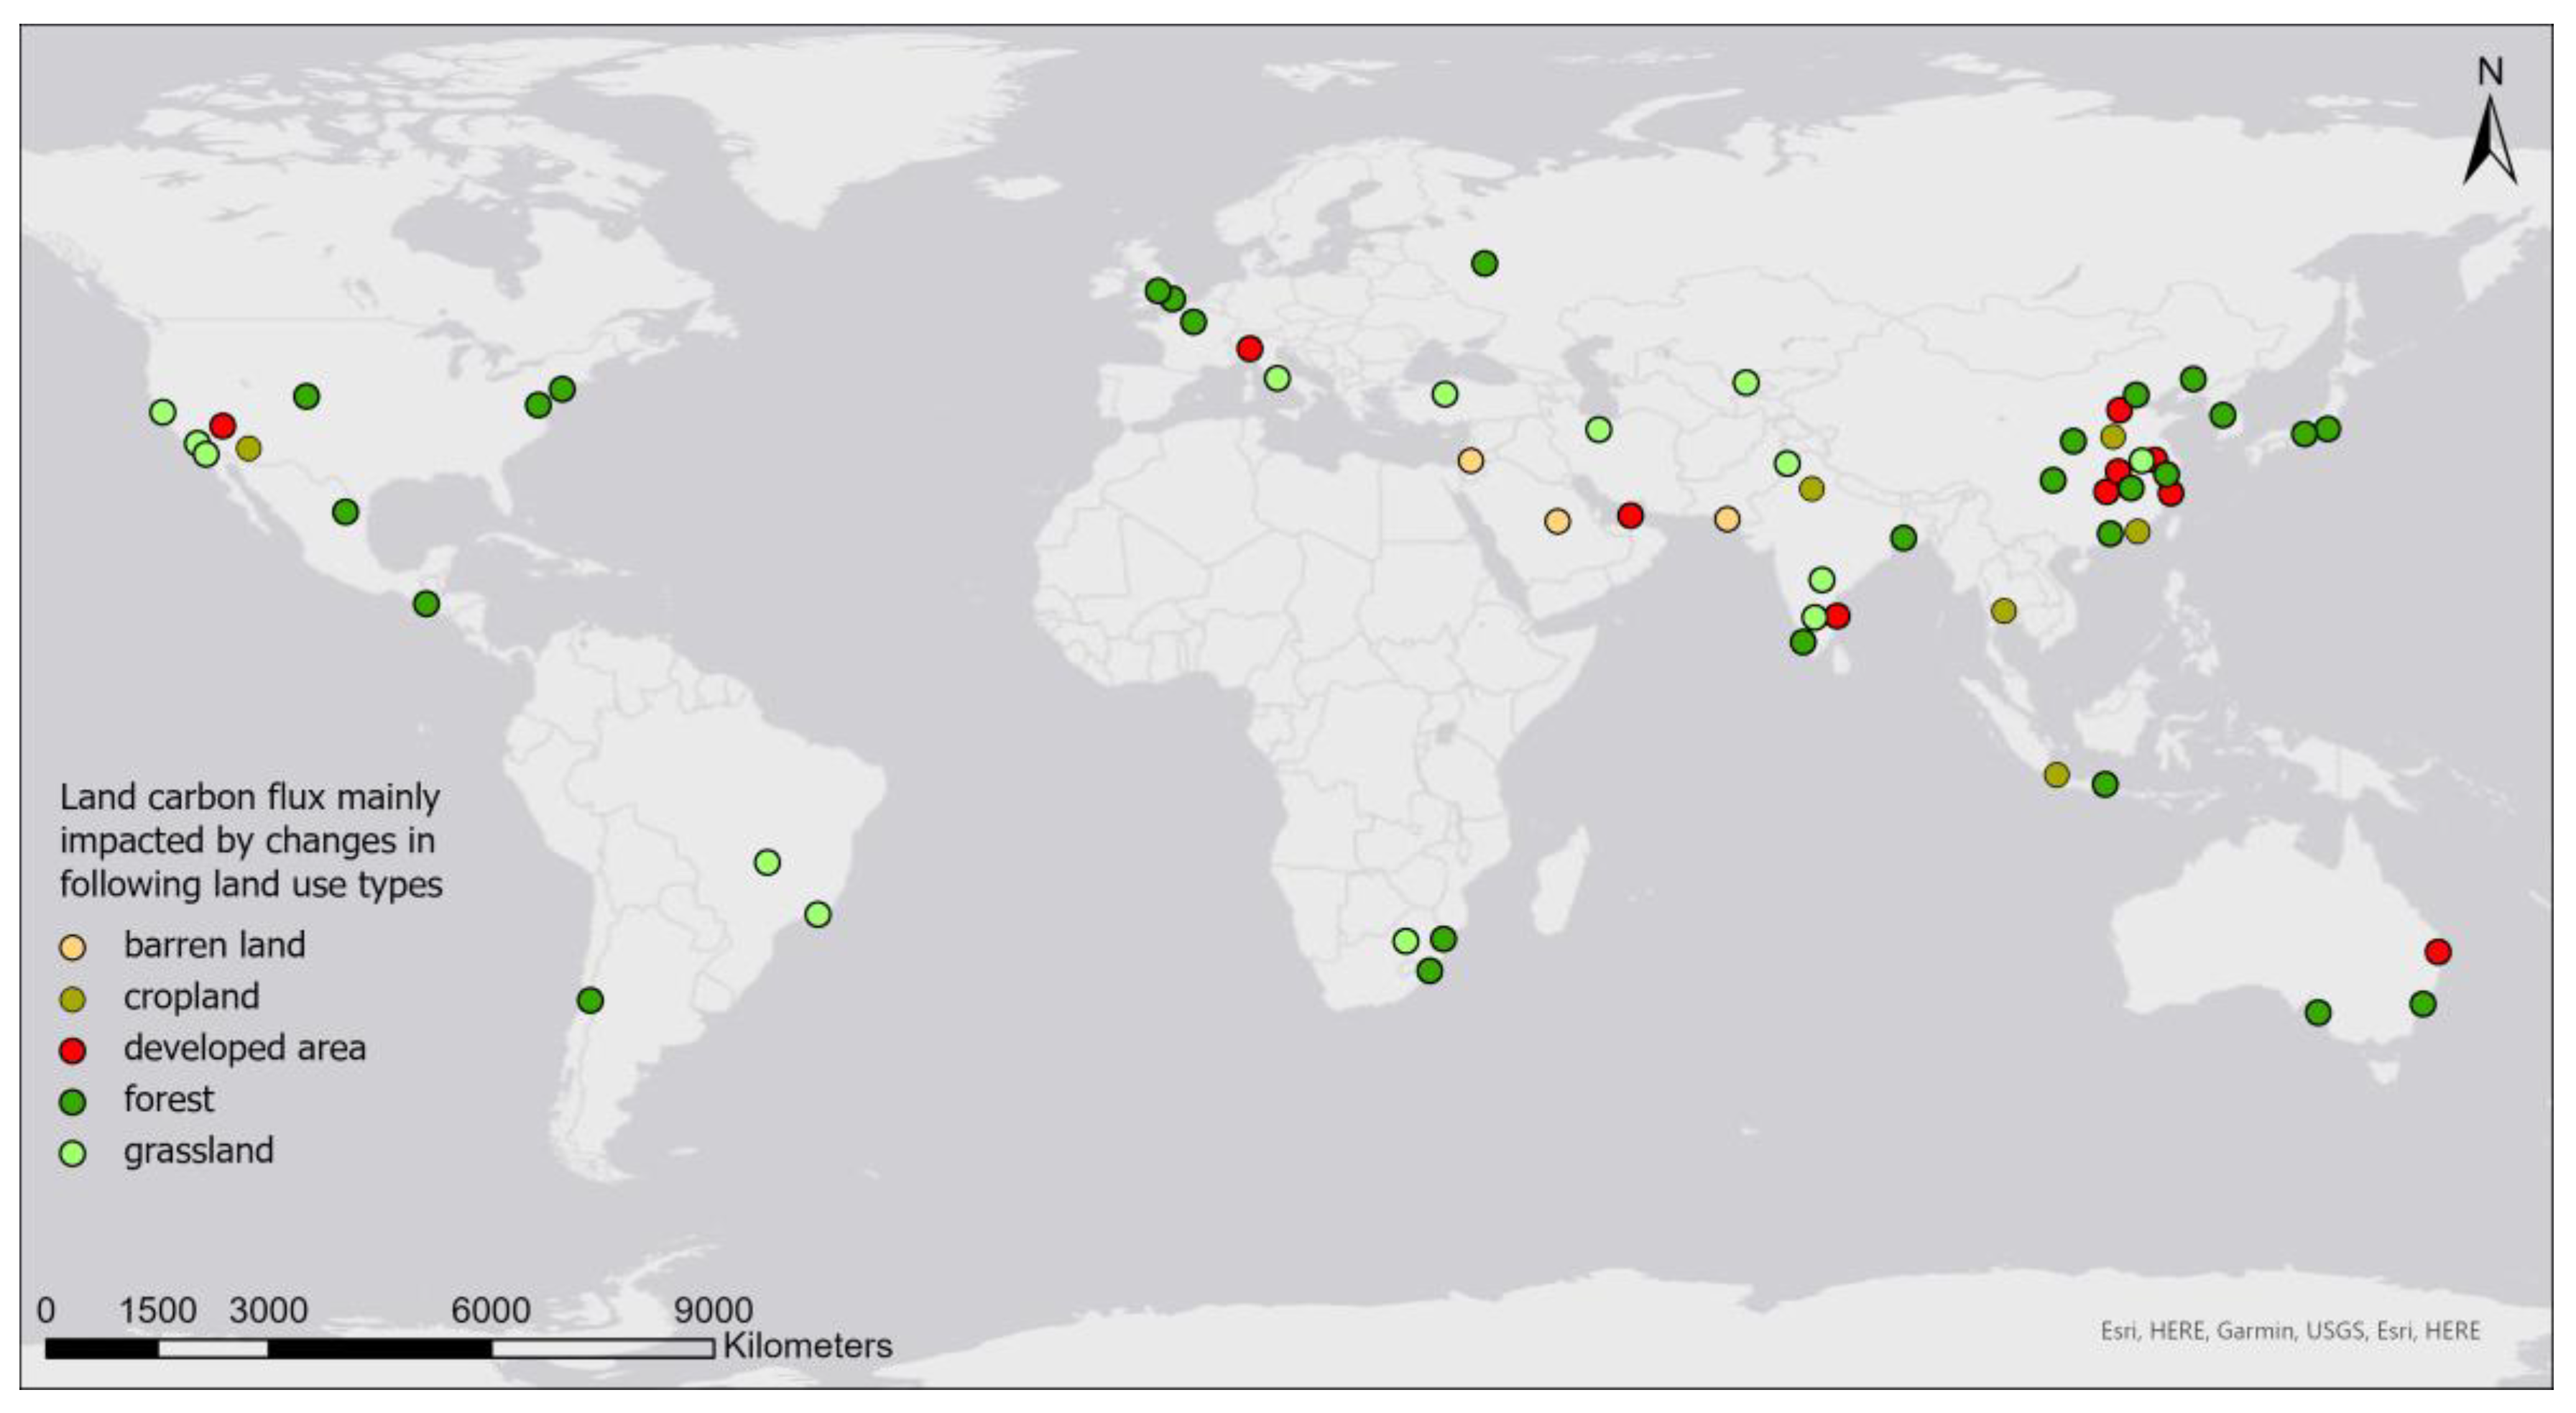
Among the 67 cities demonstrating significant changes in land carbon stock, the carbon stock changes in 60 cities could be well explained by changes in one or two land cover groups. These 60 cities were divided into five groups and 15 subclasses based on land use types that significantly contributed to changes in carbon stock (Figure 5, Table 3). The land carbon fluxes in such cities were mainly driven by the change in forest, grassland, developed area, cropland, and barren land, respectively.
According to the standardized regression coefficients (Beta), there were 27 cities whose carbon stock changes were mainly driven by the change of forest within their respective extents (Table 3), and the coefficients of forest were all positive in the respective regression models. In eight cities where developed area change was the second independent variable that impacted land carbon fluxes, the land carbon fluxes were negatively correlated with developed area in Chongqing, Nanchang, Xi’an, Tokyo, and Sydney. Among these, only Xi’an and Tokyo had increased carbon stock due to reforestation. In six cities where land carbon fluxes were also driven by, and positively correlated with, the change of cropland in addition to forests, the land carbon stock reduced in Nagoya, Seoul, and Santiago, where both forest and cropland shrunk in such cities. In Adelaide, Moscow, and Beijing, forest expansion and cropland reduction were the main causes of positive land carbon fluxes. In Washington and Maputo, land carbon stock reduction was driven by the change in forest and wetland. These two cities both showed forest shrinkage within the study period. The wetland reduced in Maputo and expanded slightly in Washington, which could not offset the negative effects of forest loss on land carbon flux. In the other 11 cities where forest change was the sole independent variable, land carbon stock decreased in Guangzhou, Hangzhou, Shenyang, Surabaya, Kolkata, London, Birmingham, New York, and Monterrey with forest shrinkage. A significant forest expansion trend could be observed in Paris and Durban, which increased carbon stock in these cities.
Land carbon stock changes in 14 cities were mainly caused by, and negatively correlated with, changes in grassland. Among them, forest changes in San Diego, US, and Hefei, China, was the second influencing factor, which was positively correlated with carbon fluxes. Among them, slight forest expansion and grassland shrinkage increased land carbon stock moderately in San Diego; the rapid decline in carbon stock in Hefei was caused by deforestation and grassland expansion. Change in barren land was the second independent variable in Tehran. The conversion of grassland and barren land to other land use types resulted in a positive land carbon flux in this city. In the remaining 11 cities, significant grassland decreased, leading to the growth of land carbon stock in Los Angeles, Johannesburg, Rio de Janeiro, Ankara, Tashkent, Hyderabad, Bengaluru, and Lahore. In contrast, negative land carbon fluxes observed in San Francisco, Goiania, and Rome were caused by grassland increase.
Changes in developed areas was the main variable leading to carbon stock changes in 10 cities. It negatively correlated with land carbon fluxes in these cities, except for Las Vegas and Dubai, where carbon stock increased due to developed area expansion and the reduction of barren land. Among three cities where carbon stock changes were also driven by cropland changes, urban expansion occupying the original cropland led to the reduction of carbon stock in Milan. In Chennai, India, land carbon stock increased due to rapid growth in cropland that offset the negative effect of expansion in developed area. Grassland changes was the second influencing factor that negatively correlated with carbon stock in Shijiazhuang, Nanjing, and Changsha; only Shijiazhuang featured positive land carbon flux in the past ten years. Carbon stock decreased in the remaining two cities, Wenzhou and Wuhan, which could only be explained by the rapid expansion of developed area.
Land carbon stock changes in five cities were mainly caused by changes in cropland. Among them, in Shantou and Phoenix, carbon stock reduction was also affected by the change in developed areas. However, changes in cropland and developed area were both negatively correlated with carbon flux in Shantou, in contrast to Phoenix, where the coefficients of these two variables were positive. In addition to the shrinkage of cropland, the decrease in land carbon stock in Zhengzhou was also caused by forest degradation. For Jakarta and Bangkok, which showed negative carbon fluxes, their land carbon fluxes were only driven by cropland shrinkage.
In three cities from the last group (Karachi, Riyadh, and Amman) located in arid regions, the growth in land carbon stock was mainly driven by the shrinkage of barren land, similar to Las Vegas and Dubai mentioned above. (Refer to Appendix C for all parameters of regression models corresponding to 60 cities).

4. Discussion

According to land use change analysis, Significant urban expansion could be observed in 83 cities, implying rapid urbanization is a global phenomenon. While 29 cities showed a deforestation trend, forest expansion only occurred in 21 cities. Cropland in 42 cities shrunk, while only 15 cities expanded their areas for agriculture. As the result of these urban land use changes, 112,211,487.9 tons of net carbon was released into the atmosphere from these 100 cities in the past 10 years.
A significant reduction trend of land carbon stock could be observed in 39 cities that are distributed on all continents and are mainly concentrated in Asia. They include, for example, Seoul, Guangzhou, Chongqing, Bangkok, Jakarta, and Kolkata. Most of them featured rapid urbanization in the past 10 years, where a decrease in forest and/or croplands that were occupied by developed areas, which was the main reason for a negative land carbon flux. Land use conversions that led to carbon stock decrease in these cities could be generalized into two main patterns. The first pattern featured urban expansion that occupied forest, mainly including Chongqing, Shenyang, Nanchang, Surabaya, Kolkata, and Kochi in Asia and Washington, New York, Denver, Monterrey, Santiago, London, and Birmingham in America and Europe. Although the urban expansion rates and forest decreasing rates of cities in developed countries are generally lower than that in developing countries, clear reduction trends of carbon stock in all the cities mentioned above require forest reservation and the limitation of urban sprawl. The second land use change pattern refers to cropland reduction that was converted to developed area, mainly including Guangzhou, Shantou, Wuhan, Bangkok, Seoul, Phoenix, and Milan. With the development of such cities, the primary industry (agriculture) might be occupied by secondary or tertiary industries [37]. To maintain total land carbon stock, blind urban sprawl should also be avoided through greenspace preservation or planning.
Positive carbon fluxes (increased land carbon stock) in 28 cities were mainly caused by an increase in forest or cropland and by shrinkage in grassland or barren land. They included, for example, Paris, Tokyo, New Delhi, Chennai, Las Vegas, and Dubai. Some of them are well-developed, such as Paris and Tokyo, where developed area remained unchanged, and green space was preserved; the others still featured significant urban expansion, accompanied by barren land shrinkage or agricultural development that increased total land carbon stock. Such land use conversions in these cities could also be generalized into three patterns.
First, forest growth in cities such as Paris, Tokyo, Moscow, Adelaide, Durban, Beijing, and Xi’an increased their carbon stock. The first five cities are well-developed, where developed area changes were insignificant. Beijing and Xi’an still featured rapid urban expansion; however, the increase in forest area in these two cities offset the negative impact of urbanization on carbon stock. These cities should keep current land management policies that might be beneficial for a positive land carbon flux. The second pattern showed that cropland increased with grassland shrinkage, including several India cities, such as New Delhi and Chennai. Due to population explosion [38], these cities planned more land for agriculture, increasing their overall carbon stock. However, with urban development in the future, developed areas may occupy these agriculture lands and cause negative land carbon flux. The final pattern refers to urban sprawl that occupied grassland or barren land in cities with relatively arid climate. These cities mainly include Tashkent, Tehran, Karachi, Las Vegas, Dubai, Riyadh, and Amman. In contrast to other cities where urban expansion had a negative impact on carbon stock or shrinkage in grassland or barren land, the land use types with the least carbon stock caused positive carbon fluxes in corresponding cities. For the cities of the last two land use change patterns, more green space should also be planned with the expansion of agricultural land or urban area, which can not only continuously increase the local land carbon stock but also reduce the impact of global climate change [39,40].
Land carbon stock had no obvious trend in 33 cities that are mainly located in North America, Europe, and East Asia, including Osaka, Shanghai, Dhaka, Cairo, and Mexico City. In some of these cities, changes in all land use types were insignificant. In other cities, conversion between grassland and developed areas had no significant effect on total carbon stock.
Cities support livable, sustainable, and resilient dwelling conditions by providing various ecological services, such as livelihood, reduced pollution, water regulation, carbon sequestration, biodiversity, recreation, shading, and heat stress relief [41,42]. Therefore, cities are complex adaptive systems, and the impact of land use change on land carbon stock should be considered from the whole-of-system perspective. For example, deforestation and de-agriculture imply less land carbon stock, and the fragmented land structure of urban green space also threatens the native plants and animals that mainly live in the “urban green-islands” in the metropolitan area [20]. These land cover changes degrade ecological services and provide less support for livelihood in developing countries. In addition, urban forests play an important role in the carbon cycle of the whole ecosystem. According to the study of McPherson et al. [43], urban forests are estimated to account for 2 percent of the total C stored and sequestered annually by trees, and they are responsible for 20 percent of the total reduction of carbon emissions in California. For the cities that contributed most to increasing atmospheric carbon concentration by land use change, including Kolkata, Chongqing, Guangzhou, and Seoul, urban management should focus on the limitation of rapid urban expansion and the protection of forests. In the group of 33 cities that did not show an obvious trend, not much should be conducted without a significant change of land use, but for other cities, a close eye should be kept on the changes of land use. For cities with positive land carbon fluxes due to barren land shrinkage or cropland expansion, more green space should also be planned since it can store a substantial amount of carbon and increase the adaptive environment for urban residents [13,43]. It is hoped that those well-developed cities continue to increase land carbon stock in the future by land planning and management. Furthermore, more than half of the population will live in urban areas by 2050 [44], and the global temperature is projected to warm by more than 1.5 degree on average by 2100 [45]. These challenges should also be considered in future urban use planning.
Compared to current studies that often focus on several cities at discontinuous time points [11,12,13,14,15,16,17,18,19,20,46,47,48], this study expanded study areas to the 100 largest cities that are distributed around the world and generated annual land cover datasets with high spatial resolution from 2013 to 2022 to analyze the changing trends for six land use groups in these cities. This study reflected on the recent comprehensive trend of the impact of urban land use change on land carbon stock in the world. It will assist the urban land use planning and management in these cities to increase the total volume of land carbon storage and will enable comparison and learning from each other based on carbon mitigation efforts between cities.
There are several limitations related to data sources and methods applied in this research. First, this research only considered carbon flux caused by the change in land carbon stock. Carbon dioxide emitted by other anthropogenic activities, such as energy consumption and industrial production processes, was not included. Since carbon sequestration by the photosynthesis of greenspace or land carbon flux can only offset a small proportion of carbon emission by human activities [12,13], our study cannot tell whether cities are carbon neutral. The second issue refers to the reliability of datasets. In a few cities located in tropical or coastal regions, high-quality satellite images were unavailable within the same month each year due to high cloud cover. When calculating carbon stock parameters for each land use type, data from IPCC database were uniform within the same climate type in a continent, which varied among different cities [49,50,51]. Additionally, in contrast to taking spatial visualization of changes in land carbon stocks within limited study extents [12,13,18,19,20], we were not able to take a spatial analysis of land carbon flux within each city due to the large amount of study sites. Thus, further studies require more reliable and accurate datasets, and carbon emission from anthropogenic activities should be calculated to assess carbon neutrality.

5. Conclusions

This study applied uniformed land use data and methods of calculating land carbon stock and analyzed the impact of land use changes on carbon stocks in 100 cities worldwide. According to the results of this research, the volume of carbon stock reduced by 112,211,487.9 tons in total among 100 selected cities from 2013 to 2022 due to land cover change. A total of 33 cities did not show a significant trend of annual carbon flux change within the study period. Among the remaining cities, 28 cities had an obvious increasing trend in carbon stock, among which Xi’an in China had the highest growth rate, reaching an average increase of 803,478 tons annually. In contrast, Kolkata in India had the sharpest downtrend of carbon flux among 39 cities that showed a significant decreasing trend, with a reduction of 2,503,007 tons of carbon stock annually. There was no clear relationship between changes in carbon fluxes and the geographical distribution and population changes of the corresponding cities. Regarding the results of stepwise multiple regression between annual carbon flux and land use change in 60 cities, land use changes were generalized into five patterns. The carbon stock changes were mainly positively correlated with forest and cropland areas and negatively correlated with urban areas and grassland areas. Therefore, in order to increase carbon stock in the future, the urban planning of corresponding cities should focus on the protection of forests or afforestation that replace barren land or grassland and should avoid rapid urban expansion. Although cropland expansion is also conducive to the growth of carbon stock, it is not appropriate to plan for more cropland in the future as it may lead to other environmental issues.

Author Contributions

Conceptualization, Y.W. and J.L.; methodology, M.L. and Y.Z.; validation, Y.W., J.L. and S.W.; formal analysis, Y.Z. and M.L.; investigation, Y.Z. and M.L.; writing—original draft preparation, M.L. and Y.Z.; writing—review and editing, Y.W., J.L. and S.W.; visualization, M.L.; supervision, Y.W.; project administration, Y.W. All authors have read and agreed to the published version of the manuscript.

Funding

This research received no external funding.

Institutional Review Board Statement

Not applicable.

Informed Consent Statement

Not applicable.

Data Availability Statement

Data that support the central findings of this study are contained within the article (in Results section and Appendix A, Appendix B and Appendix C).

Conflicts of Interest

The authors declare no conflict of interest.

Appendix A

Table A1. Confusion matrix to verify land cover classification of the FROM-GLC dataset.
ClassWaterDeveloped AreaBarren LandForestGrasslandCroplandWetlandTotalU_AccuracyKappa
Water160000011794.12%
Developed area01295050013992.81%
Barren land00200002100.00%
Forest4131123432517371.10%
Grassland0665193932816923.08%
Cropland06001301030.00%
Wetland000000000.00%
Total2021413142493834510
P_Accuracy80.00%60.28%15.38%86.62%79.59%7.89%0.00% 61.18%
Kappa 0.487
Figure A1. Land cover data produced by the ArcGIS deep learning model and FROM-GLC in Brisbane 2017 and the distribution of accuracy test points.
Sustainability 15 12497 g0a1
Table A2. Confusion matrix to verify land cover classification produced by the deep learning model.
ClassWaterDeveloped AreaBarren LandForestGrasslandCroplandWetlandTotalU_AccuracyKappa
Water190000012095.00%
Developed area120833240124086.67%
Barren land02800001080.00%
Forest01012770113693.38%
Grassland01108001080.00%
Cropland011163804780.85%
Wetland0101140314765.96%
Total2021413142493834510
P_Accuracy95.00%97.20%61.54%89.44%16.33%100.00%91.18% 86.08%
Kappa 0.804

Appendix B

Table A3. The 33 cities that showed no significant trend of carbon stock change and their areas of land cover change (KM2) in six categories annually.
CityDeveloped AreaBarren LandForestGrasslandCroplandWetland
Shanghainullnullnullnullnullnull
Dhaka155.609.00nullnullnull−178.00
Osakanull7.10nullnull−8.50null
Caironull−79.60−43.20140.70−50.7014.10
Mexico Citynullnullnullnull−12.70null
San Paulonull−3.20nullnullnullnull
Miami7.700.401.20null−4.60−3.90
Toronto10.10nullnullnull−13.005.50
Istanbul35.40−2.10−4.70−27.40nullnull
Chicago1.80null3.20−0.801.80−5.50
Quanzhou23.70null8.70null−10.90−14.30
Hanoi14.40nullnull−61.5069.10null
Cape town1.60null−1.50nullnullnull
Berlinnull0.50null1.60nullnull
Qingdao49.60−6.20null−41.10nullnull
Kabul6.80nullnull−14.30null−0.60
San Antonio29.900.70null−52.3015.704.70
Essen/Dortmundnullnullnullnullnullnull
Guadalajara21.40nullnullnull−17.90null
Asuncion26.800.708.80−15.40null−14.60
Bogota8.40nullnull−18.60nullnull
Madrid4.70−1.30nullnullnullnull
Montreal5.80nullnull0.60nullnull
St Petersburg13.50nullnullnull−16.50null
Nairobi28.90nullnullnullnullnull
Taiyuan32.70−0.90nullnull−14.00null
Philadelphia6.10null2.60−0.40−1.90−7.30
Barcelonanullnullnullnullnullnull
Fukuoka4.80null−2.90null−14.805.80
Jinan27.50nullnull−21.20null−8.60
Austin24.70−0.40null−22.00nullnull
Lisbonnullnullnull6.50−5.90null
Salt Lake City7.20nullnullnull−5.50null
‘null’ represents that a land cover group does not have a clear change trend in related cities.
Table A4. The 39 cities that showed carbon stock decreases and their areas of land cover change (KM2) in six categories annually.
CityAnnual
Carbon Stock Change (Tons)
Developed AreaBarren LandForestGrasslandCroplandWetland
Kolkata−2,503,00746.70null−193.70133.20−87.70111.20
Chongqing−1,664,618119.70−17.40−88.90null−26.9012.90
Seoul−1,346,94751.109.80−36.5010.90−69.8017.70
Guangzhou−1,147,338193.00−8.00−43.00null−69.00null
Hefei−844,46524.80null−32.8046.67nullnull
San Francisco−812,2284.50null−22.5039.70−14.70−4.60
Kochi−775,27420.30null−14.60−2.2018.90−14.50
Shantou−771,37666.20nullnull−23.30−22.70null
Wuxi−580,096109.60−4.60nullnull−87.40null
Washington−563,6459.500.20−24.40nullnull11.00
London−510,620nullnull−19.40nullnullnull
Nagoya−476,33817.60null−15.00null−18.5013.60
Bangkok−467,40955.103.10nullnull−66.50null
Shenyang−417,21218.80null−16.80nullnullnull
Jakarta−390,53555.006.00−53.00null84.00null
Zhengzhou−340,84473.30null−14.20null−23.93−14.40
Nanchang−333,02137.10null−12.60nullnull−18.30
Goiania−330,4615.20nullnull71.50−72.30null
Wuhan−287,25050.40−1.907.00−3.20−58.20null
Nanjing−271,39661.90nullnull−4.79−48.30null
Buenos Aires−261,53636.50null−1.8022.70−32.80−24.80
Surabaya−259,00033.30null−20.50nullnull−17.60
New York−234,97512.70−0.90−8.00nullnullnull
Houston−234,35853.20nullnullnull−54.90−9.00
Hangzhou−233,548null−4.90−17.50−2.10null24.80
Wenzhou−225,13351.10−9.60null−33.00nullnull
Birmingham−216,8142.90null−5.800.405.70null
Guatemala−205,1839.80null−14.1026.50−24.60null
Santiago−199,39710.70null−20.70null−14.60null
Dallas−190,06831.600.37nullnull−32.80null
Monterrey−187,33419.50null−16.30null−2.602.40
Maputo−176,4907.400.90−15.10nullnull−12.80
Changsha−164,22136.80−1.10null−24.90null11.20
Rome−160,0827.20nullnull34.20−38.80−3.60
Milan−116,18211.40−0.50null1.10−6.30−2.80
Denver−111,31316.60null−4.30null−5.40−0.40
Budapest−111,1347.80−0.20null7.20−19.003.20
Sydney−46,39010.400.30−6.90nullnullnull
Phoenix−29,30426.70nullnull−11.70−16.701.00
‘null’ represents that a land cover group does not have a clear change trend in related cities.
Table A5. The 28 cities that showed carbon stock increase and their areas of land cover change for six categories annually.
CityAnnual
Carbon Stock Change (Tons)
Developed AreaBarren LandForestGrasslandCroplandWetland
San Diego23,7791.90null1.90−5.10null0.84
Las Vegas37,7369.20−5.30nullnullnullnull
Adelaide49,838nullnull6.60null−5.902.50
Tehran60,58612.90−2.600.20−13.10nullnull
Dubai71,86418.20−6.80null−11.40−0.11null
Brisbane87,3216.900.40null−5.20−13.708.30
Riyadh91,99716.90−15.10nullnullnullnull
Rio de Janeiro93,401nullnullnull−23.50null10.10
Tashkent94,78813.200.50null−19.00null−4.20
Bengaluru106,77143.400.302.20−50.301.50null
Hyderabad125,86034.500.11null−49.205.903.80
Karachi128,68920.80−24.90nullnull0.804.00
Ankara131,81414.80null2.90−19.80nullnull
Amman132,13015.90−36.80null20.800.30null
Durban157,7693.801.2025.30−37.203.802.20
Los Angeles173,662nullnull17.70−30.20−2.100.80
Johannesburg212,25923.60nullnull−49.0017.70null
Paris326,384null0.3017.60nullnull−10.30
Chennai370,18844.80−1.805.80−93.4065.30null
Mumbai372,10361.40−5.30null−70.80nullnull
Shijiazhuang487,38231.500.6211.50−70.40nullnull
Lahore498,72161.30nullnull−108.90nullnull
Beijing584,594127.60null41.30−72.00−109.107.90
Tokyo612,613−31.002.4025.30−1.70null12.80
Moscow626,284null1.5031.70null−16.10−24.10
New Delhi650,74688.207.108.00−217.30105.406.10
Accra706,77672.60nullnull−98.3030.60null
Xi’an803,47883.501.2028.10−107.20nullnull
‘null’ represents that a land cover group does not have a clear change trend in related cities.

Appendix C

Table A6. Land carbon stock changes were mainly driven by forests in 27 cities.
CityAverage C Stock Change (Tons)ConstantCoefficient
(Forest)
BetaCoefficient (Developed Area)BetaR2
Chongqing−1,664,618179,101.0529222.9630.568−8560.592−0.4790.968
Tokyo612,613−73,327.06216,215.5060.656−8367.168−0.410.997
Nanchang−333,021125,406.84514,669.1350.996−8082.77−0.3280.925
Xi’an803,478908,667.2223,823.870.996−6992.507−0.4070.941
Sydney−46,39066,539.6655344.8761.058−6422.859−0.5770.896
Guatemala−205,183−13,070.88217,461.7720.9616465.30.1860.994
Denver−111,31337,998.24526,164.0440.6957854.920.460.997
Kochi−775,274−59,724.09427,540.3570.89922,341.5760.5940.726
CityAverage C Stock Change (tons)ConstantCoefficient (Forest)BetaCoefficient (Cropland)BetaR2
Nagoya−476,338844,53.2882527.5640.8431959.6430.3920.944
Santiago−199,39769,121.28610,653.7780.8532595.6880.2180.984
Adelaide49,838−1043.09611,749.620.9342997.6420.2440.968
Moscow626,28462,620.13319,446.7470.9554966.150.1980.985
Seoul−1,346,947−51,408.34923,751.3990.9575420.9810.1860.977
Beijing584,594108,121.45825,388.5971.1875929.8140.2710.99
CityAverage C Stock Change (tons)ConstantCoefficient (Forest)BetaCoefficient (Wetland)BetaR2
Washington−563,645−25,714.36924,896.6441.1025542.6120.2040.996
Maputo−176,490−14,238.2545443.940.716592.170.4110.999
CityAverage C Stock Change (tons)ConstantCoefficient (Forest)Beta R2
Guangzhou−1,147,338−629,601.9115,076.4750.752 0.504
Kolkata−2,503,007512,879.98411,249.2980.974 0.941
New York−234,975−65,483.64512,585.5110.872 0.725
London−510,620−287,05415,362.8620.926 0.838
Paris326,384111,801.74811,378.230.803 0.595
Hangzhou−233,548188,948.89913,706.3120.823 0.632
Surabaya−259,000154,624.9418850.0350.863 0.709
Monterrey−187,334−22,465.910,015.2810.995 0.989
Birmingham−216,814−69,633.7524,583.840.792 0.575
Shenyang−417,212139,505.34815,553.5960.966 0.923
Durban157,769−37,792.3356429.1890.974 0.942
Table A7. Land carbon stock changes were mainly driven by grassland in 14 cities.
CityAverage C Stock Change (Tons)ConstantCoefficient (Grassland)BetaCoefficient (Forest)BetaR2
San Diego23,779−7566.979−3435.349−0.7255097.4650.3950.946
Hefei−844,465−167,360.435−7025.224−0.6049983.9130.5970.894
CityAverage C Stock Change (tons)ConstantCoefficient (Grassland)BetaCoefficient (Barren Land)BetaR2
Tehran60,586−27,319.32−4014.474−0.723−7959.501−0.5330.865
CityAverage C Stock Change (tons)ConstantCoefficient (Grassland)Beta R2
Los Angeles173,662−152,084.144−8599.465−0.955 0.899
Johannesburg212,259−175,44.255−4874.721−0.998 0.995
San Francisco−812,228−121,019.048−19,058.798−0.83 0.645
Rio de Janeiro93,401−5955.122−3511.036−0.82 0.625
Hyderabad125,860−92,368.218−4320.816−0.759 0.516
Lahore498,721−85,668.357−4899.407−0.981 0.957
Bengaluru106,771−8443.883−2393.63−0.96 0.888
Goiania−330,461199,362.221−7103.737−0.951 0.89
Ankara131,814−48,471.766−6354.869−0.93 0.846
Tashkent94,788−70,648.648−7422.615−0.96 0.91
Rome−160,082−9360.628−5436.285−0.854 0.691
Table A8. Land carbon stock changes were mainly driven by cropland in 5 cities.
CityAverage C Stock Change (Tons)ConstantCoefficient (Cropland)BetaCoefficient (Developed Area)BetaR2
Shantou−771,376−661,710.81−22,891.469−0.662−9186.596−0.490.877
Phoenix−29,30420,147.5818261.8870.6553811.8170.5410.665
CityAverage C Stock Change (tons)ConstantCoefficient (Cropland)BetaCoefficient (Forest)BetaR2
Zhengzhou−340,844190,169.0945657.0730.79419,837.9980.7680.759
CityAverage C Stock Change (tons)ConstantCoefficient (Cropland)Beta R2
Jakarta−390,535−1,314,222.66913.6220.755 0.508
Bangkok−467,409−100,891.034813.7370.926 0.838
New Delhi650,746-8494.5355890.3040.961 0.913
Table A9. Land carbon stock changes were mainly driven by developed area in 10 cities.
CityAverage C Stock Change (Tons)ConstantCoefficient (Developed Area)BetaCoefficient (Barren Land)BetaR2
Las Vegas37,736−19,174.7284385.2141.018−3764.492−0.3370.961
Dubai71,8643626.6533079.981.167−1921.671−0.6360.979
CityAverage C Stock Change (tons)ConstantCoefficient (Developed Area)BetaCoefficient (Cropland)BetaR2
Milan−116,18259,100.41820,321.695−1.343−15,276.04−0.5760.91
Brisbane87,321116,636.43713,422.255−1.146−5156.822−0.6570.79
Chennai370,188458,492.381−11,646.77−0.9215907.9030.8840.757
CityAverage C Stock Change (tons)ConstantCoefficient (Developed Area)BetaCoefficient (Grassland)BetaR2
Nanjing−271,396−20,622.861−8138.271−0.734−19,497.94−0.6940.627
Shijiazhuang487,382461,995.647−7984.014−0.622−4443.484−0.5670.991
Changsha−164,221235,320.62311,282.359−0.914−3435.838−0.2610.893
CityAverage C Stock Change (tons)ConstantCoefficient (Developed Area)Beta R2
Wenzhou−225,133186,843.655−9334.423−0.675 0.377
Wuhan−287,25026.964.379−7363.765−0.833 0.65
Table A10. Land carbon stock changes were mainly driven by barren land in 3 cities.
CityAverage C Stock Change (Tons)ConstantCoefficient (Barren Land)BetaCoefficient (Developed Area)BetaR2
Karachi128,689−7587.04−1937.63−0.5724189.7090.5040.998
Riyadh91,9976891.839−2047.21−1.3033091.3830.5460.998
Amman132,130−12,729.8−2189.66−1.0583870.6520.9490.975

References

  1. Ojima, D.S.; Galvin, K.A.; Turner, B.L., II. The global impact of land-use change. BioScience 1994, 44, 300–304. [Google Scholar] [CrossRef]
  2. Seto, K.C.; Shepherd, J.M. Global urban land-use trends and climate impacts. Curr. Opin. Environ. Sustain. 2009, 1, 89–95. [Google Scholar] [CrossRef]
  3. Turner, B.L.; Lambin, E.F.; Reenberg, A. The emergence of land change science for global environmental change and sustainability. Proc. Natl. Acad. Sci. USA 2007, 104, 20666–20671. [Google Scholar] [CrossRef]
  4. UNFPA Annual Report 2007. Available online: https://www.unfpa.org/publications/unfpa-annual-report-2007 (accessed on 10 July 2023).
  5. New US Urban Area Data Released. Newgeography. Available online: http://www.newgeography.com/content/002747-new-us-urban-area-data-released (accessed on 20 July 2023).
  6. Karen, C.S.; Burak, G.; Lucy, R.H. Global forecasts of urban expansion to 2030 and direct impacts on biodiversity and carbon pools. Proc. Natl. Acad. Sci. USA 2012, 109, 16083–16088. [Google Scholar] [CrossRef]
  7. Foley, J.A.; Defries, R.; Asner, G.P.; Barford, C.; Bonan, G.; Carpenter, S.R.; Chapin, F.S.; Coe, M.T.; Daily, G.C.; Gibbs, H.K.; et al. Global consequences of land use. Science 2005, 309, 570–574. [Google Scholar] [CrossRef]
  8. Montgomery, M.R. The urban transformation of the developing world. Science 2008, 319, 761–764. [Google Scholar] [CrossRef]
  9. Ramankutty, N.; Foley, J.A. Estimating historical changes in global land cover: Croplands from 1700 to 1992. Glob. Biogeochem. Cycles. 1999, 13, 997–1027. [Google Scholar] [CrossRef]
  10. Theobald, D.M. Landscape patterns of exurban growth in the USA from 1980 to 2020. Ecol. Soc. 2005, 10, 32. Available online: https://www.jstor.org/stable/26267722 (accessed on 3 July 2023). [CrossRef]
  11. Ghaffar, A.; Nathsuda, P.; Cui, S.H. Valuation and validation of carbon sources and sinks through land cover/use change analysis: The case of Bangkok metropolitan area. Land Use Policy 2018, 70, 471–478. [Google Scholar] [CrossRef]
  12. Xu, Q.; Yang, R.; Dong, Y.X.; Liu, Y.X.; Qiu, L.R. The influence of rapid urbanization and land use changes on terrestrial carbon sources/sinks in Guangzhou, China. Ecol. Indic. 2016, 70, 304–316. [Google Scholar] [CrossRef]
  13. Wang, C.; Zhan, J.Y.; Zhang, F.; Liu, W.; Twumasi-Ankrah, M.J. Analysis of urban carbon balance based on land use dynamics in the Beijing-Tianjin-Hebei region, China. J. Clean. Prod. 2021, 281, 125138. [Google Scholar] [CrossRef]
  14. Gao, L.; Wen, X.; Guo, Y.T.; Gao, T.M.; Wang, Y.; Shen, L. Spatiotemporal Variability of Carbon Flux from Different Land Use and Land Cover Changes: A Case Study in Hubei Province, China. Energies 2014, 7, 2298–2316. [Google Scholar] [CrossRef]
  15. Li, Z.G.; Zhong, J.L.; Sun, Z.S.; Yang, W.N. Spatial Pattern of Carbon Sequestration and Urban Sustainability: Analysis of Land-Use and Carbon Emission in Guang’an, China. Sustainability 2017, 9, 1951. [Google Scholar] [CrossRef]
  16. Chuai, X.; Huang, X.; Lu, Q.; Zhang, M.; Zhao, R.; Lu, J. Spatiotemporal changes of built-up land expansion and carbon emissions caused by the Chinese construction industry. Environ. Sci. Technol. 2015, 49, 13021–13030. [Google Scholar] [CrossRef]
  17. Carbon Stocks, Fluxes and the Land Sector. Michigan State University, Forest Carbon and Climate Program. Available online: https://www.canr.msu.edu/news/carbon-fluxes-and-carbon-stocks (accessed on 15 July 2023).
  18. Hutyra, L.R.; Yoon, B.; Hepinstall-Cymerman, J.; Alberti, M. Carbon consequences of land cover change and expansion of urban lands: A case study in the Seattle metropolitan region. Landsc. Urban Plan. 2011, 103, 83–93. [Google Scholar] [CrossRef]
  19. Mendez-Estrella, R.; Romo-Leon, J.R.; Castellanos, A.E. Mapping Changes in Carbon Storage and Productivity Services Provided by Riparian Ecosystems of Semi-Arid Environments in Northwestern Mexico. ISPRS Int. J. Geo-Inf. 2017, 6, 298. [Google Scholar] [CrossRef]
  20. Yan, Y.; Zhang, C.; Hu, Y.F.; Kuang, W.H. Urban Land-Cover Change and Its Impact on the Ecosystem Carbon Storage in a Dryland City. Remote Sens. 2016, 8, 6. [Google Scholar] [CrossRef]
  21. Churkina, G. The role of urbanization in the global carbon cycle. Front. Ecol. Evol. 2016, 3, 144. [Google Scholar] [CrossRef]
  22. Pasher, J.; McGovern, M.; Khoury, M.; Diffe, J. Assessing carbon storage and sequestration by Canada’s urban forests using high resolution earth observation data. Urban For. Urban Green. 2014, 13, 484–494. [Google Scholar] [CrossRef]
  23. Weiss, D.; Nelson, A.D.; Gibson, H.S.; Temperley, W.; Peedell, S.; Lieber, A.; Hancher, M.; Poyart, E.; Belchior, S.; Fullman, N.; et al. A global map of travel time to cities to assess inequalities in accessibility in 2015. Nature 2018, 553, 333–336. [Google Scholar] [CrossRef]
  24. Mori, T.; Smith, T.E.; Hsu, W.T. Common power laws for cities and spatial fractal structures. Proc. Natl. Acad. Sci. USA 2020, 117, 6469–6475. [Google Scholar] [CrossRef] [PubMed]
  25. LandScan Global Population Data OAK RIDGE National Laboratory. Available online: https://landscan.ornl.gov/ (accessed on 10 August 2022).
  26. Global Land Cover 2000, EU SCIENCE HUB 2005. Available online: https://forobs.jrc.ec.europa.eu/products/glc2000/glc2000.php (accessed on 6 August 2022).
  27. Land Cover CCI Products, European Space Agency. Available online: http://maps.elie.ucl.ac.be/CCI/viewer/ (accessed on 6 August 2022).
  28. Finer Resolution Observation and Monitoring-Global Land Cover, Tsinghua University. Available online: http://data.ess.tsinghua.edu.cn/ (accessed on 10 August 2022).
  29. Deep Learning Model to Perform Land Cover Classification on Landsat 8 Imagery, ESRI ArcGIS. Available online: https://www.arcgis.com/home/item.html?id=e732ee81a9c14c238a14df554a8e3225 (accessed on 6 August 2022).
  30. Ratner, B. The Correlation Coefficient: Its Values Range between +1/−1, or Do They? J. Target. Meas. Anal. Mark. 2009, 17, 139–142. [Google Scholar] [CrossRef]
  31. Nowak, D.J.; Greenfield, E.J.; Hoehn, R.E.; Lapoint, E. Carbon storage and sequestration by trees in urban and community areas of the United States. Environ. Pollut. 2013, 178, 229–236. [Google Scholar] [CrossRef]
  32. 2019 Refinement to the 2006 IPCC Guidelines for National Greenhouse Gas Inventories. Available online: https://www.ipcc.ch/report/2019-refinement-to-the-2006-ipcc-guidelines-for-national-greenhouse-gas-inventories/ (accessed on 15 November 2022).
  33. Climate Change 2007: Synthesis Report. Contribution of Working Groups I, II and III to the Fourth Assessment Report of the Intergovernmental Panel on Climate Change. Available online: https://www.ipcc.ch/report/ar4/syr/ (accessed on 10 November 2022).
  34. Godwin, C.; Chen, G.; Singh, K.K. The impact of urban residential development patterns on forest carbon density: An integration of LiDAR, aerial photography and field mensuration. Landsc. Urban Plan. 2015, 136, 97–109. [Google Scholar] [CrossRef]
  35. Peng, S.Y.; Li, S.H. Scale relationship between landscape pattern and water quality in different pollution source areas: A case study of the Fuxian Lake watershed, China. Ecol. Indic. 2021, 121, 107136. [Google Scholar] [CrossRef]
  36. Novotný, J.; Chakraborty, S.; Maity, I. Urban expansion of the 43 worlds’ largest megacities: A search for unified macro-patterns. Habitat. Int. 2022, 129, 102676. [Google Scholar] [CrossRef]
  37. Jin, W.; Zhou, C.; Zhang, G. Characteristics of state-owned construction land supply in Chinese cities by development stage and industry. Land Use Policy 2020, 96, 104630. [Google Scholar] [CrossRef]
  38. Sahasranaman, M. Future of urban agriculture in India. Indian Inst. Resour. Anal. Policy 2016, 10, 1216. [Google Scholar]
  39. Luber, G.; McGeehin, M. Climate Change and Extreme Heat Events. Am. J. Prev. Med. 2008, 35, 429–435. [Google Scholar] [CrossRef] [PubMed]
  40. Tuholske, C.; Caylor, K.C.; Funk, C.; Evans, T. Global urban population exposure to extreme heat. Proc. Natl. Acad. Sci. USA 2021, 118, e2024792118. [Google Scholar] [CrossRef]
  41. Anguluri, R.; Narayanan, P. Role of green space in urban planning: Outlook towards smart cities. Urban For. Urban Green. 2017, 25, 58–65. [Google Scholar] [CrossRef]
  42. Zepp, H.; Inostroza, L. Who Pays the Bill? Assessing Ecosystem Services Losses in an Urban Planning Context. Land 2021, 10, 369. [Google Scholar] [CrossRef]
  43. McPherson, E.G.; Xiao, Q.F.; Aguaron, E. A new approach to quantify and map carbon stored, sequestered and emissions avoided by urban forests. Landsc. Urban Plan. 2013, 120, 70–84. [Google Scholar] [CrossRef]
  44. Tomás, L.; Finseca, L.; Almeida, C.; Leonardi, F.; Pereira, M. Urban population estimation based on residential buildings volume using IKONOS-2 images and lidar data. Int. J. Remote Sens. 2015, 37, 1–28. [Google Scholar] [CrossRef]
  45. Tebaldi, C. Climate model projections from the Scenario Model Intercomparison Project (ScenarioMIP) of CMIP6. Earth Syst. Dyn. 2021, 12, 253–293. [Google Scholar] [CrossRef]
  46. Alberti, M.; Hutyra, L.R. Detecting carbon signatures of development patterns across a gradient of urbanization: Linking observations, models and scenarios. In Proceedings of the Fifth Urban Research Symposium 2009: Cities and Climate Change: Responding to an Urgent Agenda, Marseille, France, 28–30 June 2009. [Google Scholar]
  47. Cathcart, J.F.; Kline, J.D.; Delaney, M.; Tilton, M. Carbon storage and Oregon’s land-use planning program. J. For. 2007, 105, 167–172. [Google Scholar] [CrossRef]
  48. Heath, L.S.; Smith, J.E.; Skog, K.E.; Nowak, D.J.; Woodall, C.W. Managed forest carbon estimates for the US greenhouse gas inventory, 1990–2008. J. For. 2011, 109, 167–173. [Google Scholar] [CrossRef]
  49. Nowak, D.J.; CrNowaane, D.E. Carbon storage and sequestration by urban trees in the USA. Environ. Pollut. 2002, 116, 381–389. [Google Scholar] [CrossRef]
  50. Yang, J.; McBride, J.; Zhou, J.X.; Sun, Z.Y. The urban forest in Beijing and its role in air pollution reduction. Urban For. Urban Green. 2005, 3, 65–78. [Google Scholar] [CrossRef]
  51. Liu, C.F.; Li, X.M. Carbon storage and sequestration by urban forests in Shenyang, China. Urban For. Urban Green. 2012, 11, 121–128. [Google Scholar] [CrossRef]
Figure 1. Method flowchart. The left part refers to Section 2.1; the middle part refers to Section 2.2; the right part refers to Section 2.3 and Section 2.4.
Sustainability 15 12497 g001
Figure 2. (a) The distribution of the top 100 largest cities in the world; (b) the Pearl River Delta city cluster that contains Guangzhou, Shenzhen, Dongguan, Foshan, and Zhuhai.
Sustainability 15 12497 g002
Figure 3. Average annual change of six land use types in 100 cities from 2013 to 2022. White dots represent cities with no significant change trends for the corresponding land use type.
Sustainability 15 12497 g003
Figure 4. Average annual change of land carbon stock in the selected 100 cities from 2013 to 2022.
Sustainability 15 12497 g004
Figure 5. Land carbon fluxes in 60 cities were mainly driven by changes in forest, grassland, developed area, cropland, or barren land, respectively.
Sustainability 15 12497 g005
Table 1. Land use classification.
Land Use ClassificationSubclass
Open Water
Perennial Snow/Ice
Developed AreaOpen Space
Low Intensity
Medium Intensity
High Intensity
Barren Land
ForestDeciduous Forest
Evergreen Forest
Mixed Forest
GrasslandShrub/Scrub
Herbaceous
CroplandHay/Pasture
Cultivated Crops
WetlandWoody Wetlands
Emergent Herbaceous Wetland
Table 2. Carbon stock/emission components for different land use types.
Land Use ClassificationSubclassCarbon Stock and Emission Components (Tons Ha-1)
Developed area Above Ground Biomass (SOCAB)
Open Space61.86
Low Intensity58.22
Medium Intensity52.3
High Intensity42.29
Forest Above Ground Biomass (SOCAB)
TropicalSubtropicalTemperate
AfricaAmericaAsiaAfricaAmericaAsiaAsiaEuropeAmerica and Oceania
Deciduous236.6187.367.770100180200
Evergreen190195433.535.174.6250.2170.4214.7185.9
Mixed69.6127.5184.665.2115.970.9116162128.9
Mineral Soils (SOCMS)
TropicalSubtropicalTemperate
drymoistdrymoistcool and drycool and moistwarm and drywarm and moist
All types2140246443812464
Litter (SOCLC)
TropicalSubtropicalTemperate
Deciduous4.35.623.9
Evergreen14.86.866.3
Mixed5.98.747.8
Dead Wood (SOCDW)
TropicalSubtropicalTemperate
Deciduous8.44.123.6
Evergreen3.410.922.1
Mixed813.223
Grassland Mineral Soils (SOCMS)
TropicalSubtropicalTemperate
drymoistdrymoistcool and drycool and moistwarm and drywarm and moist
All types2140246443812464
Cropland Above Ground Biomass (SOCAB)
Tropical and SubtropicalTemperate
Hay/pasture22.126.1
Cultivated Crops58.269.9
Mineral Soils (SOCMS)
TropicalSubtropicalTemperate
drymoistdrymoistcool and drycool and moistwarm and drywarm and moist
All types2140246443812464
Wetland Mineral Soils (SOCMS)
TropicalSubtropicalTemperate
drymoistdrymoistcool and drycool and moistwarm and drywarm and moist
All types2268741358712874135
Wetland Carbon Emission Component (SOCE)
Tropical and SubtropicalTemperate
drymoistcoolwarm and drywarm and moist
All types2.952.771.021.71.46
Table 3. The 60 cities corresponding to carbon stock changes caused by different land use changes.
5 Main GroupsSubgroupsCitiesAverage R2 of Models
Forest drivenForest and developed areaChongqing, Tokyo, Nanchang, Xi’an, Sydney, Guatemala, Denver, Kochi0.9305
Forest and croplandNagoya, Santiago, Adelaide, Moscow, Seoul, Beijing0.9747
Forest and wetlandWashington, Maputo0.9975
ForestGuangzhou, Kolkata, New York, London, Paris, Hangzhou, Surabaya, Monterrey, Birmingham, Shenyang, Durban0.7612
Grassland drivenGrassland and forestSan Diego, Hefei0.92
Grassland and barren landTehran0.865
GrasslandLos Angeles, Johannesburg, San Francisco, Rio de Janeiro, Hyderabad, Lahore, Bengaluru, Goiania, Ankara, Tashkent, Rome0.8056
Developed area drivenDeveloped area and barren landLas Vegas, Dubai0.97
Developed area and croplandMilan, Brisbane, Chennai0.819
Developed area and grasslandNanjing, Shijiazhuang, Changsha0.837
Developed areaWenzhou, Wuhan0.5135
Cropland drivenCropland and developed areaShantou, Phoenix0.771
Cropland and forestZhengzhou0.759
CroplandNew Delhi, Jakarta, Bangkok0.753
Barren land drivenBarren land and developed areaKarachi, Riyadh, Amman0.9903
Disclaimer/Publisher’s Note: The statements, opinions and data contained in all publications are solely those of the individual author(s) and contributor(s) and not of MDPI and/or the editor(s). MDPI and/or the editor(s) disclaim responsibility for any injury to people or property resulting from any ideas, methods, instructions or products referred to in the content.

