

Groundwater Hydrogeochemistry Impacted by Industrial Activities in Ain Sukhna Industrial Area, North-Western Part of the Gulf of Suez, Egypt


Abstract
:1. Introduction
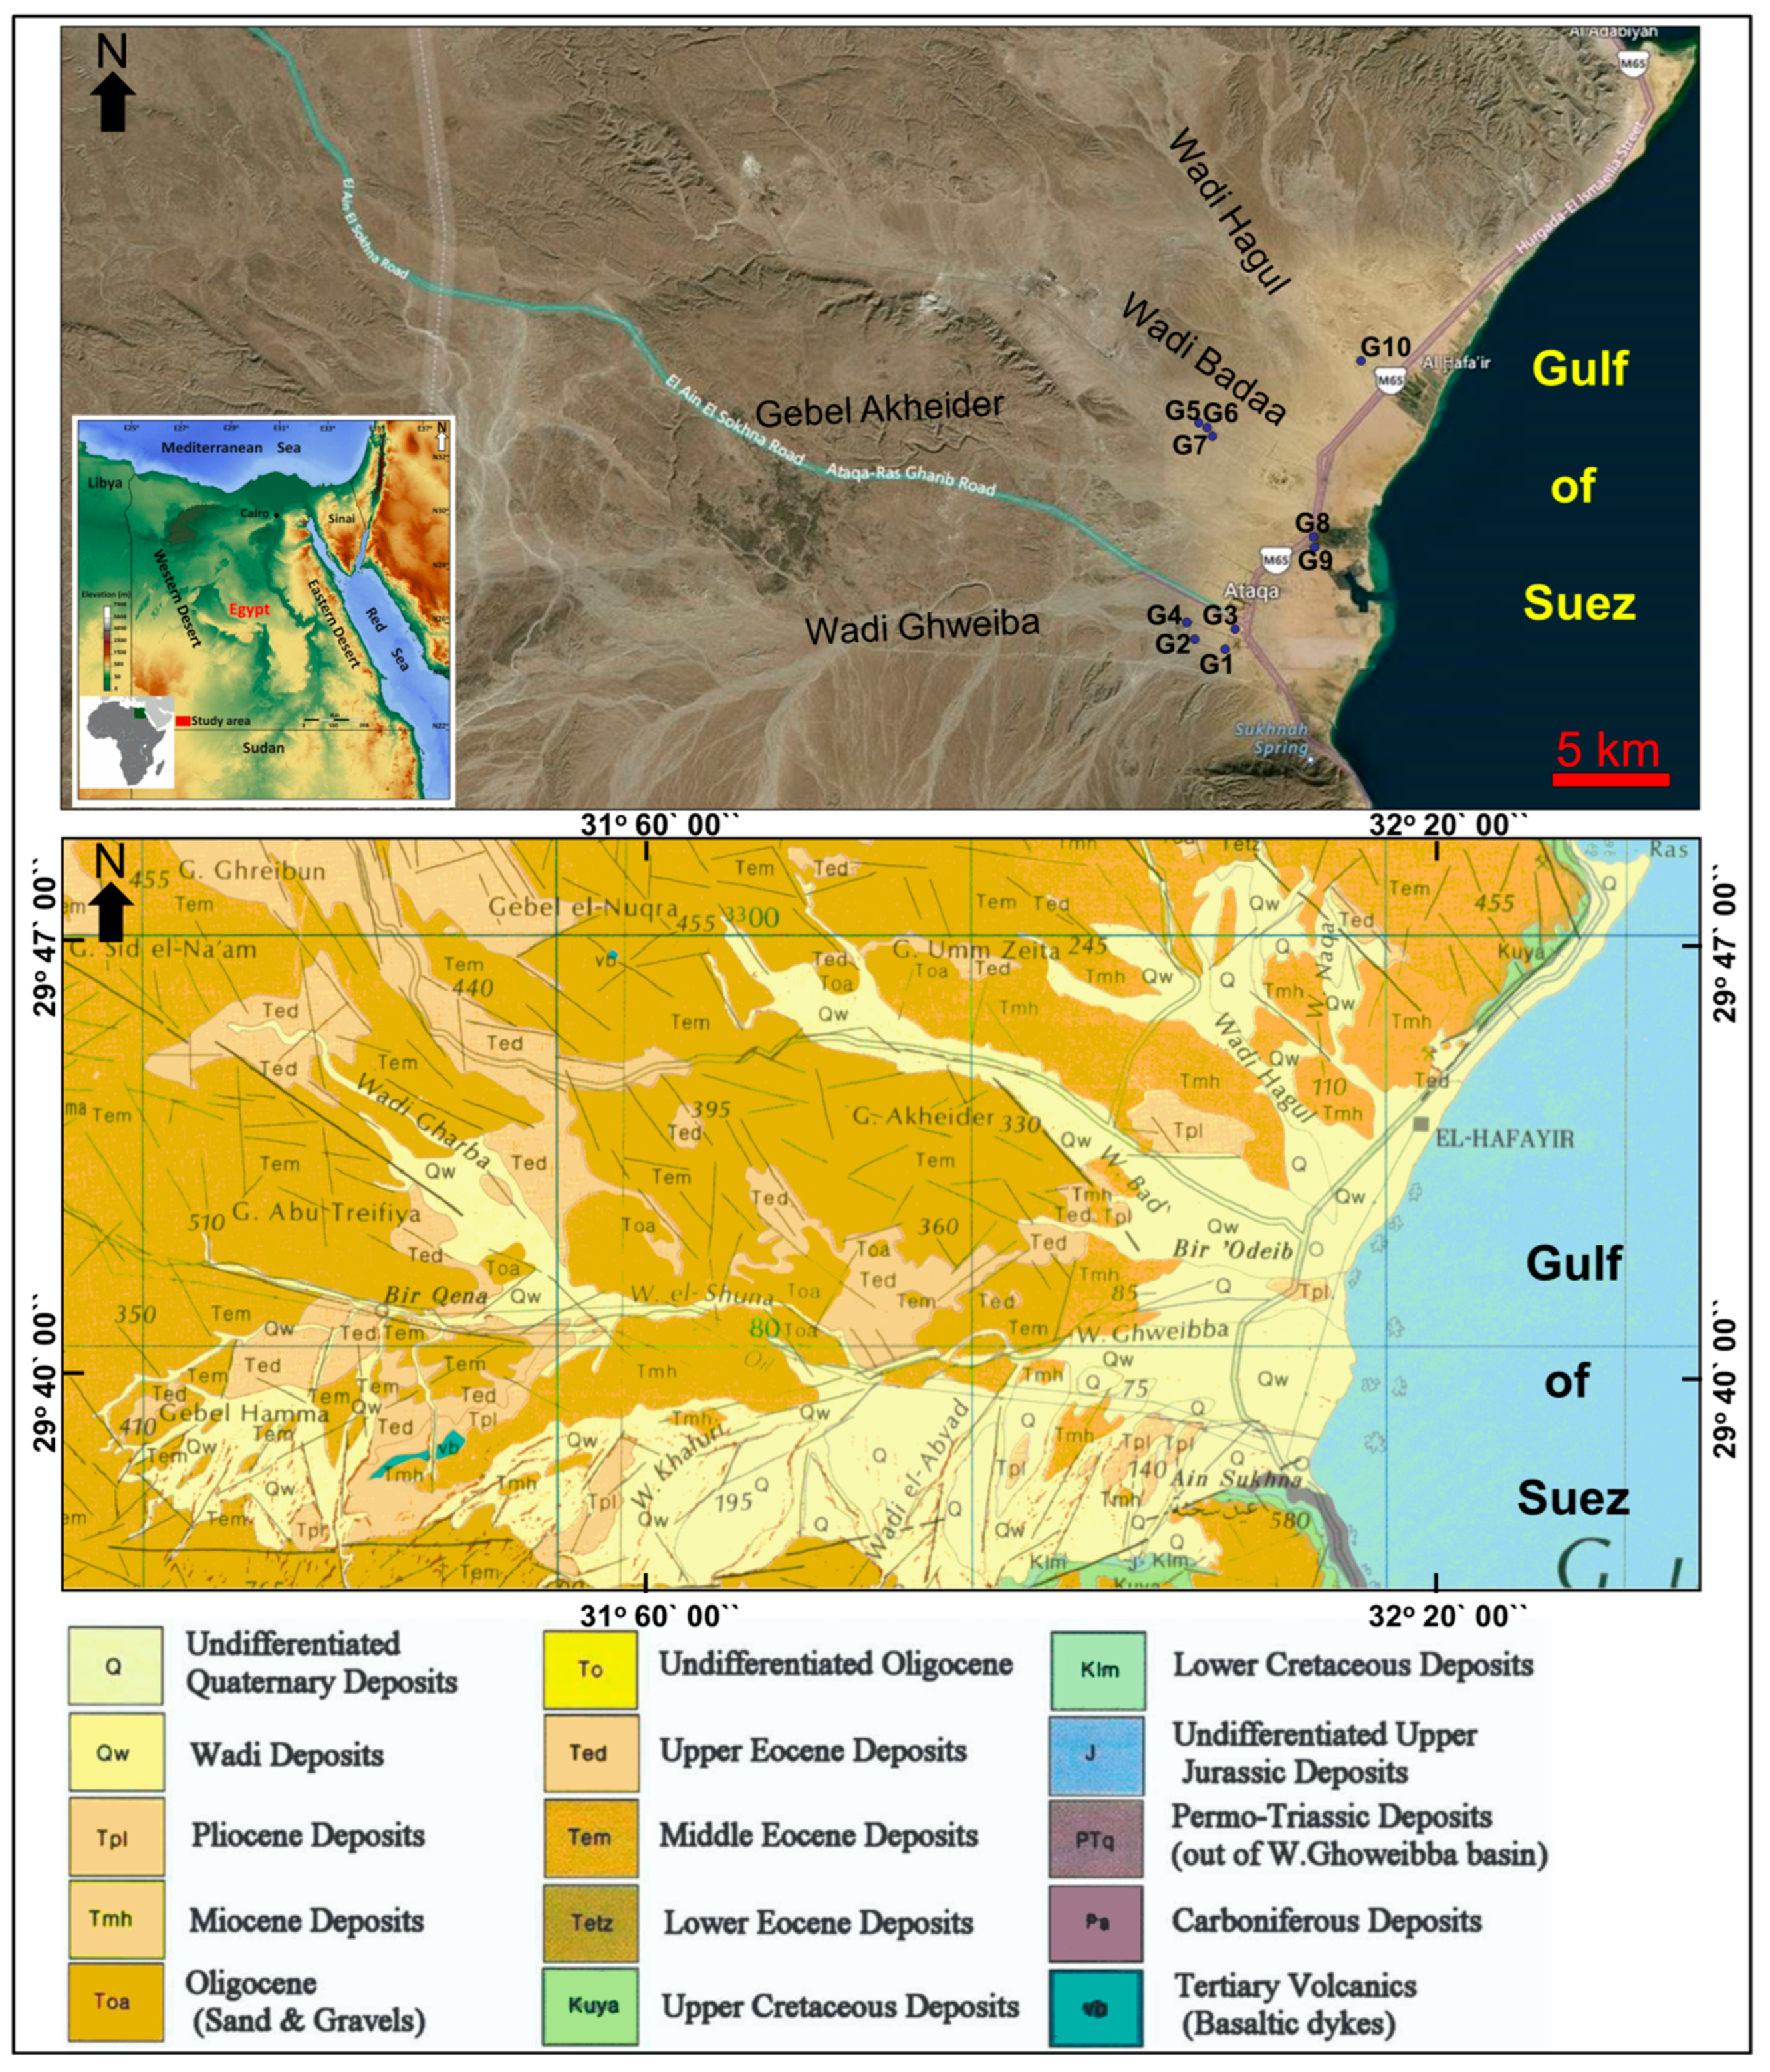
1.1. Study Area
1.2. Geologic Setting
1.3. Climate
2. Materials and Methods
2.1. Sampling and Field Methods
2.2. Geochemical Analyses
2.3. Ion Exchange Process
2.4. Suitability for Irrigation Purpose
2.5. Suitability for Industrial Purposes
3. Results and Discussions
3.1. Hydrogeological Setting
3.2. Hydrogeochemistry
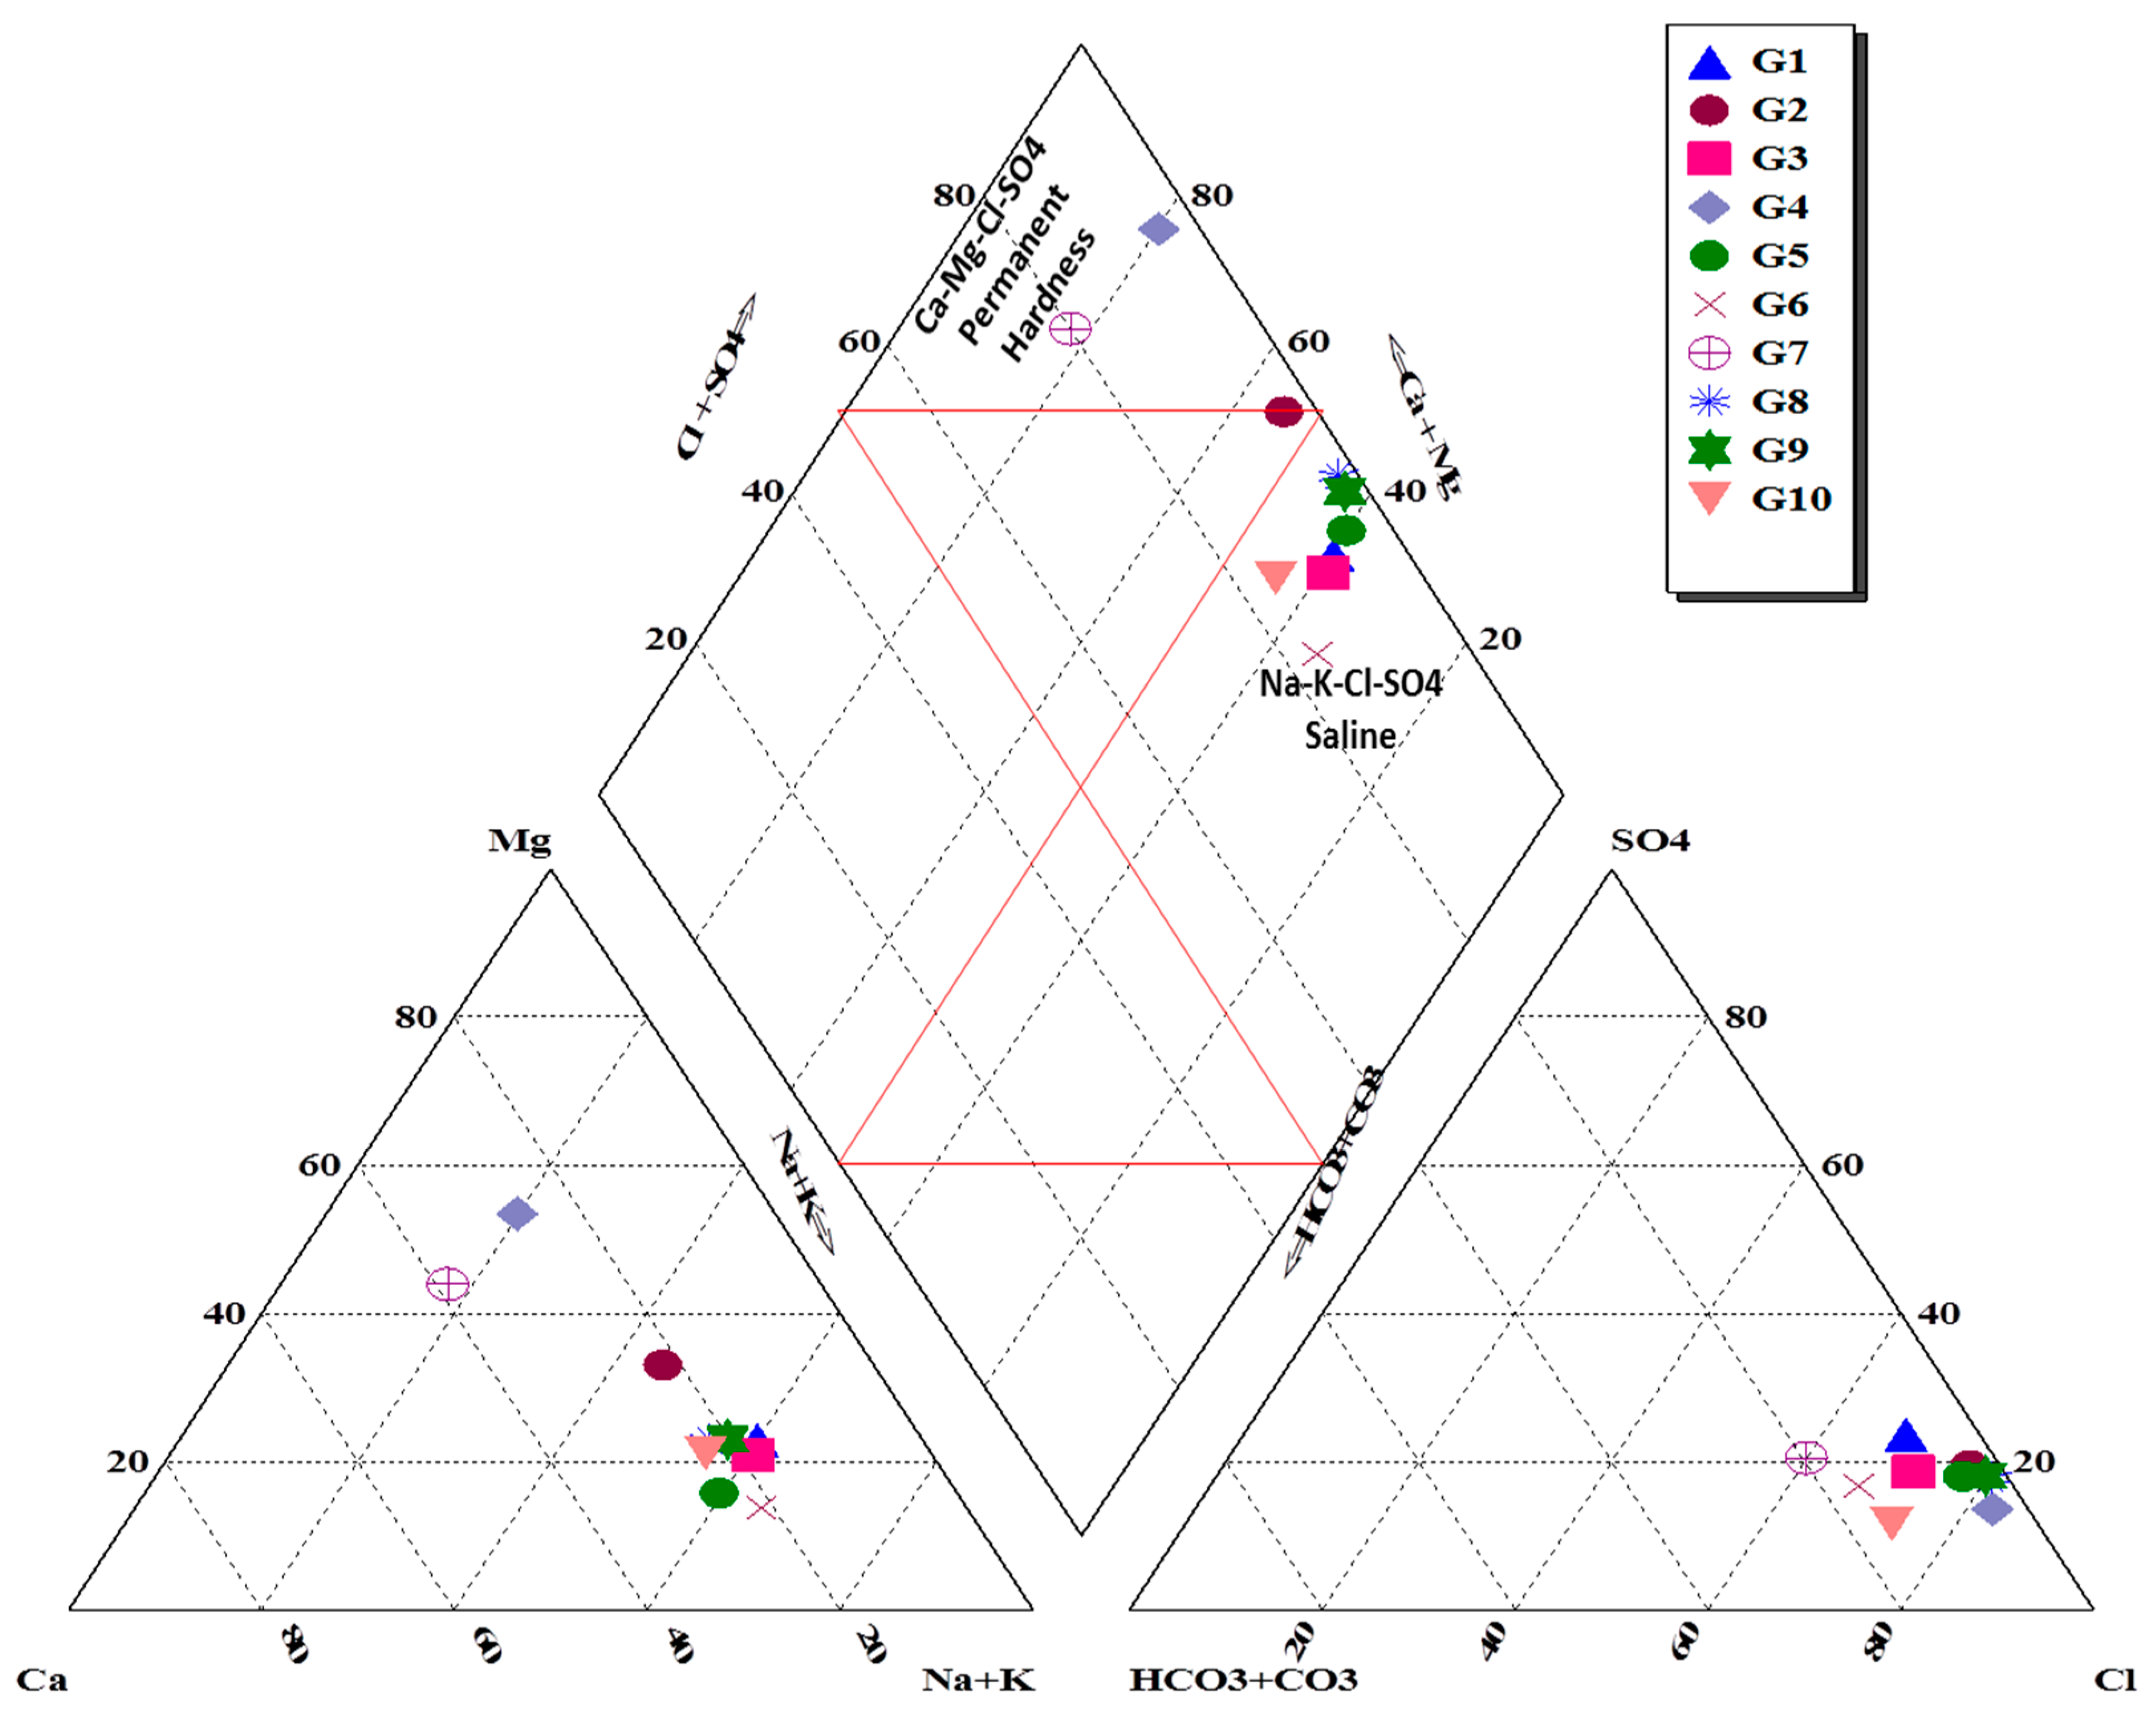
3.2.1. Groundwater Geochemistry
3.2.2. Ion Sequence and Ratio
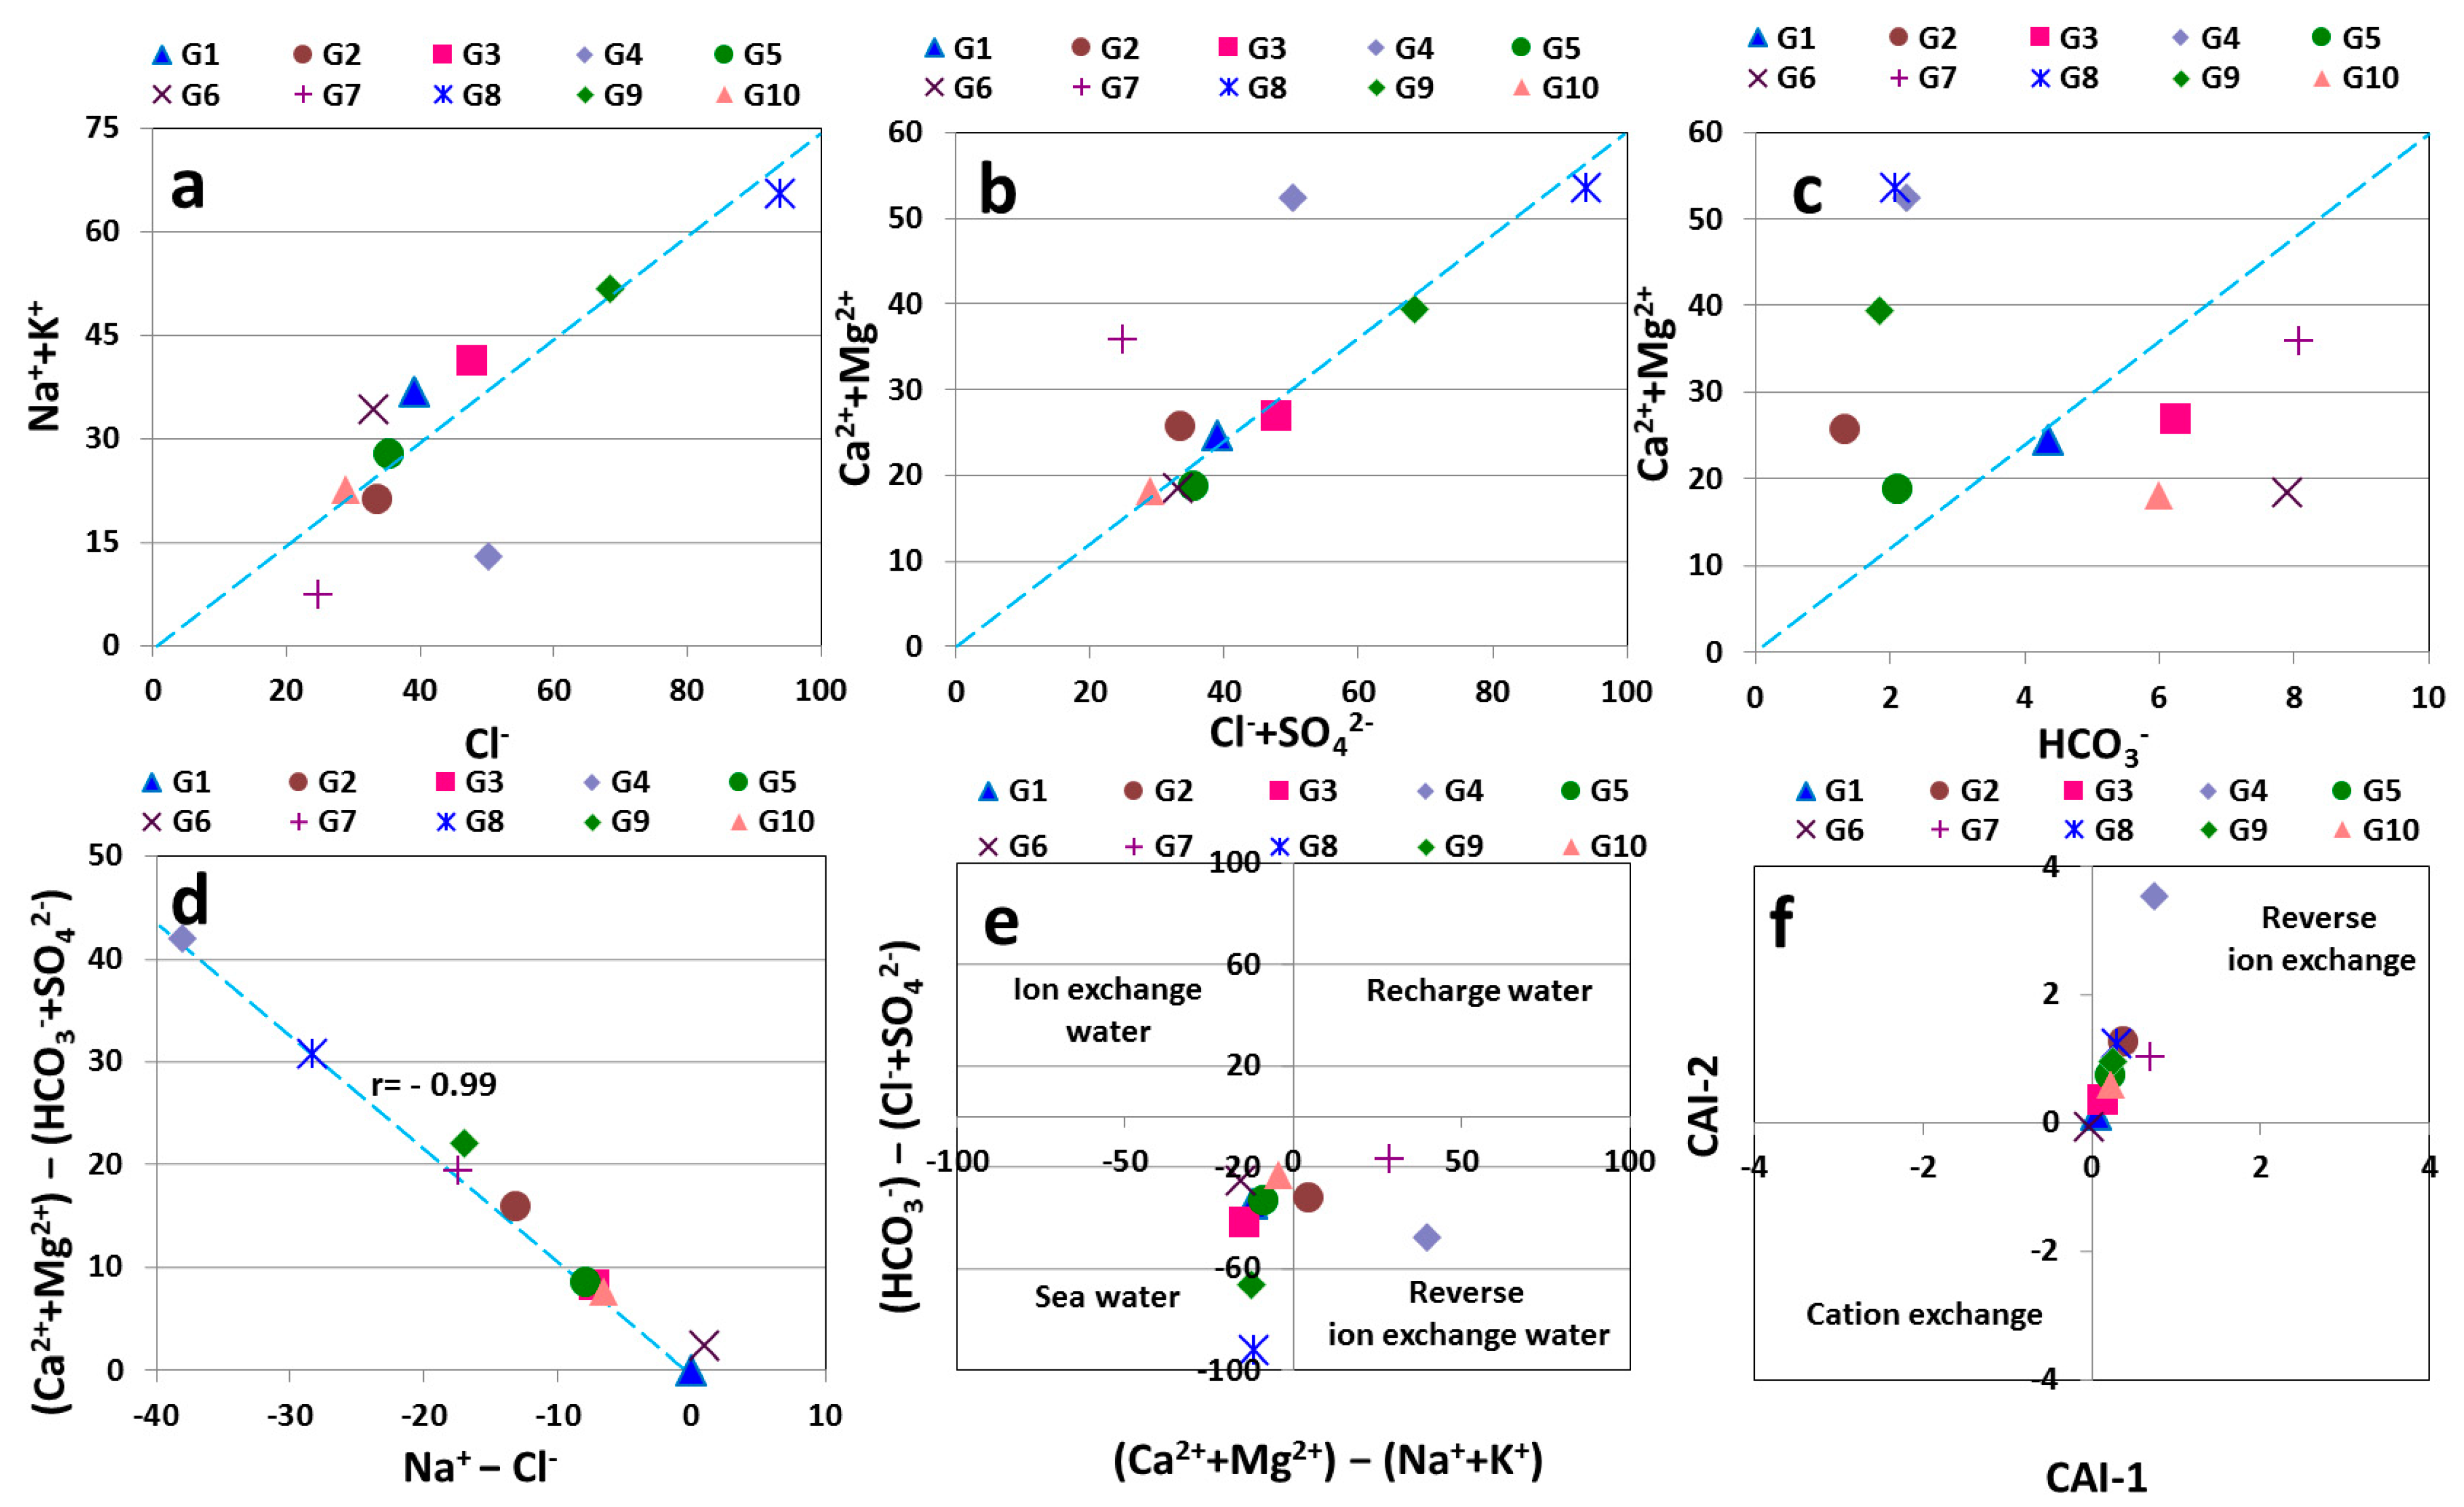
3.2.3. Interrelations of Chemical Parameters
3.2.4. Ion Exchange Process
3.2.5. Groundwater Origin
3.3. Groundwater Quality
3.3.1. Drinking Purpose
3.3.2. Irrigation Purposes
3.3.3. Industrial Purposes
- (a)
- Water, with HCO3− > 400 mg/L or TH > 300 mg/L or SO42− > 100 mg/L may cause incrustation.
- (b)
- Water with pH < 7 or TDS > 1000 mg/L or Cl− > 500 mg/L may cause corrosion.
4. Conclusions
Author Contributions
Funding
Institutional Review Board Statement
Informed Consent Statement
Data Availability Statement
Acknowledgments
Conflicts of Interest
References
- Singh, K.P.; Malik, A.; Mohan, D.; Sinha, S. Multivariate statistical techniques for the evaluation of spatial and temporal variations in water quality of Gomtiriver (India): A case study. Water Resour. 2004, 38, 3980–3992. [Google Scholar]
- Mohamed, M.M.; Elmahdy, S.I. Natural and anthropogenic factors affecting groundwater quality in the eastern region of the United Arab Emirates. Arabian J. Geosci. 2015, 8, 7409. [Google Scholar] [CrossRef]
- Saha, P.; Paul, B. Groundwater quality assessment in an industrial hotspot through interdisciplinary techniques. Environ. Monit. Assess. 2019, 191 (Suppl. 2), 326. [Google Scholar] [CrossRef] [PubMed]
- Alzahrani, H.; El-Sorogy, A.S.; Qaysi, S.; Alshehri, F. Contamination and Risk Assessment of Potentially Toxic Elements in Coastal Sediments of the Area between Al-Jubail and Al-Khafji, Arabian Gulf, Saudi Arabia. Water 2023, 15, 573. [Google Scholar] [CrossRef]
- Daniele, L.; Vallejos, Á.; Corbella, M.; Molina, L.; Pulido-Bosch, A. Hydrogeochemistry and geochemical simulations to assess water–rock interactions in complex carbonate aquifers: The case of Aguadulce (SE Spain). Appl. Geochem. 2013, 29, 43–54. [Google Scholar] [CrossRef]
- El-Moselhy, K.M.; Gabal, M.N. Trace metals in water, sediments and marine organisms from the northern part of the Gulf of Suez, Red Sea. J. Marine Sys. 2004, 46, 39–46. [Google Scholar] [CrossRef]
- Khaled, A.; El-Nemr, A.; Said, T.O.; El-Sikaily, A.; Abd-Alla, A.M.A. Polychlorinated biphenyls and chlorinated pesticides in mussels from the Egyptian Red Sea coast. Chemosphere 2004, 54, 1407–1412. [Google Scholar] [CrossRef]
- Nour, H.E.; Alshehri, F.; Sahour, H.; El-Sorogy, A.S.; Tawfik, M. Assessment of heavy metal contamination and health risk in the coastal sediments of Suez Bay, Gulf of Suez, Egypt. J. Afr. Earth Sci. 2022, 195, 104663. [Google Scholar] [CrossRef]
- Snousy, M.G.; Zawrah, M.F.; Abdel-Moghny, T.H.; Ebiad, M.A.; Rashad, A.M.; Khalil, M.M.; Abu El Ella, E.M.; El-Sayed, E.; Tantawy, M.A. Mobility and Fate of Pollutants in the Aquifer System of the Northwestern Suez Gulf, Egypt. In Reviews of Environmental Contamination and Toxicology; De Voogt, P., Ed.; Springer: Cham, Switzerland, 2016; Volume 240. [Google Scholar] [CrossRef]
- Hanna, R.G.M. The level of heavy metals in the Red Sea after 50 years. Sci. Total Environ. 1992, 125, 417–448. [Google Scholar] [CrossRef]
- Abd El-Moniem, M.A.; El-Moselhy, K.M.; Hassan, S.H. Trace metals content in three fish species from Northern part of the Suez Gulf, Red Sea, Egypt. Symposium on Red Sea marine environment, Jeddah. J. King Abdulaziz Univ. Mar. Sci. 1994, 7, 15–24. [Google Scholar]
- Hamed, M.A.; Said, T.O. Effect of pollution on the water quality of the Gulf of Suez. Egyp. J. Aquatic Biol. Fish. 2000, 4, 161–178. [Google Scholar] [CrossRef]
- El-Sikaily, A.; Khaled, A.; El Nemr, A. Heavy metals monitoring using bivalves from Mediterranean Sea and Red Sea. Environ. Monit. Assess. 2004, 98, 41–58. [Google Scholar] [CrossRef] [PubMed]
- Rushdi, A.I.; Kassim, T.A.T.A.; Simoneit, B.R.T. Organic tracers in sediments from the coastal zone of Ras Abu El-Darag, Gulf of Suez. Environ. Geol. 2009, 58, 1675–1687. [Google Scholar] [CrossRef]
- Abdel-Hamid, A.M.A.; Hamed, M.A.; Abd El-Azim, H. Heavy metals distribution in the coral reef ecosystems of the Northern Red Sea. Helgol. Mar. Res. 2011, 65, 67–80. [Google Scholar]
- Shreadah, M.A.; Said, T.O.; Abd El-Ghani, S.A.; Abd El-Moniem, M.A. Distribution of different organotin and organolead compounds in sediment of Suez Gulf. J. Environ. Protect. 2011, 2, 545–554. [Google Scholar] [CrossRef]
- Snousy, M.G.; Zawrah, M.F.; Rashad, A.M.; Ebiad, M.A.; El-Sayed, E.; Tantawy, M.A. HPLC evaluation of PAHS polluted soil in coastal petroleum refinery site Northwestern Suez Gulf, Egypt. Res. J. Environ. Toxicol. 2015, 9, 251–260. [Google Scholar]
- Conoco Geologic Map of Egypt. Egyptian General Authority for Petroleum (UNESCO Joint Map Project), 20 Sheets, Scale 1500, 000, Cairo, 1987. Available online: https://shop.geospatial.com/product/N1QHZXNQC4BQ4FTWS6H8FPCXJ4/03-EGAC-N1QH-Egypt-1-to-500000-Scale-Geological-Maps (accessed on 13 July 2023).
- El-Behiry, M.G.; Shedid, A.; Abu-Khadra, A.; El-Huseiny, M. Integrated GIS and remote sensing for runoff hazard analysis in Ain Sukhna industrial area, Egypt. JKAU Earth Sci. 2006, 17, 19–42. [Google Scholar] [CrossRef]
- Abdallah, A.M.; Abd El-Hady, F.M. Geology of Sadat area, Gulf of Suez. UAR J. Geol. 1966, 10, 1–24. [Google Scholar]
- Mohamed, A.M.E. Estimating Earthquake Ground Motions at the Northwestern Part of the Gulf of Suez, Egypt. Ph.D. Thesis, Ain Shams University, Cairo, Egypt, 2003. [Google Scholar]
- Sultan, M.; Metwally, S.; Milewski, A.; Becker, D.; Ahmed, M.; Sauck, W.; Soliman, F.; Sturchio, N.; Yan, E.; Rashed, M.; et al. Modern recharge to fossil aquifers: Geochemical, geophysical, and modeling constraints. J. Hydrol. 2011, 403, 14–24. [Google Scholar] [CrossRef]
- EMA (Egyptian General Authority of Meteorology). Available online: http://ema.gov.eg/ (accessed on 4 July 2023).
- American Public Health association (APHA). Standard Methods for the Examination of Water and Wastewater, 22nd ed.; American Water Works Association: Washington, DC, USA, 2012; 1496p. [Google Scholar]
- REGWA. Groundwater Resources in Wadi Badaa and Wadi Hagul; Internal Report; REGWA: Cairo, Egypt, 1979. [Google Scholar]
- Schoeller, H. Geochemistry of Groundwater. In Groundwater Studies–An International Guide for Research and Practice; UNESCO: Paris, France, 1977. [Google Scholar]
- Deepali, M.; Malpe, D.B.; Subba Rao, N. Identification of controlling processes of groundwater quality in a developing urban area using principal component analysis. Environ. Earth Sci. 2015, 74, 5919–5933. [Google Scholar] [CrossRef]
- Singh, A.K.; Mondal, G.C.; Kumar, S.; Singh, T.B.; Tewary, B.K.; Sinha, A. Major ion chemistry, weathering processes and water quality assessment in upper catchment of Damodar River basin, India. Environ. Geol. 2008, 54, 745–758. [Google Scholar] [CrossRef]
- Eaton, E.M. Significance of carbonates in irrigation waters. Soil Sci. 1950, 69, 123–133. [Google Scholar] [CrossRef]
- Szabolcs, I.; Darab, C. The influence of irrigation water of high sodium carbonate content of soils. In Proceedings of the 8th International Congress of ISSS, Tsukuba, Japan, 9 September 1964; pp. 803–812. [Google Scholar]
- US Salinity Laboratory Staff (USSLS). Diagnosis and Improvements of Saline and Alkali Soils; US Department of Agriculture Handbook; USDA: Washington, DC, USA, 1954; No. 60, p. 160. [Google Scholar]
- Patel, P.; Raju, N.J.; Reddy, B.C.S.R.; Suresh, U.; Gossel, W.; Wycisk, P. Geochemical processes and multivariate statistical analysis for the assessment of groundwater quality in the Swarnamukhi River basin, Andhra Pradesh, India. Environ. Earth Sci. 2016, 75, 1–24. [Google Scholar] [CrossRef]
- Desouki, H.A.; Gomaa, M.A.; Sadek, M.A.; Ezz El-Deen, H.A. Hydrochemical and isotopic evaluation of groundwater quality, El Ain El—Sukhna and Wadi Araba localities, aquifers, Egypt. Mansoura J. Geol. Geophys. 2006, 33, 32–64. [Google Scholar]
- Abdel Raouf, A.U. Geophysical Studies on Wadi Hagul-Wadi Badaa Area, North of Ain Sukhna, Gulf of Suez. Ph.D. Thesis, Faculty of Science, Mansoura University, Mansourah, Egypt, 2001; 199p. [Google Scholar]
- Elewa, H.H. A strategy for optimizing groundwater recharging by flood water in the northwestern coastal zone of the Gulf of Suez, Egypt. In Proceedings of the 5th International Symposium on Management of Aquifer Recharge (ISMAR 5), Berlin, Germany, 10–16 June 2005. [Google Scholar]
- Tóth, J. Groundwater as a geologic agent: An overview of the causes, processes, and manifestations. Hydrogeol. J. 1999, 7, 1–14. [Google Scholar] [CrossRef]
- Singh, S.; Raju, N.J.; Ramakrishna, C. Evaluation of groundwater quality and its suitability for domestic and irrigation use in parts of the Chandauli-Varanasi region, Uttar Pradesh, India. J. Water Resour. Protect. 2015, 7, 572–587. [Google Scholar] [CrossRef]
- Batayneh, A.T.; Al-Taani, A.A. Integrated resistivity and water chemistry for evaluation of groundwater quality of the Gulf of Aqaba coastal area in Saudi Arabia. J. Geosci. 2016, 20, 403–413. [Google Scholar] [CrossRef]
- World Health Organization (WHO). Guidelines for Drinking-Water Quality, 4th ed.; World Health Organization: Geneva, Switzerland, 2011; 564p, ISBN 9789241548151. [Google Scholar]
- Ahmed, A.A.; Ali, M.H. Hydrochemical evolution and variation of groundwater and its environmental impact at Sohag, Egypt. Arab. J. Geosci. 2011, 4, 339–352. [Google Scholar] [CrossRef]
- Edet, A.E.; Worden, R.H.; Mohammed, E.A.; Preston, M.R. Hydrogeochemical processes in a populated shallow coastal Plain Sand Aquifer, Southeastern Nigeria. Environ. Earth Sci. 2012, 65, 1933–1953. [Google Scholar] [CrossRef]
- Elgano, L.; Kannan, R. Rock–water interaction and its control on chemical composition of groundwater. In Developments in Environmental Science; Sarkar, D., Datta, R., Hannigan, R., Eds.; Elsevier: Amsterdam, The Netherlands, 2007; Chapter 11; Volume 5, pp. 229–243. [Google Scholar]
- Fallatah, O.; Khattab, M.R. Evaluation of Groundwater Quality and Suitability for Irrigation Purposes and Human Consumption in Saudi Arabia. Water 2023, 15, 2352. [Google Scholar] [CrossRef]
- Cushing, E.M.; Kantrowitz, I.H.; Taylor, K.R. Water Resources of the Delmarva Peninsula; U.S. Geological Survey: Reston, VA, USA, 1973; Professional Paper 822; 58p. [Google Scholar]
- Qian, J.Z.; Wang, L.L.; Zhan, H.B.; Chen, Z. Urban land-use effects on groundwater phosphate distribution in a shallow aquifer, Nanfei River basin, China. Hydrogeol. J. 2011, 19, 1431–1442. [Google Scholar] [CrossRef]
- Eickhout, B.; van Meijl, H.; Tabeau, A.; Van Rheenen, T. Economic and ecological consequences of four European land-use scenarios. Land Use Policy J. 2007, 24, 562–575. [Google Scholar] [CrossRef]
- Wei, Y.; Fan, W.; Wang, W.; Deng, L. Identification of nitrate pollution sources of groundwater and analysis of potential pollution paths in loess regions: A case study in Tongchuan region, China. Environ. Earth Sci. 2017, 76, 423. [Google Scholar] [CrossRef]
- Jalali, M. Geochemistry characterisation of groundwater in an agricultural area of Razan, Hamadan, Iran. Environ. Geol. 2009, 56, 1479–1488. [Google Scholar] [CrossRef]
- Kilemntov, P.P. General Hydrology; Mir Publishers: Moscow, Russia, 1983; 239p. [Google Scholar]
- Mapoma, H.W.T.; Xie, X.; Nyirenda, M.T.; Zhang, L.; Kaonga, C.C.; Mbewe, R. Trace elements geochemistry of fractured basement aquifer in southern Malawi: A case of Blantyre rural. Afric. Earth Sci. 2017, 131, 43–52. [Google Scholar] [CrossRef]
- Mielke, H.W.; Adams, J.L.; Chaney, R.L.; Mielke, P.W.; Ravlkumar, V.C. The pattern of cadmium in the environment of five Minnesota cities. Environ. Geochem. Health 1991, 13, 29–34. [Google Scholar] [CrossRef]
- Liao, F.; Wang, G.; Shi, Z.; Huang, X.; Xu, F.; Xu, Q.; Guo, L. Distributions, sources, and species of heavy metals/trace elements in shallow groundwater around the Poyang Lake, East China. Expo Health 2018, 10, 211. [Google Scholar] [CrossRef]
- Tebutt, T.H.Y. Relationship between Natural Water Quality and Health; UNESCO: Paris, France, 1983. [Google Scholar]
- Schoeller, H. Qualitative evaluation of groundwater resources. In Methods and Techniques of Groundwater Investigation and Development; UNESCO: Delft, The Neatherland, 1965; Series-33; pp. 54–83. [Google Scholar]
- Belkhiri, L.; Mouni, L. Hydrochemical analysis and evaluation of groundwater quality in El Eulma area, Algeria. Appl. Water Sci. 2012, 2, 127–133. [Google Scholar] [CrossRef]
- Lawrence, A.R.; Lloyd, J.W.; Marsh, J.M. Hydrochemistry and ground-water mixing in part of the Lincolnshire limestone aquifer. Engl. Groundw. 1967, 14, 1023–1045. [Google Scholar] [CrossRef]
- Djorfi, S.; Djorfi, S.; Beloulou, L.; Djidel, M.; Guechi, S. Hydrochemical Evolution of Groundwater in the Tamlouka Plain, Influence of Lithology, Geomorphology and Anthropogenic Actions. In Recent Advances in Environmental Science from the Euro-Mediterranean and Surrounding Regions; Kallel, A., Ksibi, M., Ben Dhia, H., Khélifi, N., Eds.; EMCEI 2017. Advances in Science, Technology & Innovation (IEREK Interdisciplinary Series for Sustainable Development); Springer: Cham, Switzerland, 2018. [Google Scholar]
- Meybeck, M. Global chemical weathering of surficial rocks estimated from river dissolved loads. Am. J. Sci. 1987, 287, 401–428. [Google Scholar] [CrossRef]
- Atta, S.A.; Sharaky, A.M.; ElHassanein, A.S.; Khallaf, K.M.A. Salinization of the groundwater in the coastal shallow aquifer, Northwestern Nile Delta, Egypt. In Proceedings of the 1st International Conference on the Geology of Tethys, Cairo University, Cairo, Egypt, 11–14 November 2005; pp. 151–166. [Google Scholar]
- Howari, F.M.; Banat, K.M. Hydrochemical characteristics of Jordan and Yarmouk River waters: Effect of natural and human activities. J. Hydrol. Hydromech. 2002, 50, 50. [Google Scholar]
- Sarin, M.M.; Krishnaswamy, S.; Dilli, K.; Somayajulu, B.L.K.; Moore, W.S. Major-ion chemistry of the Ganga-Brahmaputra river system:Weathering processes and fluxes to the Bay of Bengal. Geochim. Cosmochim. Acta 1989, 53, 997–1009. [Google Scholar] [CrossRef]
- Fisher, S.R.; Mullican, W.F. Hydrogeochemical evaluation of sodium-sulphate and sodium-chloride groundwater beneath the northern Chihuahua desert, Trans-Pecos, Texas, USA. Hydrogeol. J. 1997, 5, 4–16. [Google Scholar] [CrossRef]
- Das, B.K.; Kaur, P. Major ion chemistry of Renuka Lake and weathering processes, Sirmaur district, Himachal Pradesh, India. Environ. Geol. 2001, 40, 908–917. [Google Scholar] [CrossRef]
- Li, P.; Wu, J.; Qian, H. Hydrogeochemistry and quality assessment of shallow groundwater in the southern part of the Yellow River Alluvial Plain (Zhongwei Section), China. Earth Sci. Res. J. 2014, 18, 27–38. [Google Scholar] [CrossRef]
- Chadha, D.K. A proposed new diagram for geochemical classification of natural waters and interpretation of chemical data. Hydrogeol. J. 1999, 7, 431–439. [Google Scholar] [CrossRef]
- Piper, A.M. A graphical procedure in the geochemical interpretation of water analysis. Transact. Am. Geophys. Union 1944, 25, 914–923. [Google Scholar] [CrossRef]
- Zaporozec, A. Graphical interpretation of water-quality data. Ground Water 1972, 10, 32–43. [Google Scholar] [CrossRef]
- Murad, A.A.; Garamoon, H.; Hussein, S.; Al-Nuaimi, H.S. Hydrogeochemical characterization and isotope investigations of a carbonate aquifer of the northern part of the United Arab Emirates. J. Asian Earth Sci. 2011, 40, 213–225. [Google Scholar] [CrossRef]
- Ministry of Water Resources and Irrigation (MWRI). Guidelines Regarding Protection of the Nile River and Water Resources from the Pollution, Egypt, Law 48/1982; Ministry of Water Resources and Irrigation: Cairo, Egypt, 2009; Decision No. 402. [Google Scholar]
- Garg, V.K.; Suthar, S.; Singh, S.; Sheoran, A.; Garima, M.; Jai, S. Drinking water quality in villages of southwestern Haryana, India: Assessing human health risks associated with hydrochemistry. Environ. Geol. 2009, 58, 1329–1340. [Google Scholar] [CrossRef]
- He, F.J.; MacGregor, G.A. A comprehensive review on salt and health and current experience of worldwide salt reduction programmes. J. Human Hypertens. 2009, 23, 363–384. [Google Scholar] [CrossRef] [PubMed]
- McCarthy, M.F. Should we restrict chloride rather than sodium? Med. Hypothesis 2004, 63, 138–148. [Google Scholar] [CrossRef] [PubMed]
- Subba Rao, N.; Surya Rao, P.; Venktram Reddy, G.; Nagamani, M.; Vidyasagar, G.; Satyanarayana, N.L. Chemical characteristics of groundwater and assessment of groundwater quality in Varaha River Basin, Visakhapatnam District, Andhra Pradesh, India. Environ. Monit. Assess. 2012, 184, 5189–5214. [Google Scholar]
- Shrivastava, P.; Kumar, R. Soil salinity: A serious environmental issue and plant growth promoting bacteria as one of the tools for its alleviation. Saudi J. Biol. Sci. 2015, 22, 123–131. [Google Scholar] [CrossRef]
- Ayers, R.S.; Westcot, D.W. Water Quality for Agriculture; FAO Irrigation and Drainage Paper 29; FAO: Rome, Italy, 1976; 97p. [Google Scholar]
- Nagaraju, A.; Sunil Kumar, K.; Thejaswi, A. Assessment of groundwater quality for irrigation: A case study from Bandalamottu lead mining area, Guntur district, Andhra Pradesh, South India. Appl. Water Sci. 2014, 4, 385–396. [Google Scholar] [CrossRef]
- Johnson, E.E. Groundwater and Wells, 1st Indian ed.; Jain Brothers: Udaipur, India, 1983; 440p. [Google Scholar]
- Mukherjee, I.; Singh, U.K.; Chakma, S. Evaluation of groundwater quality for irrigation water supply using multi-criteria decision-making techniques and GIS in an agroeconomic tract of Lower Ganga basin, India. J. Environ. Manag. 2022, 309, 114691. [Google Scholar] [CrossRef]
- Khan, M.S.; Shahid, M. Improving Water Quality Using Metal−Organic Frameworks. In Metal−Organic Frameworks for Environmental Remediation; American Chemical Society: Washington, DC, USA, 2021; pp. 171–191. [Google Scholar] [CrossRef]
- Shi, Y.; Zou, Y.; Khan, M.S.; Zhang, M.; Yan, J.; Zheng, X.; Wang, W.; Xie, Z. Metal–organic framework-derived photoelectrochemical sensors: Structural design and biosensing technology. J. Mater. Chem. C 2023, 11, 3692–3709. [Google Scholar] [CrossRef]


| Ser.No | Location | Lat-N | Long-E | Depth-m | Aquifer |
|---|---|---|---|---|---|
| G1 | Ghweiba basin | 29.63 | 32.30 | 70 | Quaternary aquifer |
| G2 | Ghweiba basin | 29.63 | 32.29 | 129 | Quaternary aquifer |
| G3 | Ghweiba basin | 29.63 | 32.30 | 150 | Quaternary aquifer |
| G4 | Ghweiba basin | 29.63 | 32.29 | 120 | Quaternary aquifer |
| G5 | Badaa basin | 29.72 | 32.27 | 144 | Quaternary aquifer |
| G6 | Badaa basin | 29.72 | 32.28 | 144 | Quaternary aquifer |
| G7 | Badaa basin | 29.72 | 32.28 | 146 | Quaternary aquifer |
| G8 | Badaa basin | 29.67 | 32.34 | 128 | Tertiary aquifer |
| G9 | Badaa basin | 29.67 | 32.34 | 117 | Quaternary aquifer |
| G10 | Hagul | 29.73 | 32.37 | 75 | Quaternary aquifer |
| Ser.No | pH | EC | TDS | K+ | Na+ | Mg2+ | Ca2+ | Cl− | SO42− | HCO3− | NO3− | Cd | Cu | Pb | Fe | TH | CR |
|---|---|---|---|---|---|---|---|---|---|---|---|---|---|---|---|---|---|
| G1 | 7.23 | 5320 | 3558 | 34 | 826 | 171 | 211 | 1384 | 645 | 265 | 16.2 | 0.014 | 0.0025 | 0.022 | 0 | 1229 | 9.89 |
| G2 | 7.06 | 4274 | 2589 | 27 | 470 | 188 | 205 | 1190 | 405 | 82 | 0 | 0 | 0.024 | 0.082 | 0 | 1283 | 25.58 |
| G3 | 7.32 | 5570 | 4081 | 24 | 934 | 172 | 254 | 1699 | 595 | 381 | 2 | 0.042 | 0 | 0.112 | 0 | 1340 | 7.91 |
| G4 | 6.91 | 7070 | 3420 | 30 | 280 | 425 | 351 | 1779 | 395 | 137 | 2.1 | 0 | 0.004 | 0.222 | 0.006 | 2620 | 21.29 |
| G5 | 6.96 | 4569 | 2763 | 13 | 631 | 89 | 230 | 1254 | 395 | 129 | 0.92 | 0.031 | 0.0024 | 0.162 | 0.004 | 940 | 16.88 |
| G6 | 7.03 | 3750 | 3174 | 6.5 | 782 | 88 | 225 | 1174 | 395 | 482 | 0.84 | 0.006 | 0.0034 | 0.182 | 0 | 923 | 4.28 |
| G7 | 7.68 | 1430 | 2543 | 11 | 167 | 232 | 337 | 877 | 405 | 492 | 1.2 | 0.024 | 0 | 0.192 | 0.0021 | 1794 | 3.37 |
| G8 | 7.12 | 11,340 | 6841 | 8.3 | 1504 | 332 | 528 | 3327 | 995 | 127 | 2.8 | 0.021 | 0 | 0.022 | 0.0401 | 2681 | 45.06 |
| G9 | 7.34 | 7670 | 5123 | 10.3 | 1184 | 255 | 368 | 2427 | 745 | 112 | 6 | 0.005 | 0 | 0.122 | 0.014 | 1966 | 37.45 |
| G10 | 8.02 | 7620 | 2450 | 12 | 514 | 105 | 191 | 1026 | 220 | 365 | 0 | 0 | 0 | 0.132 | 0.021 | 908 | 4.59 |
| Ser.No | rNa+/rCl− | rSO42−/rCl− | rCa2+/rMg2+ | rCa2+/rNa+ | rCa2+ + rMg2+/HCO3− | RSC | MH |
|---|---|---|---|---|---|---|---|
| G1 | 0.92 | 0.34 | 0.75 | 0.29 | 5.66 | −20.25 | 57.2 |
| G2 | 0.61 | 0.25 | 0.66 | 0.50 | 19.11 | −24.35 | 60.2 |
| G3 | 0.85 | 0.26 | 0.90 | 0.31 | 4.29 | −20.57 | 52.7 |
| G4 | 0.24 | 0.16 | 0.50 | 1.44 | 23.36 | −50.22 | 66.6 |
| G5 | 0.78 | 0.23 | 1.57 | 0.42 | 8.89 | −16.68 | 38.9 |
| G6 | 1.03 | 0.25 | 1.55 | 0.33 | 2.34 | −10.56 | 39.2 |
| G7 | 0.29 | 0.34 | 0.88 | 2.31 | 4.45 | −27.83 | 53.2 |
| G8 | 0.70 | 0.22 | 0.97 | 0.40 | 25.77 | −51.57 | 50.9 |
| G9 | 0.75 | 0.23 | 0.88 | 0.36 | 21.43 | −37.50 | 53.3 |
| G10 | 0.77 | 0.16 | 1.10 | 0.43 | 3.04 | −12.18 | 47.5 |
Disclaimer/Publisher’s Note: The statements, opinions and data contained in all publications are solely those of the individual author(s) and contributor(s) and not of MDPI and/or the editor(s). MDPI and/or the editor(s) disclaim responsibility for any injury to people or property resulting from any ideas, methods, instructions or products referred to in the content. |
© 2023 by the authors. Licensee MDPI, Basel, Switzerland. This article is an open access article distributed under the terms and conditions of the Creative Commons Attribution (CC BY) license (https://creativecommons.org/licenses/by/4.0/).
Share and Cite
Al-Awah, H.; Redwan, M.; Rizk, S. Groundwater Hydrogeochemistry Impacted by Industrial Activities in Ain Sukhna Industrial Area, North-Western Part of the Gulf of Suez, Egypt. Sustainability 2023, 15, 12787. https://doi.org/10.3390/su151712787
Al-Awah H, Redwan M, Rizk S. Groundwater Hydrogeochemistry Impacted by Industrial Activities in Ain Sukhna Industrial Area, North-Western Part of the Gulf of Suez, Egypt. Sustainability. 2023; 15(17):12787. https://doi.org/10.3390/su151712787
Chicago/Turabian StyleAl-Awah, Hezam, Mostafa Redwan, and Shaymaa Rizk. 2023. "Groundwater Hydrogeochemistry Impacted by Industrial Activities in Ain Sukhna Industrial Area, North-Western Part of the Gulf of Suez, Egypt" Sustainability 15, no. 17: 12787. https://doi.org/10.3390/su151712787