Article

Relative Influence of Meteorological Variables of Human Thermal Stress in Peninsular Malaysia

by
Mohamad Rajab Houmsi
1,2,*,
Zulhilmi bin Ismail
1,2,
Ghaith Falah Ziarh
3,4,
Mohammed Magdy Hamed
5,
Daeng Siti binti Maimunah Ishak
2,
Mohd Khairul Idlan Muhammad
1,
Muhamad Zulhasif bin Mokhtar
1,
Zulfaqar Sa’adi
1,6 and
Shamsuddin Shahid
1,2
1
Department of Water and Environmental Engineering, Faculty of Civil Engineering, Universiti Teknologi Malaysia (UTM), Johor Bahru 81310, Johor, Malaysia
2
Centre for River and Coastal Engineering (CRCE), Universiti Teknologi Malaysia, Johor Bahru 81310, Johor, Malaysia
3
Civil Engineering Department, University of Technology-Iraq, Alsian’s Street, Baghdad 10066, Iraq
4
College of Engineering, University of Warith Al-Anbiyaa, Karbala 56001, Iraq
5
Construction and Building Engineering Department, College of Engineering and Technology, Arab Academy for Science, Technology and Maritime Transport (AASTMT), B 2401 Smart Village, Giza 12577, Egypt
6
Centre for Environmental Sustainability and Water Security (IPASA), Research Institute for Sustainable Environment, Universiti Teknologi Malaysia (UTM), Johor Bahru 81310, Johor, Malaysia
*
Author to whom correspondence should be addressed.
Sustainability 2023, 15(17), 12842; https://doi.org/10.3390/su151712842
Submission received: 24 July 2023 / Revised: 9 August 2023 / Accepted: 22 August 2023 / Published: 24 August 2023

Abstract

:
Climate change has significantly increased human thermal stress, particularly in tropical regions, exacerbating associated risks and consequences, such as heat-related illnesses, decreased workability, and economic losses. Understanding the changes in human thermal stress and its drivers is crucial to identify adaptation measures. This study aims to assess various meteorological variables’ spatial and seasonal impact on Wet Bulb Globe Temperature (WBGT), an indicator of human thermal stress, in Peninsular Malaysia. The Liljegren method is used to estimate WBGT using ERA5 hourly data from 1959 to the present. The trends in WBGT and its influencing factors are evaluated using a modified Mann-Kendall test to determine the region’s primary driver of WBGT change. The results indicate that air temperature influences WBGT the most, accounting for nearly 60% of the variation. Solar radiation contributes between 20% and 30% in different seasons. Relative humidity, zenith, and wind speed have relatively lesser impacts, ranging from −5% to 20%. Air temperature has the highest influence in the northern areas (>60%) and the lowest in the coastal regions (40%). On the other hand, solar radiation has the highest influence in the southern areas (20–40%) and the least in the north. The study also reveals a significant annual increase in temperature across all seasons, ranging from 0.06 to 0.24 °C. This rapid temperature rise in the study area region has led to a substantial increase in WBGT. The higher increase in WBGT occurred in the coastal regions, particularly densely populated western coastal regions, indicating potential implications for public health. These findings provide valuable insights into the factors driving WBGT and emphasize the importance of considering air temperature as a key variable when assessing heat stress.

1. Introduction

Human heat stress refers to the physiological distress individuals experience when their bodies are unable to regulate their internal temperature within the normal range due to exposure to excessive environmental heat [1,2]. It occurs when the body’s ability to dissipate heat through perspiration and transpiration is impaired [3,4,5], resulting in an imbalance between heat production and heat loss and an accumulation of heat [4,6,7]. High ambient temperature, high humidity, strenuous physical activity, restricted airflow, and inadequate hydration can all contribute to heat stress [8,9]. Prolonged exposure to heat stress may result in various heat-related ailments, spanning from moderate conditions such as heat exhaustion to severe and potentially fatal conditions such as heat stroke [10,11].
The effects of climate change on human thermal stress are substantial, exacerbating the associated risks and consequences [12]. As global temperatures rise, previously relatively unaffected regions by extreme heat may experience increased heat stress [13]. Expanding the geographic range of heat stress exposes populations not habituated to these conditions, which may increase their susceptibility. The adverse health effects of heat stress in humans include heat exhaustion, heatstroke, and even mortality [11,14]. As a result of the amplification of heat stress by climate change, there is an increased risk of heat-related ailments and deaths, especially among vulnerable populations such as the elderly, infants, and those with preexisting health conditions [4,14,15,16]. Therefore, it is essential to address the effects of thermal stress on humans caused by climate change [17,18].
Heat stress indices are utilized to evaluate the potential effects of heat on human health and well-being. Heat Index (HI) or “Feels Like” Temperature, Wet Bulb Globe Temperature (WBGT), Humidex, Apparent Temperature (AT), Predicted Heat Strain (PHS), Universal Thermal Climate Index (UTCI), and Discomfort Index (DI) are some commonly used heat stress indices [19,20,21,22]. The information provided by these indices [19] assists individuals, communities, and industries in recognizing and mitigating the hazards associated with heat stress [18]. WBGT stands out among these indices due to its exhaustive evaluation of heat stress in occupational and outdoor environments [3,23,24,25]. Temperature, humidity, wind speed, and radiation are taken into account. By considering these factors together, WBGT provides a more comprehensive and accurate evaluation of the heat stress individuals experience [24,26,27].
Gridded meteorological variables over an extended period offer the chance to estimate WBGT at various grid locations. This provides insights into the spatial and temporal variations of WBGT. Numerous studies have utilized gridded data to map WBGT across different regions. For instance, using gridded reanalysis data, [28] estimated WBGT to illustrate the spatiotemporal fluctuations in human thermal heat stress across South Asia. The authors of [29] estimated the spatiotemporal variations of WBGT in South Korea to evaluate the required patterns for rest time. Meanwhile, [30] employed gridded reanalysis data to depict the spatial and temporal changes in various heat stress categories in Peninsular Malaysia using WBGT. In a different context, [31] used WBGT to showcase potential alterations in the spatial and temporal variability of WBGT in temperate hot climate regions due to climate change. The insights gained from these studies contribute to developing adaptation strategies for mitigating human thermal stress and its repercussions, including heat-related illnesses, decreased workability, increased energy demands, and economic impacts.
Numerous strategies can be implemented to adapt to or mitigate elevated WBGT conditions [6,30,31,32,33,34,35]. Providing shady areas, installing ventilation and cooling systems, and insulating heated surfaces are examples of engineering controls that can modify the environment to reduce heat stress [12,36]. Administrative controls include managing work schedules and tasks during high WBGT conditions, altering work/rest cycles, rescheduling outdoor activities for milder times of day, and providing frequent pauses in the shade or air conditioning [6,17,37]. Individuals operating in high WBGT environments can also be provided with personal protective equipment such as lightweight and breathable apparel, cooling vests, caps, and solar protection measures [38,39,40].
The value of WBGT is affected by several variables, such as the mean air temperature, net solar radiation, relative humidity, zenith, and wind speed [24,41]. When evaluating thermal stress and its effects on human health, it is essential to consider these factors. Higher air temperature contributes to increased WBGT values, thereby intensifying heat stress [42]. WBGT is also affected by relative humidity, solar radiation, and wind speed. Higher relative humidity diminishes the evaporative cooling potential, thereby increasing WBGT, whereas intense sunlight and direct solar radiation increase the total heat burden [40,43]. Wind speed can enhance evaporation and promote cooling, potentially reducing WBGT; however, in extremely hot and arid conditions, powerful winds can exacerbate dehydration and heighten heat stress. These factors interact with and influence one another, necessitating their collective consideration when assessing heat stress and its potential effects on individuals in various contexts, including workplaces, sporting events, and outdoor environments [42,43,44]. Human heat stress is a significant concern exacerbated by climate change, and it is crucial to accurately assess heat stress to comprehend the influence of various meteorological factors on WBGT [37,45]. The WBGT index’s exhaustive evaluation enables a more holistic comprehension of heat stress in various contexts [46]. Estimating the relative influence of the factors on WBGT is crucial for instituting appropriate adaptation and mitigation measures to safeguard individuals and communities from the detrimental effects of heat stress in a climate that is changing [47,48,49].
WBGT is an essential parameter of people’s well-being in Peninsular Malaysia, located in the tropical region. The WBGT levels in Peninsular Malaysia are frequently elevated, posing difficulties for those who engage in outdoor or occupational activities [39,50,51]. The combination of high temperatures, humidity, and solar radiation can create uncomfortable and potentially hazardous conditions, especially for those performing physically demanding tasks or spending extended periods outdoors. Due to the urban heat island effect, urban areas with their concrete structures and limited green spaces can exacerbate heat stress [52,53,54,55]. It is essential to take action to mitigate the effects of WBGT on the population of this tropical nation. To determine the appropriate adaptation measures, a quantitative assessment of the relative influence of various meteorological factors is crucial [34,55,56].
This study aims to determine the impact of various meteorological variables on Peninsular Malaysia’s WBGT, an indicator of human thermal stress. This study examined the spatial and seasonal variations of various WBGT-influencing factors. In addition, the trends in WBGT and various influencing factors are evaluated to determine the primary driver of WBGT change in Peninsular Malaysia. The findings of this study are anticipated to aid in identifying and implementing appropriate adaptation and mitigation measures for safeguarding individuals and communities from the adverse impacts of heat stress in a changing climate.

2. Study Area and Data

2.1. Peninsular Malaysia

Peninsular Malaysia (PM), as shown in Figure 1, comprises Southeast Asia’s southern half of the Malay Peninsula. To the north, it is bordered by Thailand, while Singapore delineates its southern boundary. Additionally, the Malacca Strait divides it from the island of Sumatra to the west. PM is home to many ecosystems, such as tropical rainforests, mangrove swamps, and coastal habitats. It has diverse biodiversity, many endemic species, and key animal protection sites.
Moreover, it has become a center of economic activity in Southeast Asia, with a fast-increasing economy and a burgeoning population. Due to its unique ecological and economic qualities, PM is an essential research focus for many fields of study, such as environmental science, ecology, geography, economics, and the social sciences. This region can be explored concerning various topics, such as the preservation of biodiversity, alteration of land usage, development of cities, growth of tourism, global warming, and the socioeconomic repercussions on local inhabitants [11].
The maximum temperature typically recorded in the PM temperature is 32.6 °C, while the lowest is roughly 24.0 °C. The region’s weather is influenced by the northeast and southwest monsoons due to its geographical location, resulting in considerable rainfall even in the driest month. The yearly average rainfall in PM is between 1950 and 4000 mm. Overall, the climate can be classified into two monsoons: northeast monsoon (NEM) (Nov–Feb) and southwest monsoon (SWM) (May–Aug) and two inter-monsoon periods (IMP): IMP1 (Mar–Apr) and IMP2 (Sep–Oct) [57].

2.2. Dataset

CEMS (Copernicus Emergency Management Service) provides meteorological data in various formats. These datasets are available at both the global and regional levels for various lengths of time. CEMS meteorological data, namely the ERA5 hourly data on single levels from 1959 until the present, were utilized to estimate WBGT. The European Centre for Medium-Range Weather Forecasts (ECMWF), a fifth-generation global climate and weather analysis provider, offers ERA5 reanalysis spanning four to seven decades [55].
ERA5 has a horizontal resolution of 0.25° × 0.25°, a temporal resolution, and 137 layers vertically up to 80 km. It provides data on 10 m u and v wind components, the 2 m dew point temperature, the mean temperature, surface net solar radiation, surface net thermal radiation, surface pressure, total sky direct solar radiation at the surface, and surface net solar radiation downwards at https://cds.climate.copernicus.eu/cdsapp#!/dataset/reanalysis-era5-single-levels?tab=overview (accessed on 1 January 2023).
The mean wind speed is calculated using the wind components from the ERA5 datasets, specifically the u10 and v10 values. These wind speed components are measured at a height of 10 m above the Earth’s surface. However, for the calculation of WBGT, wind speed data at a height of 2 m are required. A logarithmic wind speed profile is applied to adjust the wind speed from heights other than 2 m, considering measurements above a surface with short grass. The solar zenith angle for specific times and locations is estimated based on sun declination, latitude, and hour angle data, utilizing the Zenith Function from the R Geolight Package. Solar radiation is determined by taking the difference between ERA5 surface net solar radiation and surface net thermal radiation. The proportion of direct radiation is calculated by comparing the ERA5 total sky direct solar radiation at the surface to the surface net solar radiation downward. The surface albedo is considered constant (0.4). Details of the preparation of ERA5 data for estimating WBGT can be found in [32].
Figure 2 illustrates the regional spread of numerous meteorological data necessary to compute WBGT in PM. The relative humidity in PM is 77 to 88%, while the Ta is between 21 and 27 °C. This implies that the mean temperature in the examined area does not deviate much over time. In the central highlands, both characteristics are lower, whereas, towards the coast, they are greater. Solar radiation in the east ranges between 195 and 215 W/m2, whereas, in the remaining regions, it ranges between 175 and 195 W/m2. The regional surface pressure (98 to 100 kPa) is high in the south and east but only 92 kPa in the center. Most places have wind speeds between 0.75 and 1.5 m/s, with some coastal spots reaching up to 1.75 m/s.

3. Methods

3.1. Wet Bulb Global Temperature

Lemke et al. [58] extensively analyzed various methodologies published in the literature to evaluate the calculation procedures employed for determining WBGT. In their study, they recommended the use of the Liljegren et al. [32] method for assessing outdoor W B G T . The Liljegren method incorporates three key temperature measurements: the natural wet bulb temperature ( T w ), the globe temperature ( T g ), and the dry bulb (ambient) temperature ( T a ). By utilizing these parameters, the Liljegren method (Equation (1)) provides an effective approach for accurately determining the outdoor WBGT.
W B G T = 0.7 T w + 0.2 T g + 0.1 T a
Details of the estimation of WBGT in Peninsular Malaysia can be found in [30].

3.2. Sensitivity Analysis

The sensitivity analysis measures the influence of the model’s inputs on its output. As a result, it helps to gain insight into how input alterations can affect outputs. This study evaluated the sensitivity of five metrological factors on WBGT. The Global Sensitivity Analysis technique that Nossent et al. [59] created was utilized to complete the task. This technique uses variance decomposition to generate sensitivity indices for variables [60].
This study examined the sensitivity of meteorological variables using a +40% test variance range. For this purpose, the average and variance of each parameter were estimated by approximating its distribution. Sensitivity was determined by keeping one parameter of interest fixed while altering the other factors. The overall sensitivity of all factors was estimated using partial variance. Finally, the variables were ordered based on their sensitivity. The “Sensitivity” package of R (https://CRAN.R-project.org/package=sensitivity (accessed on 1 January 2023)) was utilized to implement Sobol’s approach. The technique is detailed in [58].

3.3. Trend Analysis

The trends in WBGT and its influencing factors were estimated to determine the causes of different changing patterns of WBGT in different regions of PM. Sen’s slope [61,62] was calculated to quantify the change, and the modified Mann-Kendall (MK) test [63] was employed to assess if the changes were significant. This test was adopted to circumvent the serial correlation’s effect on the relevance of trends common in the variables investigated in this study. Further information about these methods can be found in [62,63].

4. Results

4.1. Spatial Distribution of the Influence of WBGT Drivers

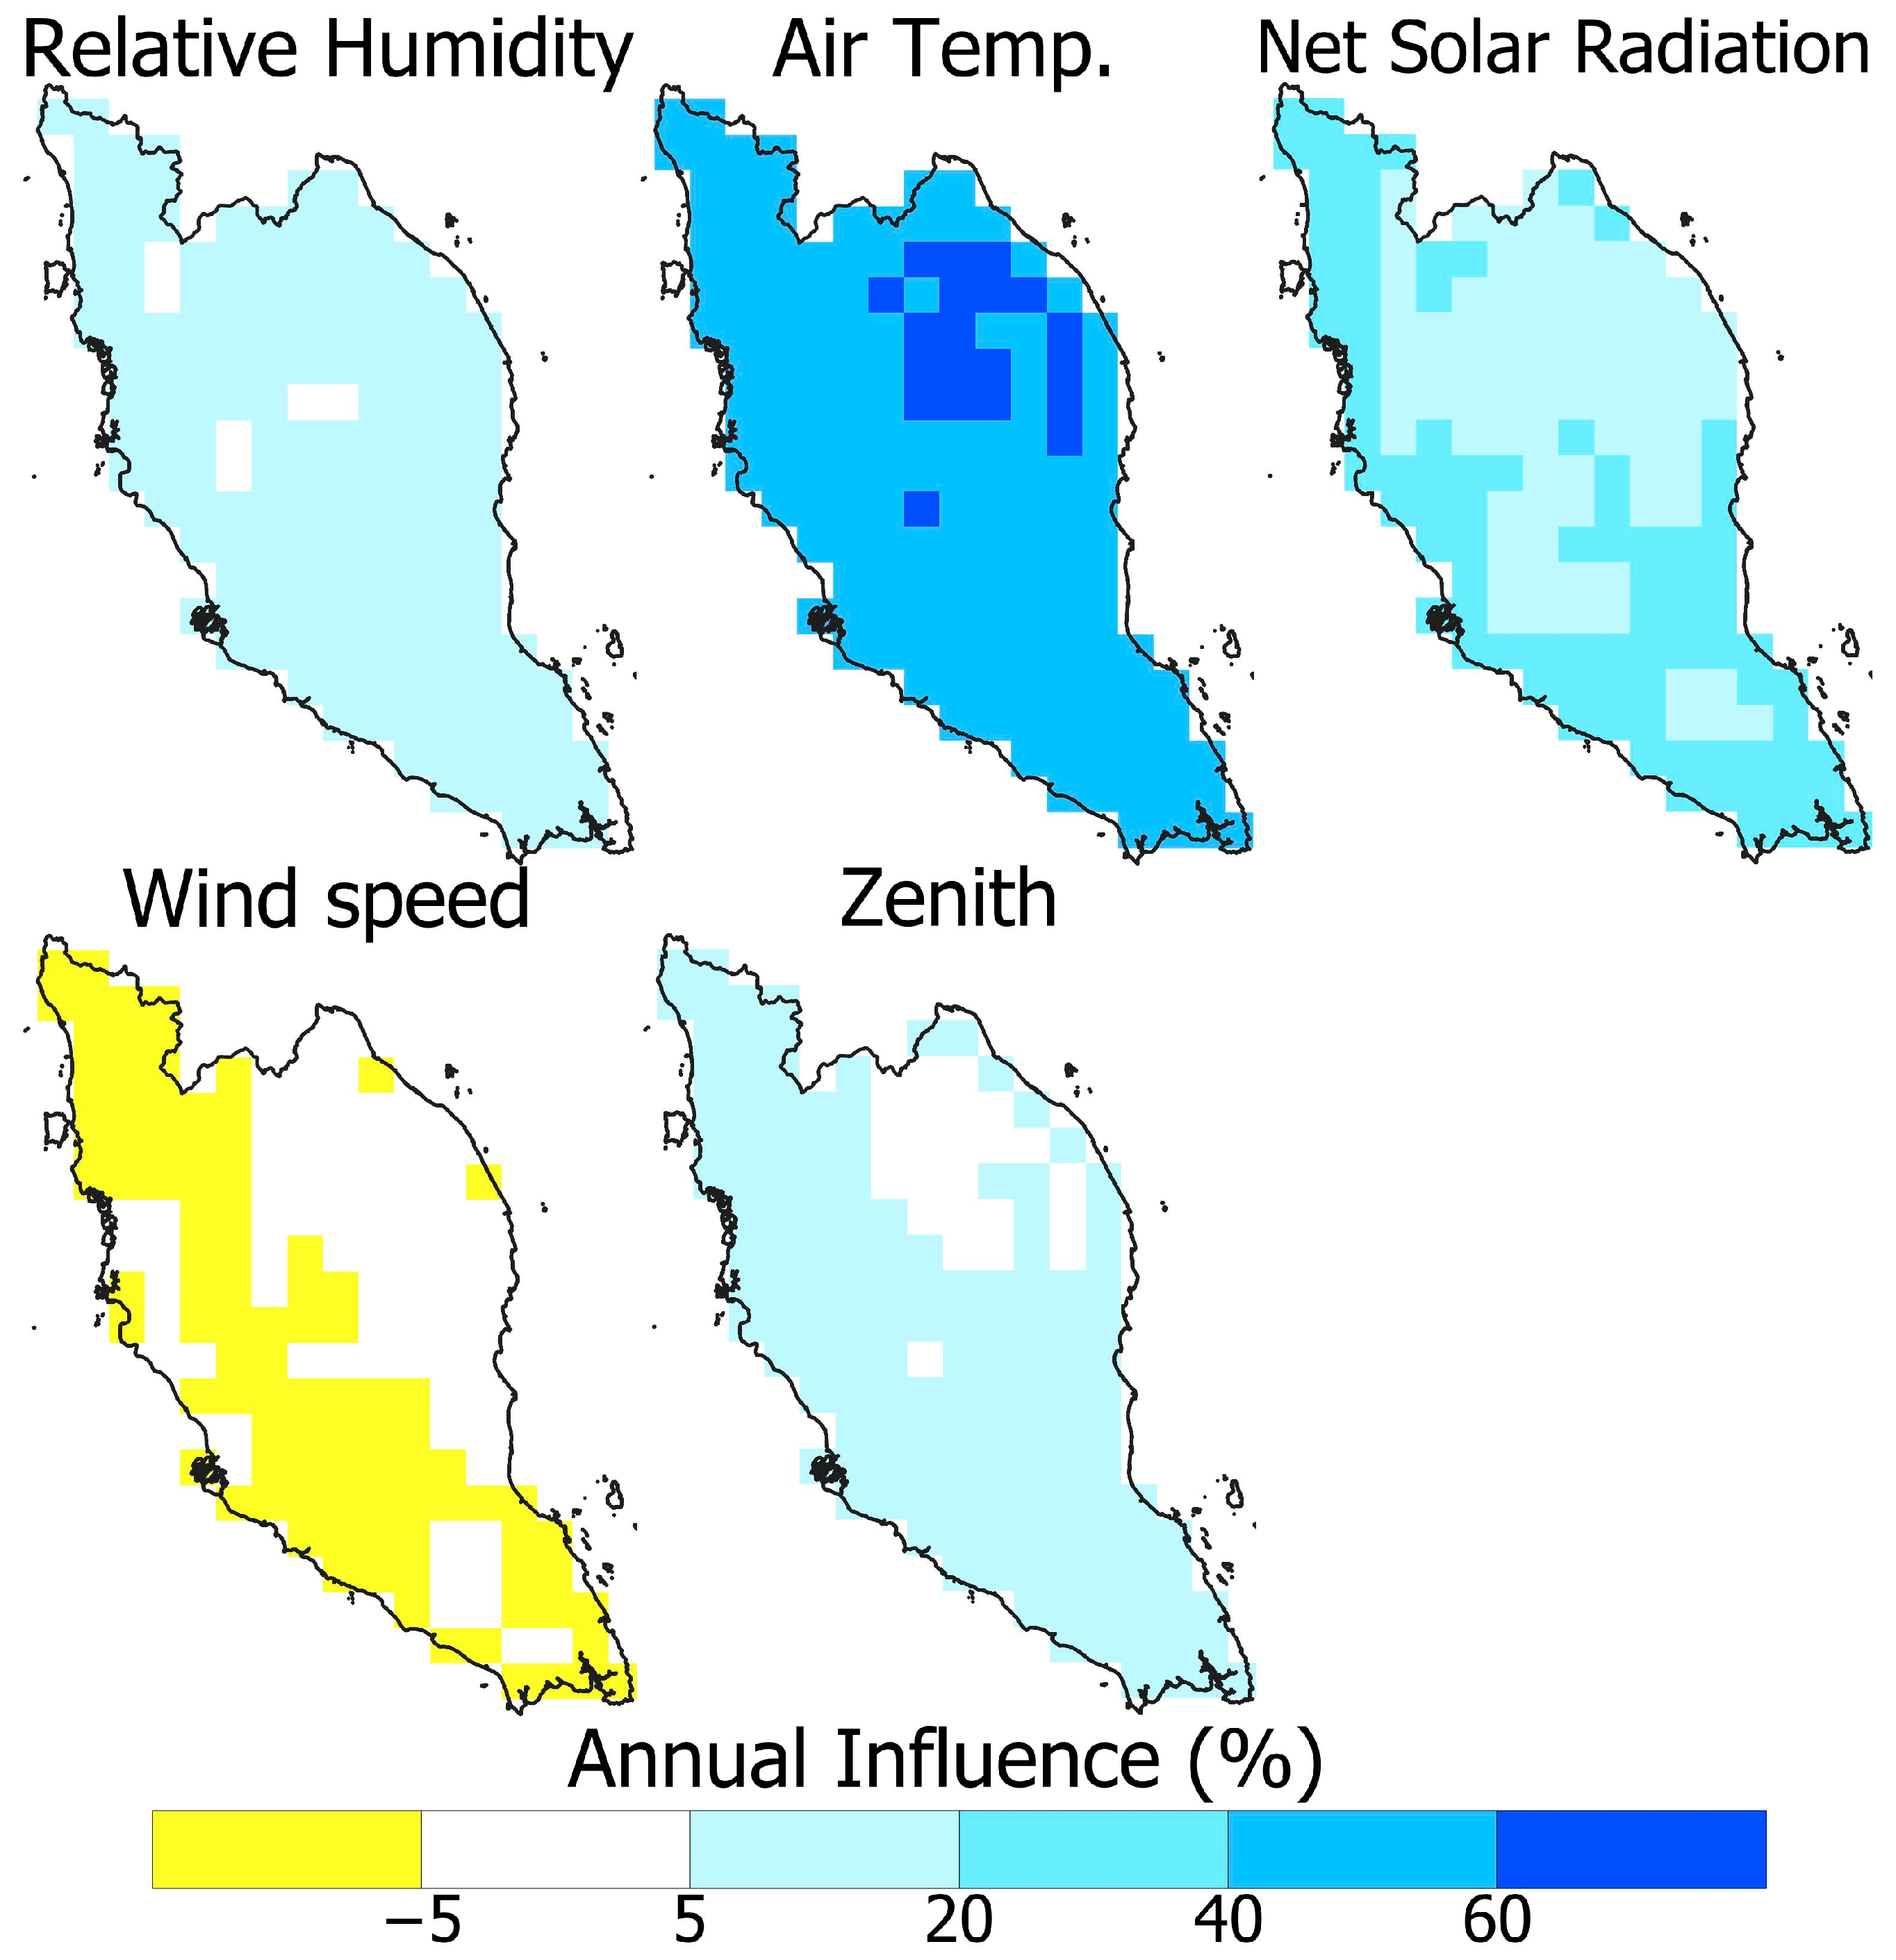
The analysis of meteorological variables on the yearly average of hourly WBGT from 1959 to 2020 in PM reveals that multiple factors contribute to its variation. Figure 3, Figure 4, Figure 5, Figure 6 and Figure 7 visually represent how these variables impact the hourly WBGT in the region. The results demonstrate that air temperature has the most significant influence, ranging from +40% to +60%, particularly in the central part of Eastern PM. Solar radiation shows the second-largest effect, ranging from +5% to +20%. On the other hand, relative humidity and zenith exhibit minor influences, ranging from 0% to +5%. Wind speed, in comparison, shows the least effect of −5% compared to the other variables, specifically on the western side of PM, from north to south.
Figure 3, Figure 4, Figure 5, Figure 6 and Figure 7 depict various factors’ yearly and seasonal influences on the hourly WBGT from 1959 to 2020. The annual analysis highlights that the mean temperature is the most influential factor, followed by solar radiation (Figure 3). The air mean temperature substantially impacts WBGT in the central and northeast regions, accounting for nearly 60% of the variation of WBGT. Its influence in other regions varies from 40 to 50%. Relative humidity, zenith, and wind speed also contribute to WBGT, albeit to a lesser extent, ranging from −5% to 20% in the humid northern areas. Overall, air temperature takes on a dominant role in determining WBGT over the entire peninsula.
During NEM, the regional distribution of the influence of climatic factors was comparable to that of the annual (Figure 4). Relative humidity, zenith, and wind speed had almost no impact on WBGT over PM, except in the north, where the effect of wind speed was negative, ranging between −5 and −10%, and relative humidity was positive, ranging between 5 and 10%. The mean temperature had a positive influence, ranging from 20% to more than 60% across the country. However, these effects were more prominently felt in the northeast and south-central areas compared to the earlier season. In some northern, central, and southern locations, solar radiation had a greater influence (20–35%). Solar radiation generally had a greater effect in places where the impact of air temperature was relatively low.
Figure 5 depicts the impact of weather variables during IMP1. The pattern was like the past seasons, particularly for the mean temperature and solar radiation. Nevertheless, the mean temperature positively impacted WBGT in the north at a higher rate (>60%) during IMP1 than in other seasons. Solar radiation showed a higher influence on the south and west coasts, in the range of 20 to 30%. The relative humidity and zenith influence WBGT in only 5 to 30% but over the entire peninsula. Relative humidity’s positive influence on WBGT in IMP1 was much higher than in the other seasons. Wind speed had a detrimental influence on WBGT in the range of −5 to 10% in the west.
Figure 6 depicts the effects of various variables on WBGT during SWM. In establishing SWM WBGT, the air temperature had the largest influence, followed by solar radiation. However, the influence of the mean temperature was more or less uniform (50 to 60%) for the whole peninsula. Solar radiation showed a higher influence (>20%) in the coastal region and the least (<20%) in the central region. Wind speed showed a negative effect (15%) on WBGT for the entire region. Relative humidity showed less influence (<10%) across the country, while zenith showed almost no influence for the whole country, except 5 to 7% in the coastline region.
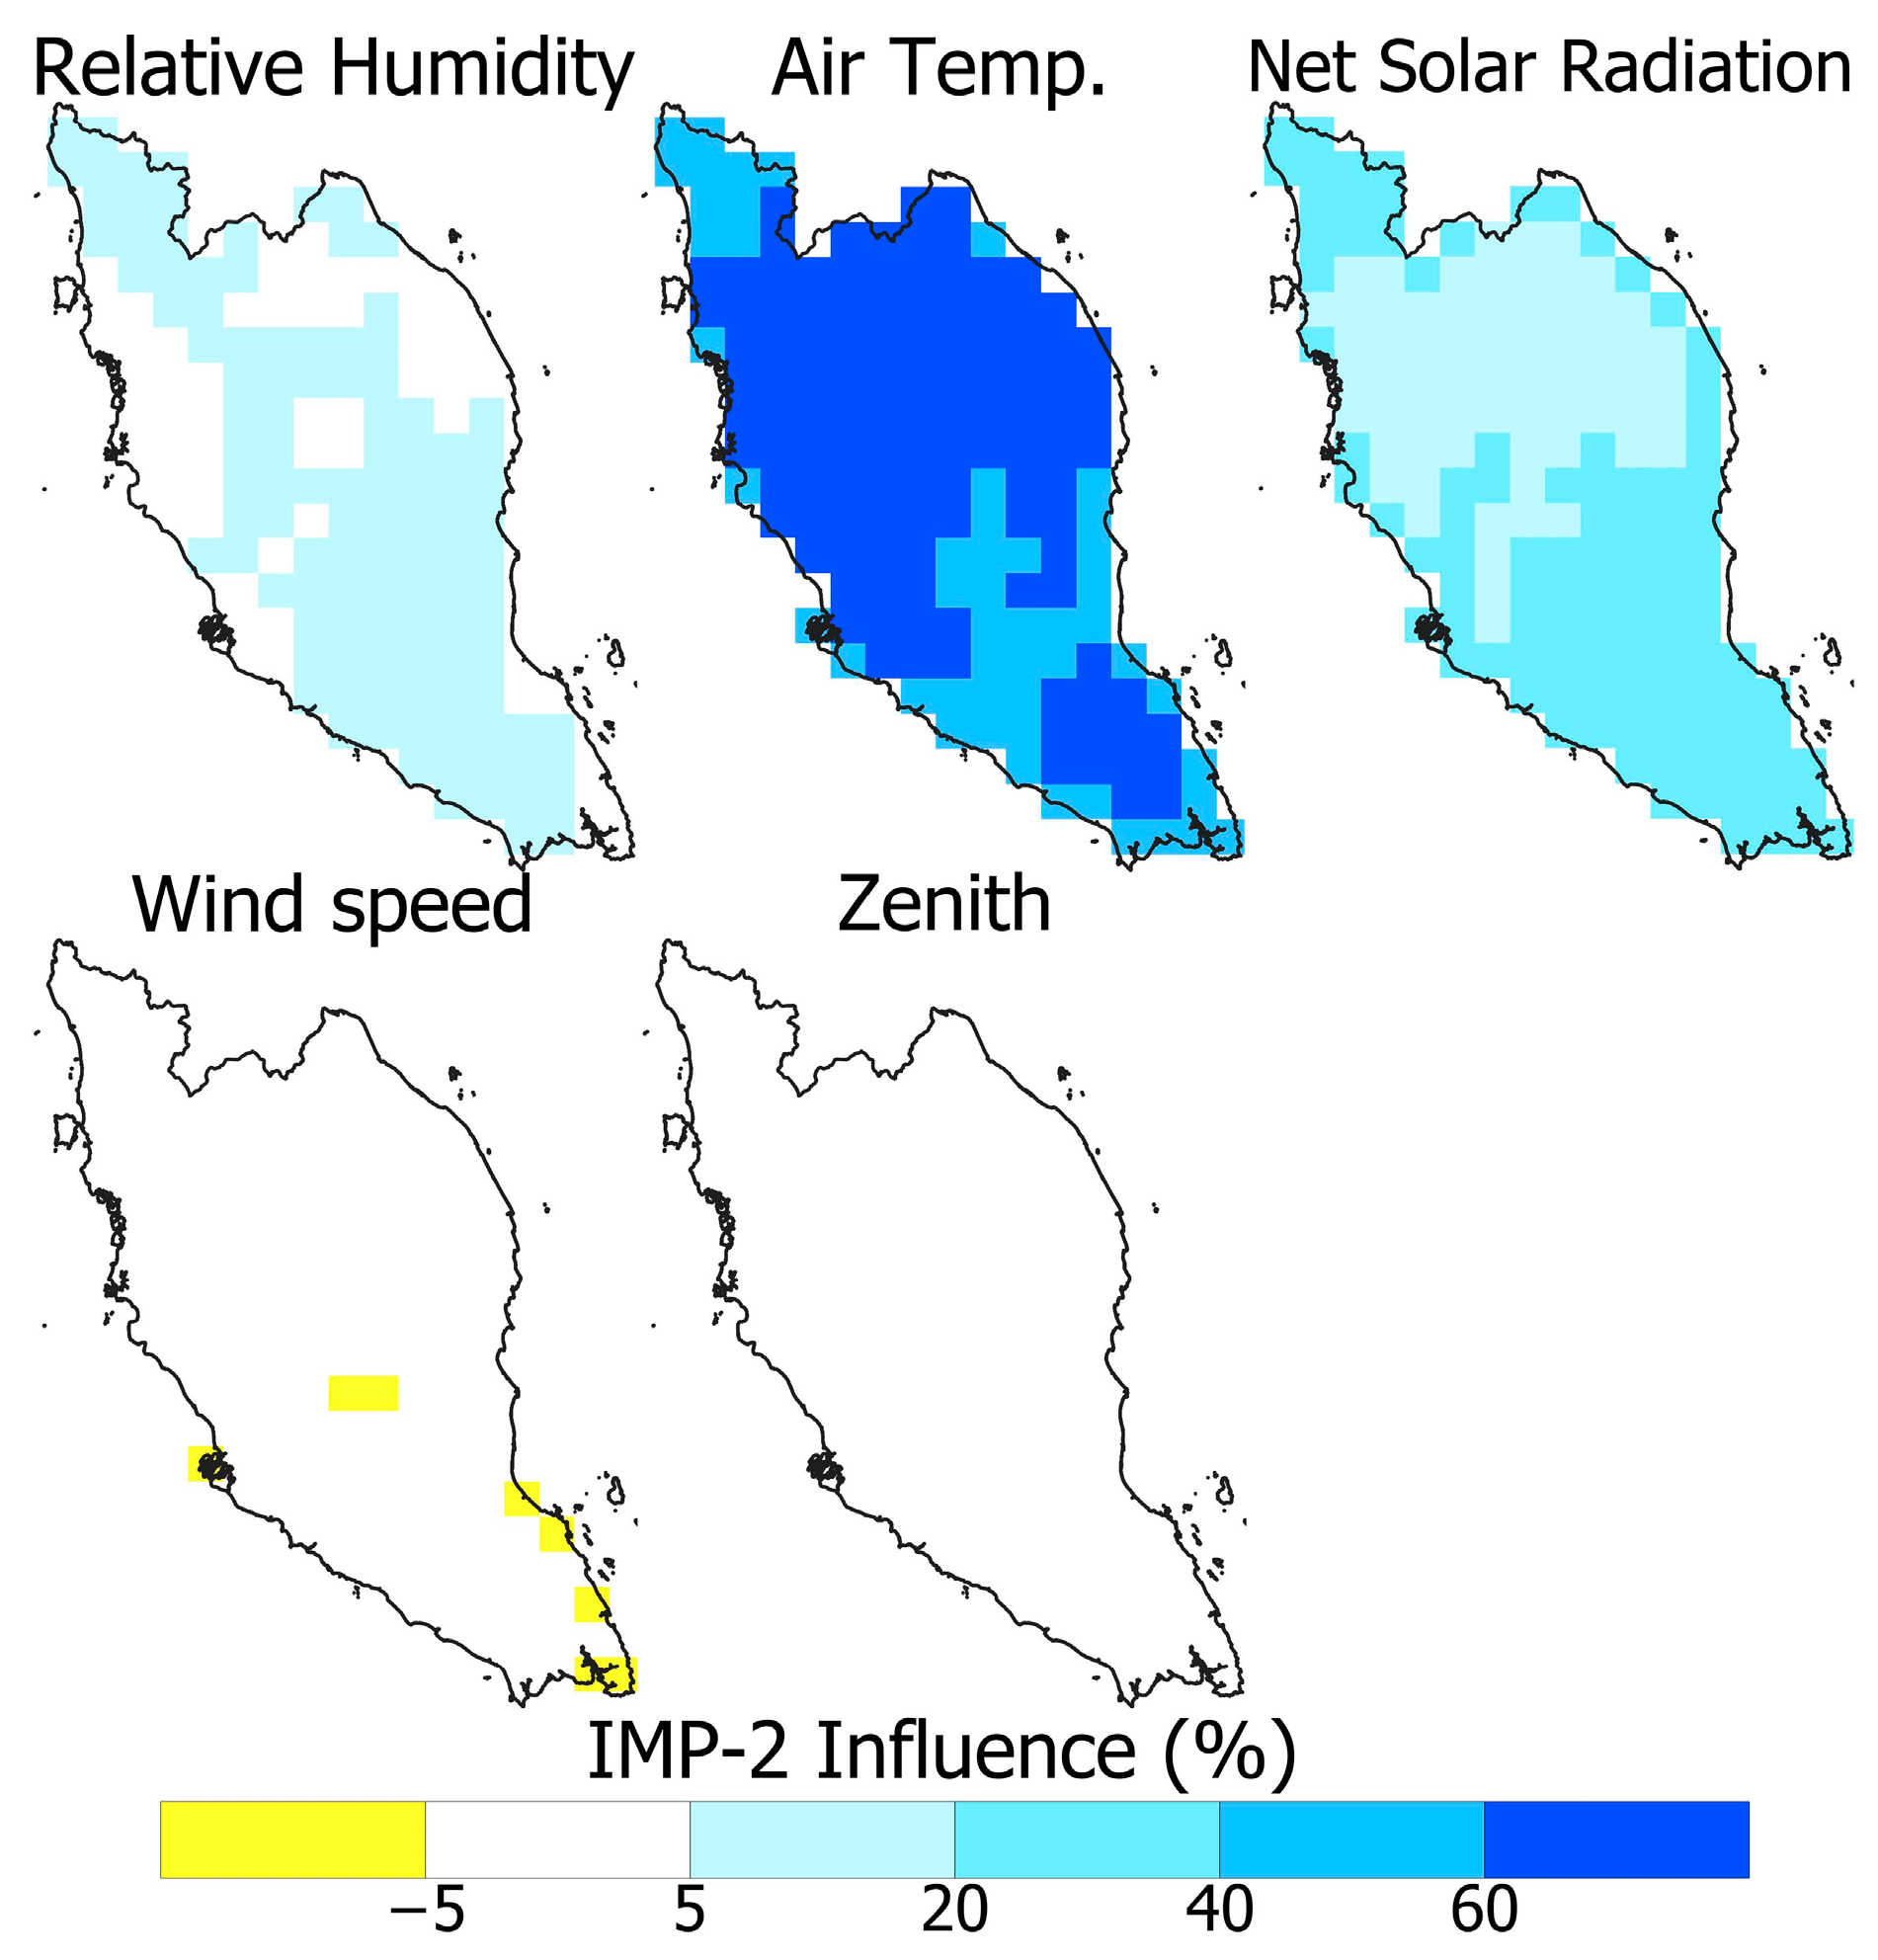
Figure 7 illustrates the effect of the variables during IMP2. The mean temperature had the most powerful effect, reaching over 60% for most of the peninsula, except in the north and southern coastal regions, where its influence was 40%. Solar radiation was the second-most influential contributing factor (20–40%), with a significant effect across the country, except for a few places in the central elevated region. Relative humidity had the lesser impact (<20%) and mostly in the south. The remaining variables had almost no impact.

4.2. Spatial Distribution of the Trends in WBGT Drivers

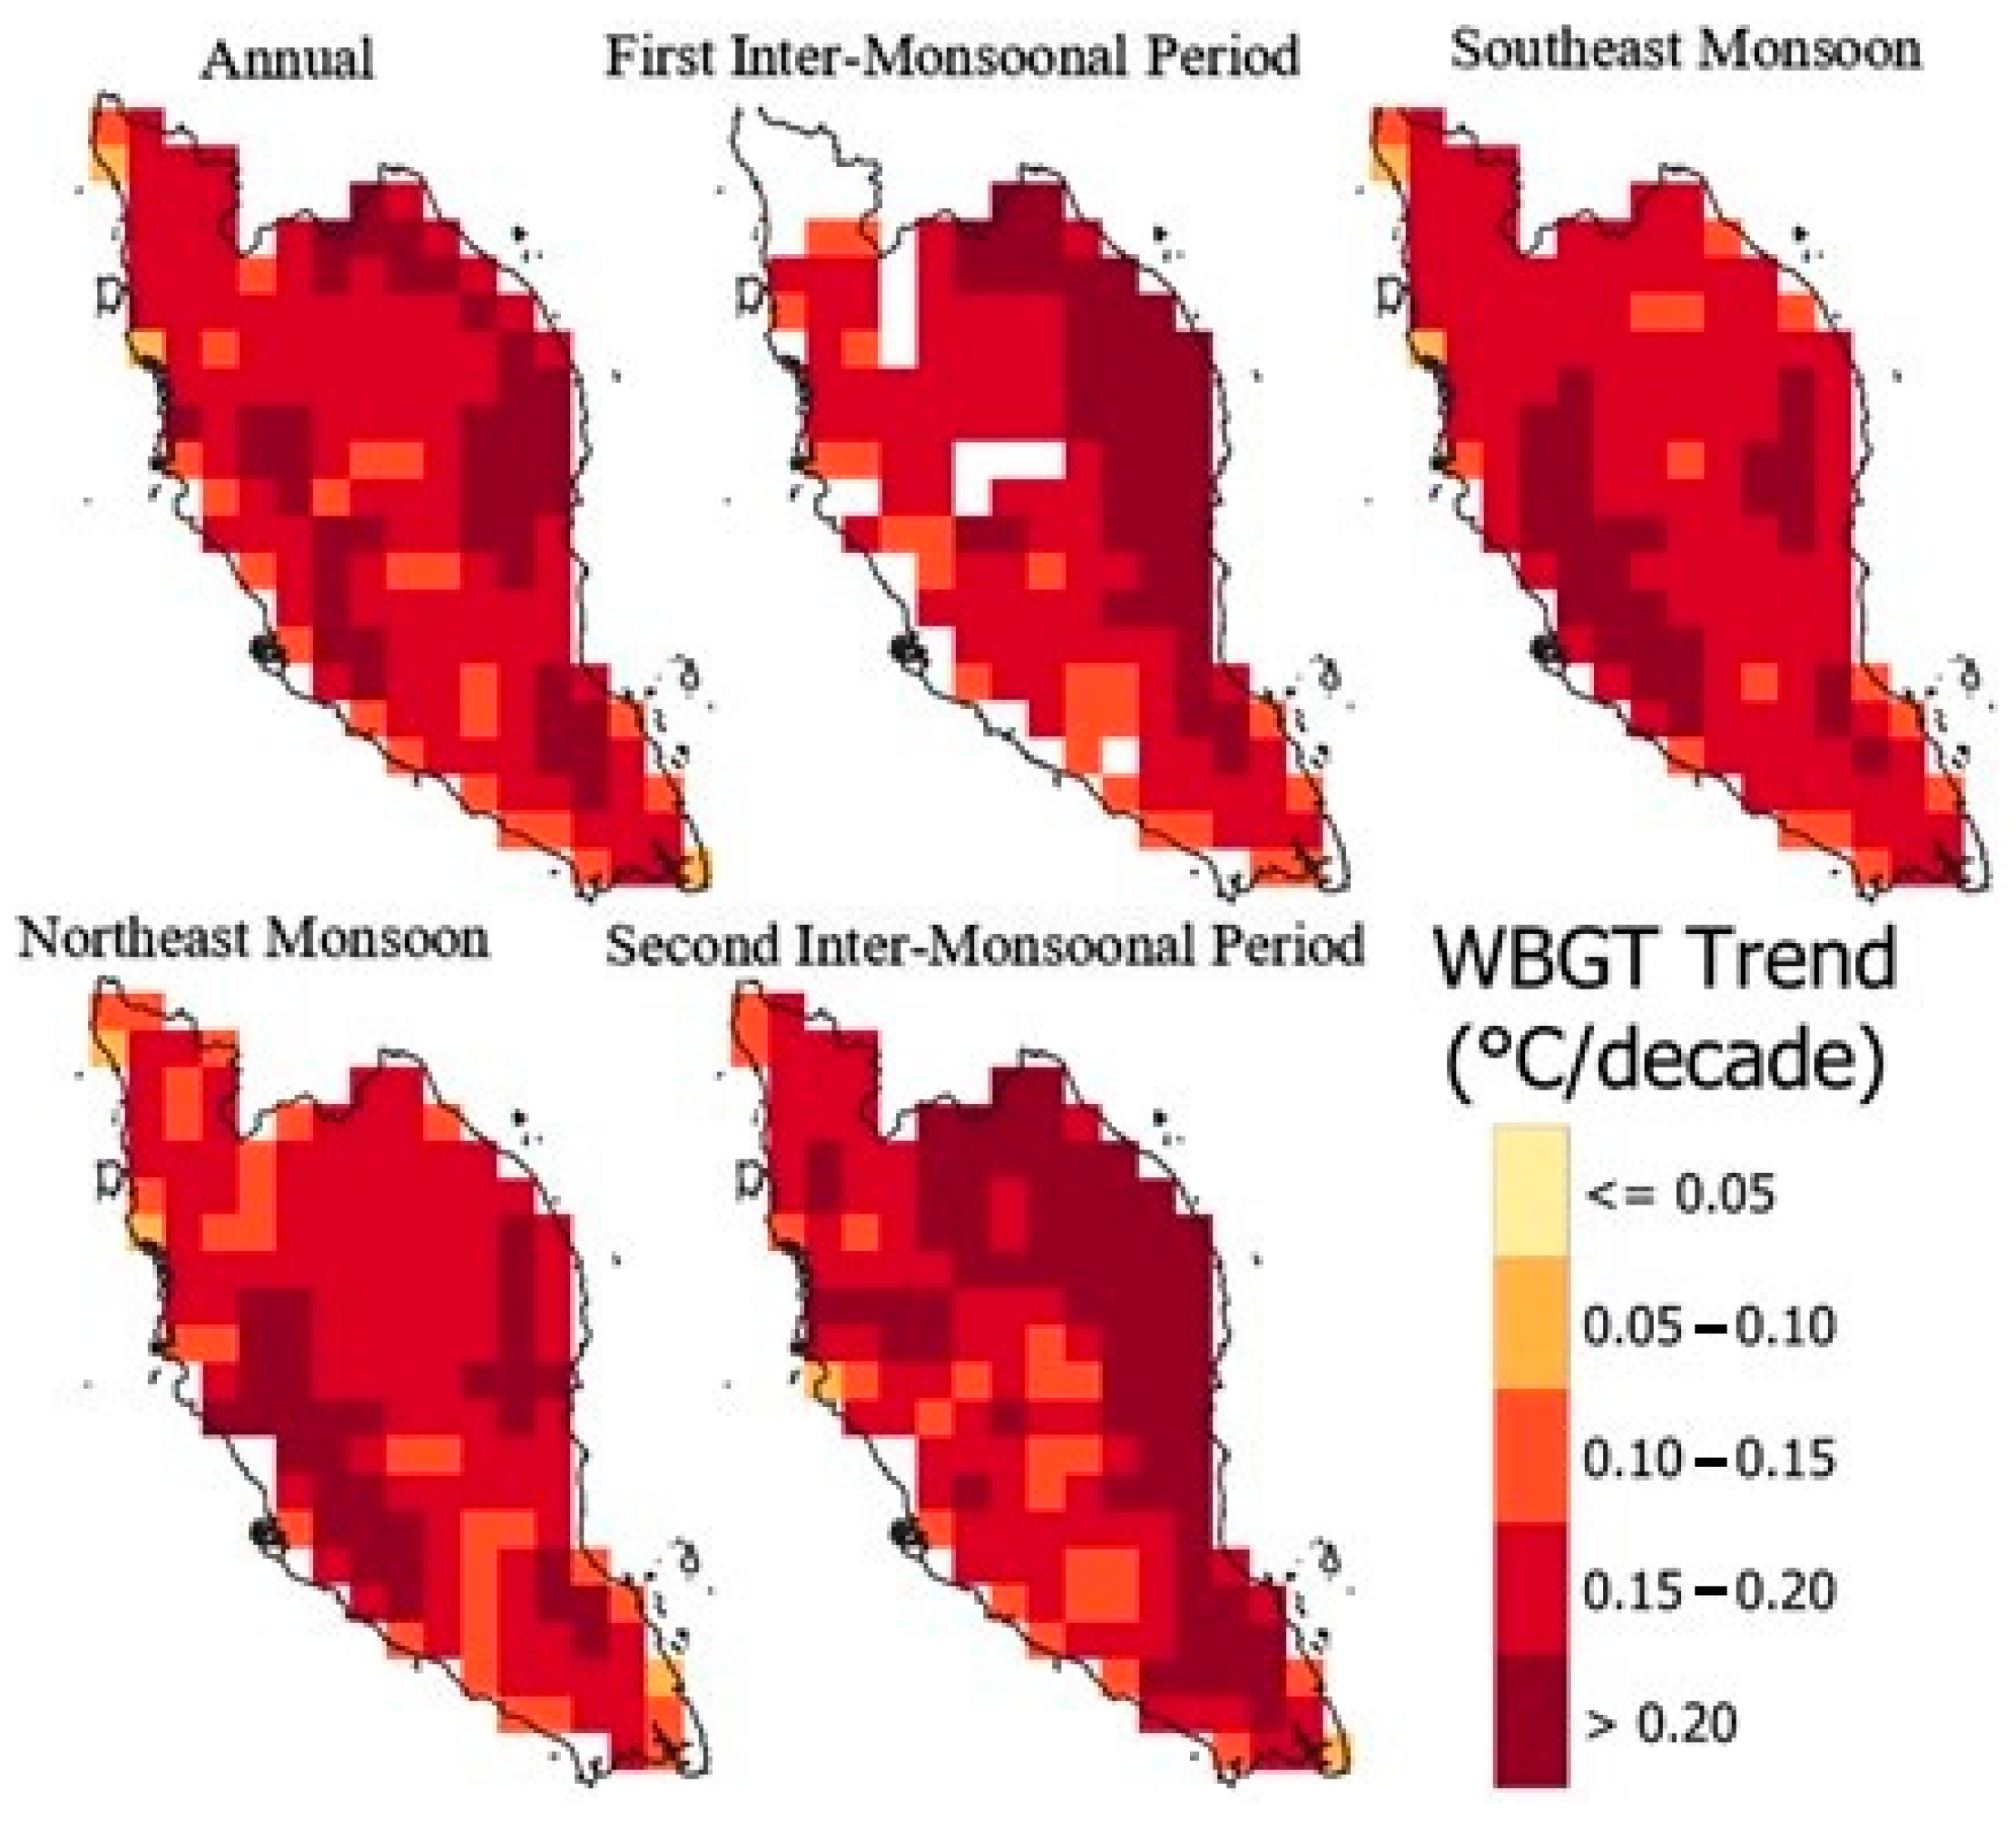
Figure 8 shows the spatial distribution of annual and seasonal WBGT trends. Only the significant changes are presented using a color ramp in the figures. The red indicates an increase, while the blue indicates a decrease in the factors. The figure shows a significant increase in WBGT annually and in all seasons in the range of 0.04 to 0.23 °C/decade. The highest increase in WBGT was in the northeastern coastal region during IMP1 and IMP2, while the lowest was on the western coast during IMP1. Overall, there was an opposing pattern of higher trends during monsoon and non-monsoon seasons. The trends were higher on the western coast during both monsoon seasons and on the east coast during inter-monsoonal seasons. Therefore, the annual trends in WBGT showed a higher increase in the coastal region compared to the islands.
The spatial variability of the annual and seasonal trends of the drivers of WBGT are presented in Figure 9, Figure 10 and Figure 11. Figure 9 shows a significant annual mean temperature increase for all seasons in the range of 0.06 to 0.24 °C/decade. The highest increase in the mean air temperature was in IMP1, while the lowest was in the summer. The annual mean temperature changes were higher (0.18 to 0.24 °C/decade) in the east and least (~0.06 °C/decade) on the west coast. In addition, a high rise in the mean temperature (>0.24 °C/decade) was noticed in dense urban areas in the central-west region. This indicates a higher rise in the mean temperature over a major part of PM than the global average mean temperature rise. Overall, the study revealed a higher increase in temperature in the coastal region than in the central highlands.
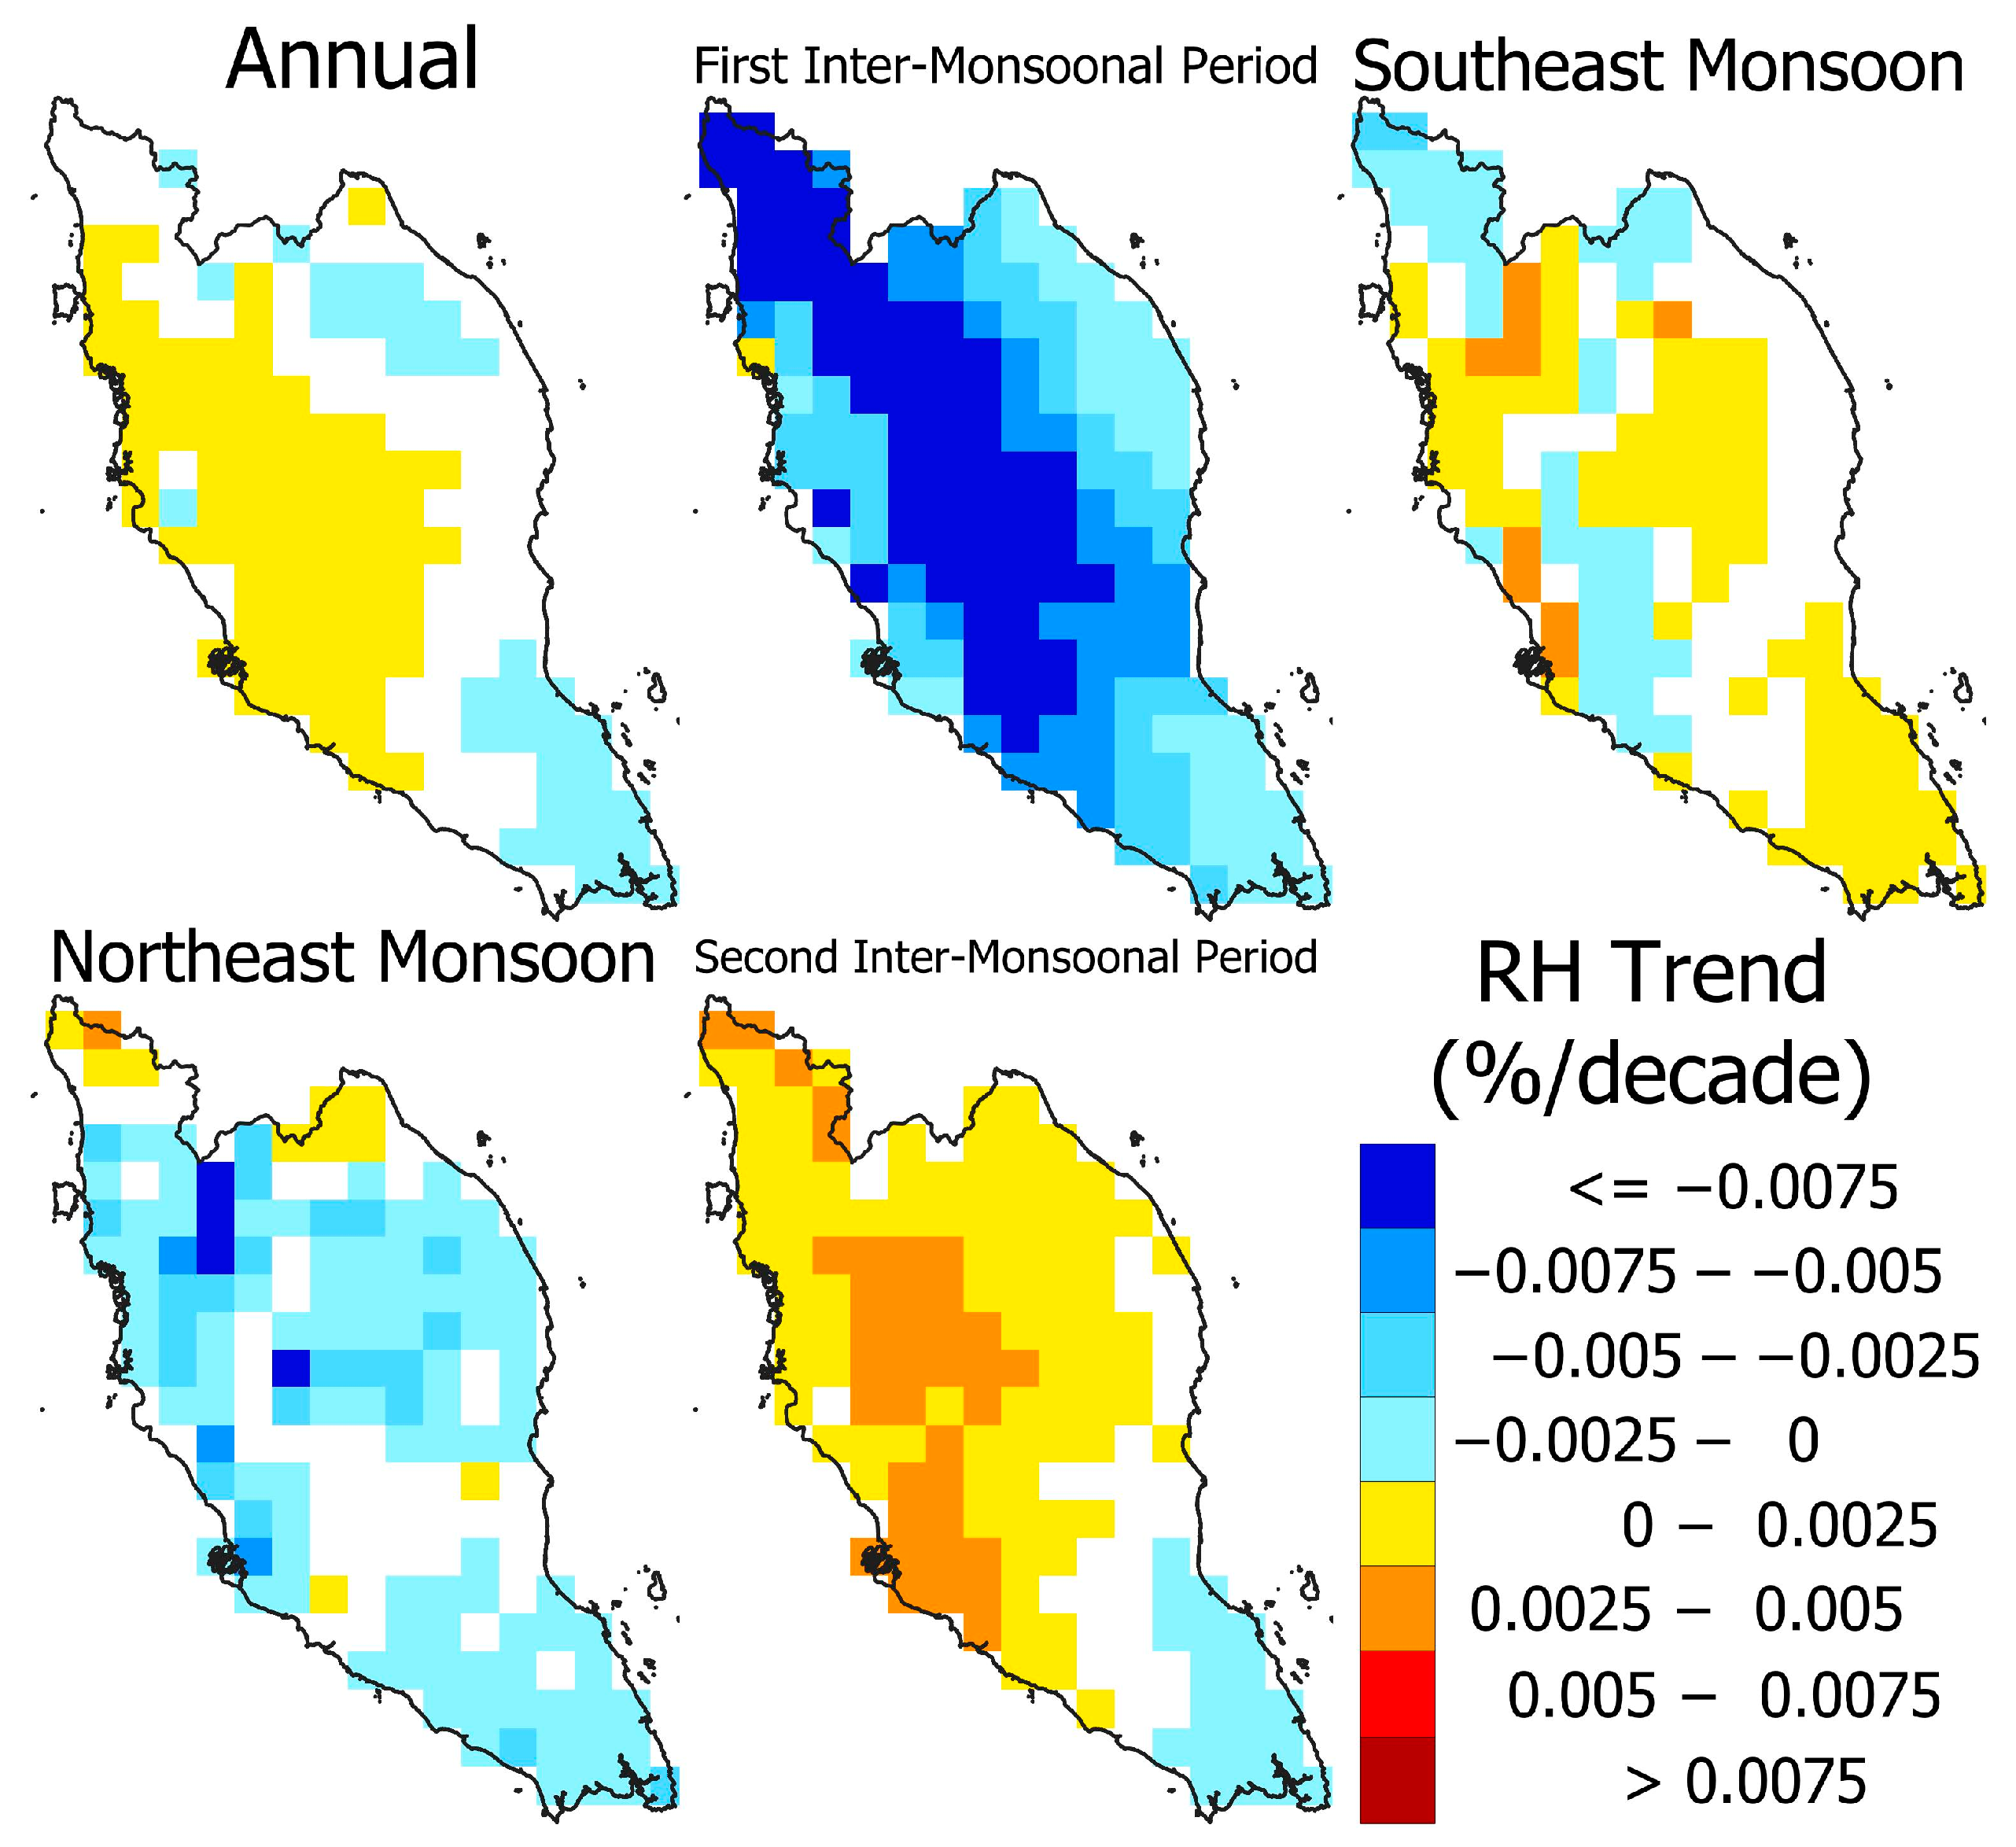
The relative humidity in PM is always very high (>80%). The present analysis revealed minor annual and seasonal relative humidity changes over PM (Figure 10). However, the changes were steady but much less. The annual relative humidity changed over the PM by −0.0025% to 0.0025% per decade. The highest change in relative humidity was in IMP1 when it declined by −0.0075% per decade. In contrast, the highest increase was in NEM (~0.005% per decade).
The wind over PM is generally very less, mostly below 1.25 m/s on the islands and 1.5 to 1.75 m/s on the coast. Figure 11 shows almost no change in wind speed for PM. A slight decrease in wind speed was noticed in the north in the range of −0.0050 to −0.0075 m/s per decade. In the case of solar radiation, no significant changes were noticed at any locations for any seasons and, therefore, were not presented.
The analysis indicates that the increase in WBGT over PM is only due to the mean temperature increase. Solar radiation also significantly influences WBGT, particularly in the coastal areas of PM. However, it has not changed significantly in any region and is not responsible for the increase in WBGT in PM. The relative humidity and wind speed changes were very low over the study period. Their influence on WBGT is also very negligible. The mean temperature in PM has increased very fast over a vast region. This has caused a large rise in WBGT in the region.
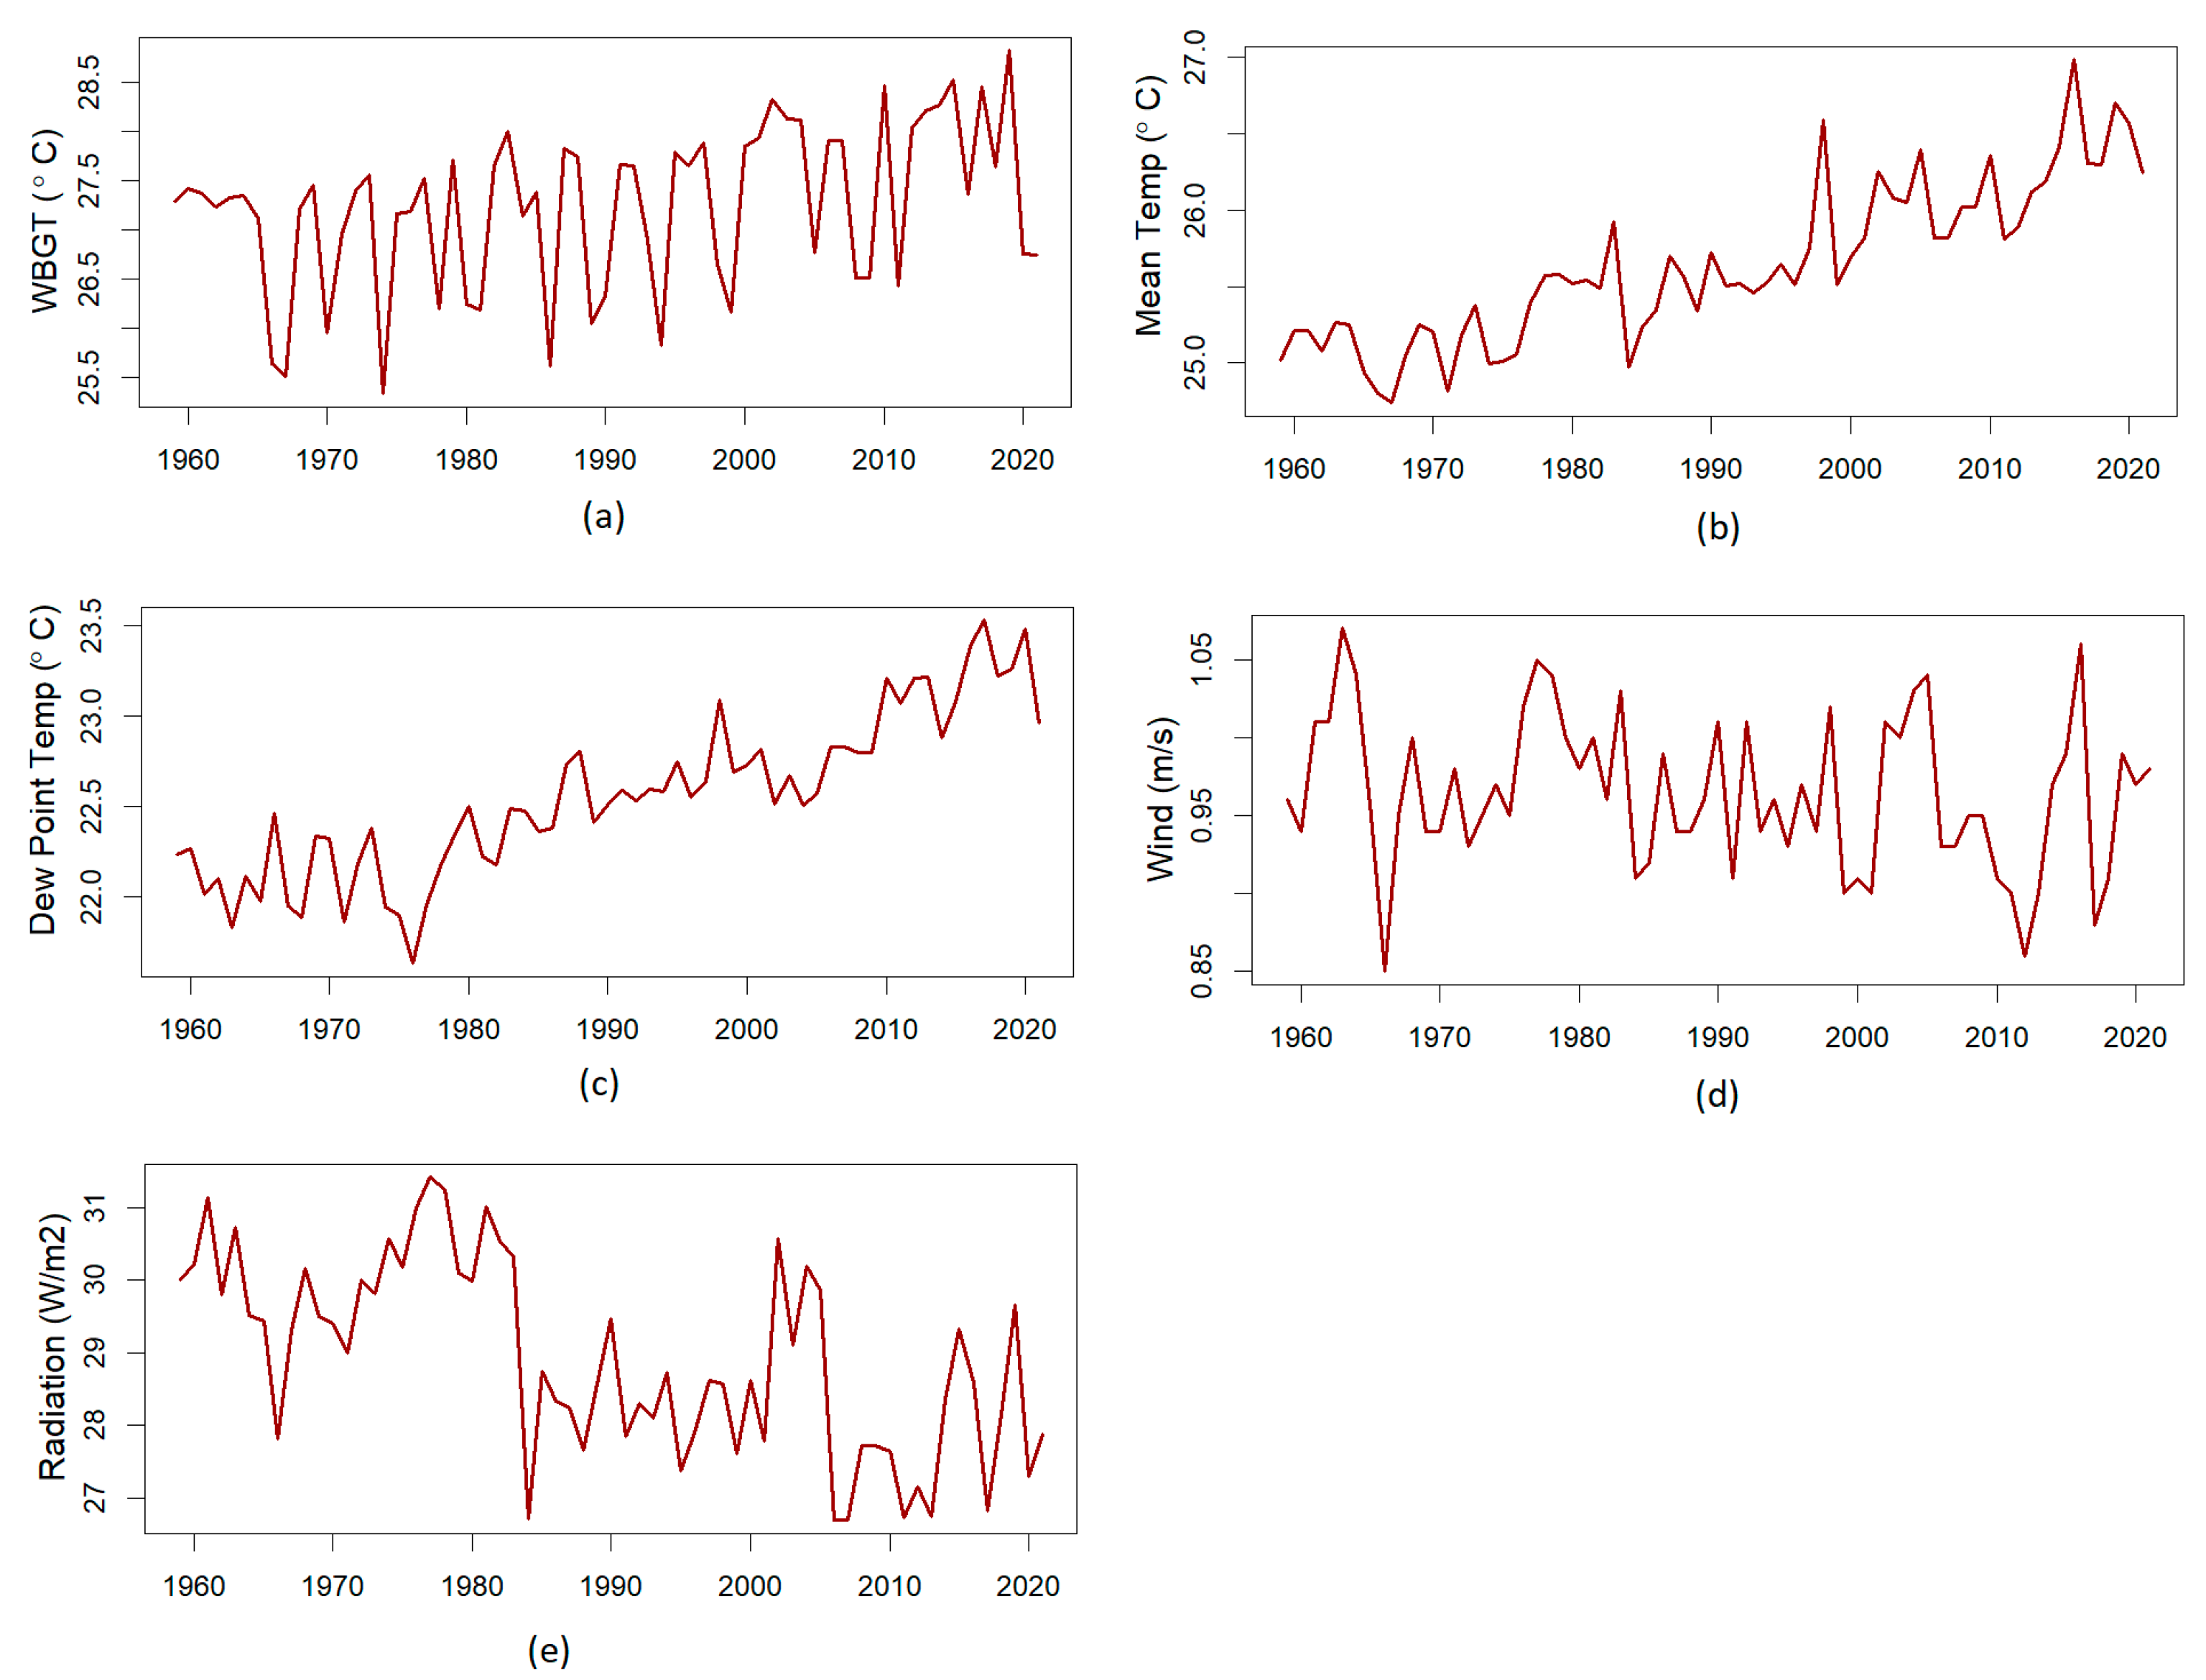
Figure 12 illustrates the average yearly changes in WBGT and the key factors influencing WBGT throughout the study period from 1959 to 2021. The graphs depict a gradual rise in the mean temperature, dew point temperature, and WBGT, alongside a decrease in solar radiation and no significant change in wind speed. These variables exhibit a slow and consistent increase over time. However, considerable variability is possibly associated with large-scale ocean–atmosphere interactions [64]. Notably, certain years stand out due to exceptional conditions. For instance, the elevated mean temperatures in 1998 and 2014–2015 can be attributed to El Niño events. These findings emphasize the marked fluctuations in WBGT in Peninsular Malaysia due to the interplay of its influencing factors. Despite this variability, an overarching upward trend in WBGT has been discernible over the years, potentially linked to broader global climate change patterns.

5. Discussion

The study’s results clearly indicate a noteworthy and consistent increase in WBGT annually and across all seasons. The observed rise in WBGT ranges from 0.04 to 0.23 °C. However, there was a clear regional variability in the magnitude of WBGT changes. The study showed an interesting pattern of higher trends during monsoon seasons in contrast to non-monsoon seasons. Specifically, the western coast demonstrated higher WBGT trends during both monsoon seasons, while the eastern coast showed higher trends during inter-monsoonal seasons. Overall, when considering the annual trends in WBGT, the coastal region exhibited a higher increase than the islands. This finding is significant, as it suggests that the coastal areas are experiencing a more pronounced impact of rising WBGT compared to the relatively buffered island regions.
Peninsular Malaysia is characterized by a significant population in the coastal regions, whereas the central elevated region experiences relatively sparse population density [65,66]. The fact that the coastal regions show a higher increase in WBGT raises concerns about potentially severe consequences for public health. Particularly, the central-west coast of the coastal region has witnessed rapid urbanization and economic development in recent years [57]. This urbanization and development may contribute to the notable rise in temperatures, leading to increased WBGT levels. As urban areas expand and industries grow, there is a higher production of waste heat and greenhouse gas emissions, which can exacerbate the urban heat island effect and lead to higher temperatures in these regions [67,68]. This, in turn, influences the WBGT and may result in a heightened risk of heat-related illnesses and discomfort for the population living in these areas [37].
This study examined the influences of different meteorological factors on the hourly WBGT in Peninsular Malaysia from 1959 to 2020. The findings highlight the complex interplay of meteorological variables in shaping the hourly WBGT in Peninsular Malaysia. The dominant influence of the mean temperature underscores its importance in driving changes in WBGT, particularly in the northwestern region. Although less pronounced, the solar radiation, relative humidity, zenith, and wind speed variations contribute to the overall patterns observed [30,69]. These results are consistent with those found in tropical humid Bangladesh [70]. These findings provide valuable insights into the factors that impact heat stress in Peninsular Malaysia, aiding in developing effective mitigation and adaptation strategies to protect individuals and communities from the adverse effects of high Wet Bulb Global Temperatures.
The seasonal analysis revealed that the impact of climatic factors on WBGT was comparable to the annual pattern [37,71]. The mean temperature positively influenced the country, with more prominent effects in the northeast [72,73]. Solar radiation had a greater influence on the southern and most coastal regions. Relative humidity, zenith, and wind speed showed low positive impacts, while wind speed had low negative impacts on the western coastal region. Overall, the mean temperature emerged as the most influential variable in determining WBGT across most of the country during all seasons, except for IMP1, when solar radiation played a dominant role in the south and western coastal region. Solar radiation was consistently the second-most influential factor in most places, followed by relative humidity and zenith. Wind speed had the least impact on WBGT in Peninsular Malaysia.
The results of this study indicate that, while there has been a notable increase in the mean temperature in PM, the relative humidity has remained relatively stable, and there have been minimal changes in wind speed and no change in solar radiation. Overall, the findings suggest that the rapid increase in the mean temperature over a large region of PM has resulted in a significant rise in WBGT [74]. The analysis reveals that the mean temperature in PM has increased faster than the global average. This rapid increase in the mean temperature has consequently led to a significant rise in WBGT in PM. Notably, the mean temperature in the dense urban areas of the central-western region of PM has experienced a substantial rise of over 0.28 °C. These findings indicate that, if this trend persists, urban areas will likely become hotspots for heat stress in PM in the future [72]. These results highlight the urgent need for effective heat mitigation strategies and adaptation measures in urban areas to minimize the potential health impacts of high WBGT levels.
The results provide valuable insights into the influence of various climatic factors on WBGT across PM’s various seasons. Such insights are essential for devising effective strategies to mitigate heat stress’s effects and assure individuals’ well-being in various fields, including occupational safety, public health, and urban planning. Reducing the mean temperature in urban areas is crucial for mitigating the effects of increasing heat stress. Trees, verdant spaces, and green roofs and walls can help mitigate the heat island effect by providing shade, lowering surface temperatures, and increasing evaporative cooling through transpiration. Cooling materials such as reflective roofs and pavement can reduce solar radiation absorption and surface temperatures. Moreover, encouraging compact and interconnected urban forms can improve natural ventilation and circulation. By installing chilly pavements with high solar reflectance, surface temperatures can be reduced. The construction of urban water bodies, such as ponds or lakes, can aid in the evaporative cooling of adjacent areas. Implementing heat reduction strategies in urban planning practices, such as promoting mixed land use, reducing urban expansion, and implementing passive design principles, can contribute to creating colder and more habitable cities. This study’s findings can be used to educate the public on the significance of reducing heat and to encourage behavioral adjustments, such as wearing light-colored apparel and avoiding superfluous heat-generating activities during heated periods, such as IMP1.
This study focuses exclusively on the recent past, presenting alterations in WBGT and its underlying factors within this timeframe. The authors of [75] reconstructed historical hydrography in the tropical Eastern Indian Ocean using multiple proxies. Their findings revealed fluctuations in the thermocline depth and thermocline temperature, leading to sea surface temperature variations of up to 2 °C throughout the past millennia. These insights suggest that elevated WBGT levels might have existed during the pre-industrial era. This signifies that WBGT conditions in the region underwent changes even in times preceding industrialization, and people seemingly adapted to these variations. It would be beneficial to delve further into this topic by conducting research that reconstructs WBGT dynamics from the pre-industrial era to the present day. Such an extended analysis could offer a more comprehensive understanding of how WBGT has evolved over different historical periods.

6. Conclusions

This study aims to provide valuable insights into the factors that impact heat stress in Peninsular Malaysia, facilitating the development of effective mitigation and adaptation strategies to safeguard individuals and communities from the adverse effects of high WBGT. The annual and seasonal analyses reveal that the climatic factors have a comparable influence on the WBGT, with the mean temperature emerging as the most influential variable across different regions and seasons, followed by solar radiation. The study demonstrates a notable increase in the mean temperature over PM, surpassing the global average, while the relative humidity has remained relatively stable, and wind speed and solar radiation have experienced minimal changes. This significant rise in the mean temperature has, consequently, led to a substantial increase in WBGT, especially in the dense urban areas of the central-western region, where temperatures have risen by over 0.28 °C/decade. These findings underscore the potential future emergence of urban areas as hotspots for heat stress in PM, necessitating urgent attention to heat mitigation strategies and adaptation measures. The present study relied on ERA5 hourly data, which might have inherent uncertainties and limitations. The accuracy and representativeness of the data may vary across different regions and time periods, potentially affecting the findings. In addition, the findings may not capture localized variations in the WBGT and the influence of meteorological factors on a finer spatial scale. Despite these limitations, this study provides a valuable foundation for understanding the influences of meteorological factors on the WBGT in PM. It highlights the importance of considering these factors in assessing heat stress. Further research and refinement of the methodologies can address these limitations and enhance the understanding of heat stress dynamics in the region.

Author Contributions

All the authors were involved in the conceptualization of this research. M.R.H., M.M.H. and M.K.I.M. downloaded the data and preprocessed it. S.S. wrote the code for the data processing. M.R.H., G.F.Z. and D.S.b.M.I. generated the results. M.R.H., M.M.H. and S.S. prepared the first draft. Z.b.I., M.Z.b.M. and Z.S. reviewed the writing. D.S.b.M.I. supported the data storage and work planning. All authors have read and agreed to the published version of the manuscript.

Funding

This research was supported by the Professional Development Research University (PDRU) grant of Universiti Teknologi Malaysia (UTM), No. 06E01.

Data Availability Statement

The source of all data used in this study is mentioned in the text with a downloadable link. The processed data can be provided on request from the corresponding author.

Acknowledgments

The authors are grateful to CEMS (Copernicus Emergency Management Service) for providing free access to the ERA5 data used in this study.

Conflicts of Interest

The authors declare no conflict of interest.

References

  1. Bernard, T.E.; Iheanacho, I. Heat index and adjusted temperature as surrogates for wet bulb globe temperature to screen for occupational heat stress. J. Occup. Environ. Hyg. 2015, 12, 323–333. [Google Scholar] [CrossRef]
  2. Brocherie, F.; Millet, G.P. Is the wet-bulb globe temperature (WBGT) index relevant for exercise in the heat? Sports Med. 2015, 45, 1619–1621. [Google Scholar] [CrossRef] [PubMed]
  3. Bernard, T.E.; Ashley, C.D. Short-term heat stress exposure limits based on wet bulb globe temperature adjusted for clothing and metabolic rate. J. Occup. Environ. Hyg. 2009, 6, 632–638. [Google Scholar] [CrossRef] [PubMed]
  4. Sakoi, T.; Mochida, T.; Kurazumi, Y.; Kuwabara, K.; Horiba, Y.; Sawada, S.-I. Heat balance model for a human body in the form of wet bulb globe temperature indices. J. Therm. Biol. 2018, 71, 1–9. [Google Scholar] [CrossRef] [PubMed]
  5. Hunt, A.P.; Potter, A.W.; Linnane, D.M.; Xu, X.; Patterson, M.J.; Stewart, I.B. Heat Stress Management in the Military: Wet-Bulb Globe Temperature Offsets for Modern Body Armor Systems. Hum. Factors 2022, 64, 1306–1316. [Google Scholar] [CrossRef]
  6. Minard, D.; O’brien, R.L. Heat Casualties in the Navy and Marine Corps 1959–1962 with Appendices on the Field Use of the Wet Bulb-Globe Temperature Index. RES REP MR 005. 01-0001. 01, REP N0.7. Res. Summ. 1964, 42, 1–15. [Google Scholar]
  7. Seo, Y.; Powell, J.; Strauch, A.; Roberge, R.; Kenny, G.P.; Kim, J.-H. Heat stress assessment during intermittent work under different environmental conditions and clothing combinations of effective wet bulb globe temperature (WBGT). J. Occup. Environ. Hyg. 2019, 16, 467–476. [Google Scholar] [CrossRef]
  8. Whang, R.; Matthew, W.T.; Christiansen, J.; Brown, B.; Smith, J.; Thomas, G.; Rose, M.S.; Szlyk, P.C.; Armstrong, L.; Schatzle, F.J. Field assessment of wet bulb globe temperature: Present and future. Mil. Med. 1991, 156, 535–537. [Google Scholar] [CrossRef]
  9. Carter, A.W.; Zaitchik, B.F.; Gohlke, J.M.; Wang, S.; Richardson, M.B. Methods for estimating wet bulb globe temperature from remote and low-cost data: A comparative study in Central Alabama. GeoHealth 2020, 4, e2019GH000231. [Google Scholar] [CrossRef]
  10. Tsuji, M.; Kume, M.; Tuneoka, H.; Yoshida, T. Differences in the heat stress associated with white sportswear and being semi-nude in exercising humans under conditions of radiant heat and wind at a wet bulb globe temperature of greater than 28 °C. Int. J. Biometeorol. 2014, 58, 1393–1402. [Google Scholar] [CrossRef]
  11. Grundstein, A.; Cooper, E. Assessment of the Australian Bureau of Meteorology wet bulb globe temperature model using weather station data. Int. J. Biometeorol. 2018, 62, 2205–2213. [Google Scholar] [CrossRef] [PubMed]
  12. Mohraz, M.H.; Ghahri, A.; Karimi, M.; Golbabaei, F. The past and future trends of heat stress based on wet bulb globe temperature index in outdoor environment of Tehran City, Iran. Iran. J. Public Health 2016, 45, 787–794. [Google Scholar]
  13. Li, C.; Zhang, X.; Zwiers, F.; Fang, Y.; Michalak, A.M. Recent very hot summers in Northern Hemispheric land areas measured by wet bulb globe temperature will be the norm within 20 years. Earth’s Future 2017, 5, 1203–1216. [Google Scholar] [CrossRef]
  14. Pryor, J.L.; Pryor, R.R.; Grundstein, A.; Casa, D.J. The heat strain of various athletic surfaces: A comparison between observed and modeled wet-bulb globe temperatures. J. Athl. Train. 2017, 52, 1056–1064. [Google Scholar] [CrossRef] [PubMed]
  15. Sakoi, T.; Mochida, T. Concept of the equivalent wet bulb globe temperature index for indicating safe thermal occupational environments. Build. Environ. 2013, 67, 167–178. [Google Scholar] [CrossRef]
  16. Oliveira, B.F.A.; Silveira, I.H.; Feitosa, R.C.; Horta, M.A.P.; Junger, W.L.; Hacon, S. Human Heat stress risk prediction in the Brazilian semiarid Region based on the Wet-Bulb Globe Temperature. An. Acad. Bras. Ciências 2019, 91, e20180748. [Google Scholar] [CrossRef]
  17. Thorsson, S.; Rayner, D.; Palm, G.; Lindberg, F.; Carlström, E.; Börjesson, M.; Nilson, F.; Khorram-Manesh, A.; Holmer, B. Is Physiological Equivalent Temperature (PET) a superior screening tool for heat stress risk than Wet-Bulb Globe Temperature (WBGT) index? Eight years of data from the Gothenburg half marathon. Br. J. Sports Med. 2021, 55, 825–830. [Google Scholar] [CrossRef]
  18. Wolf, S.T.; Havenith, G.; Kenney, W.L. Relatively minor influence of individual characteristics on critical wet-bulb globe temperature (WBGT) limits during light activity in young adults (PSU HEAT Project). J. Appl. Physiol. 2023, 134, 1216–1223. [Google Scholar] [CrossRef]
  19. Moran, D.S.; Pandolf, K.B.; Shapiro, Y.; Heled, Y.; Shani, Y.; Mathew, W.; Gonzalez, R. An environmental stress index (ESI) as a substitute for the wet bulb globe temperature (WBGT). J. Therm. Biol. 2001, 26, 427–431. [Google Scholar] [CrossRef]
  20. Paengkaew, W.; Limsakul, A.; Junggoth, R.; Pitaksanurat, S. Empirically Derived Equation from Simple Heat Index for Calculating Wet Bulb Globe Temperature: A Case Study of Thailand. Appl. Environ. Res. 2020, 42, 25–39. [Google Scholar] [CrossRef]
  21. Vanos, J.K.; Grundstein, A.J. Variations in athlete heat-loss potential between hot-dry and warm-humid environments at equivalent wet-bulb globe temperature thresholds. J. Athl. Train. 2020, 55, 1190–1198. [Google Scholar] [CrossRef]
  22. Ridder, N.N.; Pitman, A.J.; Ukkola, A.M. High impact compound events in Australia. Weather. Clim. Extrem. 2022, 36, 100457. [Google Scholar] [CrossRef]
  23. Jabara, J.W. Comparison of the Wet Bulb Globe Temperature and a Modified Botsball Thermometer in an Outdoor Environment. Appl. Ind. Hyg. 1988, 3, 303–309. [Google Scholar] [CrossRef]
  24. McCann, D.J.; Adams, W.C. Wet bulb globe temperature index and performance in competitive distance runners. Med. Sci. Sports Exerc. 1997, 29, 955–961. [Google Scholar] [CrossRef]
  25. Moran, D.S.; Pandolf, K.B. Wet bulb globe temperature (WBGT)—To what extent is GT essential? Aviat. Space Environ. Med. 1999, 70, 480–484. [Google Scholar]
  26. Prost, G.; Davezies, P. L’indice WBGT. Arch. Mal. Prof. Médecine Trav. Sécurité Soc. 1985, 46, 45–47. [Google Scholar]
  27. Brimicombe, C.; Lo, C.H.B.; Pappenberger, F.; Di Napoli, C.; Maciel, P.; Quintino, T.; Cornforth, R.; Cloke, H.L. Wet Bulb Globe Temperature: Indicating extreme heat risk on a global grid. GeoHealth 2023, 7, e2022GH000701. [Google Scholar] [CrossRef]
  28. Kyaw, A.K.; Hamed, M.M.; Kamruzzaman, M.; Shahid, S. Spatiotemporal changes in population exposure to heat stress in south Asia. Sustain. Cities Soc. 2023, 93, 104544. [Google Scholar] [CrossRef]
  29. Lee, S.-W.; Kim, I.-G.; Kim, H.-M.; Lee, D.-G.; Lee, H.-C.; Choi, G. Spatio-temporal patterns of the minimum rest time for outdoor workers exposed to summer heat stress in South Korea. Int. J. Biometeorol. 2020, 64, 1755–1765. [Google Scholar] [CrossRef]
  30. Houmsi, M.R.; Ismail, Z.; Othman, L.K.; Ishak, D.S.M.; Hamed, M.M.; Iqbal, Z.; Syamsunur, D.; Shahid, S. Spatiotemporal changes in Hourly Wet Bulb Globe temperature in Peninsular Malaysia. Stoch. Environ. Res. Risk Assess. 2023, 37, 2327–2347. [Google Scholar] [CrossRef]
  31. Hall, A.; Horta, A.; Khan, M.R.; Crabbe, R.A. Spatial Analysis of Outdoor Wet Bulb Globe Temperature under RCP4.5 and RCP8.5 Scenarios for 2041–2080 across a Range of Temperate to Hot Climates. Weather Clim. Extrem. 2022, 35, 100420. [Google Scholar] [CrossRef]
  32. Liljegren, J.C.; Carhart, R.A.; Lawday, P.; Tschopp, S.; Sharp, R. Modeling the wet bulb globe temperature using standard meteorological measurements. J. Occup. Environ. Hyg. 2008, 5, 645–655. [Google Scholar] [CrossRef]
  33. Dehghan, H.; Mortazavi, S.B.; Jafari, M.J.; Maracy, M.R. Evaluation of wet bulb globe temperature index for estimation of heat strain in hot/humid conditions in the Persian Gulf. J. Res. Med. Sci. Off. J. Isfahan Univ. Med. Sci. 2012, 17, 1108. [Google Scholar]
  34. Lei, Z. A Simplified Method to Calculate the Wet Bulb Globe Temperature. J. Civ. Archit. Environ. Eng. 2015, 5, 108–111. [Google Scholar]
  35. Shao, L.; Meng, Q.; Lu, S.; Zhong, K. Simplified calculation method of outdoor wet bulb globe temperature for areas with low latitude and high latitude. J. Chongqing Univ. 2020, 43, 112–120. [Google Scholar]
  36. Takane, Y.; Kusaka, H.; Takaki, M.; Okada, M.; Abe, S.; Fuji, Y.; Iizuka, S.; Nagai, T. Observational Study and Numerical Prediction Experiments on Wet-Bulb Globe Temperature in Tajimi, Gifu Prefecture: Consideration of Uncertainty with a Physics Parameterization Scheme and Horizontal Resolution of the Weather Research and Forecasting Model. Jpn. Prog. Climatol. = Jpn. Prog. Climatol. 2013, 2013, 77–86. [Google Scholar]
  37. Heo, S.; Bell, M.L.; Lee, J.-T. Comparison of health risks by heat wave definition: Applicability of wet-bulb globe temperature for heat wave criteria. Environ. Res. 2019, 168, 158–170. [Google Scholar] [CrossRef]
  38. Reneau, P.D.; Bishop, P.A. A review of the suggested wet bulb globe temperature adjustment for encapsulating protective clothing. Am. Ind. Hyg. Assoc. J. 1996, 57, 58–61. [Google Scholar] [CrossRef]
  39. Schroter, R.; Marlin, D.; Jeffcott, L. Use of the wet bulb globe temperature (WBGT) index to quantify environmental heat loads during three-day-event competitions. Equine Vet. J. 1996, 28, 3–6. [Google Scholar] [CrossRef]
  40. Dally, M.; Butler-Dawson, J.; Sorensen, C.J.; Van Dyke, M.; James, K.A.; Krisher, L.; Jaramillo, D.; Newman, L.S. Wet bulb globe temperature and recorded occupational injury rates among sugarcane harvesters in southwest Guatemala. Int. J. Environ. Res. Public Health 2020, 17, 8195. [Google Scholar] [CrossRef]
  41. Ghanbary Sartang, A.; Dehghan, H. Investigating relationship between perceptual strain index with indices heat strain score index, wet bulb globe temperature in experimental hot condition. Int. J. Environ. Health Eng. 2015, 4, 37. [Google Scholar]
  42. Bitencourt, D.P. Maximum wet-bulb globe temperature mapping in central–south Brazil: A numerical study. Meteorol. Appl. 2019, 26, 385–395. [Google Scholar] [CrossRef]
  43. Dernedde, E. A correlation of the wet-bulb globe temperature and botsball heat stress indexes for industry. Am. Ind. Hyg. Assoc. J. 1992, 53, 169–174. [Google Scholar] [CrossRef]
  44. Hall, P.F.; Blackadder-Coward, J.; Pynn, H. Measuring wet bulb globe temperatures at point-of-exertion in worldwide UK military settings: A longitudinal observational study determining the accuracy of a portable WBGT monitor. BMJ Mil. Health 2023, 169, 161–165. [Google Scholar] [CrossRef]
  45. Heidari, H.; Golbabaei, F.; Shamsipour, A.; Forushani, A.R.; Gaeini, A. Consistency between sweat rate and wet bulb globe temperature for the assessment of heat stress of people working outdoor in arid and semi-arid regions. Int. J. Occup. Environ. Med. 2018, 9, 1. [Google Scholar] [CrossRef]
  46. Brake, D. Calculation of the natural (unventilated) wet bulb temperature, psychrometric dry bulb temperature and wet bulb globe temperature from standard psychrometric measurements. J. Mine Vent. Soc. S. Afr. 2001, 54, 108–112. [Google Scholar]
  47. Ohashi, Y.; Kawabe, T.; Shigeta, Y.; Hirano, Y.; Kusaka, H.; Fudeyasu, H.; Fukao, K. Evaluation of urban thermal environments in commercial and residential spaces in Okayama City, Japan, using the wet-bulb globe temperature index. Theor. Appl. Climatol. 2009, 95, 279–289. [Google Scholar] [CrossRef]
  48. Wang, W.; Ding, G.; Wang, Y.; Li, J. Field study on the effect of space type, exercise intensity, and wet bulb globe temperature on thermal responses of exercisers. Build. Environ. 2022, 225, 109555. [Google Scholar] [CrossRef]
  49. Islam, A.; Abdullah, R.A.; Ibrahim, I.S.; Lai, G.T.; Chaudry, M.H.; Junaid, M.; Iqbal, Z.; Jamal, N.; Aziz, A.F.A.; Salim, A. Effect of Stress Ratio K due to Varying Overburden Topography on Crack Intensity of Tunnel Liner. J. Perform. Constr. Facil. 2023, 37, 04023026. [Google Scholar] [CrossRef]
  50. Taylor, N.; Kuehn, L.; Howat, M. A direct-reading mercury thermometer for the wet bulb globe temperature index. Can. J. Physiol. Pharmacol. 1969, 47, 277–279. [Google Scholar] [CrossRef]
  51. Guyer, H.; Georgescu, M.; Hondula, D.M.; Wardenaar, F.; Vanos, J. Identifying the need for locally-observed wet bulb globe temperature across outdoor athletic venues for current and future climates in a desert environment. Environ. Res. Lett. 2021, 16, 124042. [Google Scholar] [CrossRef]
  52. Ho, H.C.; Lau, K.K.-L.; Ren, C.; Ng, E. Characterizing prolonged heat effects on mortality in a sub-tropical high-density city, Hong Kong. Int. J. Biometeorol. 2017, 61, 1935–1944. [Google Scholar] [CrossRef] [PubMed]
  53. Gao, J.; Wang, Y.; Wu, X.; Gu, X.; Song, X. A simplified indoor wet-bulb globe temperature formula to determine acceptable hot environmental parameters in naturally ventilated buildings. Energy Build. 2019, 196, 169–177. [Google Scholar] [CrossRef]
  54. Li, C.; Sun, Y.; Zwiers, F.; Wang, D.; Zhang, X.; Chen, G.; Wu, H. Rapid warming in summer wet bulb globe temperature in China with human-induced climate change. J. Clim. 2020, 33, 5697–5711. [Google Scholar] [CrossRef]
  55. Kuehn, L.; Stubbs, R.; MacHattie, L. A nomogram for calculation of the wet bulb–globe temperature index. Can. J. Physiol. Pharmacol. 1970, 48, 832–834. [Google Scholar] [CrossRef]
  56. Kong, Q.; Huber, M. Explicit calculations of wet-bulb globe temperature compared with approximations and why it matters for labor productivity. Earth’s Future 2022, 10, e2021EF002334. [Google Scholar] [CrossRef]
  57. Ziarh, G.F.; Asaduzzaman, M.; Dewan, A.; Nashwan, M.S.; Shahid, S. Integration of catastrophe and entropy theories for flood risk mapping in peninsular Malaysia. J. Flood Risk Manag. 2021, 14, e12686. [Google Scholar] [CrossRef]
  58. Lemke, B.; Kjellstrom, T. Calculating workplace WBGT from meteorological data: A tool for climate change assessment. Ind. Health 2012, 50, 267–278. [Google Scholar] [CrossRef]
  59. Nossent, J.; Elsen, P.; Bauwens, W. Sobol’ sensitivity analysis of a complex environmental model. Environ. Model. Softw. 2011, 26, 1515–1525. [Google Scholar] [CrossRef]
  60. Yamamoto, T.; Sakamoto, H. Monte Carlo sensitivity analysis method for the effective delayed neutron fraction with the differential operator sampling method. Ann. Nucl. Energy 2020, 140, 107108. [Google Scholar] [CrossRef]
  61. Sobol, I.M. Global sensitivity indices for nonlinear mathematical models and their Monte Carlo estimates. Math. Comput. Simul. 2001, 55, 271–280. [Google Scholar] [CrossRef]
  62. Sen, P.K. Estimates of the regression coefficient based on Kendall’s tau. J. Am. Stat. Assoc. 1968, 63, 1379–1389. [Google Scholar] [CrossRef]
  63. Hamed, K.H. Trend detection in hydrologic data: The Mann–Kendall trend test under the scaling hypothesis. J. Hydrol. 2008, 349, 350–363. [Google Scholar] [CrossRef]
  64. Tangang, F.T.; Juneng, L.; Salimun, E.; Sei, K.; Halimatun, M. Climate change and variability over Malaysia: Gaps in science and research information. Sains Malays. 2012, 41, 1355–1366. [Google Scholar]
  65. Masron, T.; Yaakob, U.; Ayob, N.M.; Mokhtar, A.S. Population and spatial distribution of urbanization in Peninsular Malaysia 1957–2000. Geogr. Malays. J. Soc. Space 2012, 8, 20–29. [Google Scholar]
  66. Ariffin, E.H.; Mathew, M.J.; Roslee, A.; Ismailluddin, A.; Yun, L.S.; Putra, A.B.; Yusof, K.M.K.K.; Menhat, M.; Ismail, I.; Shamsul, H.A.; et al. A multi-hazards coastal vulnerability index of the east coast of Peninsular Malaysia. Int. J. Disaster Risk Reduct. 2023, 84, 103484. [Google Scholar] [CrossRef]
  67. Rajagopalan, P.; Lim, K.C.; Jamei, E. Urban heat island and wind flow characteristics of a tropical city. Sol. Energy 2014, 107, 159–170. [Google Scholar] [CrossRef]
  68. Rahaman, Z.A.; Kafy, A.-A.; Saha, M.; Rahim, A.A.; Almulhim, A.I.; Rahaman, S.N.; Fattah, M.A.; Rahman, M.T.; S, K.; Faisal, A.-A.; et al. Assessing the impacts of vegetation cover loss on surface temperature, urban heat island and carbon emission in Penang city, Malaysia. Build. Environ. 2022, 222, 109335. [Google Scholar] [CrossRef]
  69. Budd, G.M. Wet-bulb globe temperature (WBGT)—Its history and its limitations. J. Sci. Med. Sport 2008, 11, 20–32. [Google Scholar] [CrossRef]
  70. Kamal, A.S.M.M.; Shahid, S.; Fahim, A.K.F. Changes in Wet Bulb Globe Temperature and Risk to Heat-Related Hazards: An Overview of Bangladesh. In Proceedings of the OHOW 2022—The 1st International Symposium on One Health, One World, Pattaya City, Thailand, 8–10 December 2022; MDPI: Basel, Switzerland, 2023. [Google Scholar]
  71. Sakoi, T.; Mochida, T.; Kurazumi, Y.; Sawada, S.-I.; Horiba, Y.; Kuwabara, K. Expansion of effective wet bulb globe temperature for vapor impermeable protective clothing. J. Therm. Biol. 2018, 71, 10–16. [Google Scholar] [CrossRef]
  72. Willett, K.M.; Sherwood, S. Exceedance of heat index thresholds for 15 regions under a warming climate using the wet-bulb globe temperature. Int. J. Climatol. 2012, 32, 161–177. [Google Scholar] [CrossRef]
  73. Kang, M.; Kim, K.R.; Shin, J.-Y. Event-based heat-related risk assessment model for South Korea using maximum perceived temperature, wet-bulb globe temperature, and air temperature data. Int. J. Environ. Res. Public Health 2020, 17, 2631. [Google Scholar] [CrossRef] [PubMed]
  74. Zare, S.; Hasheminejad, N.; Bateni, M.; Baneshi, M.R.; Shirvan, H.E.; Hemmatjo, R. The association between wet-bulb globe temperature and other thermal indices (DI, MDI, PMV, PPD, PHS, PSI and PSIhr): A field study. Int. J. Occup. Saf. Ergon. 2020, 26, 71–79. [Google Scholar] [CrossRef] [PubMed]
  75. Kwiatkowski, C.; Prange, M.; Varma, V.; Steinke, S.; Hebbeln, D.; Mohtadi, M. Holocene variations of thermocline conditions in the eastern tropical Indian Ocean Quat. Sci. Rev. 2015, 114, 33–42. [Google Scholar] [CrossRef]
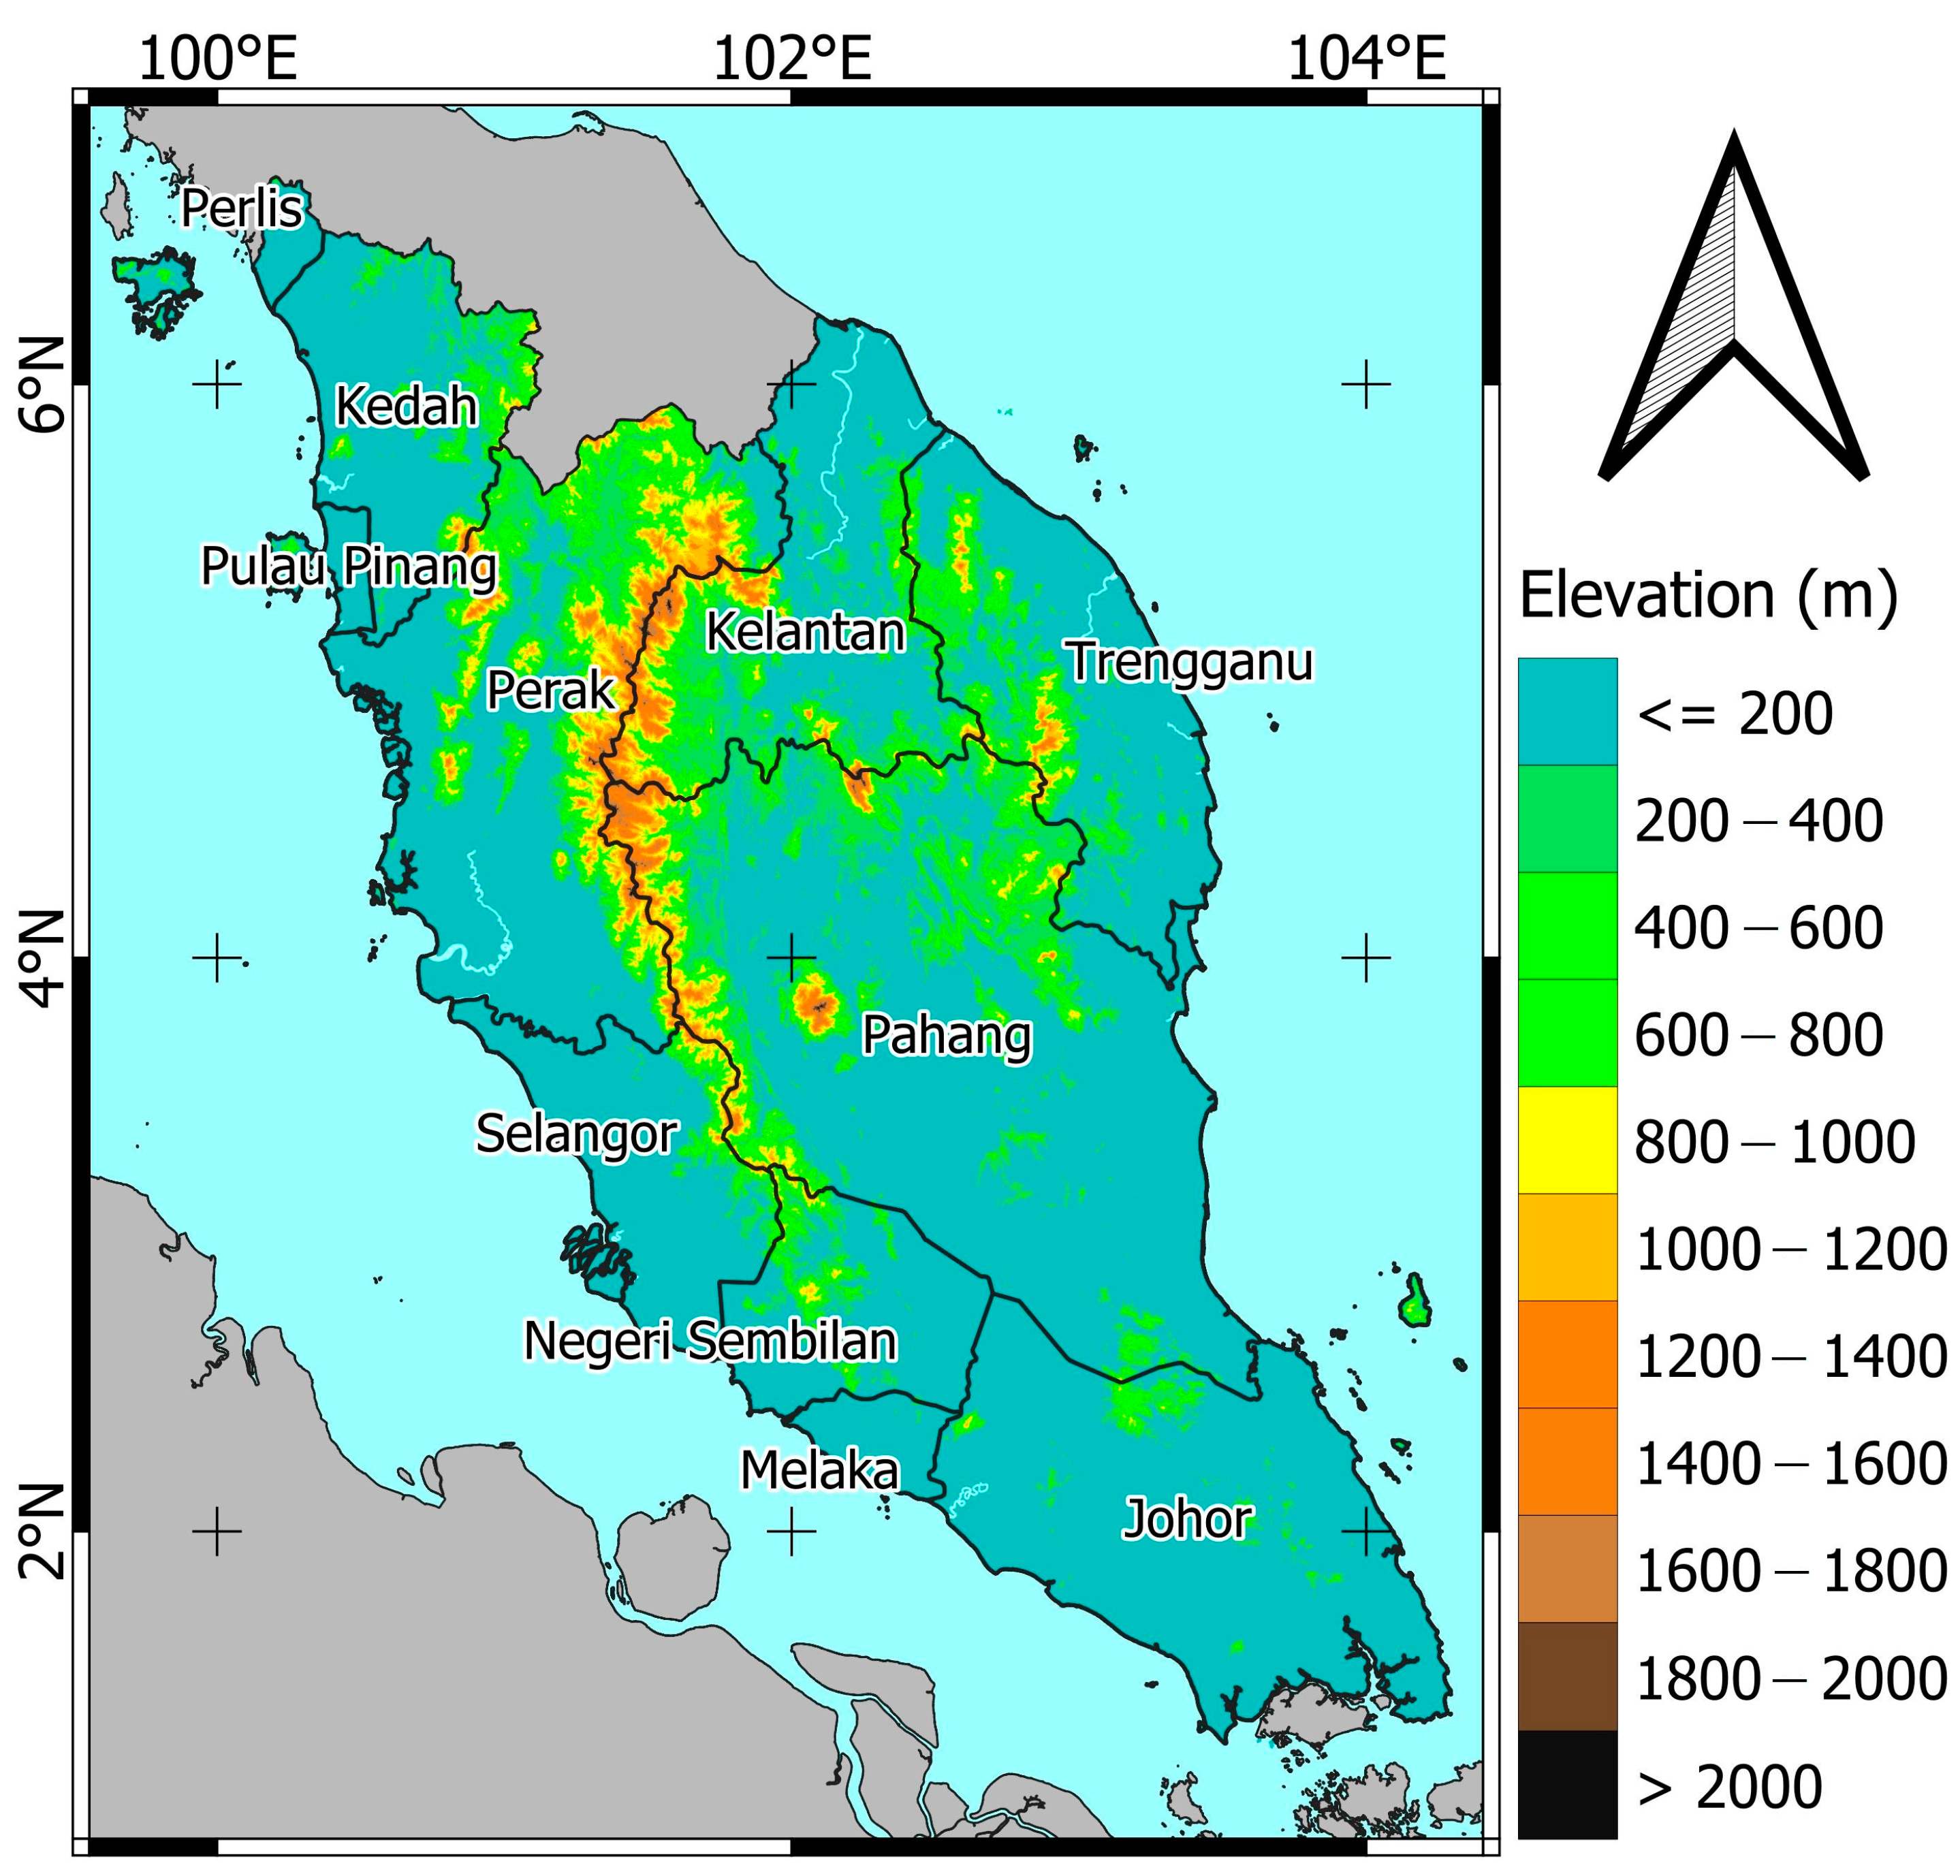
Figure 1. The study area location and topography.
Sustainability 15 12842 g001
Figure 2. Spatial variability by hourly (a) 2 m temperature, (b) relative humidity, (c) surface net solar radiation, (d) surface net thermal radiation, (e) surface pressure, and (f) wind speed.
Sustainability 15 12842 g002
Figure 3. The spatial distribution of the influence of different meteorological variables in defining the annual average of hourly WBGT over Peninsular Malaysia.
Sustainability 15 12842 g003
Figure 4. The spatial distribution of the influence of different meteorological variables in defining the NEM average of hourly WBGT over Peninsular Malaysia.
Sustainability 15 12842 g004
Figure 5. The spatial distribution of the influence of different meteorological variables in defining the IMP1 average of hourly WBGT over Peninsular Malaysia.
Sustainability 15 12842 g005
Figure 6. The spatial distribution of the influence of different meteorological variables in defining the SWM average of hourly WBGT over Peninsular Malaysia.
Sustainability 15 12842 g006
Figure 7. The spatial distribution of the influence of different meteorological variables in defining the IMP2 average of hourly WBGT over Peninsular Malaysia.
Sustainability 15 12842 g007
Figure 8. Spatial variability in the significance trends for WBGT in °C.
Sustainability 15 12842 g008
Figure 9. Spatial variability in the significance trends for the temperature mean in °C.
Sustainability 15 12842 g009
Figure 10. Spatial variability in the significance trends for relative humidity in %.
Sustainability 15 12842 g010
Figure 11. Spatial variability in the significance trends for wind speed in m/s.
Sustainability 15 12842 g011
Figure 12. Temporal variability yearly areal mean of the (a) Wet Bulb Globe Temperature, (b) 2 m temperature, (c) dew point temperature, (d) wind speed, and (e) net radiation over Peninsular Malaysia from 1959 to 2021.
Sustainability 15 12842 g012
Disclaimer/Publisher’s Note: The statements, opinions and data contained in all publications are solely those of the individual author(s) and contributor(s) and not of MDPI and/or the editor(s). MDPI and/or the editor(s) disclaim responsibility for any injury to people or property resulting from any ideas, methods, instructions or products referred to in the content.