Abstract
As nations around the world strive to achieve carbon neutrality, many policies have been implemented at varying costs and levels of efficacy. Although carbon emissions are dominated by the power, industry, transport, and building sectors, the plastics sector is responsible for a significant 4.5% of global emissions and is the fastest-growing material production sector. This study seeks to identify the economic and carbon-reduction potential of the greening of plastic supply chains compared to existing carbon-reduction regimes. Utilizing literature review, lifecycle analysis and multicriteria analysis cognizant of cost, carbon-reduction potential, quality, and recyclability, this paper identifies the performance of virgin, recycled, and bioplastics under a number of scenarios. We find that recycled plastics offer a low-cost carbon-reduction potential; however, concerns about perceived quality remain. While no single plastic type or source can satisfy all criteria, the satisfaction of manufacturer and end user concerns is critical to reducing CO2 via plastic supply-chain greening and the move away from crude-oil-based plastics. The reallocation of subsidies from less effective carbon-reduction policies toward supply-chain greening may offer benefits and stimulate the emergence of a quality control system to overcome manufacturer and user concerns.
Keywords:
carbon neutrality; energy system; plastics; recycling; sustainability; bioplastic; circular economy 1. Introduction
The achievement of carbon neutrality is a global issue, and cooperation is required among nations if the worst impacts of climate change and temperature increases are to be avoided [1]. Global carbon emissions are increasing and are dominated by the power, industry, transport, and building sectors [2], and the reduction of emissions, particularly in the power sector, is envisaged through the deployment of additional renewable energy [3]. Governments have several policy instruments that can be utilized to encourage the reduction of carbon emissions in these sectors, including subsidies for renewables such as feed-in tariff (FIT) or feed-in premium (FIP) approaches, the introduction of carbon taxes, carbon credit or offset mechanisms, building code changes, direct legislation of transport regimes, for example, and, through the imposition of regulations on specific industries, to reduce their emissions. Due to such a broad range of policy and legislative options, the cost and effectiveness of carbon reduction is variable, and it is prudent to assess which approaches will yield the greatest level of reduction per unit investment.
Japan, the focus of this study, is among a group of developed nations that have declared that they will achieve carbon neutrality by the year 2050, and it is the third-largest carbon dioxide (CO2) emitter in Asia after China and India [4]. Like other nations, Japan has deployed both FIT and FIP policies to encourage the deployment of renewable energy [5], seeking to increase the share of renewables in their energy mix as one strategy toward carbon neutrality and energy self-sufficiency [6]. Japan also pursued aggressive carbon credit acquisition in the past, notably in order to meet its Kyoto Protocol targets [7]. Japan also has an emissions trading scheme (ETS) in place in the prefectures of Tokyo and Saitama, which were introduced in 2010 and 2011, respectively. Some criticism has been leveled at these ETSs in that they helped to cap some emissions, but that emissions trading did not emerge and carbon prices have been low compared to international norms [8]. In addition, Japan is considering the role of nuclear power in the energy mix, the introduction of hydrogen, the shift away from gasoline vehicles, increased energy efficiency, and negative emission technologies toward achieving their carbon neutrality goals [6]. One sector that is often overlooked with regard to carbon emissions is the plastics sector, which is responsible for 4.5% of global greenhouse emissions while also being the fastest-growing bulk material production sector [9]. After the US, Japan has the second-highest level of plastic packaging waste generated per capita (32.4 kg) in the world and at the same time is also an aggressive recycler of plastics, via material, mechanical and thermal recycling methods [10]. In Japan, approximately 80% of general waste comes from packaging and containers, while for industrial waste, 40% of plastic waste comes from electrical and electronic equipment, with approximately 20% coming from packaging [11]. In 2021, 24.6% of Japan’s plastic waste was mechanically recycled, 0.4% was chemically recycled, and the majority, some 71.3%, was thermally recycled, i.e., combusted to generate energy, in order to avoid the landfill [12]. Thermal recycling, while reducing some emissions through the generation of energy, thus offsetting fossil fuel imports, produces CO2 emissions and is thus not the preferred option for plastic recycling from a circular economy or carbon emissions point of view. An increase in the mechanical and chemical recycling of plastics, thus greening supply chains in Japan, may represent an economically preferable pathway to the reduction in carbon emission compared to existing policies. At the government level, the New Energy and Industrial Technology Development Organization (NEDO) in Japan is working on a project toward innovative plastic-resource-recycling technology, including advanced sorting for recycling, petrochemical feedstock conversion, and high-efficiency energy recovery. This project aims to engender the additional material recycling of 860,000 tons of plastic waste annually, which have not been recycled to date [13].
This study aims to investigate the economic performance of existing carbon-reduction policies that are supported by the government of Japan, i.e., through the allocation of subsidies or economic incentives, and to compare these policies with the greening of plastic supply chains, specifically through the encouragement of the use of recycled and bio-derived plastics in manufacturing processes.
This study is detailed, beginning with a literature review of the existing and proposed carbon-reduction policies for Japan, and with regard to greening plastic supply chains more broadly, identifying the gap we aim to address in Section 2. Section 3 outlines our proposed methodology to compare the greening of plastic supply chains with existing policies from an economic and efficacy point of view, cognizant of multiple potential future scenarios and exogenous factors. Section 4 details the results, while Section 5 discusses policy implications for Japan and more generally. Conclusions are presented in Section 6.
2. Literature Review
The literature review focuses on CO2-reduction schemes as mentioned above, assessing international and Japanese norms. Here, we review academic research on the political and economic efficacy of FIT and FIP approaches, carbon taxes, credits and ETS, and energy-system reforms, considering the contributions of nuclear and hydrogen and specific policy interventions in the transport sector, moving away from gasoline vehicles. Further, we assess international regimes for plastic supply-chain greening, as research on this topic is particularly limited in Japan. In the review, we provide a conversion of foreign currencies to Japanese Yen at a rate of JPY 140 per United States Dollar (USD), JPY 90 per Australian Dollar (AUD), and JPY 150 per Euro (EUR) for ease of comparison.
2.1. Feed-in Tariffs and Premiums
With regard to FIT and FIP approaches, neither are new, and both have existed in several forms in a number of nations. In analyzing 13 cases of internationally developed nations, it was identified that FITs increase participation in distributed solar photovoltaic generation; however, FITs are costly and require constant adjustment, usually in the form of gradual reductions over time [14]. For developing nations, although in the long term, avoiding fossil fuel generation is a desirable outcome, in the short term, FITs were found to increase the cost of electricity by 2.2 cents USD (3.08 JPY) per kilowatt hour and have an abatement cost of approximately USD 36 (JPY 5040) per ton of CO2 [15]. In Japan, a late introducer of the FIT, with the opportunity to learn from international experience [16,17], the same Issues were encountered, with electricity prices increasing by up to JPY 3.45 per kilowatt hour in the year 2022 [18], reducing to JPY 1.40 per kilowatt hour in 2023 due to increased fossil fuel prices as a result of the war in Ukraine, and ever-reducing FIT payments [19]. The FIT law has been revised several times in the past, notably in 2017 to improve operating conditions [20] and most recently in the shift to an FIP approach, beginning in 2022 [18].
2.2. Emissions Trading Schemes, Carbon Taxes and Credits
With regard to ETSs, at the beginning of 2022, there were 25 ETSs in operation around the world, covering nations in Asia, Oceania, Europe, and the Americas, accounting for the sectors of forestry, waste, transport, buildings, industry, and power [21]. According to the World Bank, an ETS represents a mechanism to cap the allowed amount of greenhouse gas (GHG) emissions, allowing the market to decide the price of carbon through trading allowances between parties, noting that not all ETSs cover the same sectors, and therefore, coverage of national emissions also varies [22].
These cap-and-trade schemes help to reduce emissions, and it has been found that a carbon price reduces emissions significantly after multi-sourcing and decentralizing the supply chain [23]. The supply chain cost was found to be reduced by increasing the carbon cap in a cap-and-trade policy. Further, it was identified that executing a cap-and-trade policy within the transportation sector is a cost-effective way to reduce carbon emissions [24]. Various financing strategies, including delay-in-payment and bank loans, as well as two cap-and-trade policies, including carbon emission reduction cooperation and price cooperation, were investigated to elucidate how companies identify pricing and carbon-emission-reduction strategies under various financing regimes [25].
ETSs and carbon tax regimes implemented around the world account for 11.66 Gt CO2 equivalent, i.e., 23% of global GHG emissions, and prices per ton of CO2 vary from as low as USD 1.08 (JPY 151) in Saitama Japan, up to a high of USD 96.30 (JPY 13,480) in the European Union (EU) ETS [26].
Carbon taxes have become more prominent since 2014 and are implemented via environmental policies relating to carbon emissions in order to limit emissions in a region by levying a price, restriction, or tax for each unit of CO2 emissions within the supply chain. A recent study from Australia revealed that the total cost of a supply chain increases when a carbon tax is implemented, finding that costs increased by 1.4% for a carbon tax of AUD 23 (JPY 2070) per ton, demonstrating that a carbon tax can make a marked difference in an uncertain market and can also help enterprises to make informed environmental investment decisions [27]. It was also identified that even minor increases in carbon prices can result in considerable reductions in carbon footprints [28]. An environmental dynamic stochastic general equilibrium model was constructed using multiple stages of production and various types of productivity shocks to determine the optimal carbon tax rate in a supply chain, revealing that optimal carbon tax rates differ across stages and depend on the type of shocks experienced [29]. A study has also been undertaken on carbon tax and investment cooperation in agricultural supply chains to optimize the dual goals of enhancing profits and reducing carbon emissions work toward environmental protection [30]. An investigation on the effects of carbon taxes on costs, emissions, and cooperation savings in multi-echelon supply chains was undertaken using a number of strategies, identifying that following the implementation of carbon taxes, both costs and carbon emissions could be reduced through cooperation schemes [31]. The analysis of horizontal collaboration effects on carbon emissions for transportation [32] and inventory routing [33] showed that cooperation in supply chains has both financial and environmental benefits. The impacts of the retailer’s revenue (i.e., the amount of revenue the retailer is willing to share with the manufacturer to abate emissions in order to maximize profits) and cost-sharing (i.e., the amount a retailer is willing to invest in abatement costs to maximize profits), and how they may affect a manufacturer’s efforts to reduce carbon emissions when both consumer environmental awareness and a carbon tax are present, were assessed, suggesting that the government should charge the highest carbon tax level under revenue sharing, a moderate carbon tax under cost sharing, and the lowest carbon tax level under neither of the two schemes to increase manufacturers’ incentives to reduce emissions [34]. Current carbon tax prices range from a low of USD 0.82 (JPY 115) per ton of CO2 equivalent in Ukraine to a high of USD 155.87 (JPY 21,820) in Uruguay [35].
Considering carbon credits, many programs exist around the world offering the purchase of a carbon ‘credit’ in order to offset a carbon-intensive activity, sometimes separated into compliance and voluntary regimes [36]. The idea of a carbon credit was envisaged due to increasing awareness of the need to reduce emissions during the Kyoto Protocol era and formalized through mechanisms such as the Clean Development Mechanism (CDM) and Joint Implementation (JI) mechanism, leading to the issuance of Certified Emission Reduction (CER) carbon credits [37]. More recently, with the division of carbon credit issuance into mandatory (compliance) regimes, usually operated at the national level, and voluntary regimes, usually operated by industry or non-government organizations (NGO), a division in pricing has emerged. For example, pricing in the compliance market can be as high as EUR 90 (JPY 13,500) per ton of CO2 in the European Union, while in the voluntary markets, prices are much lower, with the Nature-Based Offset costing just USD 2.55 (JPY 357) per ton [38]. In terms of company decision making, the price of carbon- and carbon-credit-purchasing decisions have been shown to be closely associated with manufacturing and remanufacturing options and approaches [39]. In Japan, ‘J-Credit’ is the main carbon-credit regime and is used to certify the amount of GHG emissions reduced by sinks in Japan. Since 2013, the J-Credit program has been centralized under the government, and participants apply for the certification of credits (from emission reductions or energy savings), which can then be purchased by those who need to reduce their emissions according to their emission-reduction and reporting requirements [40].
2.3. Energy System Reform
In terms of energy system reform, shifting to a hydrogen economy is one option being considered around the world as a complimentary carbon-reduction measure, ideally via green hydrogen [41]. However, when considering the introduction of hydrogen, currently, some 92% of the world’s hydrogen is generated from fossil fuels (i.e., grey hydrogen), meaning that it is only carbon-free for the end user. In addition, the transition to a low-carbon energy system incorporating hydrogen has been shown to increase energy system costs by up to seven times by 2050, compared to 2000’s system cost levels [42]. Japan, as an importer of foreign energy, is considered a special case, wherein up to 25% of energy needs may be met by hydrogen by the year 2050 [43,44].
Although, ideally, the hydrogen economy will engender additional renewable energy and electrolysis deployment, the status quo suggests that fossil fuels will continue to underpin these efforts in the medium term, especially in Japan, where cheap foreign fossil fuels such as brown coal in Australia present an attractive hydrogen import pathway [45]. Significant reduction in electrolyzer costs, and the consideration of environmental, health, and broader exogenous impacts are required to make renewable hydrogen economy pathways more competitive in the long term [46]. The hydrogen economy has been found to be consistent with Environmental, Social, and Governance (ESG) principles and investments, making it attractive to investors and a likely destination of incentives in the future [47].
Another option for the decarbonization of the energy system being considered in some nations is the expanded use of nuclear power. There are several challenges associated with this option, notably decreases in profitability due to the availability of inexpensive fossil fuels, construction complexity and budget overruns, and the recent Fukushima Daiichi nuclear accident, which increased public concern levels [48]. With the emergence of next-generation nuclear plants and the potential for small modular reactors, some analysts see a role for nuclear power not only in energy system decarbonization but also as a flexible power source for alternative operations, including desalination, district heating or even for the generation of clean hydrogen [49]. In Japan, post-Fukushima, it was expected that nuclear power would be phased out in preference for other sources of energy; however, due to rising power prices as a result of the war in Ukraine and increased public support, nuclear energy is expected to be reinvigorated with an extension of power plants’ lifetimes [50]. Indeed, the sixth Strategic Energy Plan details an increase in nuclear power in the energy mix target for 2030 from 6% to 20–22% compared to the previous Strategic Energy Plan [6].
2.4. Transport Sector Policy Intervention
Many nations around the world are developing policies to move away from internal combustion engine (ICE) vehicles toward zero-emission vehicles, including electric vehicles (EVs) and fuel cell vehicles (FCVs). Among these nations, approximately 22 governments have set targets to achieve a 100% phaseout of light-duty (passenger) ICE vehicles. These include the nations of Canada, Chile, and some individual states of the US in the Americas, and Spain, France, Iceland, the UK, Norway, Denmark, Slovenia, the Netherlands, and Greece in Europe, with varying target years from 2025 to 2050 [51]. The transition from gasoline vehicles to electric vehicles has been investigated in terms of carbon-reduction potential, showing a reduction in emissions of up to 38%, predominantly in vehicle and fuel lifecycles and tailpipe emissions [52]. In Japan, the target for the ICE phaseout is 2035; however, this phaseout also includes the use of hybrid electric vehicles (HEVs). Since the introduction of a number of subsidies and tax offsets in Japan, consumers have opted for HEVs in greater numbers [53]; however, EVs and FCVs have not penetrated the market in the same way. As eVs are superior to HEVs in reducing GHG emissions in most cases [54], how and when Japan transitions to zero-emission vehicles will influence the overall cost and efficacy of this policy intervention.
2.5. International Plastic Supply-Chain Greening
It has been recognized that single-use plastics do not biodegrade and also cause issues such as microplastic, and of the 9% of single-use plastics that have been recycled between 1950 and 2015, only 10% of these have been recycled more than once, with the need for a shift to a more sustainable model in line with the ideals of a circular economy [55]. Research has also been conducted with regard to achieving the global carbon neutrality of plastic production, considering the existing plastic waste as a carbon reservoir toward increased levels of recycling and a shift toward bioplastic-based plastic substitution. Researchers have recognized that under this scenario, extra GHGs are emitted from incineration and energy consumption and that it is difficult to achieve a carbon-neutral plastic industry through one-off efforts [56]. The appropriate accounting for carbon stored in plastics was also identified in research that initially promoted an increased recycling rate of plastic and ensured that incineration utilizes carbon capture and storage (CCS) while aiming to shift to a circular economy and renewable plastic feedstocks by the 2030s [57]. In order to achieve the needed increase in recycling rates, chemical recycling is presented as a way to recycle those plastics that are difficult to recycle mechanically; however, it has been identified that challenges such as feedstock quality, sorting, and product standardization hinder these efforts toward achieving a circular economy for plastics [58]. In considering reducing GHG emissions due to plastic recycling, a study showed that current recycling practices could reduce their emissions by approximately 13% by optimizing the plastic recycling process through initiatives such as avoiding unnecessary storage, improving equipment maintenance, defining quality control, and standardizing the operating procedures, finding that these interventions also improved profitability over time [59]. The upcycling of plastics via the thermochemical conversion to higher-value materials such as graphitic carbons for the electronics industry has also been proposed [60]. With regard to the cost of greening plastic and chemical supply chains, prior research identified the common theme of a need to increase recycling and also the need for a carbon price between USD 190 and USD 370 (JPY26,600 to JPY 51,800) by 2050, accompanied by reduced pricing for renewable energy and biomass and increased investment by the chemical industry [61]. As governments shift their focus toward carbon neutrality, obligations are also being imposed on the private sector, leading to a need to improve recycling and waste-management goals. These factors are also becoming increasingly important for investors who want to know that their investments will have a positive environmental impact [62].
To our knowledge, no research to date has comprehensively investigated the economic efficacy of the deliberate substitution of necessary resources underpinning plastic product manufacturing with low-carbon alternatives, the emission reduction impacts of such an approach, or the economic and efficacy contrast with existing approaches. This research clarifies these aspects and provides policymakers with a quantitative evidence base for developing policies that will reduce carbon emissions in the supply chain at the best cost in line with manufacturers’ goals and identify opportunities for the prioritization and reallocation of existing subsidization schemes.
3. Methodology
The methodology of this study consists of three parts. First, an assessment of existing carbon-reduction regimes and cost per reduction of one ton of CO2 is clarified for Japan, utilizing the evaluation of research-based and historical data to capture current prices and fluctuations in carbon-reduction costs over time. The scope of this analysis is detailed in Table 1.

Table 1.
Carbon-Reduction Regimes and Scope of Analysis.
In the case of the ETS and J-Credit carbon-reduction regimes, annually published prices can be utilized directly; however for the other regimes, the cost per kWh of generation (i.e., for FIT and nuclear) is essential, and for system changes, including the hydrogen economy and ICE phaseout, pricing regimes and system cost estimates are utilized for the calculation of per-ton carbon offset costs.
Second, a lifecycle assessment (LCA) and economic assessment of six varieties of commonly used plastics detailed in Table 2, considering virgin plastic (oil-derived), recycled plastic, and bioplastic varieties are undertaken.
Table 2.
Plastic Types and Environmental and Economic Analysis Scope.
LCA-based Global Warming Potential (GWP) estimates for virgin materials are calculated using lifecycle inventory datasets by considering the derivation of each plastic type from crude oil using the PlasticsEurope Eco-profile methodology detailed in [77] under a cradle-to-gate system boundary in line with ISO 14040 [96]. This methodology includes energy mix and transport factors, as well as all relevant processes from the extraction of crude oil, refining, and subsequent processes relevant to each plastic type, with a declared unit of 1 Kg of unpacked resin, representative of average European resin production. Subsequently, for each recycled plastic, mechanical recycling processes are considered to derive GWP estimates [85,86,87] from precedential research and industry recyclers. Bio-derived plastic GWP estimates consider recent research and commercial publications, where data were available for four of the six considered plastic types [90,91,92,93], some of which are still at the laboratory or pilot stage. Cost estimates are derived from monthly Japanese market price reports [78,79] for virgin plastics, where available, and international import costs and recent research publications for other plastic types [88,89]. Quality is a subjective factor, emphasizing the desire of manufacturers to utilize virgin plastics, and is then decreased in a ratio of recycled content to simulate the decreased perceived quality of plastics as the ratio of recycled content increases (i.e., if the plastic has 10% recycled content, the perceived quality score will be reduced from 10 to 9 and so on). Recyclability is established by industry norms, ease of recyclability, and the total comparative number of times each plastic can be recycled satisfactorily according to both recent research on overall plastic-type recyclability and established recycling regimes and recycler preferences [80,81,82,83,84,94,95]. An evaluation of the cost of reducing CO2 via plastic recycling and the use of bio-alternatives is detailed and contrasted with existing and future carbon-reduction regimes. Sensitivity analysis is also conducted on the impacts of varying oil prices on the production of virgin plastics.
Third, a multicriteria assessment cognizant of cost, GWP, quality, and recyclability of each plastic type and blend to determine plastic selection priorities for manufacturers is undertaken, an approach often used in energy system design [97]. Based on these three analyses, policy implications and the potential for supply-chain greening via recycling regimes and environmental and economic implications are extracted in the discussion section.
4. Results
The results are presented in the same order as the methods, beginning with the derivation of existing and under-consideration carbon-reduction options in Japan.
4.1. Costs of Existing and Under-Consideration Carbon-Reduction Regime
Figure 1 summarizes the cost per ton of CO2 reduced for existing regimes currently in operation (the FIT, Saitama and Tokyo ETS, and J-Credits for renewable energy deployment and energy efficiency) over time.
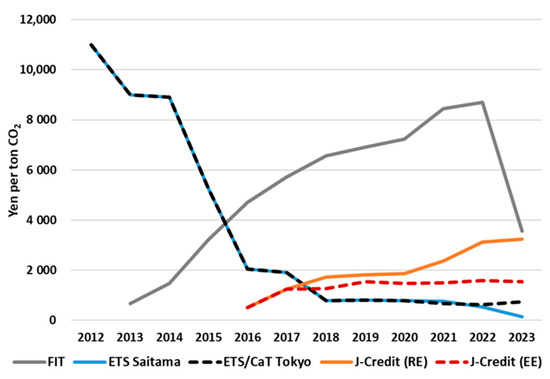
Figure 1.
Costs of Existing Carbon-Reduction Regime Over Time.
For the FIT in Japan, CO2-reduction costs were derived according to the imputed increase in generation costs of electricity bills per kWh, divided by the reduction in carbon intensity of the energy mix over time due to the deployment of renewable energy [63,64]. For the ETS and J-Credit schemes, time series data were utilized [26,65,66,67].
Figure 2 details the range of costs for existing regimes and the estimated costs for proposed policies, including hydrogen society, the reinvigoration of nuclear power stations, and a shift away from ICE vehicles.
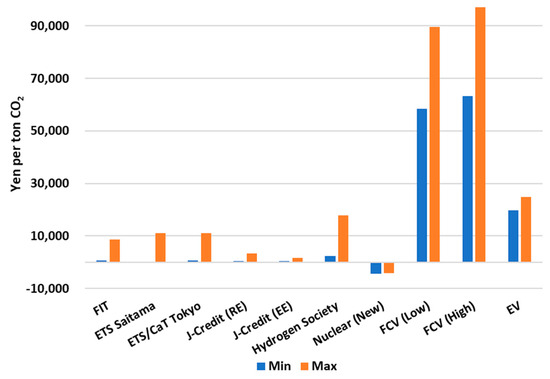
Figure 2.
Cost Estimates of Existing and Proposed Carbon-Reduction Regime.
For the hydrogen society, we assume that hydrogen will be imported to Japan and be carbon-free at the point of use [42], with costs declining in line with Japanese roadmaps to 2030 [68,69]. Increasing the lifetimes of nuclear power stations is the only cost-negative approach, significantly reducing customers’ electricity bills. The vehicle transition to FCV and EV alternatives is the most expensive option, based on tons of CO2 reduced over the vehicle’s life (13 years) and tax incentives provided to purchase vehicles [75].
4.2. Plastic LCA and the Economic and Environmental Assessment of CO2-Reduction Options
Figure 3 details the GWP and cost per Kg of plastic produced for virgin, recycled, and bio-derived options.
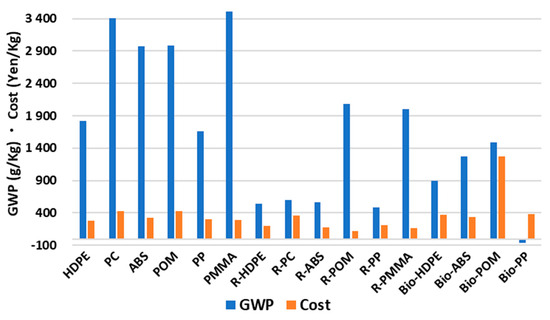
Figure 3.
Virgin, Recycled, and Bioplastic Production GWP and Cost.
Virgin plastics are comparatively expensive to produce, with the highest GWP, as they are produced from crude oil [77,78,79,80,81,82,83,84]. Recycled plastics are cheaper to produce than their virgin counterparts based on a number of recycling methods (both mechanical and chemical) with lower GWP values [85,86,87,88,89], and bioplastics show good GWP values compared to virgin alternatives but are generally more expensive to produce than both recycled and virgin options [90,91,92,93,94,95]. Bio-PP is carbon-negative in its production, but we recognize that these GWP figures will vary by region and the production method used [93]. Further, we also realize that bioplastics are not always suitable as ‘drop in’ replacements for their virgin counterparts and that the availability of recycled and bioplastics is not guaranteed in all cases.
Figure 4 shows the cost of reducing CO2 per ton via recycled and bioplastic alternatives (shown on the y-axis), cognizant of the sensitivity of virgin plastic costs due to changes in crude oil price (shown on the x-axis).
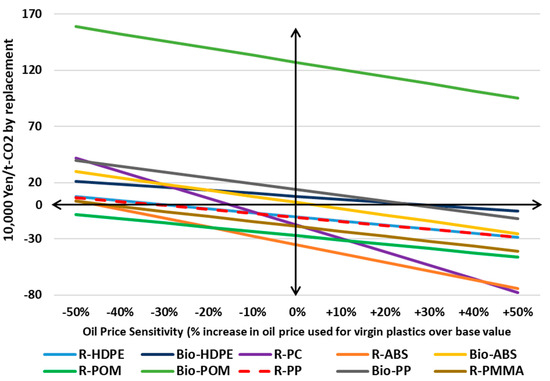
Figure 4.
CO2-Reduction Cost via Recycled and Bio-alternative Plastics.
When oil prices are low, most recycled and bioplastic alternatives have a positive cost of CO2 reduction, except for recycled POM, for which it is consistently negative. Bio-POM, on the other hand, never becomes a cost-efficient CO2 reduction option, even in times of very high oil prices. Generally speaking, bioplastics are the most expensive option to reduce CO2, ranging between approximately JPY 79,000 per ton (Bio-HDPE) and JPY 1,270,000 per ton (Bio-POM) of CO2 reduced by the replacement (at stable oil prices). Recycled plastics offer a negative cost per ton of CO2 reduced unless oil prices are particularly low, meaning that choosing these plastic types as alternatives to virgin plastics seems attractive if they can meet quality requirements.
4.3. Multicriteria Analysis for Plastic Selection
Figure 5 shows the multicriteria weighted scores on a scale of 0 to 100, where higher is better, for each plastic type and a number of recycle blend levels, in terms of their desirability for manufacturers under a number of scenarios. For each scenario, scores for each of the four factors are normalized in a range from 0 to 1 based on a normalization according to the most desirable outcome, i.e., for GWP and cost, which will be the minimum (or lowest) comparative value among plastic types, while for quality and recyclability, it is the maximum (or highest) comparative value. These scores are then multiplied by the allocated weighting in each scenario to achieve a score with a maximum value of 100, i.e., the best option for each scenario’s stated goal. Virgin refers to crude oil-derived plastics, R10, R20, and R50 refer to the blend level of recycled and virgin sources, while Bio refers to bioplastics (where available). Scenarios are noted in parentheses, with G describing the lowest GWP, C describing the lowest cost, Q describing the best perceived quality, and R describing high recyclability as the priority for manufacturers. The dual scenarios of G&C and Q&G describe the combination of GWP and the lowest cost and the quality and GWP as priorities for manufacturers. Scenarios without parentheses imply equal weighting of all four criteria.
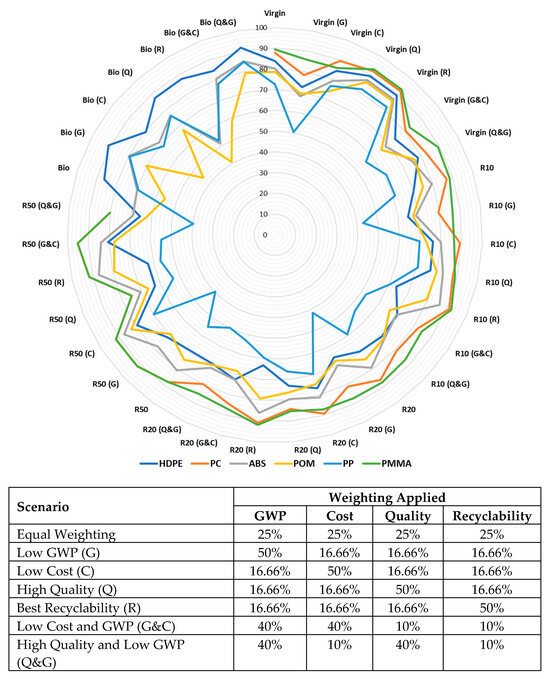
Figure 5.
Multicriteria Weighted Scores for Plastic Selection.
In deriving this analysis, we consider GWP and costs as detailed above, along with quality and recyclability factors depending on blends and the manufacturer’s perceived level of plastic quality (please see Appendix A for the raw scores allocated to each component). For HDPE, bioplastics score highly in most scenarios, with virgin HDPE only excelling in the scenarios with priority on recyclability and quality. PC scores highly in scenarios equally weighted and recyclability priority. For ABS, whose scores were somewhat muted overall, highly recycled (R50) blends excelled in most cases due to the high level of recyclability shown by ABS plastic. Bio-ABS was considered superior when quality and GWP were prioritized. Bio-POM, on the other hand, did not score well in most scenarios, except for the scenario prioritizing GWP. Virgin sources of POM were considered superior in almost all scenarios. On the other hand, Bio-PP excelled in a number of scenarios but not for recyclability and perceived quality. PMMA scored highly in virgin and recycled blends over a number of criteria and scenarios, except for quality-centric priorities for highly recycled blends. Multicriteria analysis allows us to demonstrate that there is no one approach or plastic blend that will satisfy manufacturers in every case.
5. Discussion and Policy Implications
First, this study detailed existing and proposed carbon-reduction regime costs for various carbon-reduction options in Japan, including the shift toward recycled and bio-based plastics. Further, we investigated global issues surrounding the need for the modification of plastic supply chains and the establishment of carbon taxes and investment opportunities. The cost-effectiveness of each of these options over time was analyzed, providing insights into their potential impact on carbon-reduction efforts and a comparison baseline for plastic-related initiatives.
We also explored the lifecycle GWP and production costs of different types of plastics, including virgin, recycled, and bio-based options, leading to the derivation of cost comparisons for reducing CO2 emissions through the utilization of these alternatives. Our investigation highlighted that recycled plastics offer a negative cost per ton of CO2 reduced, making them an attractive option in certain conditions, except when oil prices are low. However, bioplastics generally incur a higher cost for CO2 reduction, with significant variations depending on the type of virgin plastic being replaced. Our LCA and economic assessment of plastics suggest that promoting the increased use of recycled plastics can be an economically viable strategy for reducing CO2 emissions, while greater incentives or reductions in cost are required to include bioplastics in this scheme. Policymakers could develop policies to support recycling industries and create a market for recycled plastics, thereby incentivizing businesses to opt for more sustainable packaging and products.
In addition, we provided a multicriteria analysis regime to evaluate the desirability of different plastic types and recycle blend levels for manufacturers under various scenarios. The criteria included GWP, cost, quality, and recyclability. Our analysis showed how different plastics perform under different scenarios and highlighted that there is no one-size-fits-all approach for plastic selection and that the best choice will depend on the manufacturer’s priorities and acceptable recycled plastic blend levels:
- Bio-HDPE, a drop-in replacement for virgin HDPE, performs well in a number of scenarios,
- Bio-POM is only considered viable under a scenario with low priority for GWP, where cost is not an issue, an unlikely situation without significant incentives.
- ABS and PC perform well in scenarios with priority on recyclability, and ABS scores well at high recycled content levels and as a bio-alternative where GWP reduction is a priority.
- Bio-PP struggles to achieve high scores due to limitations in recyclability and perceived quality.
- PMMA scores well for virgin and recycled blends in a number of scenarios, except where recycled content is high and quality is perceived as a priority.
As a result, our analysis of bioplastics reveals that they have the potential to offer lower GWP values but are generally more expensive to produce. Policymakers could consider research-and-development grants or incentives to promote technological advancements in bioplastics, making them more cost-competitive with virgin and recycled alternatives. The issue of land and water requirements here is particularly pertinent for Japan, where land and other resources are at a premium, as noted by the Japanese Government’s Roadmap for Bioplastics Introduction [98].
In addition, policymakers and manufacturers should recognize that plastic selection involves tradeoffs between various criteria. Different scenarios and priorities may lead to distinct preferences for certain plastic types and blend levels, leading to the tailoring of regulations and standards that support diverse sustainable plastic solutions based on specific applications and needs. In addition to the design of policies supportive of recycled and bio-derived plastics, policymakers also need to be aware of exogenous impacts on supply chains that put pressure on oil prices, for example, which were recently realized as a result of the war in Ukraine, driving up both oil and energy prices in Japan and around the world.
One key finding of this research is that the cost of shifting to bioplastics in favor of virgin materials is currently the most expensive carbon-reduction option for Japan, compared to the FIT, ETS, energy-system-intervention options, and next-generation vehicles, even for the most cost-effective option (bio-HDPE). In order to close this gap, as has been identified in precedential research, an increase in carbon prices is necessary, as largely envisaged both in Japan and globally [99,100].
In addition to an increase in carbon prices that will help to reduce this cost differential is the potential for consumers to prefer bio-derived plastics, expressed as a willingness to pay (WTP). Previous studies have investigated WTP with regard to preferring better-performing plastics from an environmental point of view. Among these, bioplastics were viewed favorably by consumers who had a high level of environmental awareness, and WTP varied based on the end use of bioplastic, with a 10–20% premium found to be acceptable to consumers for horticultural products and a 6–24% premium deemed acceptable for food and beverage packaging [101]. For bio-based water bottles, a WTP of 8–30% was identified; however, it is uncertain if this willingness will translate into actual behavior in the future, with education and labeling found to be critical in enhancing this environmentally positive behavior [102].
Another outstanding issue in Japan requiring redress is the currently high level of thermal recycling and the need to reduce this in favor of mechanical and chemical recycling approaches [12]. If an approach can be developed that successfully satisfies quality concerns, thermally recycled plastic can be reduced in favor of recycled plastics, in line with the Japanese government’s goals [13]. One additional policy implication that arises is the necessity for the development of a system that can ensure manufacturer and consumer satisfaction with recycled plastic quality through a central collection and sorting regime that incorporates a chain of provenance and quality-assurance functions.
It is hoped that the analysis and findings of this research can aid in reducing thermal recycling in Japan, greening plastic supply chains, and encouraging the appropriate selection of virgin, recycled, and bio-derived plastics to satisfy manufacturers and end users and toward the achievement of government carbon-reduction goals.
When considering the recycling of plastic wastes in Japan toward decarbonizing this sector, we note that in 2021, the total plastic waste was 8.24 million tons, while resin production was approximately 10.5 million tons [12], meaning that if all of Japan’s plastic waste was recycled efficiently via mechanical or chemical means, approximately 78% of required resins could be produced via recycling.
6. Conclusions
There is a huge opportunity in Japan to recycle and utilize more otherwise thermally recycled plastics. To do so, manufacturers and consumers must accept recycled plastics more broadly or be willing to pay more for bio-alternatives.
This research provides policymakers with not only implications toward the development of plastic supply chain and production policies that will reduce GHG emissions in the long term and contribute toward carbon neutrality but also an overview of the cost-effectiveness of existing and proposed carbon-reduction regimes in Japan to aid in the formulation of targeted policies to incentivize the adoption of more cost-efficient options and phase out less economically viable approaches. As plastic production continues to ramp up and associated GHG emissions grow, reducing emissions in this sector will become critical to achieving carbon-neutral goals both in Japan and more broadly. The reallocation of subsidies from other sectors that do not yield as deep cuts in GHG is one approach, and shifting toward renewable and bio-derived plastics as carbon prices increase over time is another strategy that may be employed. Issues of quality and recyclability may be allayed via the development of a centralized collection, treatment, and recycling regime that satisfies manufacturers’ and consumers’ perceived quality and potential GHG-reduction concerns. In Japan, the production of bioplastics utilizing starch, as is common in other nations, may compete with agricultural land, water, and ultimately food-production needs. In order to overcome this issue, Japanese researchers are focusing on cellulose-based bioplastics, notably those sourced from wood pulp and other agricultural waste products [103]. It is hoped that the scaling up of these efforts in line with an ever-growing bioplastic market will overcome food vs. plastic production issues while attracting investment.
In terms of future work, an investigation of the quality requirements and manufacturers’ desires for recycled and bio-based plastics needs to be undertaken to elicit the barriers to greater levels of recycled plastics across multiple industries and sectors. Broadening these investigations to the consumer level may also be useful as a complementary measure in matching supply with demand.
Author Contributions
The research design was proposed by Y.Y. and K.K., and the manuscript was written by all authors. Data collection and curation were undertaken by A.C., T.F. and K.K.S. Model design and analysis was undertaken by K.K.S., A.C. and T.F. The project was supervised and coordinated by A.C. All authors have read and agreed to the published version of the manuscript.
Funding
This project was funded under a joint research agreement between Sotas Co., Ltd., and the International Institute for Carbon Neutral Energy Research, Kyushu University.
Data Availability Statement
Data will be made available upon reasonable request, excluding industry-partner-specific sensitive data.
Acknowledgments
This research was supported through the confidential provision of industry data from a Japanese plastic manufacturer. We are also grateful for the guiding comments received from Professor Hajime Ohno.
Conflicts of Interest
The authors declare no conflict of interest.
Appendix A
Table A1.
Raw scores for GWP, Cost, Quality and Recyclability.
Table A1.
Raw scores for GWP, Cost, Quality and Recyclability.
| Plastic Type | GWP (Kg CO2/Kg Plastic; Virgin [77], Recycled [85,86,87] and Bio [90,91,92,93]) | Cost (JPY/Kg; Virgin [78,79], Recycled and Bio [88,89]) | Quality (Qualitative, Based on Perceived Quality of Recycled Blend) | Recyclability (Ease of Recycling, Times Material Able to be Recycled; Virgin and Recycled [80,81,82,83,84], Bio [94,95]) |
|---|---|---|---|---|
| HDPE | 1.82 | 285 | 10 | 10 |
| PC | 3.41 | 425 | 10 | 7 |
| ABS | 2.97 | 325 | 10 | 7 |
| POM | 2.98 | 426 | 10 | 9 |
| PP | 1.66 | 300 | 10 | 5 |
| PMMA | 3.51 | 293 | 10 | 7 |
| R10-HDPE | 1.692 | 276.735 | 9 | 5 |
| R10-PC | 3.129 | 418.625 | 9 | 7 |
| R10-ABS | 2.72943 | 310.375 | 9 | 7 |
| R10-POM | 2.8906 | 395.5 | 9 | 8 |
| R10-PP | 1.542 | 290.7 | 9 | 3 |
| R10-PMMA | 3.359 | 280.5 | 9 | 7 |
| R20-HDPE | 1.564 | 268.47 | 8 | 5 |
| R20-PC | 2.848 | 412.25 | 8 | 7 |
| R20-ABS | 2.48886 | 295.75 | 8 | 7 |
| R20-POM | 2.8012 | 365 | 8 | 8 |
| R20-PP | 1.424 | 281.4 | 8 | 3 |
| R20-PMMA | 3.208 | 268 | 8 | 7 |
| R50-HDPE | 1.18 | 243.675 | 5 | 5 |
| R50-PC | 2.005 | 393.125 | 5 | 7 |
| R50-ABS | 1.76715 | 251.875 | 5 | 7 |
| R50-POM | 2.533 | 273.5 | 5 | 8 |
| R50-PP | 1.07 | 253.5 | 5 | 3 |
| R50-PMMA | 2.755 | 230.5 | 5 | 7 |
| Bio-HDPE | 0.9 | 370.5 | 9 | 9 |
| Bio-ABS | 1.2771 | 338 | 9 | 1 |
| Bio-POM | 1.49 | 1278 | 9 | 1 |
| Bio-PP | −0.06 | 380 | 9 | 1 |
References
- Ferrari, M.M.; Pagliari, M.S. No Country Is an Island. International Cooperation and Climate Change. SSRN Electron. J. 2021. [Google Scholar] [CrossRef]
- IEA CO2 Emissions in 2022. IEA Paris. 2023. Available online: https://www.iea.org/reports/co2-emissions-in-2022 (accessed on 5 July 2023).
- Yuan, X.; Su, C.W.; Umar, M.; Shao, X.; Lobonţ, O.R. The Race to Zero Emissions: Can Renewable Energy Be the Path to Carbon Neutrality? J. Environ. Manag. 2022, 308, 114648. [Google Scholar] [CrossRef] [PubMed]
- Ritchie, H.; Roser, M. Our World in Data: CO2 Emissions. 2023. Available online: https://ourworldindata.org/co2-and-greenhouse-gas-emissions (accessed on 7 July 2023).
- Hu, J.; Honma, S.; Chang, S. Renewable Energy Generation Efficiency of Japan’s Administrative Regions_ An Application of the Dynamic Slacks-Based Measure. Next Energy 2023, 1, 100029. [Google Scholar] [CrossRef]
- METI Outline of the 6th Strategic Energy Plan. 2021. Available online: https://www.enecho.meti.go.jp/en/category/others/basic_plan/pdf/6th_outline.pdf (accessed on 22 July 2023).
- Nikkei Asia Japan Buys Its Way to Kyoto Success. Nikkei Asia 2014. Available online: https://asia.nikkei.com/NAR/Articles/Japan-buys-its-way-to-Kyoto-success3 (accessed on 4 July 2023).
- Nguyen, D.H.; Chapman, A.; Farabi-Asl, H. Nation-Wide Emission Trading Model for Economically Feasible Carbon Reduction in Japan. Appl. Energy 2019, 255, 113869. [Google Scholar] [CrossRef]
- Stegmann, P.; Daioglou, V.; Londo, M.; van Vuuren, D.P.; Junginger, M. Plastic Futures and Their CO2 Emissions. Nature 2022, 612, 272–276. [Google Scholar] [CrossRef]
- Institute for Global Environmental Strategies Plastic Atlas Asia: Japan’s Plastic Waste Management—Challenges and Potential Solutions. 2022. Available online: https://www.iges.or.jp/en/publication_documents/pub/reportchapter/en/12341/PlasticAtlasAsia2022_en_WEB_1.pdf (accessed on 22 July 2023).
- The Japan Research Institute Current Status and New Business Potential of Waste Plastics in Japan. Available online: https://www.jri.co.jp/page.jsp?id=36897 (accessed on 7 July 2023).
- Plastic Waste Management Institute. An Introduction to Plastic Recycling 2022. 2022. Available online: https://www.pwmi.or.jp/ei/plastic_recycling_2022.pdf (accessed on 21 July 2023).
- NEDO Basic Plan for the Development of Innovative Plastic Resource Recycling Process Technology. 2020. Available online: https://www.nedo.go.jp/content/100919126.pdf (accessed on 7 June 2023).
- Pereira da Silva, P.; Dantas, G.; Pereira, G.I.; Câmara, L.; De Castro, N.J. Photovoltaic Distributed Generation—An International Review on Diffusion, Support Policies, and Electricity Sector Regulatory Adaptation. Renew. Sustain. Energy Rev. 2019, 103, 30–39. [Google Scholar] [CrossRef]
- Huenteler, J. International Support for Feed-in Tariffs in Developing Countries—A Review and Analysis of Proposed Mechanisms. Renew. Sustain. Energy Rev. 2014, 39, 857–873. [Google Scholar] [CrossRef]
- Tanaka, Y.; Chapman, A.; Tezuka, T.; Sakurai, S. Putting the Process into the Policy Mix: Simulating Policy Design for Energy and Electricity Transitions in Japan. Energy Res. Soc. Sci. 2020, 70, 101702. [Google Scholar] [CrossRef]
- Tanaka, Y.; Chapman, A.; Sakurai, S.; Tezuka, T. Feed-in Tariff Pricing and Social Burden in Japan: Evaluating International Learning through a Policy Transfer Approach. Soc. Sci. 2017, 6, 127. [Google Scholar] [CrossRef]
- Ministry of Economy Trade and Industry Renewable Energy Purchase Prices, Surcharge Rate, and Other Details Related to FIT and FIP Schemes from FY2022 Onward to Be Determined. 2022. Available online: https://www.meti.go.jp/english/press/2022/0325_004.html (accessed on 5 July 2023).
- Nikkei Newspaper Renewable Energy Surcharge Reduced to 1.40 Yen, the First Ever Reduction. Average Household Bills to Fall by 820 Yen per Month. Available online: https://www.nikkei.com/article/DGXZQOUA240S60U3A320C2000000/ (accessed on 5 July 2023).
- Chu, L.; Takeuchi, K. The Non-Operating Solar Projects: Examining the Impact of the Feed-in Tariff Amendment in Japan. Energy Policy 2022, 160, 112712. [Google Scholar] [CrossRef]
- International Carbon Action Partnership. International Carbon Action Partnership Status Report 2022. 2022. Available online: https://icapcarbonaction.com/system/files/document/220408_icap_report_rz_web.pdf (accessed on 21 July 2023).
- World Bank. Putting a Price on Carbon with an ETS. 2012. Available online: https://www.worldbank.org/content/dam/Worldbank/document/Climate/background-note_ets.pdf (accessed on 7 July 2023).
- Abdallah, T.; Diabat, A.; Simchi-Levi, D. A Carbon Sensitive Supply Chain Network Problem with Green Procurement. In Proceedings of the 40th International Conference on Computers & Indutrial Engineering, Awaji, Japan, 25–28 July 2010. [Google Scholar] [CrossRef]
- Giarola, S.; Shah, N.; Bezzo, F. A Comprehensive Approach to the Design of Ethanol Supply Chains Including Carbon Trading Effects. Bioresour. Technol. 2012, 107, 175–185. [Google Scholar] [CrossRef] [PubMed]
- Yang, L.; Chen, Y.; Ji, J. Cooperation Modes of Operations and Financing in a Low-Carbon Supply Chain. Sustainability 2018, 10, 821. [Google Scholar] [CrossRef]
- World Bank. Carbon Pricing Dashboard: ETS Prices. Available online: https://carbonpricingdashboard.worldbank.org/map_data (accessed on 7 May 2023).
- Fahimnia, B.; Sarkis, J.; Boland, J.; Reisi, M.; Goh, M. Policy Insights from a Green Supply Chain Optimisation Model. Int. J. Prod. Res. 2015, 53, 6522–6533. [Google Scholar] [CrossRef]
- Hammami, R.; Nouira, I.; Frein, Y. Carbon Emissions in a Multi-Echelon Production-Inventory Model with Lead Time Constraints. Int. J. Prod. Econ. 2015, 164, 292–307. [Google Scholar] [CrossRef]
- Chan, Y.T.; Zhao, H. Optimal Carbon Tax Rates in a Dynamic Stochastic General Equilibrium Model with a Supply Chain. Econ. Model. 2023, 119, 106109. [Google Scholar] [CrossRef]
- Liu, Z.; Lang, L.; Hu, B.; Shi, L.; Huang, B.; Zhao, Y. Emission Reduction Decision of Agricultural Supply Chain Considering Carbon Tax and Investment Cooperation. J. Clean. Prod. 2021, 294, 126305. [Google Scholar] [CrossRef]
- Halat, K.; Hafezalkotob, A.; Sayadi, M.K. Cooperative Inventory Games in Multi-Echelon Supply Chains under Carbon Tax Policy: Vertical or Horizontal? Appl. Math. Model. 2021, 99, 166–203. [Google Scholar] [CrossRef]
- Ouhader, H.; El Kyal, M. The Impact of Horizontal Collaboration on CO2 Emissions Due to Road Transportation. In Proceedings of the International Conference on Industrial Engineering and Operations Management, Rabat, Morocco, 11–13 April 2017. [Google Scholar]
- Soysal, M.; Bloemhof-Ruwaard, J.M.; Haijema, R.; van der Vorst, J.G.A.J. Modeling a Green Inventory Routing Problem for Perishable Products with Horizontal Collaboration. Comput. Oper. Res. 2018, 89, 168–182. [Google Scholar] [CrossRef]
- Yang, H.; Chen, W. Retailer-Driven Carbon Emission Abatement with Consumer Environmental Awareness and Carbon Tax: Revenue-Sharing versus Cost-Sharing. Omega 2018, 78, 179–191. [Google Scholar] [CrossRef]
- World Bank. Carbon Pricing Dashboard: Carbon Tax Prices. Available online: https://carbonpricingdashboard.worldbank.org/map_data (accessed on 7 May 2023).
- Carbon Offset Guide Carbon Offset Programs. Available online: https://www.offsetguide.org/understanding-carbon-offsets/carbon-offset-programs/ (accessed on 7 May 2023).
- Show, K.Y.; Lee, D.J. Carbon Credit and Emission Trading: Anaerobic Wastewater Treatment. J. Chinese Inst. Chem. Eng. 2008, 39, 557–562. [Google Scholar] [CrossRef]
- Live Carbon Prices Today. Available online: https://carboncredits.com/carbon-prices-today/ (accessed on 9 May 2023).
- Wang, Y.; Wang, F. Effects of the Carbon Credits Buy-Back Policy on Manufacturing/Remanufacturing Decisions of the Capital-Constrained Manufacturer. J. Ind. Manag. Optim. 2023, 19, 594–628. [Google Scholar] [CrossRef]
- J-Credit Scheme Outline of J-Credit Scheme. 2023. Available online: https://japancredit.go.jp/english/pdf/credit_english_001_41.pdf (accessed on 5 July 2023).
- Sadik-Zada, E.R. Political Economy of Green Hydrogen Rollout: A Global Perspective. Sustainability 2021, 13, 13464. [Google Scholar] [CrossRef]
- Chapman, A.; Itaoka, K.; Farabi-Asl, H.; Fujii, Y.; Nakahara, M. Societal Penetration of Hydrogen into the Future Energy System: Impacts of Policy, Technology and Carbon Targets. Int. J. Hydrogen Energy 2020, 45, 3883–3898. [Google Scholar] [CrossRef]
- Chaube, A.; Chapman, A.; Shigetomi, Y.; Huff, K.; Stubbins, J. The Role of Hydrogen in Achieving Long Term Japanese Energy System Goals. Energies 2020, 13, 4539. [Google Scholar] [CrossRef]
- Sugiyama, M.; Fujimori, S.; Wada, K.; Endo, S.; Fujii, Y.; Komiyama, R.; Kato, E.; Kurosawa, A.; Matsuo, Y.; Oshiro, K.; et al. Japan’s Long-Term Climate Mitigation Policy: Multi-Model Assessment and Sectoral Challenges. Energy 2019, 167, 1120–1131. [Google Scholar] [CrossRef]
- Kamiya, S.; Nishimura, M.; Harada, E. Study on Introduction of CO2 Free Energy to Japan with Liquid Hydrogen. Phys. Procedia 2015, 67, 11–19. [Google Scholar] [CrossRef]
- Chapman, A.J.; Fraser, T.; Itaoka, K. Hydrogen Import Pathway Comparison Framework Incorporating Cost and Social Preference: Case Studies from Australia to Japan. Int. J. Energy Res. 2017, 41, 2374–2391. [Google Scholar] [CrossRef]
- Zavarkó, M. The Global ESG Trend and Adaptation Opportunities in the Emerging Hydrogen Economy: A Corporate Governance Perspective. Soc. Econ. 2023. [Google Scholar] [CrossRef]
- Buongiorno, J.; Corradini, M.; Parsons, J.; Petti, D. Nuclear Energy in a Carbon-Constrained World: Big Challenges and Big Opportunities. IEEE Power Energy Mag. 2019, 17, 69–77. [Google Scholar] [CrossRef]
- Bistline, J.; Bragg-Sitton, S.; Cole, W.; Dixon, B.; Eschmann, E.; Ho, J.; Kwon, A.; Martin, L.; Murphy, C.; Namovicz, C.; et al. Modeling Nuclear Energy’s Future Role in Decarbonized Energy Systems. iScience 2023, 26, 105952. [Google Scholar] [CrossRef]
- World Nuclear News. Poll Finds Record Support for Japanese Reactor Restarts. Available online: https://world-nuclear-news.org/Articles/Poll-finds-record-support-for-Japanese-reactor-res (accessed on 19 July 2023).
- The International Council on Clean Transportation Phase out of Light Duty Vehicles. Available online: https://theicct.org/phase-out-map-ldv/ (accessed on 23 June 2023).
- Morfeldt, J.; Shoman, W.; Johansson, D.J.A.; Yeh, S.; Karlsson, S. If Electric Cars Are Good for Reducing Emissions, They Could Be Even Better with Electric Roads. Environ. Sci. Technol. 2022, 56, 9593–9603. [Google Scholar] [CrossRef] [PubMed]
- Wang, J.; Matsumoto, S. Can Subsidy Programs Lead Consumers to Select “Greener” Products?: Evidence from the Eco-Car Program in Japan. Res. Transp. Econ. 2022, 91, 101066. [Google Scholar] [CrossRef]
- Sacchi, R.; Bauer, C.; Cox, B.; Mutel, C. When, Where and How Can the Electrification of Passenger Cars Reduce Greenhouse Gas Emissions? Renew. Sustain. Energy Rev. 2022, 162, 112475. [Google Scholar] [CrossRef]
- Sheldon, R.A. Biocatalysis and Biomass Conversion: Enabling a Circular Economy: Biocatalysis and Biomass Conversion. Philos. Trans. R. Soc. A Math. Phys. Eng. Sci. 2020, 378, 20190274. [Google Scholar] [CrossRef]
- Sun, X.; Xie, M.; Mai, L.; Zeng, E.Y. Biobased Plastic: A Plausible Solution toward Carbon Neutrality in Plastic Industry? J. Hazard. Mater. 2022, 435, 129037. [Google Scholar] [CrossRef]
- Sandberg, E.; Krook-Riekkola, A. Accounting for Carbon Flows into and from (Bio)Plastic in a National Climate Inventory. GCB Bioenergy 2023, 15, 208–223. [Google Scholar] [CrossRef]
- Qureshi, M.S.; Oasmaa, A.; Pihkola, H.; Deviatkin, I.; Tenhunen, A.; Mannila, J.; Minkkinen, H.; Pohjakallio, M.; Laine-Ylijoki, J. Pyrolysis of Plastic Waste: Opportunities and Challenges. J. Anal. Appl. Pyrolysis 2020, 152, 104804. [Google Scholar] [CrossRef]
- Rahim, R.; Abdul Raman, A.A. Carbon Dioxide Emission Reduction through Cleaner Production Strategies in a Recycled Plastic Resins Producing Plant. J. Clean. Prod. 2017, 141, 1067–1073. [Google Scholar] [CrossRef]
- Weldekidan, H.; Mohanty, A.K.; Misra, M. Upcycling of Plastic Wastes and Biomass for Sustainable Graphitic Carbon Production: A Critical Review. ACS Environ. Au 2022, 2, 510–522. [Google Scholar] [CrossRef]
- Zibunas, C.; Meys, R.; Kätelhön, A.; Bardow, A. Cost-Optimal Pathways towards Net-Zero Chemicals and Plastics Based on a Circular Carbon Economy. Comput. Chem. Eng. 2022, 162, 107798. [Google Scholar] [CrossRef]
- ESG Investing Waste and Opportunity: How to Capitalize on Plastics. Available online: https://www.esginvesting.co.uk/waste-and-opportunity-how-to-capitalize-on-plastics/ (accessed on 22 July 2023).
- Renewable Energy Institute Renewable Energy Surcharges to Decrease Significantly with Lower FIT Purchase Prices and Higher Wholesale Market Prices. Available online: https://www.renewable-ei.org/en/activities/column/REupdate/20230627.php (accessed on 4 July 2023).
- The Federation of Electric Power Companies of Japan. 2023. Available online: https://www.fepc.or.jp/english/library/electricity_eview_japan/__icsFiles/afieldfile/2023/04/06/electricity_2023.pdf (accessed on 21 July 2023).
- ICAP. ICAP Status Report 2023. 2023. Available online: https://icapcarbonaction.com/system/files/document/ICAPEmissionsTradingWorldwide2023StatusReport_0.pdf (accessed on 6 July 2023).
- Arimura, T.H.; Abe, T. The Impact of the Tokyo Emissions Trading Scheme on Office Buildings: What Factor Contributed to the Emission Reduction? Environ. Econ. Policy Stud. 2021, 23, 517–533. [Google Scholar] [CrossRef]
- Mizuho Research and Technologies Ltd. About the J-Credit Scheme (Data Collection). 2023. Available online: https://japancredit.go.jp/data/pdf/credit_002.pdf (accessed on 21 July 2023).
- Government of Japan. Basic Hydrogen Strategy, Ministerial Council on Renewable Energy, Hydrogen and Related Issues. 2017. pp. 1–37. Available online: http://www.meti.go.jp/english/press/2017/pdf/1226_003b.pdf (accessed on 22 July 2023).
- Nagashima, M. Japan’s Hydrogen Strategy and Its Economic and Geopolitical Implications; Etudes de L’Ifri: Paris, France, 2018; ISBN 9782365679183. Available online: https://www.ifri.org/sites/default/files/atoms/files/nagashima_japan_hydrogen_2018_.pdf (accessed on 27 July 2023).
- World Nuclear Association Comparison of Lifecycle Greenhouse Gas Emissions of Various Electricity Generation Sources. 2011. Available online: https://www.world-nuclear.org/uploadedfiles/org/wna/publications/working_group_reports/comparison_of_lifecycle.pdf (accessed on 24 July 2023).
- Wang, L.; Wei, Y.M.; Brown, M.A. Global Transition to Low-Carbon Electricity: A Bibliometric Analysis. Appl. Energy 2017, 205, 57–68. [Google Scholar] [CrossRef]
- Osawa, J. Portfolio Analysis of Clean Energy Vehicles in Japan Considering Copper Recycling. Sustainability 2023, 15, 2113. [Google Scholar] [CrossRef]
- Kagawa, S.; Goto, Y.; Suh, S.; Nansai, K.; Kudoh, Y. Accounting for Changes in Automobile Gasoline Consumption in Japan: 2000–2007. J. Econ. Struct. 2012, 1, 1–27. [Google Scholar] [CrossRef]
- Renewable Energy Institute EV Uptake Trends and Future Prospects. 2018. Available online: https://www.renewable-ei.org/activities/reports/img/pdf/20180627/REI_EVreport_20180627.pdf (accessed on 25 July 2023).
- Next Generation Vehicle Promotion Center EV Subsidies by Vehicle Type in Japan. Available online: https://www.cev-pc.or.jp/hojo/pdf/R4ho/R4ho_meigaragotojougen.pdf (accessed on 25 July 2023).
- Yang, Z.; Wang, B.; Jiao, K. Life Cycle Assessment of Fuel Cell, Electric and Internal Combustion Engine Vehicles under Different Fuel Scenarios and Driving Mileages in China. Energy 2020, 198, 117365. [Google Scholar] [CrossRef]
- Plastics Europe. Eco-Profiles. 2023. Available online: https://legacy.plasticseurope.org/en/resources/eco-profiles (accessed on 7 May 2023).
- Nikkei Newspaper. Plastics, Resins, Lactates, Cardboard Monthly Prices. 2023. Available online: http://shuyousoubamonthly.sblo.jp/category/4476438-1.html (accessed on 20 July 2023).
- Prototype Factory Watanabe Resin Prices and Heat Resistance. Available online: https://www.watanabe-mfg.co.jp/2016/07/post-1007/staffblog/ (accessed on 20 July 2023).
- RepetCo. Main Types of Plastics by Use and Recycling Tolerance. 2022. Available online: https://www.repetco.com/main-types-of-plastics-by-use-and-recycling-tolerance/ (accessed on 20 July 2023).
- Naderi Kalali, E.; Lotfian, S.; Entezar Shabestari, M.; Khayatzadeh, S.; Zhao, C.; Yazdani Nezhad, H. A Critical Review of the Current Progress of Plastic Waste Recycling Technology in Structural Materials. Curr. Opin. Green Sustain. Chem. 2023, 40, 100763. [Google Scholar] [CrossRef]
- Tan, M.H.; Chiong, M.S.; Chun, Y.Y.; Tsukahara, K.; Tahara, K. An Analysis of Practices and Challenges for Plastic Recycling Industry in Malaysia. Int. J. Autom. Technol. 2022, 16, 831–837. [Google Scholar] [CrossRef]
- Tsuchimoto, I.; Kajikawa, Y. Recycling of Plastic Waste: A Systematic Review Using Bibliometric Analysis. Sustainability 2022, 14, 16340. [Google Scholar] [CrossRef]
- Costa, A.A.; Martinho, P.G.; Barreiros, F.M. Comparison between the Mechanical Recycling Behaviour of Amorphous and Semicrystalline Polymers: A Case Study. Recycling 2023, 8, 12. [Google Scholar] [CrossRef]
- Zhou, X.; Zhai, Y.; Ren, K.; Cheng, Z.; Shen, X.; Zhang, T.; Bai, Y.; Jia, Y.; Hong, J. Life Cycle Assessment of Polycarbonate Production: Proposed Optimization toward Sustainability. Resour. Conserv. Recycl. 2023, 189, 106765. [Google Scholar] [CrossRef]
- Franklin Associates. Life Cycle Impacts for Postconsumer Recycled Resins: PET, HDPE, and PP. Submitted to The Association of Plastic Recyclers (APR). 2018. Available online: https://plasticsrecycling.org/images/library/2018-APR-LCI-report.pdf (accessed on 4 July 2023).
- The Association of Plastic Recyclers (APR); Franklin Associates. Virgin vs. Recycled Plastic Life Cycle Assessment Energy Profile and Life Cycle Assessment Environmental Burdens. 2020. Available online: https://plasticsrecycling.org/images/library/APR-Recycled-vs-Virgin-May2020.pdf (accessed on 4 July 2023).
- ChemAnalyst Chemical Price List. Available online: https://www.chemanalyst.com/Pricing/Pricingoverview (accessed on 2 July 2023).
- Plasticker Raw Materials & Prices. Available online: https://plasticker.de/preise/preise_monat_single_en.php (accessed on 2 July 2023).
- Siracusa, V.; Blanco, I. Bio-Polyethylene (Bio-PE), Bio-Polypropylene (Bio-PP) and Bio-Poly(Ethylene Terephthalate) (Bio-PET): Recent Developments in Bio-Based Polymers Analogous to Petroleum-Derived Ones for Packaging and Engineering Applications. Polymers 2020, 12, 5029. [Google Scholar] [CrossRef]
- Ma, Z.; Weersink, A.; Vadori, R.; Misra, M. Financial Cost Comparison of Acrylonitrile Butadiene Styrene (ABS) and BioABS. J. Biobased Mater. Bioenergy 2015, 9, 244–251. [Google Scholar] [CrossRef]
- Zorko, D.; Demšar, I.; Tavčar, J. An Investigation on the Potential of Bio-Based Polymers for Use in Polymer Gear Transmissions. Polym. Test. 2021, 93, 106994. [Google Scholar] [CrossRef]
- Brizga, J.; Hubacek, K.; Feng, K. The Unintended Side Effects of Bioplastics: Carbon, Land, and Water Footprints. One Earth 2020, 3, 45–53. [Google Scholar] [CrossRef]
- Lamberti, F.M.; Román-Ramírez, L.A.; Wood, J. Recycling of Bioplastics: Routes and Benefits. J. Polym. Environ. 2020, 28, 2551–2571. [Google Scholar] [CrossRef]
- Alaerts, L.; Augustinus, M.; Van Acker, K. Impact of Bio-Based Plastics on Current Recycling of Plastics. Sustainability 2018, 10, 1487. [Google Scholar] [CrossRef]
- ISO Central Secretariat. Environmental Management: The ISO 14000 Family of International Standards. 2009. Available online: https://www.iso.org/files/live/sites/isoorg/files/archive/pdf/en/theiso14000family_2009.pdf (accessed on 30 August 2023).
- Karbasioun, M.; Gholamalipour, A.; Safaie, N.; Shirazizadeh, R.; Amidpour, M. Developing Sustainable Power Systems by Evaluating Techno-Economic, Environmental, and Social Indicators from a System Dynamics Approach. Util. Policy 2023, 82, 101566. [Google Scholar] [CrossRef]
- Government of Japan. Roadmap for Bioplastics Introduction. 2021. Available online: https://www.env.go.jp/recycle/mat21030210_1.pdf (accessed on 5 July 2023).
- Chang, C.; McAleer, M. Modeling Latent Carbon Emission Prices for Japan: Theory and Practice. Energies 2019, 12, 4222. [Google Scholar] [CrossRef]
- Meyer, M.; Löschel, A.; Lutz, C. Carbon Price Dynamics in Ambitious Climate Mitigation Scenarios: An Analysis Based on the Iamc 1.5°c Scenario Explorer. Environ. Res. Commun. 2021, 3, 081007. [Google Scholar] [CrossRef]
- Findrik, E.; Meixner, O. Drivers and Barriers for Consumers Purchasing Bioplastics—A Systematic Literature Review. J. Clean. Prod. 2023, 410, 137311. [Google Scholar] [CrossRef]
- Zwicker, M.V.; Brick, C.; Gruter, G.J.M.; van Harreveld, F. (Not) Doing the Right Things for the Wrong Reasons: An Investigation of Consumer Attitudes, Perceptions, and Willingness to Pay for Bio-Based Plastics. Sustainability 2021, 13, 6819. [Google Scholar] [CrossRef]
- Nature Research. Focal Point on Bioplastics in Japan. 2023. Available online: https://www.nature.com/articles/d42473-023-00020-z (accessed on 7 August 2023).
Disclaimer/Publisher’s Note: The statements, opinions and data contained in all publications are solely those of the individual author(s) and contributor(s) and not of MDPI and/or the editor(s). MDPI and/or the editor(s) disclaim responsibility for any injury to people or property resulting from any ideas, methods, instructions or products referred to in the content. |
© 2023 by the authors. Licensee MDPI, Basel, Switzerland. This article is an open access article distributed under the terms and conditions of the Creative Commons Attribution (CC BY) license (https://creativecommons.org/licenses/by/4.0/).