Abstract
The Yangtze River Delta Urban Agglomeration (YRDUA) is the core area for the development of China’s digital economy. This paper constructed a five-dimensional evaluation index system and measured the digital economy development level of the YRDUA. A modified gravity model social network analysis was applied to analyze the structure of the digital economy network. The results show that (1) the level of digital economy in the YRDUA has increased during 2011–2021, with Hangzhou having the highest digital economy development level of 0.513 in 2021. (2) The digital economy network density of the YRDUA increased from 0.155 in 2011 to 0.158 in 2016, and then decreased to 0.151 in 2021, showing an “inverted U-shaped” trend of first increasing and then decreasing. (3) Shanghai, Suzhou, Nanjing, Hangzhou, and Wuxi play the role of “bridge” in the digital economy network, and the pattern of linkage development of neighboring cities driven by the central cities of Shanghai, Nanjing, Suzhou, Hangzhou, Ningbo, and Hefei has basically formed. These findings of the study provide data support and reference for the coordinated development of the digital economy in the YRDUA and are of theoretical and practical significance for the synergistic development of cities.
1. Introduction
In the era of information, the continuous development and widespread application of information technology have given rise to the digital economy. Since the concept of “digital economy” was first proposed in 2017 in China, digitization has been introduced as a new production factor into various stages of production [1]. According to the data in the “White Paper on the Development of China’s Digital Economy”, the size of China’s digital economy was only 9.5 trillion yuan in 2011, while it has risen to 45.5 trillion yuan in 2021, accounting for a proportion of 39.8% of GDP. It is gradually becoming an important driving force and essential pillar of our national economy [2]. The development of the digital economy has become an important strategy for driving economic growth in countries around the world and a key element in building a new domestic and international dual-circulation development paradigm [3,4]. In this context, quantitative research on the level of development of the digital economy helps to reveal new opportunities for the high-speed development of the digital economy and provides empirical evidence to promote economic transformation and upgrading.
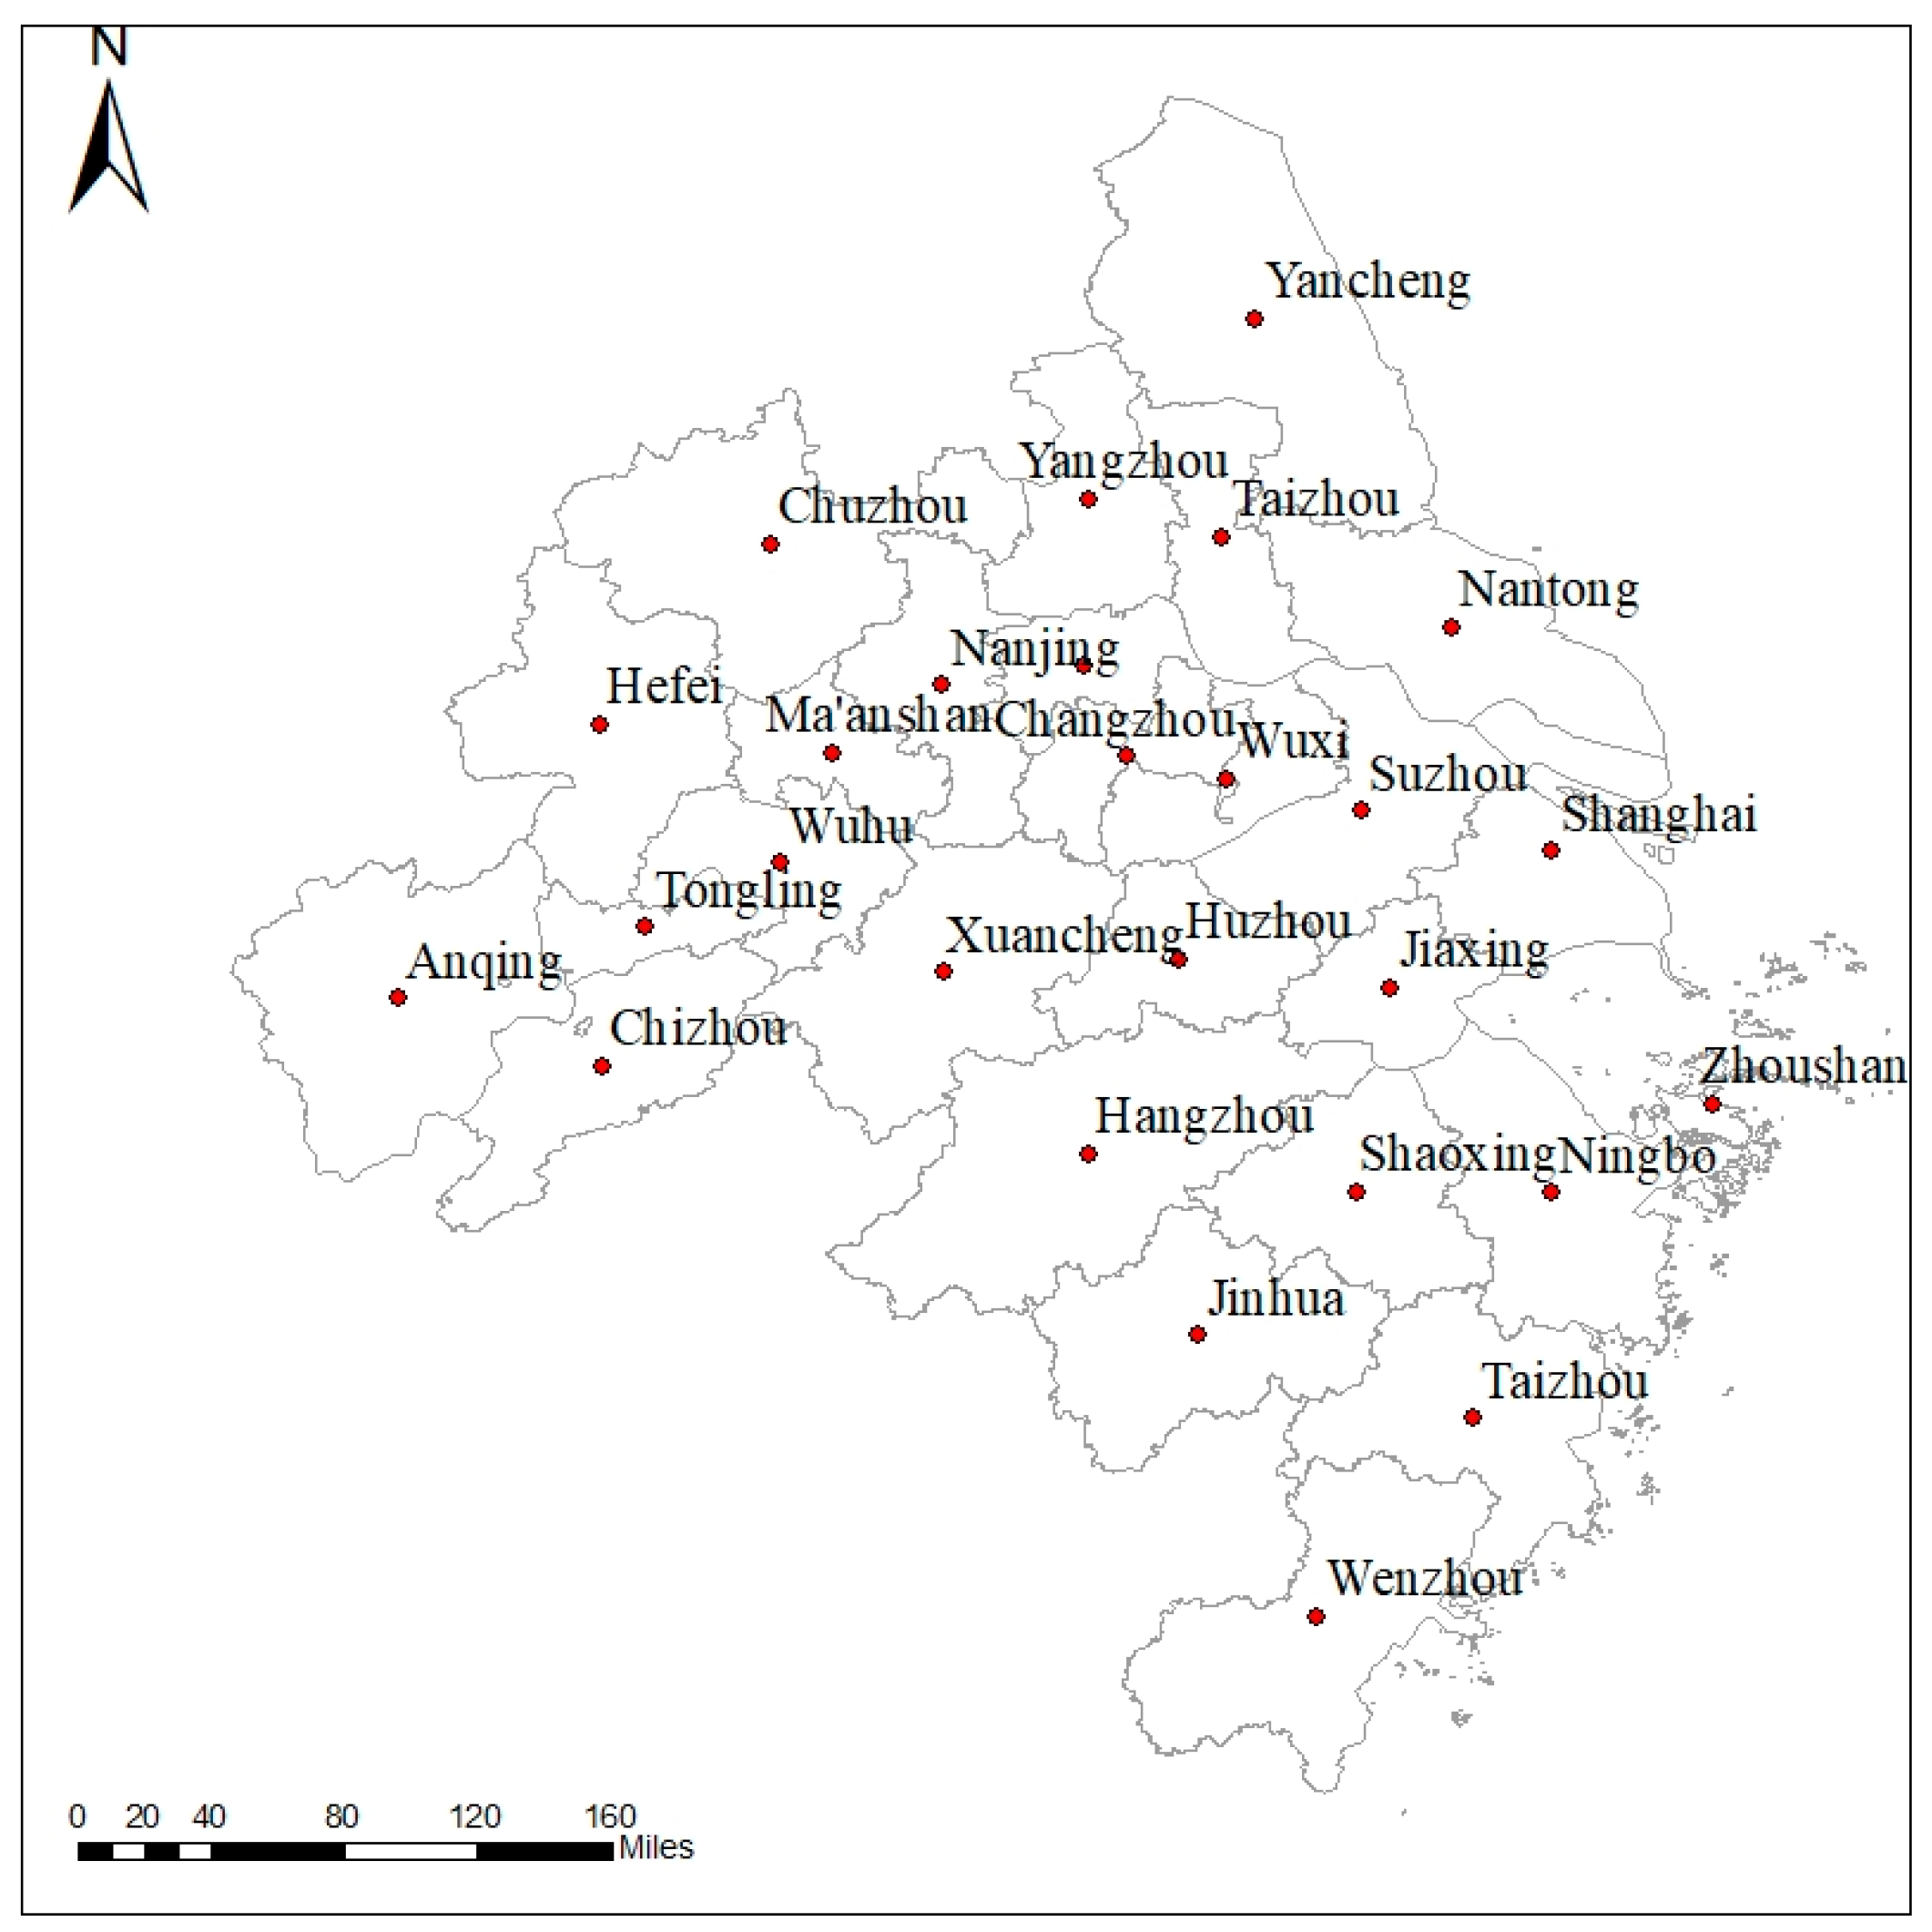
As one of the key strongholds for the development of China’s digital economy, the YRDUA boasts mature foundations and conditions. With its robust digital infrastructure and talent resources, it serves as the core hub of China’s digital economy network, playing a crucial role in the overall national development strategy [5]. The YRDUA consists of 27 cities: Shanghai, Nanjing, Wuxi, Changzhou, Suzhou, Nantong, Yancheng, Yangzhou, Zhenjiang and Taizhou in Jiangsu Province, Hangzhou, Ningbo, Wenzhou, Jiaxing, Huzhou, Shaoxing, Jinhua, Zhoushan, and Taizhou in Zhejiang Province, and Hefei, Wuhu, Ma’anshan, Tongling, Anqing, Chuzhou, Chizhou, and Xuancheng in Anhui Province, as shown in Figure 1. The industrial growth of cities in the YRDUA is crucial for advancing the high-quality development of China’s economy [6]. Therefore, it is of theoretical significance and practical value to explore the level of digital economy development and its spatial correlation by taking the YRDUA as a sample. In existing research on the digital economy, most scholars have explored the level of digital economy development at the provincial level and the spatial correlation of provincial digital economy development, while there is relatively little research on the digital economy at the urban level. Although there is less literature that focuses on the digital economy at the urban level, the digital economy indicators in the literature are of a single respect and do not fully consider the factors that affect the development of the digital economy. Therefore, from multiple perspectives, constructing a digital economy indicator system for the YRDUA can help to comprehensively evaluate the level of digital economy development in the YRDUA.
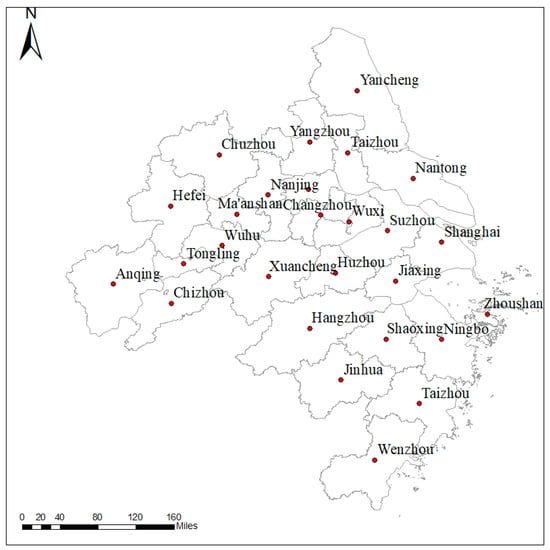
Figure 1.
Location of the YRDUA.
The digital economy network in the YRDUA has had significant impacts on the economy and society. The digital economy can speed up the flow of information and other factors between regions by eliminating the location barriers between cities, thus improving regional integration [7]. In terms of exploring the evolution characteristics of networks, the social network analysis method, SNA, can effectively quantify spatial relationships and reveal the associated characteristics of spatial networks, making it the most commonly used method in spatial network analysis. The gravity model is a widely used spatial interaction model to analyze and predict the forms of spatial interactions. Combining the gravity model with a social network analysis can quantitatively analyze the evolution characteristics of networks through both overall network indicators and individual network indicators, which has been the most popular research method in recent years. Applying this method to the analysis of the spatial network correlation of digital economy can reveal the digital economy correlation between cities in the YRDUA. Based on the existing research, this study attempts to measure the development level of the digital economy in various cities of the YRDUA and explores the spatial network correlation of the digital economy in the YRDUA by constructing a spatial network model.
2. Literature Review
The digital economy is a new form of economy characterized by digitization, driven by information technology, and focused on improving total factor productivity. In 1996, Tapscott first introduced the concept of the “digital economy” and defined it as a new economy based on human intelligence networks enabled by the internet and the world wide web [8]. The definition of the digital economy also evolves with technological trends and era-specific characteristics [9,10,11,12,13,14,15]. As the digital economy has grown, measuring its development level has drawn the attention of scholars. In terms of the digital economy index, Xian et al. proposed a measurement index system for the digital economy [16]. This index system was used to assess and forecast the scale of core industries in China’s digital economy. Based on the penetrability, substitutability, and synergistic characteristics of digital technologies, Cai et al. divided the digital economy into two parts, namely “digital industrialization” and “industrial digitalization”. Using empirical research analysis methods, they measured the scale of value added in China’s digital economy [17]. Chen et al. took into account the national economic industry classification and designed a classification system to measure the scale of China’s digital economy from 2012 to 2017 [18]. Wang utilized machine-learning algorithms to assess the development level of the digital economy in Shaanxi Province [19]. Most of the above literature uses the subjective expert scoring method or the single objective weighting method when determining the weights of the indicators, which makes it difficult to reflect the weights of the indicators objectively and comprehensively. Moreover, most of the studies are based on China’s provincial data, and the literature is a single digital economy indicator without comprehensively considering the factors affecting the development of the digital economy.
Most of the studies on the spatial structure of the digital economy have explored the spatial differentiation characteristics of regional digital economy development in terms of geographic or economic neighborhood characteristics. For example, Wang et al., based on the Tencent Research Institute’s published Digital Economy Index, analyzed the spatial differentiation characteristics of China’s digital economy using methods such as interpolation simulation, Zipf’s law, and geographic detector methods [20]. Chen et al. used nighttime light (NTL) remote-sensing data to estimate the digital economy level and analyze the spatial characteristics of Chinese cities from 2017 to 2020 [21]. Luo and Zhou conducted an analysis of the dynamic evolution, spatial differences, and driving factors of the provincial level digital economy in China from 2011 to 2020 using spatial Markov chains, the Gini coefficient, and geographic detection methods [22]. Li and Liu used the entropy method to measure the development level of the digital economy in various regions of China in 2018. They used exploratory spatial data analysis (ESDA) and geographically weighted regression (GWR) models to analyze the spatial distribution pattern of China’s digital economy and its influencing factors [23]. These studies above mainly use methods such as geographic detector methods, Markov chains, Gini coefficients, and other spatial characterization, which mainly reflect the characteristics of spatial changes in the research object and cannot reflect spatial network relationships. A few scholars have analyzed the spatial network linkages of the digital economy from the perspective of spatial linkages. For example, Zhao et al. investigated the spatial linkage structure of digital economy development among provinces by using the digital economy value added and digital economy industry revenue. They employed the modified gravity model and social network analysis to examine the spatial relationship in the development of the digital economy [24]. Zhong et al. employed the Getis–Ord G index to analyze the spatial agglomeration characteristics of digital economy development in 125 cities in 2016 and examined the hotspots and coldspots of digital economy development in the region [25]. Applying the spatial network analysis method to the analysis of the digital economy can explore the spatial network characteristics of the digital economy. In addition, the analysis of spatial network characteristics of the digital economy over multiple years can reveal the time-evolution characteristics of spatial network correlation. Most of the existing studies on the spatial network association of digital economy in the YRDUA focus on the spatial characteristics of a certain year, which has some limitations in reflecting the temporal trends of the spatial network.
The above-mentioned deficiencies motivate this research. Apart from previous studies, this study contributes to the existing literature in the following ways: (1) we constructed an evaluation index system for the digital economy development level of the YRDUA in five dimensions: digital infrastructure, digital industry development, digital human resources, digital innovation ability, and digitalization degree. Compared with existing studies, the design of this system not only helps to enrich the relevant theoretical basis but also can take into account multiple aspects of the development of the digital economy in a more comprehensive way during the assessment process, thus ensuring that the evaluation results are more comprehensive and objective. (2) We used the entropy weight method and coefficient of variation method to assign weights to the indicators, which eliminates the one-sidedness and bias that may be brought by the traditional subjective assignment method and more objectively calculates the weights of the indicators to measure the digital economy development index of the YRDUA. This index can more accurately reflect the overall development of the digital economy in the YRDUA, reveal the strengths and shortcomings of each city, and provide a more valuable reference basis for policy formulation and resource allocation in the field of digital economy in the YRDUA. (3) By using the modified gravity model and social network analysis method, an empirical analysis was conducted on the structure of the digital economy network in the YRDUA. Spatial network correlation and time spatial evolution characteristics of the digital economy in the YRDUA were investigated. These investigations not only enrich the theory of the digital economy–spatial correlation relationship but also provide important data support and guidance for the development of the digital economy in the YRDUA, and promote the implementation of the strategy of coordinated regional development.
3. Methodology
3.1. Digital Economy Indicator System and Measurement Method
The existing research mainly comes from the provincial level in China. For example, by using data from 30 Chinese provinces for the period of 2015–2018, Liu et al. measured the digital economy of China’s digital economy at a provincial level [26]. Liu et al. developed a provincial level evaluation index system for the development of the digital economy in four dimensions: digital infrastructure, digital industry, usage and application level, and digital innovation capability [27].
Based on the existing literature, a comprehensive digital economy development index system is built in this paper taking into account the availability of relevant data at the city level. It includes the five dimensions of digital infrastructure, digital industry development, digital human resources, digital innovation capability, and digitization as well as a subdivision of 13 indicators, as shown in Table 1. The indicators in the digital infrastructure dimension include broadband internet infrastructure and mobile internet infrastructure. The development of digital industry comprises two subindicators: the proportion of telecommunications industry output to GDP and the proportion of postal service output to GDP. Digital human resources include manpower in the information industry and the foundation of human resources. Digital innovation capability comprises the support of digital innovation elements and the level of digital innovation output. Digital inclusive finance reflects the degree of urban digitization.

Table 1.
Digital Economy Development Index System for YRDUA.
To overcome subjectivity and objectively determine the relative weights of the indexes, this paper uses the entropy weight method and coefficient of variation method to assign weights to each index in order to measure the digital development level economy in the YRDUA [28]. The specific steps are as follows:
- Data standardization
The dimensionless processing of indicators can improve the comparability between different indicators and enhance the rationality of evaluation. Therefore, this study standardizes the data through the extreme value method, as shown in Equation (1)
where is the index of the jth indicator for the ith city, , ;
- 2.
- Calculate information entropy.
First, we use standardized data to calculate the proportion of index j in the total value of all regional indexes, as shown in Equation (3). Then, the information entropy of index j in the ith area can be calculated by using Equation (4).
- 3.
- Calculate the coefficient of variation.
The coefficient of variation for indicator j is calculated using the Equation (5):
- 4.
- Calculate the weight of each indicator.
The coefficients of variation should be normalized to calculate the weights of each indicator, as shown in Equation (6).
- 5.
- Calculate the digital economy development level.
The comprehensive score of the digital economy development level of the 27 cities in the YRDUA is calculated with the following equation:
3.2. The Modified Gravity Model
The gravity model, based on the formula of gravitation in physics, has been widely employed to measure the special relevancy [29,30]. Therefore, this paper introduces a modified gravity model to explore the spatial association of the digital economy in the YRDUA. In addition, considering that regional GDP can reflect the differences in the economic structure of cities to a certain extent, the ratio of geographical distance to the difference in city GDP is used as the economic geographical distance, and the traditional gravity model is modified to construct a gravity matrix to describe the strength of digital economic linkages between cities. The modified gravity model is shown in Equation (8).
where is the gravitational strength of the digital economy between city i and city j. k is the modified gravitational constant. , are the digital economy development levels of region i and region j, respectively. is the distance between cities i and j. r is the friction coefficient of distance, usually set to 2. , represent the GDP of city i and city j, respectively. In order to eliminate weak correlations and simplify the overall network distribution, this paper uses the mean value of the digital economy gravitational force from 2011 to 2021 as the threshold value and then binarizes the gravitational matrix before proceeding to the next step of social network analysis.
3.3. Social Network Analysis
Social network analysis (SNA) is an important method in social sciences for studying the relationships between actors [31,32]. It utilizes graph theory and algebraic modeling techniques to describe relationship patterns and investigate their impact on individuals or the overall structure. This method is particularly suitable for studying interactive relationships and group structures within a population. In the context of studying city-cluster networks, social network analysis provides valuable tools. By applying network analysis methods and utilizing appropriate software, it becomes possible to improve the city-cluster network structure in a more intuitive and controllable manner. Furthermore, the effects of these improvements can be quantitatively evaluated and measured with greater clarity.
- (1)
- Network density reflects the level of connectivity among nodes in a network. The density value not only represents the overall influence of the network on individual members within the network but also reflects the mutual influence among individuals within the network [24]. A higher network density indicates a greater likelihood of network influence on members and a closer relationship between network members;
- (2)
- Network characteristics of nodes. According to social network analysis, the network structure characteristics of nodes can be characterized using metrics such as degree centrality, betweenness centrality, and closeness centrality. Degree centrality measures the centrality of nodes within a spatially correlated network based on the number of connections. A higher degree of centrality indicates that a node has more connections with other nodes in the spatial economic network, indicating a greater degree of centrality for that node within the network. Betweenness centrality reflects the level of interaction and the intermediary role of a node with respect to other nodes. A higher betweenness centrality suggests stronger interaction between the city and other cities, along with a greater ability to control resources. Closeness centrality measures the degree to which a node is not controlled by other nodes in the network. A higher closeness centrality value indicates more direct connections between the node and other nodes [25];
- (3)
- Cohesive group. Cohesive group analysis aims to reveal the phenomenon of small group clustering within the digital economic network. Nodes within a cohesive group exhibit relatively strong spatial relationships and direct closeness.
4. Empirical Analysis
4.1. The Development Level of Digital Economy in the YRDUA
The research object of this paper is the 27 cities in the YRDUA. Based on the evaluation index system of digital economy development level, we use the entropy value method to measure the digital economy development level of 27 cities in the YRDUA from 2011 to 2021, and the results are shown in Table 2. From the comprehensive digital economy scores of the cities in each YRDUA listed in Table 2, the development of the digital economy in the YRDUA was at a relatively low level in 2011 and there was little difference in the development level between the cities. Shanghai, Hangzhou, Wenzhou, and Jinhua were among them, scoring higher than other cities and in the top four. Between 2011 and 2016, the overall digital economy development level of cities in the YRDUA has steadily improved, from a low level in 2011 to a medium-low level. Meanwhile, the gap in development levels across cities has continuously grown. Five cities, Shanghai, Hangzhou, Wenzhou, Nanjing, Hefei, and Wuhu, are among the top five cities in the YRDUA with digital economy development levels over 0.3. From 2016 to 2021, the digital economy development level in the YRDUA further improved, with several cities reaching a medium-high development level. Among them, Hangzhou showed outstanding progress in digital economy development and surpassed Shanghai in 2021 to become the city with the highest level of digital economy in the YRDUA, injecting strong momentum into the digital economy development of the region. However, there were still some cities at a relatively low level of development, leading to further disparities in development levels among cities.
Table 2.
Digital Economy Development Level of YRDUA.
4.2. Spatial Association of Digital Economy
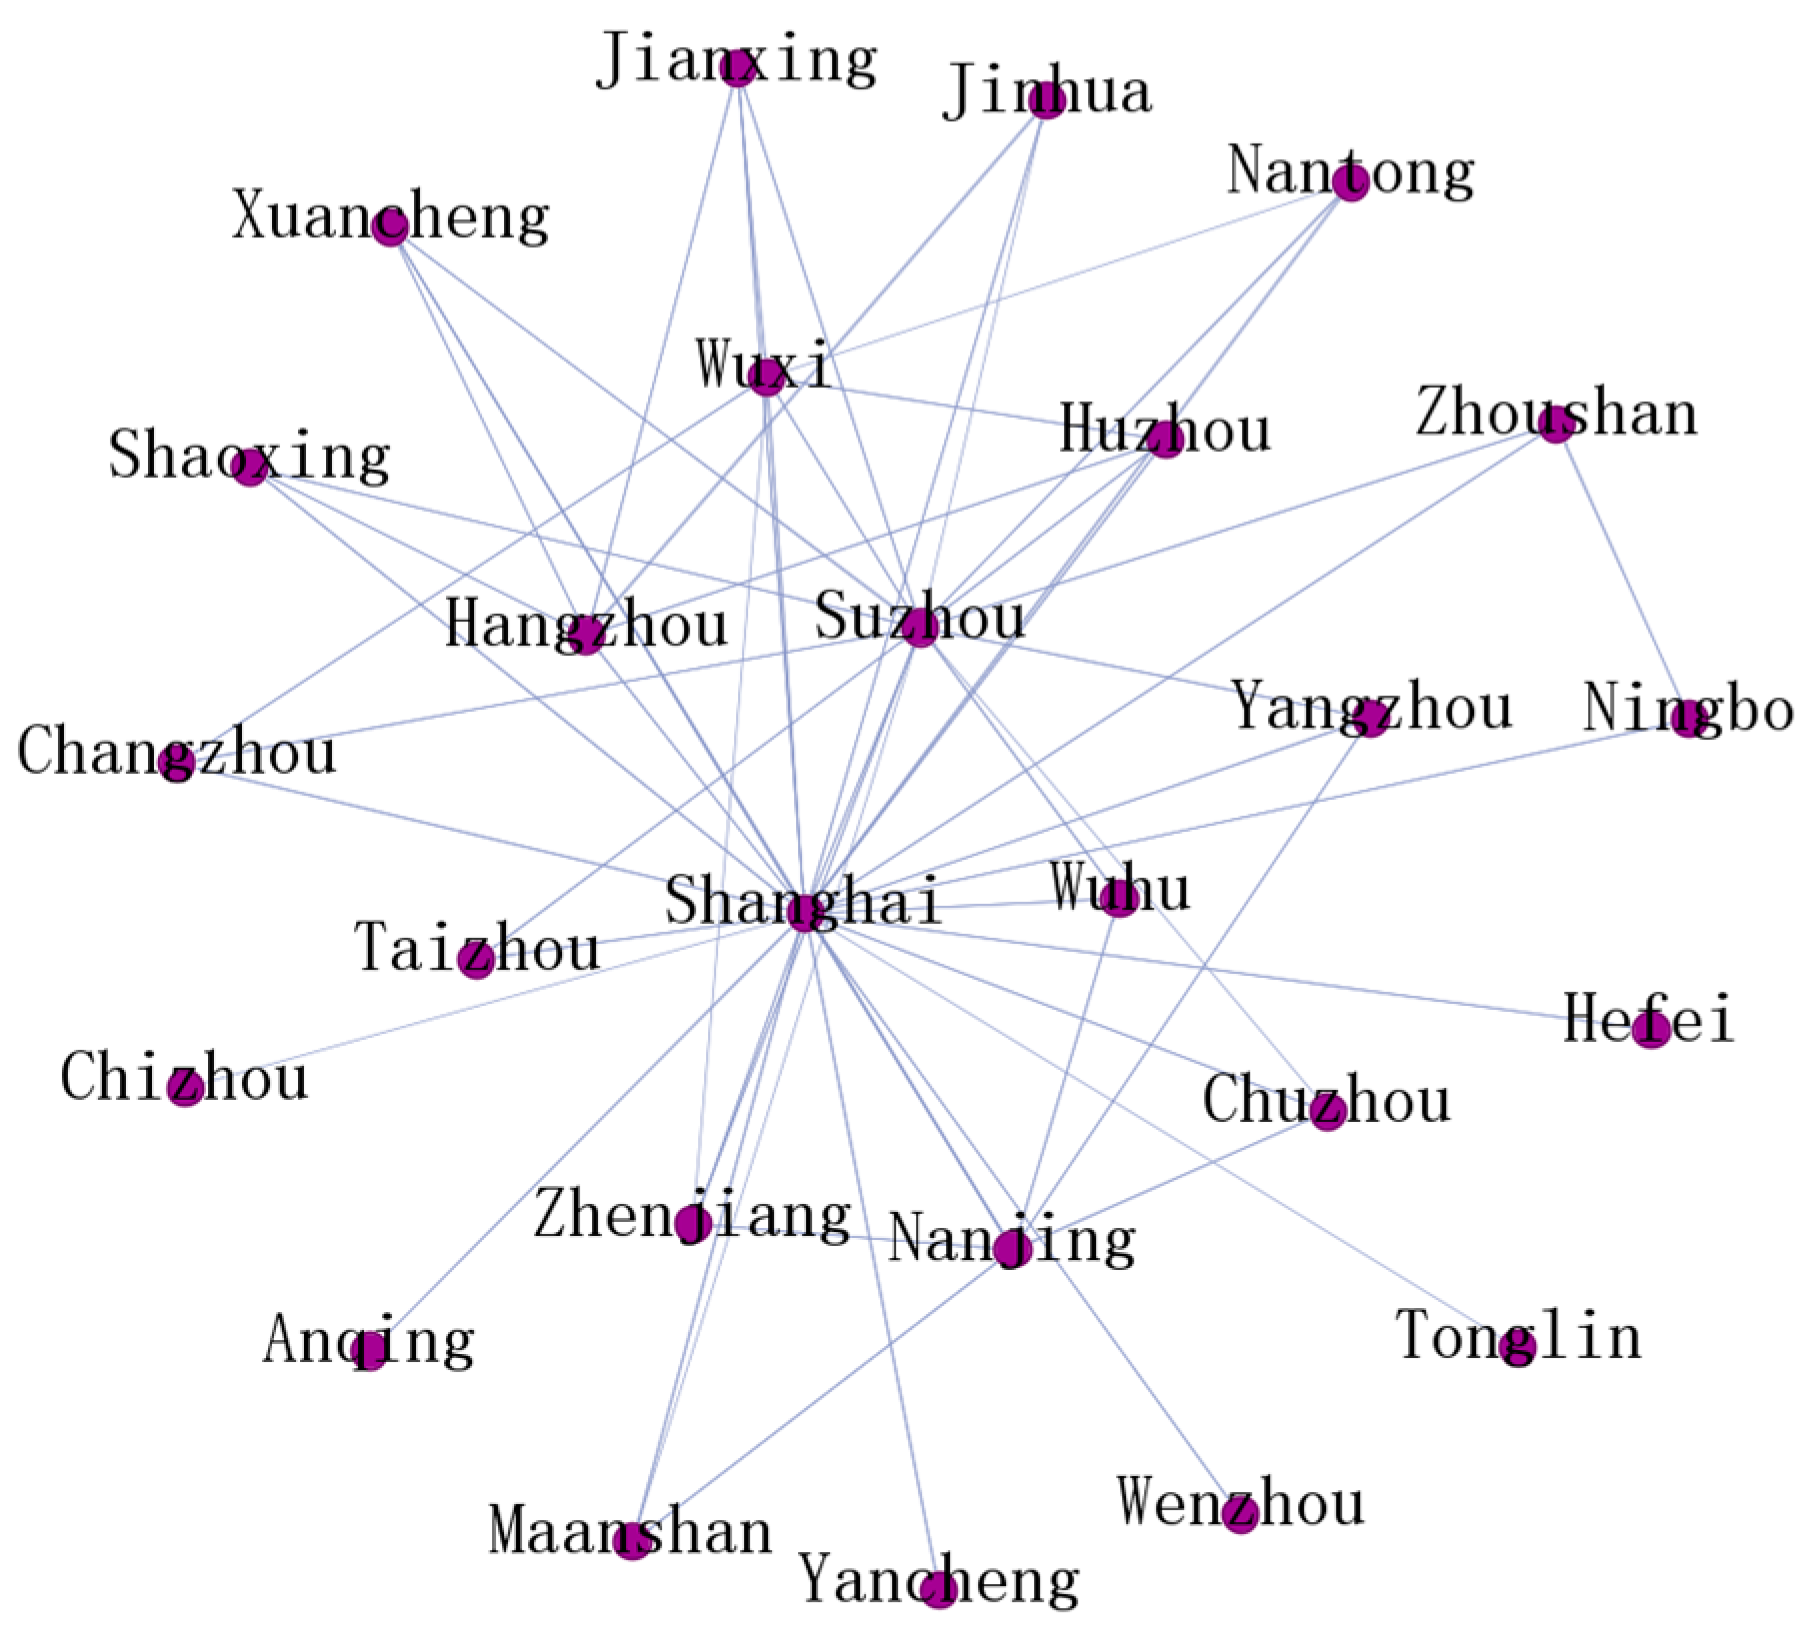
Based on the development level of the digital economy in the YRDUA, this study selects three time points, 2011, 2016, and 2021, to analyze the spatial network association and evolutionary trend of the digital economy in the YRDUA through a gravity model and a social network analysis, and the spatial network figures of the YRDUA in 2011, 2016 and 2021 can be obtained by using the UCINE 6.8 software, as shown in Figure 2, Figure 3 and Figure 4.
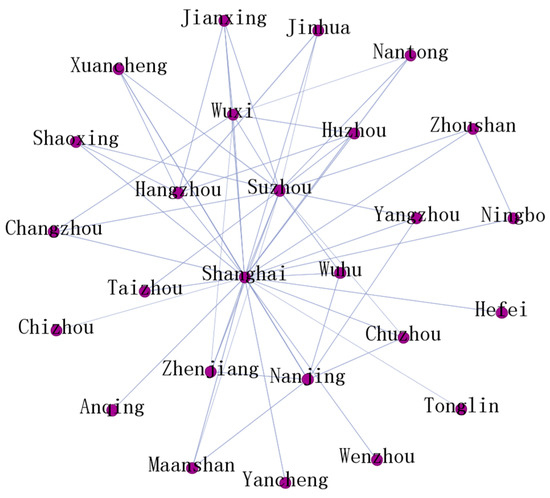
Figure 2.
Digital Economy Network of the YRDUA in 2011.
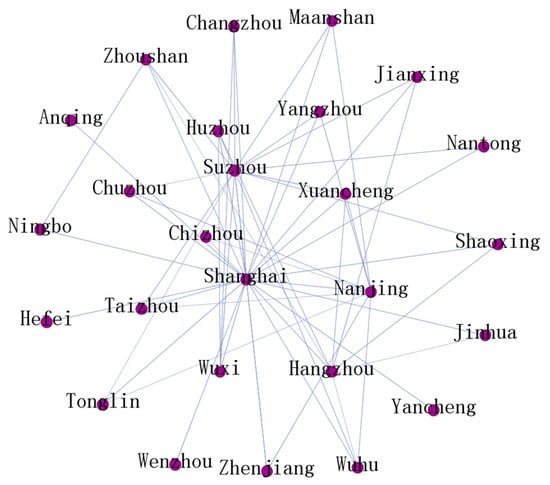
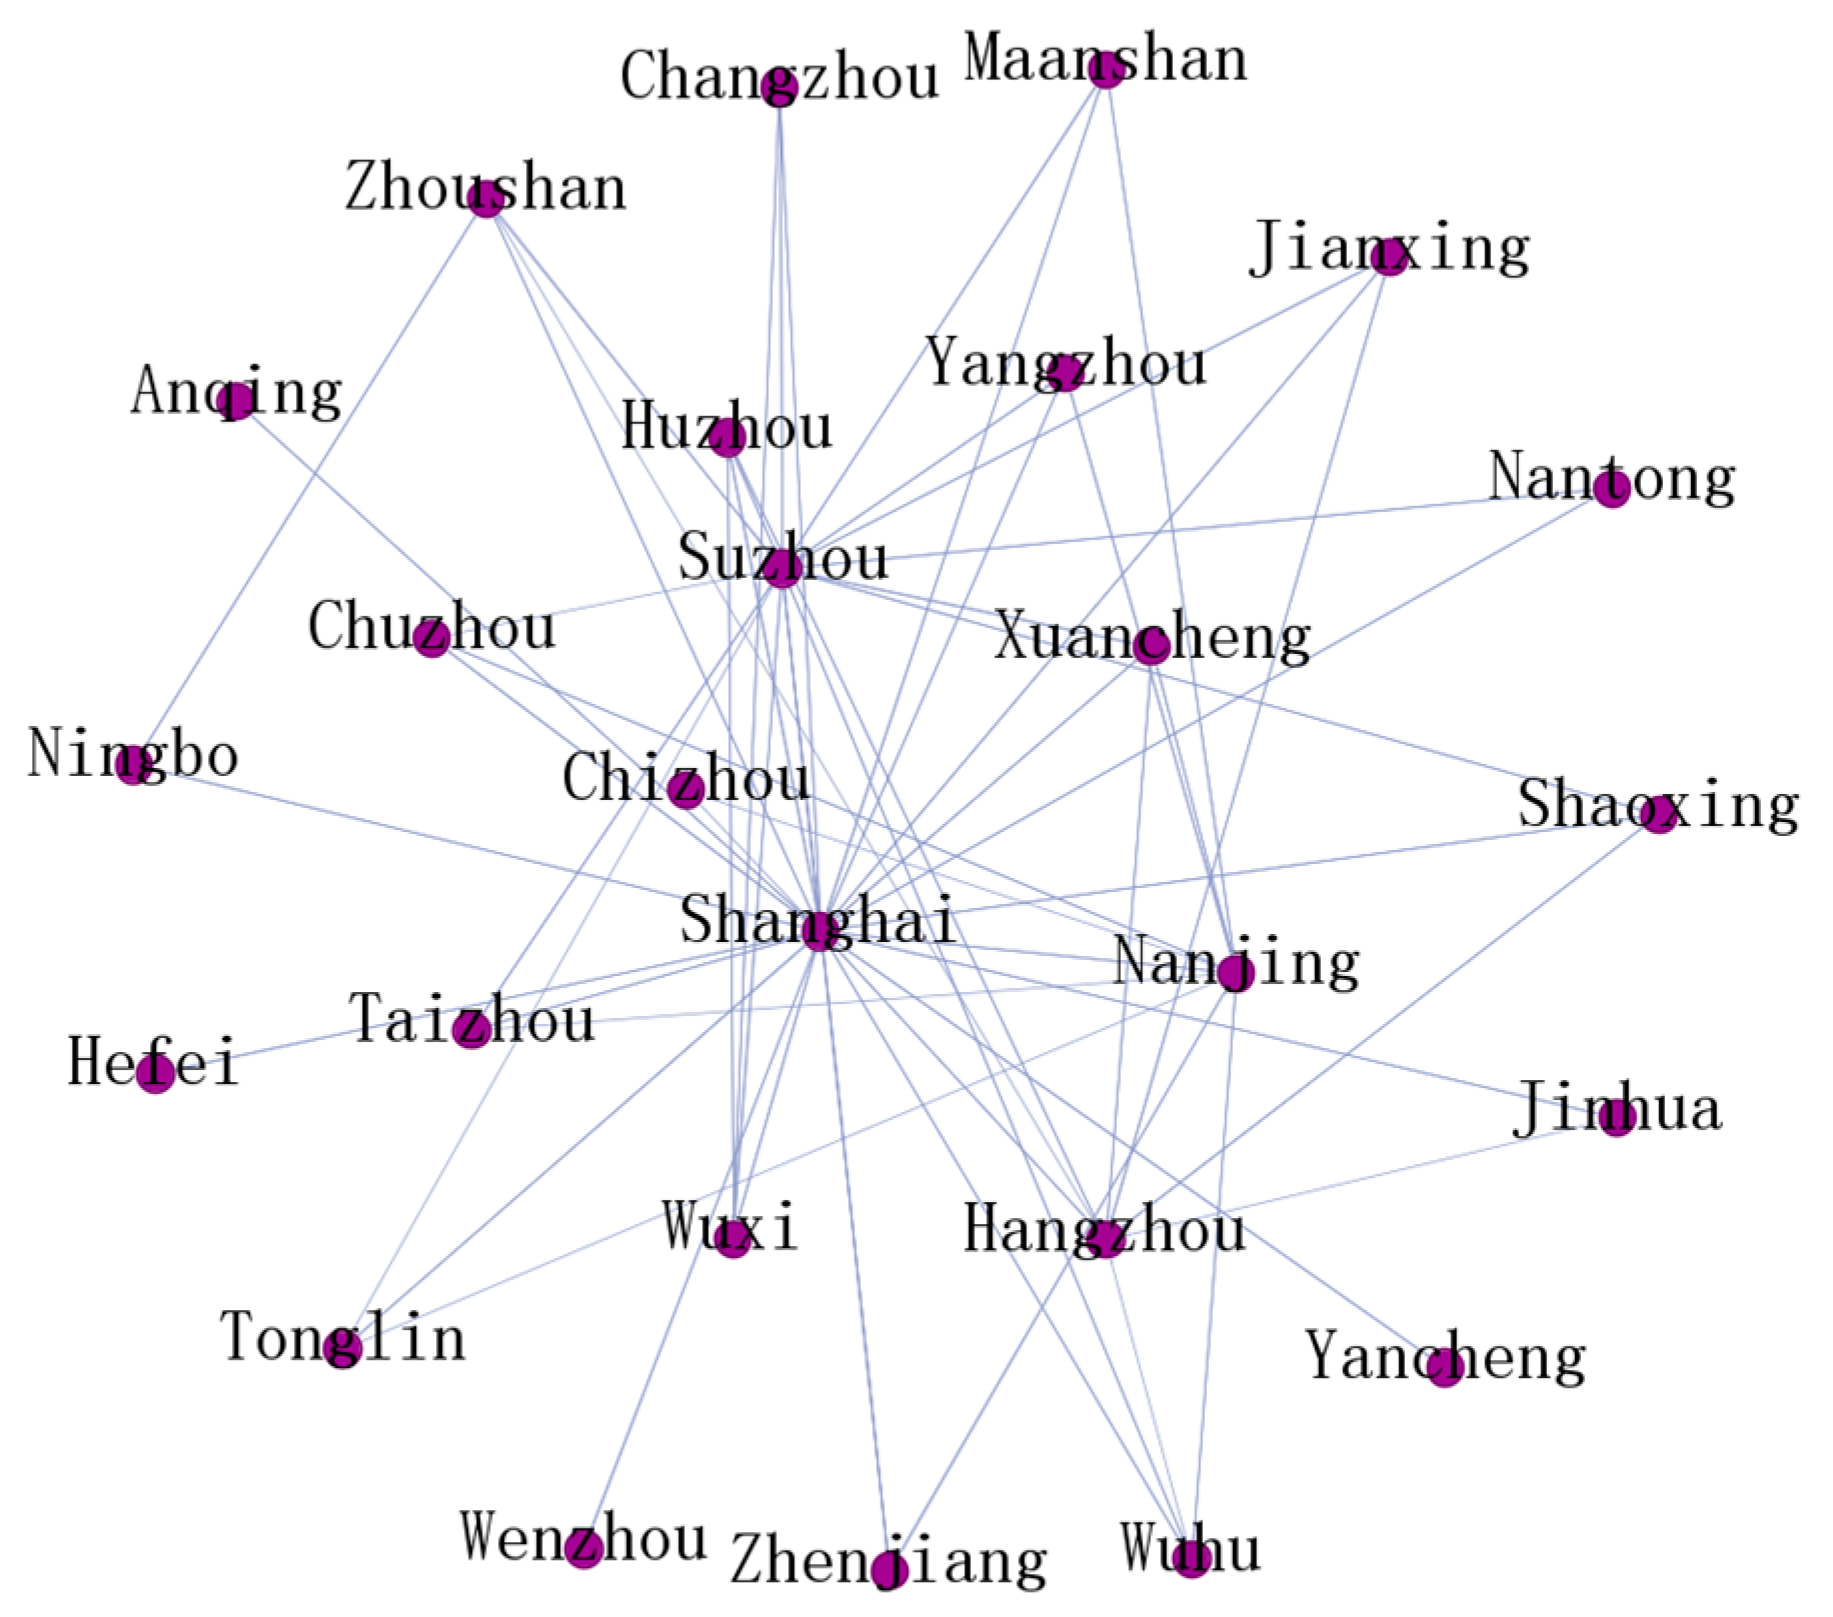
Figure 3.
Digital Economy Network of the YRDUA in 2016.
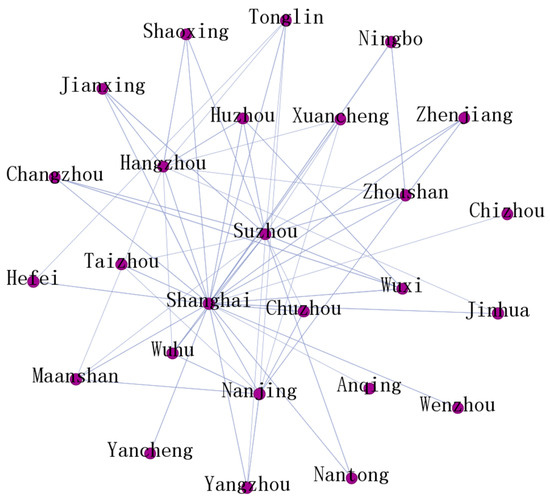
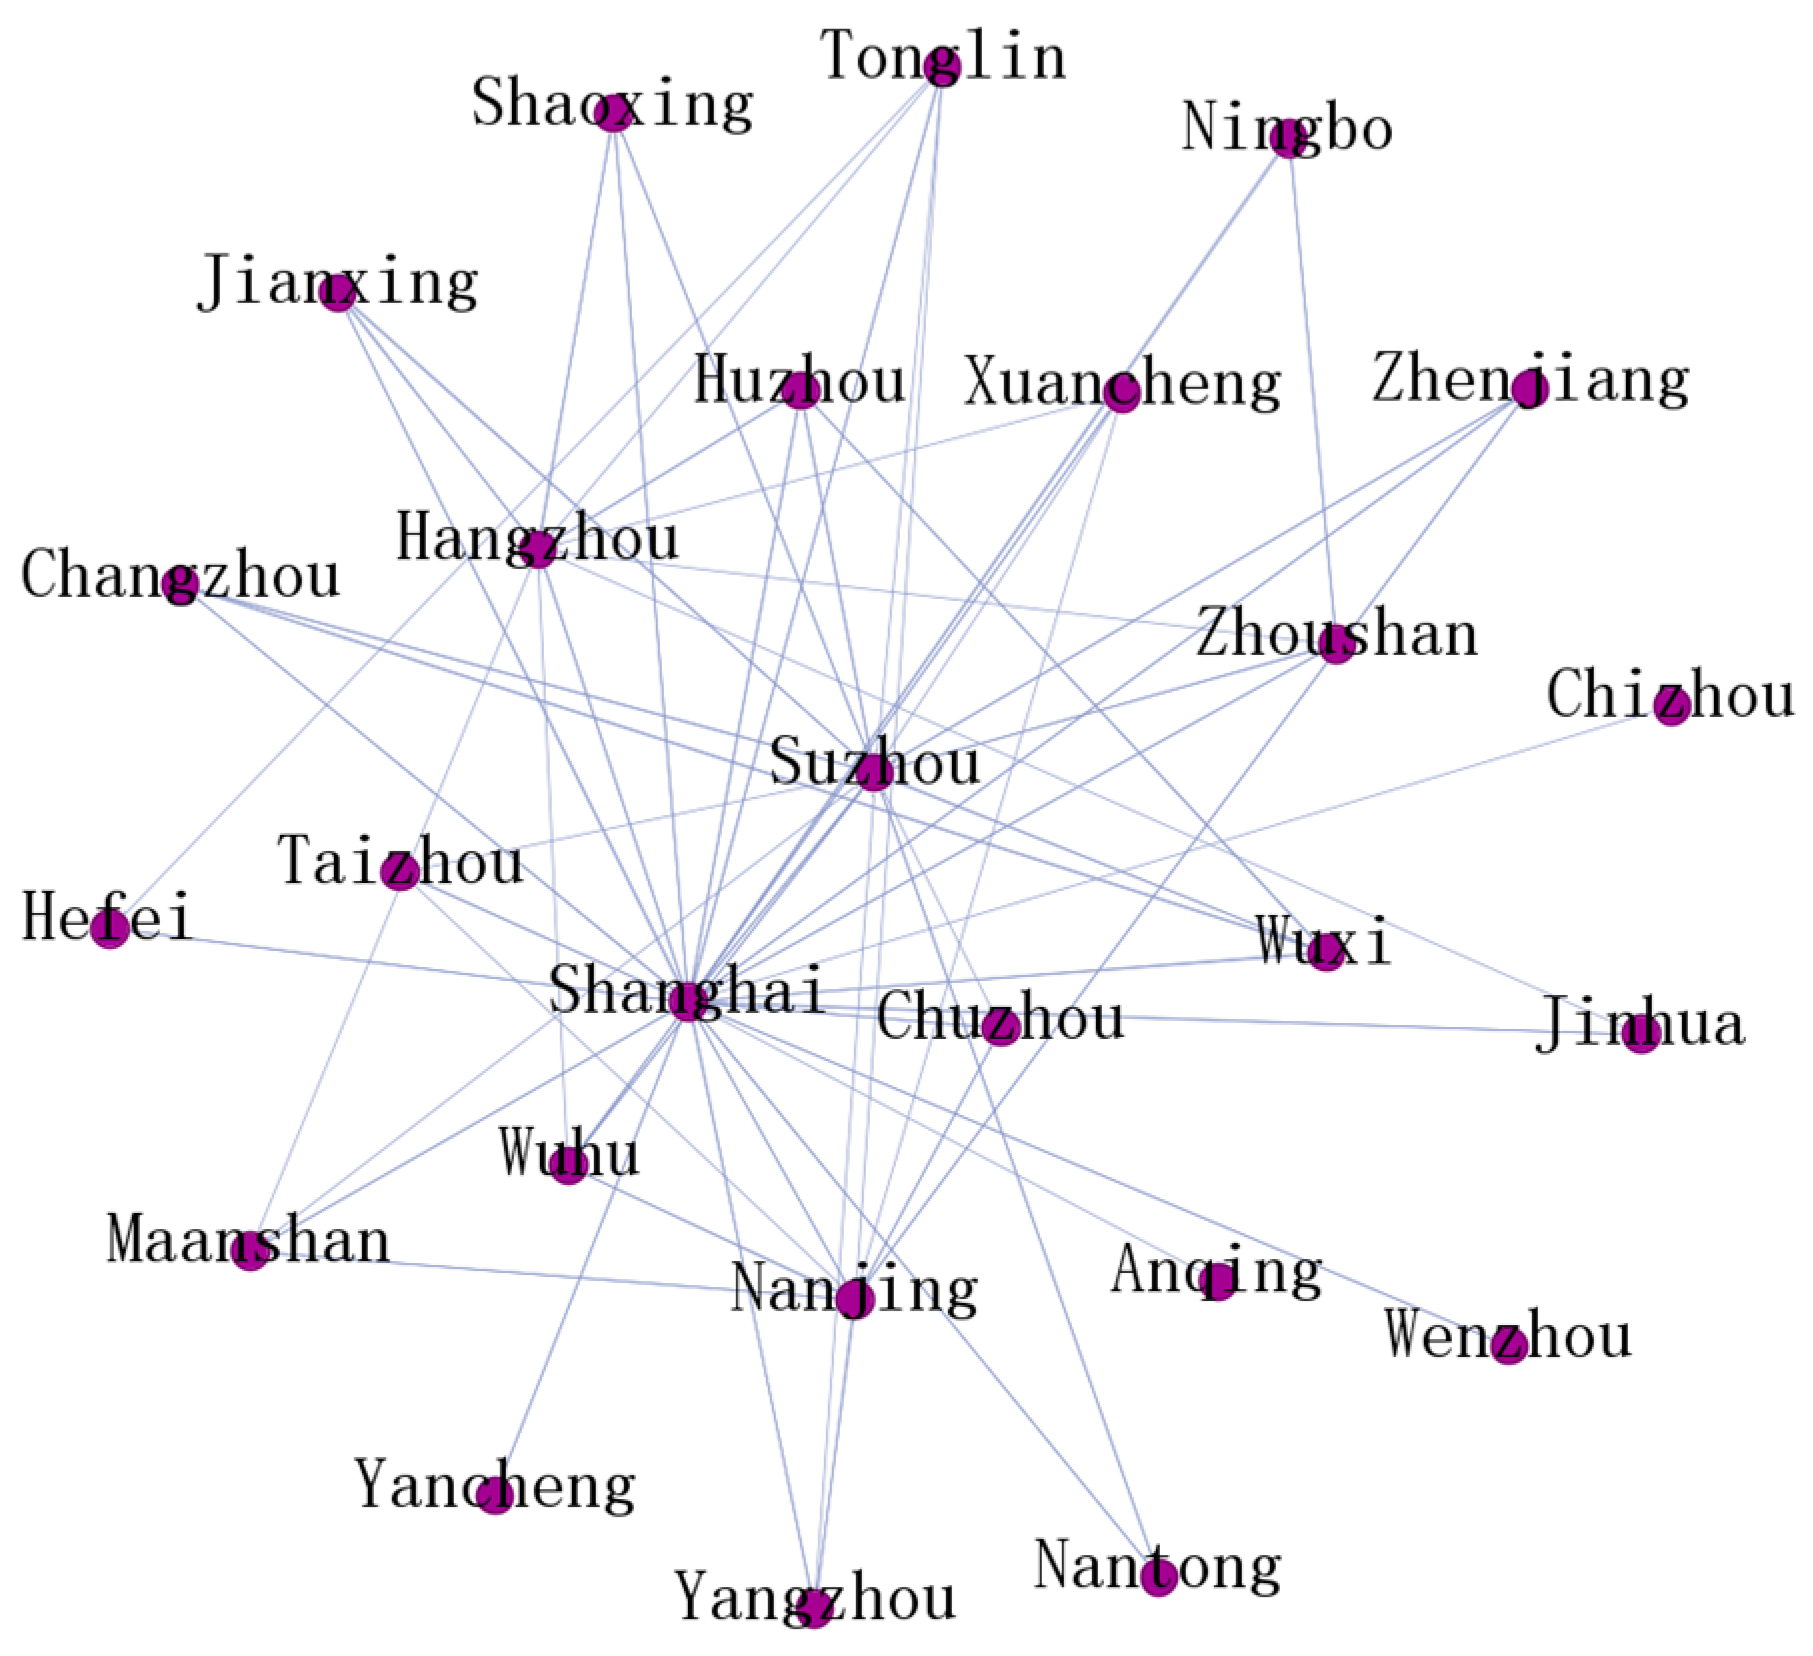
Figure 4.
Digital Economy Network of the YRDUA in 2021.
- (1)
- Analysis of the overall characteristics of the network structure
The results show that the digital economy network density of the YRDUA increased from 0.155 in 2011 to 0.158 in 2016 and then decreased to 0.151 in 2021, showing an “inverted U-shaped” trend of first increasing and then decreasing. Possible explanations for this include the fact that the YRDUA cities’ spatial connections for the development of their digital economies have gotten closer since 2010 when China’s digital economy and the mobile internet industry both experienced rapid growth. However, as the digital economy expands quickly, new problems will also arise, including how to overcome technical obstacles, enhance data quality, and make significant strides in digital technology innovation. These problems could have a negative impact on the YRDUA’s entire digital economy network. Overall, the YRDUA’s digital economy network density is typically low at the three points in time investigated, and there is still more room for the development of digital economy cooperation among the cities in the city cluster.
The critical value of linkage intensity set by the economic network structure figure of the YRDUAs reflected in Figure 2, Figure 3 and Figure 4 is zero. This indicates that as long as economic linkages exist between cities, regardless of the intensity, their existence is reflected in the network figure. In the digital economy network structure figure of the YRDUA, the intensity of connecting lines between nodes represents the strength of digital economy ties. By analyzing Figure 2, Figure 3 and Figure 4, it can be found that the strength of the digital economy connections between Shanghai and other cities is always stronger, which indicates that Shanghai is the pioneer of digital economy development in the YRDUA. And the digital economy network linkages are mainly concentrated in the core cities of Suzhou, Hangzhou, and Nanjing, and then gradually develop to other cities in the YRDUA.
In addition, the economic linkages of the YRDUA are polarized. There are strong economic links between some cities and their neighboring cities, reflecting the radiating role of the central cities, such as Shanghai, Suzhou, Hangzhou, and Nanjing with the surrounding cities. However, there are still some prefecture-level cities with weaker economic ties with each other. Most of these cities are located at the edge of the YRDUA and, due to their lack of geographical advantages and weak economic development base, they lag behind the core cities of the city cluster in terms of development speed and quality. Therefore, the mutual influence and synergistic development between the YRDUAs still need to be strengthened.
- (2)
- Node association analysis
We have measured the centrality indicators of the digital economy network and explored the role of each city in the digital economy spatial association network of the YRDUA. Table 3 presents the results of the degree centrality of the digital economy linkage network for the three years 2011, 2016, and 2021. From the results in Table 3, it can be found that Shanghai and Suzhou consistently ranked the top two in the region in terms of degree centrality, occupying a central position in the digital economy network, and having strong radiation capacity. The degrees of centrality of Hangzhou, Ningbo, Wuxi, Nanjing, and Changzhou were at a high level during the study period, indicating that the digital economy of these cities also has a stronger role in driving the development of the digital economy in the YRDUA.
Table 3.
Results of the degree centrality of the digital economy network in the YRDUA.
In addition, overall, there is a clear trend of polarization in both in-degrees centrality and out-degrees centrality of the YRDUA over time. The in-degrees centrality and out-degrees centrality of the core cities in the YRDUA have been increasing, while the in-degrees centrality and out-degrees centrality of some cities with weaker economic development bases have been gradually decreasing. This indicates that the strength of economic radiation from the core cities increased during the study period, while cities with a weaker economic development base have weaker economic ties with other cities and are less affected by the economic influence of other surrounding cities.
Further, we measured the closeness centrality and betweenness centrality to analyze the relationships between cities in the digital economy network, and the results are shown in Table 4. The results show that Shanghai has the highest proximity centrality value, with closeness centrality even reaching 100 in the year under examination, indicating that Shanghai has established direct digital economy links with other cities in the Yangtze River Delta and is an absolute central actor. The closeness centrality of Suzhou, Wuxi, Nanjing, Hangzhou, Changzhou, and Ningbo is high at all three time points, indicating that these cities are not easily controlled by other cities and are relatively well connected with other cities in the digital economy. Except for a very few cities with a closeness centrality of less than 50 in individual years, most of the cities in the YRDUA have small differences in closeness centrality values and all of them are above 50, indicating that most of the cities in the YRDUA are well connected to each other in the digital economy.
Table 4.
Results of Closeness Centrality and Betweenness Centrality of the Digital Economy Network in the YRDUA.
Comparing the betweenness centrality in the Yangtze River Delta digital economy in 2011, 2016, and 2021, we find that Shanghai is always at the top of the list, and the number of betweenness centrality has increased significantly. In addition, cities such as Suzhou, Nanjing, Hangzhou, and Wuxi also have strong control power in the Yangtze River Delta digital economy network, playing the same role of “bridge” in the digital economy network and connecting other cities to form the digital economy cooperation network. It is worth noting that some cities have a constant betweenness centrality of 0. We further combine their degree centrality and find that these cities are not isolated in the digitally connected network but remain connected to other cities through spillover and absorption effects.
- (3)
- Cohesive group of the spatial network structure of the digital economy
The cohesive subgroup analysis is based on the strength of economic ties between cities, and this paper uses this analysis method to explore the phenomenon of small groups of cities clustering within the YRDUA. In this study, the iterative correlation convergence method (concor) algorithm in Unicet was used to obtain the cohesive subgroup of the YRDUA in 2011, 2016, and 2021, and the results are shown in Table 5.
Table 5.
Cohesive subgroup analysis results of the Digital Economy Network in the YRDUA.
In 2011, the members of subcluster 2 mainly included Ningbo, Hefei, and their surrounding cities. With economic development and technological progress, Ningbo and Hefei are among the new first-tier cities, gradually forming a new subcluster with Hangzhou. Subcluster 3 is mainly composed of cities around the core cities of Shanghai, Nanjing, Suzhou, Hangzhou, and Hefei, and these peripheral cities are influenced by the strong economic radiation of these core cities and have close economic ties. Subcluster 4 is composed mainly of cities located on the edge of the YRDUA. Economic communication between these cities is limited by many factors such as regional location and economic strength, and they are less influenced by the economic radiation of the core cities. Further analysis shows that cohesive subgroups 1 and 2 have varying degrees of economic radiation to the other two cohesive subgroups, a feature that the other two cohesive subgroups do not have. It can be seen that cohesive subgroups 1 and 2 are economically linked to other cities within the YRDUA, generating strong economic linkages, implying that the digital economy network of the YRDUA has developed based on the cohesive subgroups 1 and 2.
4.3. Discussion
According to the index system and empirical model constructed in this paper, this paper provides a comprehensive measurement of the digital development level of the YRDUA from 2011 to 2021 and analyzes the spatial distribution pattern and spatial correlation characteristics of the digital economy development in the YRDUA. It is found that the network density of the digital economy in the YRDUA is generally low, which is less than 0.2 during the study period, consistent with the conclusion of Xu et al. [15]. This indicates that the spatial correlation network connection of the digital economy in the YRDUA is not close enough, and there is still much room for improvement and enhancement. The possible reasons for this are manifold, including the combined effects of imbalanced development among cities, industrial differences, cooperation mechanisms, technological barriers, and market competition. Imbalanced urban development may result in some areas accumulating a lot of resources in the digital economy while other areas lag. This imbalance affects the balanced distribution of digital economy activities within city clusters, thereby constraining the formation and development of spatially connected networks. At the same time, differences between industries also affect the degree of agglomeration of digital economy activities, which, in turn, affects the synergistic growth of the digital economy within city clusters. These problems are important reasons for the unsustainable development of the digital economy, which stems from the lack of proper knowledge dissemination and distribution, inadequate cooperation mechanisms within urban agglomerations, and the lack of proper cooperation between enterprises, local governments, science, and society, whereby the sharing of information and the integration of resources will be limited, leading to the existence of information silos and restricting the sharing of knowledge and experience, thus affecting the cross-regional integration of the digital economy [33]. Apart from that, cybersecurity, as well as cybersecurity-related facilities, technologies, and policies, are also important aspects affecting the development of the digital economy [34]. The development of the digital economy is closely dependent on information technology and internet infrastructure. However, this also makes the digital economy more vulnerable to threats such as cyber-attacks, data leakage, and malware. In the event of a cybersecurity incident, it could not only lead to significant losses for businesses and individuals but also affect market confidence and consumer trust in the digital economy, which, in turn, could affect its stable and sustainable growth and limit technological progress in the digital economy.
In addition, Xu et al. also pointed out that the spatial correlation of the digital economy in the YRDUA shows a pattern of “only super power and multi-great power”, in which Shanghai, Nanjing, Suzhou, Hangzhou, and Wuxi have a higher out-degree than other cities, and the strongest radiation ability of the digital economy, which is consistent with the results of this paper’s degree centrality measurement [15]. This reason for the obvious unevenness in the spatial correlation of the digital economy in the YRDUA can be analyzed according to the model used in this paper. The modified gravity model in this paper is the ratio of geographic distance to the difference in a city’s GDP as the economic geographic distance. Geographic and socioeconomic differences are important factors affecting the formation and differences of digital economic networks in the YRDUA. Geographic proximity, economic development level, industrial structure, government investment, infrastructure development, and degree of openness all have an impact on the structure of digital economic networks. Through the analysis of cohesive subgroups, it is found that cohesive subgroup 1, consisting of Shanghai, Nanjing, and Suzhou, and cohesive subgroup 2, consisting of Hangzhou, Ningbo, and Hefei, are the basis for the development of the digital economy network in the YRDUA. The pattern of linkage development of peripheral cities driven by the central cities of Shanghai, Nanjing, Suzhou, Hangzhou, Ningbo, and Hefei is basically formed. This result is consistent with the findings of Xuan et al. who studied the digital innovation network structure of the YRDUA and found that the digital innovation network of the YRDUA basically formed a core area centered on Shanghai–Suzhou–Hangzhou from 2009 to 2020 [35]. Core cities such as Shanghai, Nanjing, Suzhou, and Hangzhou have better economic foundations and innovation resources, thus acting as important agglomerations of digital technology innovation. This innovation leadership makes the central city the core of the digital economy network, leading to the linked development of neighboring cities and promoting the development of the digital economy network.
As the YRDUA plays an important role as the engine of China’s economic development, its digital economy research findings are typical and representative to a certain extent. These findings above are of significant value for the study of the digital economy in urban agglomerations in China and other countries. Findings also help to reveal the level of development and spatial characteristics of the digital economy in the YRDUA, as well as the formulation of policies and strategies that are conducive to promoting the development of the digital economy [36,37]. Moreover, these findings can provide useful references for urban agglomerations in other countries in the process of digital transformation and help them avoid repeating the mistakes already made by the YRDUA in the process of digital transformation. The YRDUA has already encountered a series of challenges and barriers in the development of the digital economy, such as inappropriate technology deployment, unsuitable policies, and insufficient market competition. Urban agglomerations in other countries can avoid similar problems by learning from the experience of the YRDUA. For example, the YRDUA experienced problems in the early stages of digital transformation due to the lack of appropriate legal and regulatory support, and other countries can avoid similar legal obstacles by establishing a useful legal framework in advance. In addition to this, the YRDUA may have tried unsuccessful innovations or business models in the development of the digital economy, which are also lessons that other countries can learn from. The digital economy development journey of the YRDUA is a valuable case study with many valuable lessons and experiences that can help urban agglomerations in other countries avoid some of the steps that have proved to be wrong in their digital transformation and achieve successful digital economy development more quickly.
Further, it should be pointed out that this paper mainly focuses on the measurement of the level of digital economy development and its spatial network correlation and does not explore the factors affecting the development of the digital economy. Future research can further explore the factors affecting the development of the digital economy in the YRDUA, explore the driving mechanism of the development of the digital economy in the YRDUA, and provide a basis for the relevant departments to formulate more scientific and reasonable measures.
5. Conclusions and Policy Implications
This paper measures and evaluates the digital development level of the YRDUA from 2011–2021 and examines the spatial distribution pattern and spatial correlation of digital economy development in the YRDUA. It is concluded that the digital economy development level of the YRDUA is found to have increased during the period 2011–2021, and Hangzhou is the city with the highest digital economy level in the YRDUA in 2021. From the perspective of the spatial network, Shanghai, Nanjing, Suzhou, and Hangzhou are the core nodes of the digital economy linkage network of the YRDUA, and these cities have a positive radiation effect on the neighboring cities, driving the development of the digital economy in the neighboring cities. And a pattern of linked development of peripheral cities driven by central cities, mainly Shanghai, Nanjing, Suzhou, Hangzhou, Ningbo, and Hefei, has gradually been formed in the YRDUA. However, although the spatial network of digital economy among cities has basically been formed, in general, the density of digital economy among cities in the YRDUA is at a low level. The network connection among cities is not close enough, and it is necessary to further enhance the network connection among cities. For these conclusions, this paper puts forward the following suggestions.
- (1)
- Government departments need to accelerate the digital reform of the YRDUA and drive the transformation and upgrading of traditional industries in the direction of digitalization by deepening the application of modern information technology. On the one hand, core cities such as Shanghai and Hangzhou need to further leverage their economic development advantages and geographic advantages to guide the digital transformation of enterprises and encourage them to connect to the industrial internet, so as to provide reserve power for the development of the digital economy. On the other hand, it is important to increase financial support and policy inclination for less developed areas of the digital economy, strengthen cooperation between areas lagging behind in the development of the digital economy and core cities, and accelerate the digital transformation of enterprises in the YRDUA;
- (2)
- Based on the growing need for integrated development of the YRDUA, government departments should encourage the integrated development of new information infrastructure and consolidate and promote digital economy development. Cities such as Shanghai, Hangzhou, Suzhou, and Nanjing have a good foundation for the development of the digital economy and have certain advantages in the application of digital technology. Therefore, it is important to accelerate the exchange of digital economy between cities through the mode of core cities driving peripheral cities, so as to realize the unobstructed flow of factors and product flows between cities and to promote the high-quality development of digital economy in the YRDUA;
- (3)
- To promote the comprehensive development of the digital economy in the YRDUA, it is not only important to focus on government initiatives but also to pay significant attention to other stakeholders, including private industries, educational institutions, and international organizations. For private industries, incentive policies, financial support, and collaborative platforms should be established to encourage investment in the digital economy sector. Educational institutions can foster industry–academia collaboration, establish innovation centers, and encourage interdisciplinary interactions to nurture highly skilled talents aligned with digital economy needs. International organizations can expand international cooperation, and host international exchange events to enhance their global competitiveness. Through these policy recommendations, a diversified cooperation network can be established in the YRDUA to create a conducive environment for the sustained and high-quality development of the digital economy.
Author Contributions
H.C.: Resources, methodology, supervision, writing original draft. Y.N.: Theoretical framework, review, and editing. X.Q.: Data processing, writing, review, and editing. All authors have read and agreed to the published version of the manuscript.
Funding
This research received no external funding.
Institutional Review Board Statement
Not applicable.
Informed Consent Statement
Not applicable.
Data Availability Statement
Data available on request from the authors.
Conflicts of Interest
The authors declare no conflict of interest.
References
- Wang, H.; Wu, D.; Zeng, Y. Digital economy, market segmentation and carbon emission performance. Environ. Dev. Sustain. 2023, 6, 03465. [Google Scholar] [CrossRef]
- Qian, X. Empowering High Quality Economic Development under the New Situation of Deep Integration of Digital Economy and Real Economy. Financ. Trade Res. 2022, 33, 1–8. (In Chinese) [Google Scholar]
- Shahbaz, M.; Wang, J.D.; Dong, K.Y.; Zhao, J. The impact of digital economy on energy transition across the globe: The mediating role of government governance. Renew. Sustain. Energy Rev. 2022, 166, 112620. [Google Scholar] [CrossRef]
- Xu, S.; Oleksii, L.; Pimonenko, T. China’s digital economy development: Incentives and challenges. Technol. Econ. Dev. Eco. 2022, 29, 1–21. [Google Scholar]
- Zhu, W.; Huang, J.; Cai, N. Comparing the Digital Economy Urban Network: Study Based on the Human Resource Needs in the Yangtze River Delta, China. J. Urban. Plan. Dev. 2022, 148, 05022033. [Google Scholar] [CrossRef]
- Wang, H.; Gu, K.; Dong, F.; Sun, H. Does the low-carbon city pilot policy achieve the synergistic effect of pollution and carbon reduction? Energ. Environ. 2022, 9, 1177. [Google Scholar] [CrossRef]
- Li, Z.H.; Li, N.Y.; Wen, H.W. Digital Economy and Environmental Quality: Evidence from 217 Cities in China. Sustainability 2021, 13, 8058. [Google Scholar] [CrossRef]
- Tapscott, D.; Caston, A.; Osorio, M.A. Cambio de Paradigmas Empresariales; McGraw-Hill: Santaé de Bogotá, Colombia, 1995. [Google Scholar]
- Kling, R.; Lamb, R. IT and organizational change in digital economies: A socio-technical approach. ACM SIGCAS Comput. Soc. 1999, 29, 17–25. [Google Scholar] [CrossRef]
- Crawford, W. The digital economy: Promise and Peril in the age of networked intelligence. J. Acad. Libr. 1996, 22, 69–71. [Google Scholar] [CrossRef]
- Kim, B.; Barua, A.; Whinston, A.B. Virtual field experiments for a digital economy: A new research methodology for exploring an information economy. Decis. Support. Syst. 2002, 32, 215–231. [Google Scholar] [CrossRef]
- Hasan, H.; Kazlauskas, A. Digital Ecosystems: ICT’s contribution to addressing climate change. In Proceedings of the 2009 3rd IEEE International Conference on Digital Ecosystems and Technologies, Istanbul, Turkey, 1–3 June 2009; pp. 157–162. [Google Scholar]
- Bukht, R.; Heeks, R. Defining, Conceptualising and Measuring the Digital Economy. Int. Organ. Res. J. 2018, 13, 143–172. [Google Scholar] [CrossRef]
- Guo, B.N.; Wang, Y.; Zhang, H.; Liang, C.Y.; Feng, Y.; Hu, F. Impact of the digital economy on high-quality urban economic development: Evidence from Chinese cities. Econ. Model. 2023, 120, 106194. [Google Scholar] [CrossRef]
- Xu, M.Z.; Zhu, Y.Z.; Yang, D.P. Spatial Correlation and Collaborative Governance of Digital Economy Development: Taking the Yangtze River Delta Urban Agglomeration as an Example. Gov. Res. 2022, 38, 102–112. (In Chinese) [Google Scholar]
- Xian, Z.D.; Wang, T.Q. Measurement and prediction of the scale of core industries in China’s digital economy. Stat. Res. 2022, 39, 4–14. (In Chinese) [Google Scholar]
- Cai, Y.Z.; Niu, X.X. Calculation and Structural Analysis of the Value Added Scale of China’s Digital Economy. Soc. Sci. China 2021, 11, 4–30. (In Chinese) [Google Scholar]
- Chen, L.; Kong, Q. Statistical Measurement of the Scale of China’s Digital Economy. Stat. Decis. 2021, 37, 5–9. (In Chinese) [Google Scholar]
- Lina, W. Evaluation of High-quality Development of Shaanxi’s Economy Based on Digital Economy Based on Machine Learning Algorithm. Int. Trans. Electr. Energy Syst. 2022, 2022, 6327347. [Google Scholar]
- Wang, B.Y.; Tian, J.F.; Cheng, L.S.; Hao, F.L.; Han, H.; Wang, S.J. Spatial differentiation and influencing factors of China’s digital economy. Geogr. Sci. 2018, 38, 859–868. (In Chinese) [Google Scholar]
- Chen, Z.Q.; Wei, Y.; Shi, K.F.; Zhao, Z.Y.; Wang, C.X.; Wu, B.; Qiu, B.W.; Yu, B.L. The potential of nighttime light remote sensing data to evaluate the development of digital economy: A case study of China at the city level. Comput. Environ. Urban. Syst. 2022, 92, 101749. [Google Scholar] [CrossRef]
- Luo, R.; Zhou, N.X. Dynamic Evolution, Spatial Differences, and Driving Factors of China’s Provincial Digital Economy. Sustainability 2022, 14, 9376. [Google Scholar] [CrossRef]
- Li, Z.; Liu, Y. Research on the Spatial Distribution Pattern and Influencing Factors of Digital Economy Development in China. IEEE Access 2021, 9, 63094–63106. [Google Scholar]
- Zhao, F.; Liu, Y.J. The connection strength, spatial structure and development strategy of China’s digital economy. J. Shanxi Univ. 2021, 44, 99–108. (In Chinese) [Google Scholar]
- Zhong, Y.X.; Mao, W.S. Spatial pattern and influencing factors of digital economy in the Yangtze River Economic Belt. J. Chongqing Univ. 2020, 26, 19–30. (In Chinese) [Google Scholar]
- Liu, J.; Yang, Y.Y.; Zhang, S.F. Research on the Measurement and Driving Factors of China’s Digital Economy. Shanghai J. Econ. 2020, 381, 81–96. (In Chinese) [Google Scholar]
- Liu, S.J.; Guo, Z.X. Research on evaluation of development level of digital economy based on combination weighting method and improved VIKOR method. J. Intell. Fuzzy Syst. 2023, 44, 7723–7738. [Google Scholar] [CrossRef]
- Si, X.F.; Li, M.S. Digital Economy, Employment Structure, and Employment Quality: An Empirical Analysis Based on Provincial Data in China. Northwest Popul. J. 2022, 43, 54–69. (In Chinese) [Google Scholar]
- Tang, F.H.; Tang, H.; Sun, Q.; Tang, D.S. Analysis of the Economic Network Structure of Urban Clusters in the Middle Reaches of the Yangtze River. Acta Geogr. Sin. 2013, 68, 1357–1366. (In Chinese) [Google Scholar]
- Liu, H.J.; Liu, C.M.; Sun, Y.N. A study on the spatial correlation network structure characteristics and effects of energy consumption in China. China Ind. Econ. 2015, 326, 83–95. (In Chinese) [Google Scholar]
- Su, Y.; Yu, Y.Q. Spatial association effect of regional pollution control. J. Clean. Prod. 2019, 213, 540–552. [Google Scholar]
- Liu, J. Lecture on Whole Network Approach: A Practical Guide to UCINET; Truth & Wisdom Press: Shanghai, China, 2009. [Google Scholar]
- Kuzior, A.; Kuzior, P. The Quadruple Helix Model as a Smart City Design Principle. Virtual Econ. 2020, 3, 39–57. [Google Scholar] [CrossRef]
- Kuzior, A.; Vasylieva, T.; Kuzmenko, O.; Koibichuk, V.; Brożek, P. Global Digital Convergence: Impact of Cybersecurity, Business Transparency, Economic Transformation, and AML Efficiency. J. Open Innov. Technol. Mark. Complex. 2022, 8, 195. [Google Scholar]
- Xuan, Z.Y.; Duan, J.J.; Hua, Y.N.; Yao, M.C. Multi scale analysis of the spatial structure evolution and mechanism differences of digital innovation networks in the Yangtze River Delta. China Sci. Technol. Forum 2023, 4, 63–72. (In Chinese) [Google Scholar]
- Kwilinski, A. Mechanism of Formation of Industrial Enterprise Development Strategy in the Information Economy. Virtual Econ. 2018, 1, 7–25. [Google Scholar]
- Yang, C.; Kwilinski, A.; Chygryn, O.; Lyulyov, O.; Pimonenko, T. The Green Competitiveness of Enterprises: Justifying the Quality Criteria of Digital Marketing Communication Channels. Sustainability 2021, 13, 13679. [Google Scholar]
Disclaimer/Publisher’s Note: The statements, opinions and data contained in all publications are solely those of the individual author(s) and contributor(s) and not of MDPI and/or the editor(s). MDPI and/or the editor(s) disclaim responsibility for any injury to people or property resulting from any ideas, methods, instructions or products referred to in the content. |
© 2023 by the authors. Licensee MDPI, Basel, Switzerland. This article is an open access article distributed under the terms and conditions of the Creative Commons Attribution (CC BY) license (https://creativecommons.org/licenses/by/4.0/).