Article

Analysis of Factors Affecting the Extra Journey Time of Public Bicycles

1
Department of Research and Development Team, CITYEYELAB Inc., Seongnam-si 13449, Republic of Korea
2
Department of Highway and Transportation Research, Korea Institute of Civil Engineering and Building Technology, Goyang 10223, Republic of Korea
*
Author to whom correspondence should be addressed.
Sustainability 2023, 15(18), 13804; https://doi.org/10.3390/su151813804
Submission received: 27 June 2023 / Revised: 3 September 2023 / Accepted: 12 September 2023 / Published: 15 September 2023

Abstract

:
Many countries worldwide are introducing public bicycle systems to reduce urban traffic and environmental problems. However, studies on the usage behavior of public bicycles have not considered the trip purpose of riders extensively due to data limitations. Therefore, this study defined the “extra journey time” from usage time and origin–destination (OD) expected time and clustered public bicycle usage behaviors. Subsequently, the effects of the location characteristics of the departure and arrival stations, road environmental factors, and weather conditions for each cluster were analyzed. Three clusters were obtained from the results. Riders in Cluster 1 were inferred to have used the bicycles to commute and for work purposes, and riders in Clusters 2 and 3 used the bicycles for leisure purposes. Moreover, the bike station location characteristics, road environmental factors, and weather conditions influenced the probability of classification into one cluster. In particular, bike lanes near the departure and arrival stations increased the probability of classification under Clusters 2 and 3. The trip patterns according to the extra journey time of public bicycles were classified under these clusters. Furthermore, the differences in the characteristics of the bicycle usage types were identified according to the location and meteorological factors affecting them.

1. Introduction

Automobile use has increased worldwide along with the rapid urbanization of modern society, improving the convenience and efficiency of life. However, this has caused various problems, such as traffic jams, parking difficulties, and traffic accidents. In addition, soot and noise emitted from vehicles cause environmental pollution and serious climate problems, such as global warming [1]. Accordingly, many countries worldwide are transitioning from the existing automobile-oriented traffic management policies to those centered on public and green transport to solve urban traffic and environmental problems [2]. Green transportation refers to clean modes of transport centered on walking and cycling [3]. Bicycles are an effective means of transportation that can simultaneously improve the health of users and the urban environment. Accordingly, public bicycle rental systems that promote the use of bicycles are being introduced worldwide to significantly reduce urban traffic and environmental problems [1]. Moreover, various policies are being promoted to revitalize the use of public bicycles.
A public bicycle rental system allows any member of a community to use public bicycles as cheaply, quickly, and conveniently as possible [4]. More than 300 cities worldwide have already introduced and operated public bicycle systems owing to their low initial construction cost and eco-friendliness [3].
Public bicycle systems are used to reduce traffic congestion, noise, and air pollution, among others, and the use of private vehicles by providing the public with free or low-cost transport [5,6,7]. Korea has many public bicycle rental systems in operation, such as Ttareungi in Seoul, Tashu in Daejeon, and Nubija in Changwon. In Seoul, public bicycle rental services have the highest awareness and satisfaction ratings among various urban environmental policies and services and are recognized as an effective environment related policy [8].
Efficiently installing a public bicycle system, considering the demand and trip patterns of public bicycles, is necessary because the location and capacity of departure/arrival rental stations are directly related to system operability and user satisfaction [9]. Accordingly, since the introduction of public bicycles, research has been conducted using actual usage data to analyze the factors affecting public bicycle usage. Studies on the effects of the presence of bicycle-only roads and road slopes, location characteristics of bicycle rental stations (whether they are within business and commercial districts), weather conditions, and demographic characteristics, such as gender, age, and academic background, were based on the public bicycle usage frequency, rate, and time. However, these studies were limited in that the purpose of the public bicycle trip could not be determined owing to the nature of the actual usage data; thus, the trip characteristics could not be classified. Therefore, this study compared the estimated trip time based on the distance between departure and arrival rental stations with actual public bicycle trip time data to compensate for the abovementioned limitations and to cluster the data according to usage behavior. The effect of spatiotemporal characteristics, road/environmental characteristics, and weather conditions at the departure/arrival rental station on each group’s usage behavior were analyzed.

2. Literature Review

Existing studies on the factors affecting public bicycle usage primarily considered the location characteristics of rental stations, weather and date/seasonal conditions, road environment conditions, and several other complex factors. Lee et al. [10] analyzed the location characteristics of rental stations affecting public bicycle usage in Changwon. They found that the usage was high at rental stations located in areas with high gross floor areas for public housing or commercial facilities. By contrast, public bicycle usage was relatively low in areas with a high density of available public transportation and consequently, a high demand for public transportation. Sa and Lee [11] analyzed the effect of the physical environment around public bicycle rental stations on public bicycle usage rates. The gross floor area of housing and office facilities near the rental station and the traffic volume on adjacent roads positively affected the public bicycle usage rate. The distance between the subway station and the bicycle-only road also significantly affected the bicycle usage rate. Similarly, Jang et al. [12] analyzed public bicycle usage in the Yeouido and Sangam districts of Seoul. They found that public bicycle usage for commuting and transfer purposes was high in residential/business complexes. Moreover, they confirmed that bicycle usage was high in areas where bus use was relatively low. Kim et al. [13] analyzed the effect of the location characteristics of public bicycle rental stations on public bicycle utilization. They found that commercial areas had a more significant effect on bicycle usage than residential areas. Moreover, the public bicycle usage rate around parks was three to five times higher than that near schools and subway stations. In addition, they found that the bicycle usage rate was approximately twice as high on weekends compared with weekdays. These results suggest that public bicycle utilization is high in city environments with well-maintained facilities. By contrast, usage may be rather low in environments with well-maintained public transportation.
Pucher et al. [14] analyzed the relationship between weather conditions and bicycle usage rates in North American cities. They found that the bicycle usage rate was high in cities with mild winter weather but not much precipitation, and the usage rate decreased in very hot or humid cities. Similarly, Lee et al. [15] analyzed the weather conditions affecting public bicycle usage in Goyang. They found that the public bicycle usage rate decreased when the precipitation, temperature, and wind speed were at least 10 mm, 29 °C, and 7 m/s, respectively. Faghih-Imani et al. [16] analyzed various factors, such as climate, date, and surrounding environment, affecting the public bicycle demand in Montreal, Canada. The analysis revealed that the better the weather, the higher the demand for public bicycles, and the demand was lower on weekends than on weekdays. In addition, accessibility to urban facilities, such as restaurants, commercial facilities, and universities, near bicycle rental stations also significantly affects bicycle rental and return. Tran et al. [17] and Mateo-Babiano et al. [18] developed a similar model by analyzing the effects of external factors on public bicycle usage. Corcoran et al. [19] comprehensively analyzed the date, climate, and urban environmental factors affecting the public bicycle usage rate in Brisbane, Australia. The analysis revealed that holidays did not independently affect the bicycle usage rate; however, they had a significant effect when analyzed with respect to the central business area. Rainfall and strong winds significantly reduced the public bicycle usage rate, while temperatures did not. In this study, the effect of temperature was insignificant because Brisbane has a warm subtropical climate throughout the year. Gebhart and Noland [20] analyzed the effect of weather conditions on public bicycle usage trends in Washington, DC, USA. They confirmed that people who use public bicycles, even under rainy weather conditions, are generally registered as members for public bicycle usage. Puello and Geurs [21] proved that road environmental factors significantly affected public bicycle usage. Public bicycle usage was higher in areas with bicycle-only roads than in other areas, and differences in the frequency of usage by degree of road slope were confirmed. Fuller et al. [22] evaluated the impact of public transportation strikes on public bicycle usage. An analysis of the public bicycle data obtained from two separate days of a London underground strike showed a 30% increase in the number of public bicycle users than usual on the first day of the strike, and a nearly 100% increase was observed on the second day. These results show that the demand for public bicycles increases as public transport becomes limited.
García-Palomares et al. [23] calculated and proposed accessibility indicators for public bicycle rental stations. They verified that the use of public bicycles to commute to work or school from rental stations with good accessibility was high. Fishman et al. [24] indicated that the primary trip purpose of public bicycle users is last-mile mobility linked to public transportation. Moreover, the use of bicycles to commute to work or school was high. They also suggested that public bicycles can help reduce unnecessary vehicular traffic in the city center. Wang et al. [25] analyzed the factors affecting public bicycle rentals for Nice Ride Minnesota, a public bicycle system in Minnesota, USA. They found that the average usage rate was 90% to 95% lower if another rental station was within a 1 km radius of the rental station. Moreover, the utilization rates of other rental agencies are negatively affected when adjacent rental agencies provide similar services. Midgley [26] characterized the public bicycle system and public bicycle usage by country. The successful conditions for introducing public bicycles include the existence of bicycle paths and favorable terrain and climatic conditions. In addition, the motivations for public bicycle use and the trip purpose according to the presence or absence of bicycle-only roads should be examined in future studies. W.L. Shang et al. [27] researched the impact of the COVID-19 pandemic on Bike Sharing System (BSS) utilization. They calculated travel distances and trajectories and estimated the environmental benefits of BSSs. The results show that the pandemic significantly affected user behavior, e.g., the average travel time of BSS riders increased. Xing et al. [28] combined BSS medium and short operation data with points of interest to study the trip purpose based on the k-means clustering method. The results revealed that departure and destination points on weekdays can be divided into five typical areas: dining, transportation, house, company, and shopping. To the best of our knowledge, there are very few studies on the frequency patterns of BSS users considering three time granularities simultaneously, namely a month-based long cycle, a week-based medium cycle, and an hour-based short cycle. Scarano et al. [29] analyzed 1066 papers between 2012 and 2021 using the Web of Science (WoS) to conduct research on bicycle safety. The field of bicycle safety was expressed in four diagrams, and through research, it contributed to making bicycles a means of safe use.
Most studies on public bicycle use are limited because the trip purpose cannot be determined due to the nature of the available data; thus, the trip characteristics cannot be analyzed separately. To compensate for this limitation, McBain and Caulfield [30] defined the difference between the actual time consumed riding a public bicycle and the “standard time” (standard time is the time required for a user to travel by bicycle from the origin rental station to the destination rental station) as “extra travel time”. They analyzed the influence of various physical and environmental factors on extra travel time. As extra travel time can indicate the degree of detour by public bicycle users and the quickness of the user to ride a bicycle, it can have useful implications for analyzing usage behavior, including the purpose of use. Their results confirmed that the number of commercial facilities near the rental station and better accessibility to public transportation reduced the user’s extra travel time. Moreover, users who used bicycles less than seven times in two years had longer travel times. This suggests that the physical environment of the city and usage frequency can significantly affect extra travel time and usage time. McBain and Caulfield’s [30] study is limited in that the usage time scale was not applied, as extra travel time is defined as the difference between the actual and standard usage times. For example, the characteristics of a bicycle trip in which a 5 min standard travel time extends to 15 min differ from those of a trip in which a 1 h standard travel time extends to 1 h and 10 min.
This study first defined the ratio of actual usage time to standard usage time as “extra journey time.” Subsequently, the influence of factors, such as location characteristics of rental stations, weather and date conditions, and environmental conditions, was analyzed after grouping public bicycle usage behaviors according to extra journey time. In addition, the results of previous studies were used to analyze various physical environments and usage factors that were not previously considered [31,32,33,34].

3. Methods

3.1. K-Means Clustering

McBain and Caulfield [30] used quantiles to categorize the extra travel time for public bicycle trips. However, the similarities between classified categories or clusters were unclear because quantiles automatically equalized the entire data. Therefore, this study categorized the extra journey time using clustering to ensure the rationality and validity of the derived categories.
Clustering involves unsupervised learning. It divides a large number of objects into several clusters, such that objects with high similarity are assigned to the same cluster. Proposed by McQueen [35], k-means clustering is widely used because it can easily identify different clusters with unique characteristics with low computational cost for large data. K-means clustering minimizes the sum of the distances between the centroid of the cluster and each object in the cluster (Equation (1)).
a r g m i n S S E = i = 1 N j = 1 K u i j x i u j 2 ,
s . t     u i j = 1 0     i f x i u j 2 < x i u k       k j o t h e r w i s e ,
j = 1 k u i j = 1           i ,
u j = i = 1 N u i j x i / i = 1 N u i j   ,
N: number of observations; k: number of clusters; u i j : whether object i is included in the cluster j; and u j : centroid of a cluster.
Equation (2) allocates an object to a cluster where it has the shortest distance to the centroid. Equation (3) guarantees that an object is allocated to only one cluster and that the object allocation result is mutually exclusive and collectively exhaustive (MECE). Equation (4) defines the centroid as the average of the objects in the cluster.
Clustering is a combinatorial optimization problem; thus, finding an exact solution is challenging. However, an approximate solution is obtained in k-means clustering through the following iterative process:
  • Step 1: Randomly set the u j centroids;
  • Step 2: Allocate each object to the cluster closest to the centroid Equation (2);
  • Step 3: Update the centroid using Equation (4);
  • Step 4: Repeat steps 2 and 3 until convergence.
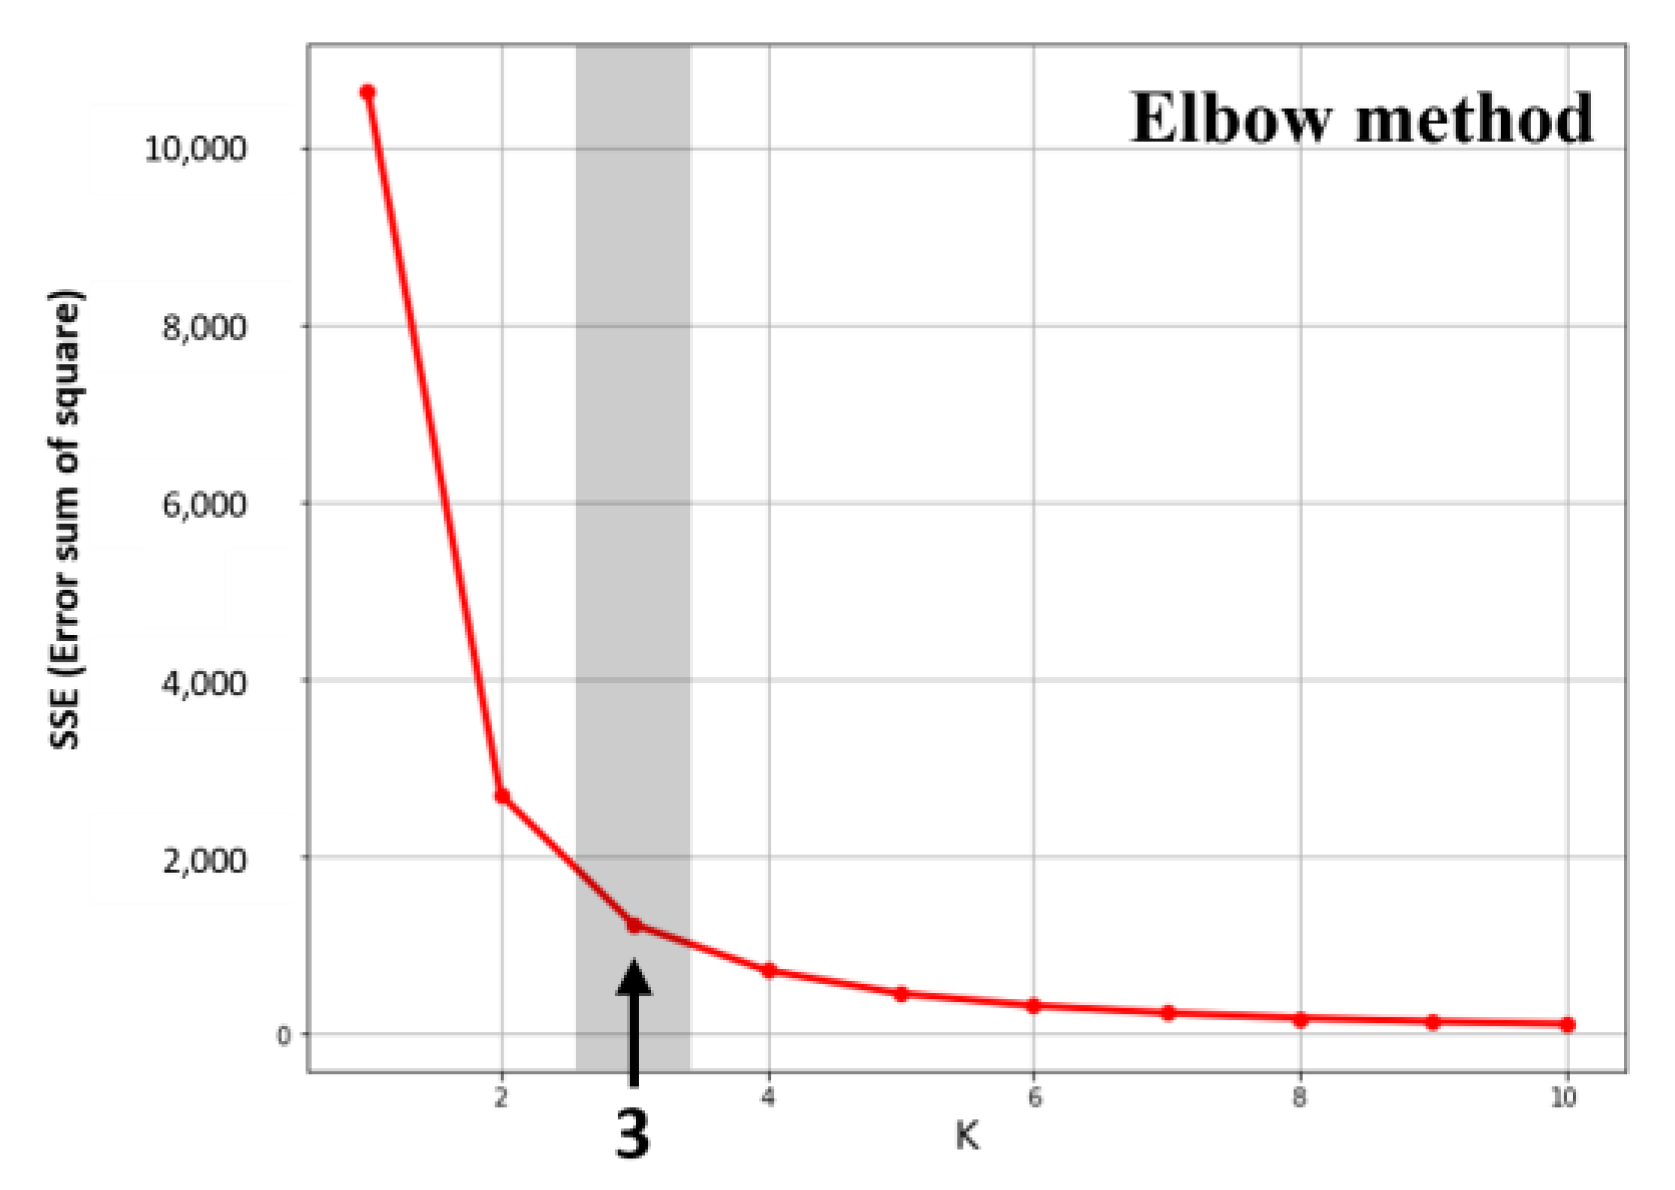
A possible constraint in k-means clustering is that the number of clusters is arbitrarily set by the researcher. Therefore, this study evaluated the sum of squared errors (SSE) according to the number of clusters to minimize the effect of randomness. Moreover, the total number of clusters, k, was determined using the elbow method. Initially, the k-means was run with only one cluster. The cost function or distortion, J, was computed and plotted. Then, the k-means was run with two clusters and with multiple random initial agents. Subsequently, the k-means were run with up to ten clusters. A curve was obtained showing a decreasing distortion with an increasing number of clusters.

3.2. Multinomial Logistic Regression

When the dependent variable is a categorical variable, a logistic regression model is used to predict the group classification of an object using the object’s attributes. A multinomial logistic regression analysis is performed when there are three or more groups of dependent variables, with the groups independent of each other. In this study, the cluster derived through k-means clustering for extra journey time was treated as a dependent variable. Accordingly, a multinomial logistic regression analysis was used to analyze the effect of various factors, such as location characteristics, weather and date conditions, and road environmental conditions, on the cluster.
Multinomial logistic regression analysis predicts the probability that the dependent variable x i of an individual belongs to a particular group with respect to the attribute of the individual. One dependent variable group was set as the reference group. The ratio of the probability that another group will be selected to the probability that the reference group will be selected is expressed as an equation for x i . The first group was used as the reference group.
ln [ P r ( y i = j | x i ) P r ( y i = 1 | x i ) ] = x i β j ,                         j = 2 ,   3 n ,
β j   : regression coefficient; and n: number of clusters of dependent variables.
The regression coefficient of the reference group is fixed at β 1   = 0 , and its probability is expressed as follows:
Pr y i = j x i = e x p ( x i β j ) k = 1 n e x p ( x i β k ) .
Figure 1 shows the analysis framework implemented in this study.

4. Study Case

4.1. Data

This study categorized the extra journey time of bicycles using operational data from public bicycles in Seoul and analyzed the factors affecting these categories. Because the date and season significantly affect public bicycle usage behavior, it is appropriate to set the temporal range of the analysis to one year. Usage data from 2018, when the Seoul public bicycle system was established, was obtained and used in this study. Specifically, the spatial range was limited to the Seoul district of Yeongdeungpo-gu. Land use in Yeongdeungpo-gu is diverse, and the district has a well-defined central business area, parks, and residential housing. Hence, public bicycle usage in Yeongdeungpo-gu fulfills various purposes, including commuting, work, shopping, and leisure trips. Typically, for public bicycle trips, the maximum speed on flat ground is 30 km/h; therefore, data with an average driving speed of 30 km/h or higher were considered outliers and excluded from the analysis. Accordingly, 432,795 data points were used in the analysis. Table 1 shows the exploratory data analysis (EDA) of public bicycles in Seoul.
The bicycle routes were mapped using a Korean navigation app, KakaoMap (Kakao Corp., Jeju, Republic of Korea), and the standard usage times were calculated. Three routes were provided: the shortest distance, a priority route containing bicycle-only roads, and a comfortable route. In this study, the standard usage time was calculated based on the trip time using the priority route. The travel time displayed by KakaoMap was extracted using Web Crawler because there were many possible combinations of departure and arrival rental stations. This method was also more convenient than manually entering and searching for the departure (start) and destination (end) points for public bicycle trips on KakaoMap. Table 2 lists the sources of the origin and destination site characteristics, weather and date conditions, and road/environmental conditions that were used as independent variables for multinomial logistic regression in this study.

4.2. Analysis Results

4.2.1. Clustering Results

The SSE according to the number of clusters ( k ) is shown in Figure 2. The extra journey time was divided into three clusters because the SSE was considered to be sufficiently reduced at k = 3 according to the elbow method. The extra journey time results are summarized in Table 3.
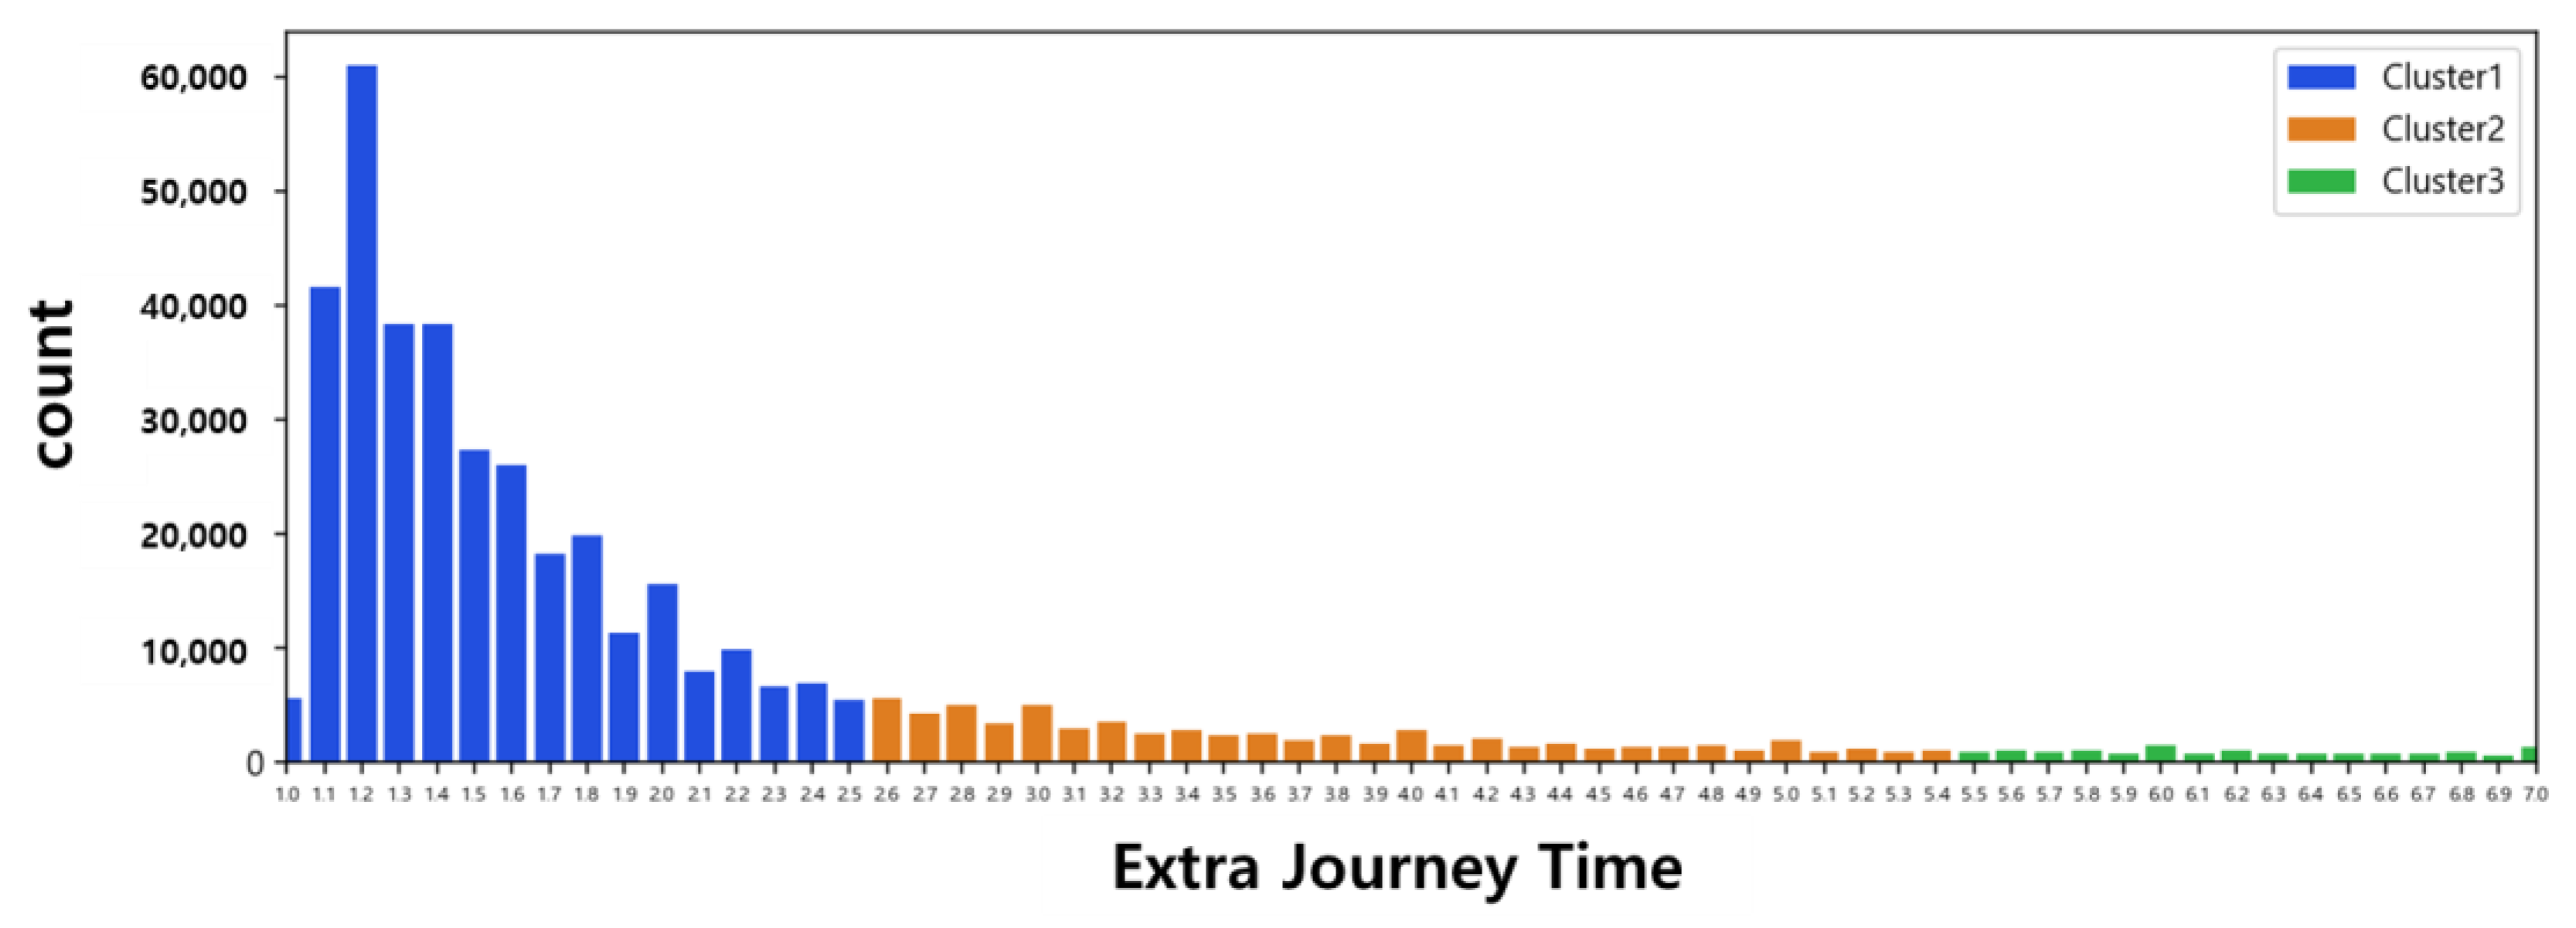
Cluster 1 had an extra journey time of 2.5 or less. Out of 432,795 cases, 339,178 (78%) were included in Cluster 1. Cluster 2 had an extra journey time greater than 2.5 and less than or equal to 5.4. The cluster contained 65,724 cases (15%). Cluster 3 had an extra journey time of 5.5 to 10 and contained 27,893 cases (7%). The extra journey time distribution is shown in Figure 3.
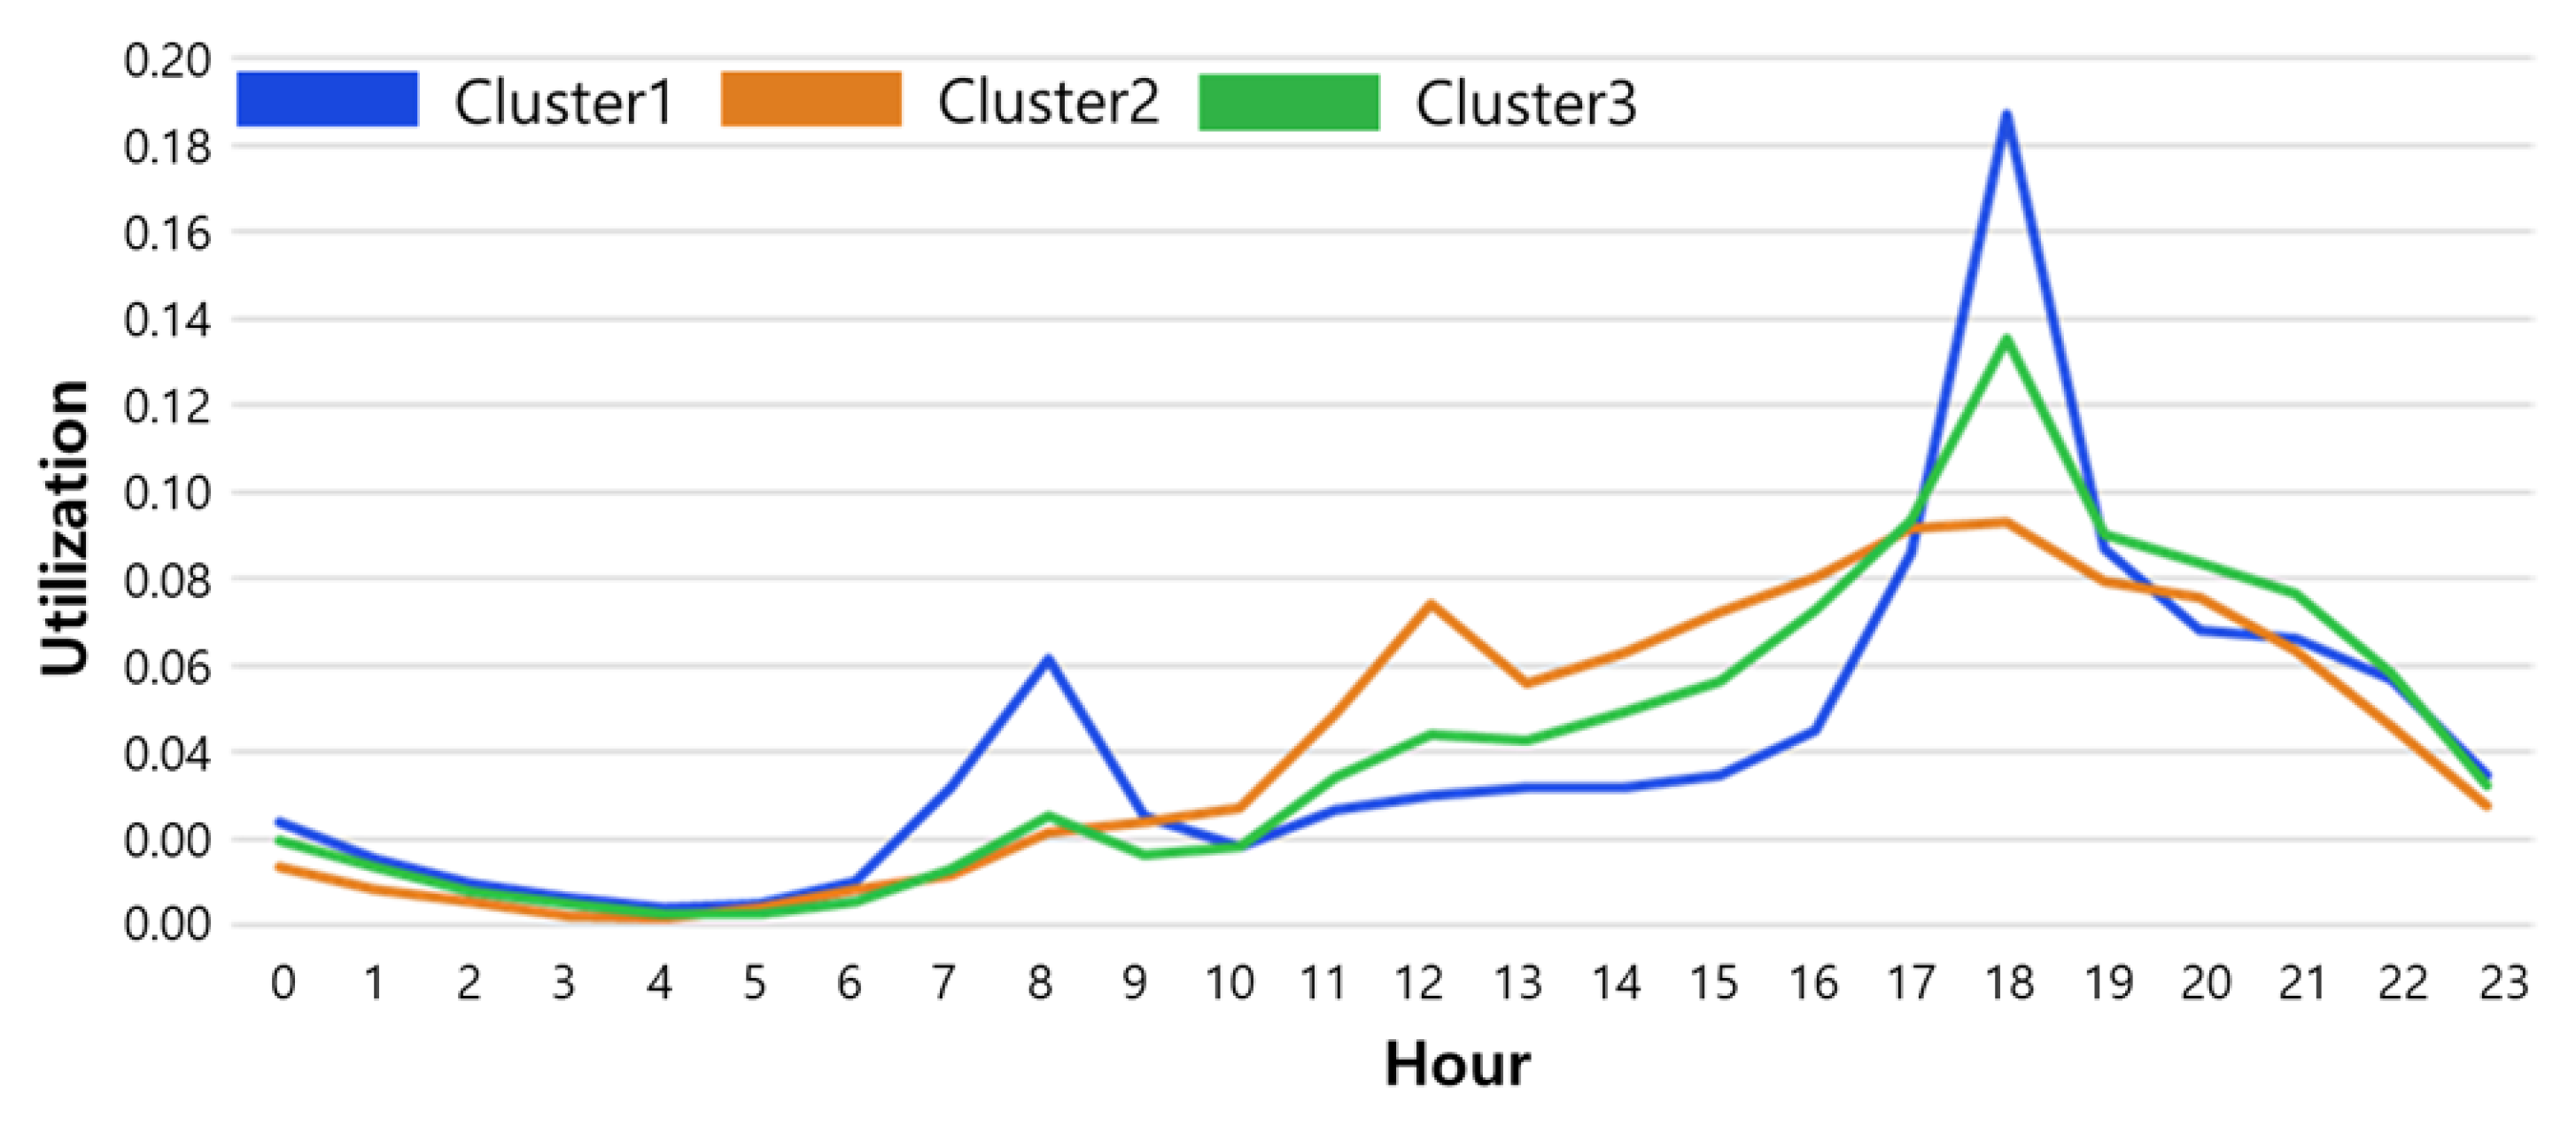
The three clusters exhibited different usage behaviors (Figure 4). The extra journey time was the smallest in Cluster 1. Bicycle usage was high during the weekdays, and bicycle demand was concentrated during commute hours. Cluster 2 and Cluster 3 had high extra journey times and frequent weekend usage. In both clusters, bicycle usage was concentrated during interpeak hours (11:00–17:00) rather than morning peak (07:00–10:00) and evening peak (18:00–21:00) hours. However, the distance between departure and arrival rental stations (origin–destination (OD) pair station distance) was longer in Cluster 2. The average distances were 2.1 km and 1.0 km in Cluster 2 and Cluster 3, respectively. The average standard usage time (OD-pair expected time) in Cluster 3 was 7.41 min, shorter than that in Cluster 2 at 13.01 min. The average actual usage time in Cluster 3 was 53.31 min, longer than that in Cluster 2 at 45.07 min.
The bicycle trip purpose inferred through the usage behavior of each cluster is as follows: bicycle trips in Cluster 1 were mostly for commuting or work trips, considering that bicycle usage was concentrated during commuting hours on weekdays (Figure 4 and Figure 5). By contrast, bicycle trips in Clusters 2 and 3 were concentrated on weekends during interpeak hours (Figure 5), implying shopping or leisure trips (Figure 4). However, considering that the distance between the departure and arrival rental stations in Cluster 2 was the same as that in Cluster 1 (Figure 6), it can be inferred that the trip purpose in Cluster 2 is for sports and high-intensity activities or for traveling to shopping and leisure areas. In Cluster 3, considering the short distance between the departure and arrival rental stations (Figure 6), it is presumed that public bicycles were used for light-intensity activities within a limited area. Table 4 summarizes the spatial and temporal characteristics of each cluster.

4.2.2. Multinomial Logistic Regression Results

Multinomial logistic regression was performed to analyze the effect of location characteristics, weather and date conditions, and road environmental conditions on the different clusters. The variance inflation factor (VIF), which indicates multicollinearity between independent variables, was less than 10.0. Thus, the analysis can be performed without difficulty. The results are summarized in Table 5. The pseudo-R-squared, indicating the explanatory power of the model, was calculated to be 0.454. The estimation results and implications for each independent variable are as follows:
First, the probabilities of classification under Cluster 2 rather than Cluster 1 and Cluster 3 rather than Cluster 2 were higher as the number of rental stations (station size) increased. Thus, the extra journey time increased as the number of bicycle cradles increased. Unlike those in Cluster 1, the results in Clusters 2 and 3 suggest that the smaller the number of cradles, the lower the utilization. Therefore, optimizing the number of cradles in rental places with a high usage probability is necessary.
The probabilities of classification under Cluster 2 rather than Cluster 3 and Cluster 1 rather than Cluster 2 were higher as the distance between the departure and arrival rental stations increased. Thus, the extra journey time decreased as the distance between the departure and arrival rental stations increased. This phenomenon occurs because the tendency to use public bicycles for transportation rather than leisure becomes stronger while moving from Cluster 3 to Cluster 1. However, the longer the actual trip distance, the higher the probability of classification under Clusters 2 and 3. Users belonging to Clusters 2 and 3 seem to freely use public bicycles for longer periods instead of traveling directly from the departure rental station to the arrival rental station.
The slower the average speed of bicycles, the higher the probabilities of classification under Cluster 2 rather than Cluster 1 and Cluster 3 rather than Cluster 2. Thus, the extra journey time increased as the speed decreased. A slow travel speed may indicate that users have sufficient time resources, indicating that public bicycles are used for leisure trips or leisure activities rather than commuting or work trips. In addition, it is unlikely that a low speed of 5 km/h or less is maintained for 45 min or more; therefore, a low average travel speed suggests that the rider made an intermediate stop.
The probabilities of classification under Clusters 2 and 3 were high during a weekend or during interpeak times. This is consistent with the clustering results, indicating that Clusters 2 and 3 may be related to shopping or leisure activities.
The probabilities of classification under Clusters 2 and 3 were high when a subway was within 250 m of the rental station. When a bicycle is considered a means of access to a subway station, it can indicate that other means of transport, including buses, are preferred for Cluster 1. Moreover, it indicates that public bicycles are preferred for Clusters 2 and 3. The preferences are presumed to be caused by the differences in bus dispatch intervals during peak and nonpeak hours and the congestion level of pedestrian paths near rental stations. However, this requires further analysis in the future.
The probabilities of classification under Clusters 2 and 3 were high when cultural and leisure facilities were near the rental station, suggesting that the trip purposes for Clusters 2 and 3 may be leisure activities. Moreover, the higher the number of restaurants near the bicycle rental station, the higher the probability of classification under Cluster 1. This is attributed to the high density of restaurants targeting office workers in the central business district of Yeongdeungpo-gu. Therefore, the purpose of the public bicycle trip and the trip pattern depend on the characteristics of the area surrounding the rental station. This suggests that different operating strategies can be applied according to location characteristics in the future.
The probabilities of classification under Cluster 2 rather than Cluster 1 and Cluster 3 rather than Cluster 2 were high when an exclusive bicycle path was near the rental station. Thus, the extra journey time was longer in places where bicycle lanes are available. This suggests that people who use public bicycles for long periods tend to use bicycle lanes. Installing additional bicycle lanes can promote public bicycle use in Clusters 2 and 3; however, this effect may be minimal for Cluster 1.
The worse the weather conditions, the lower the probabilities of classification under Clusters 2 and 3. Commuting and work trips, inferred to be concentrated under Cluster 1, are taken regardless of weather conditions. However, under Clusters 2 and 3, users can easily cancel their trip during poor weather conditions. In addition, Clusters 2 and 3 are more sensitive to weather conditions because the actual distance and trip time are long. Therefore, the utilization rates of Clusters 2 and 3 decreased when the temperature was too high or too low, during heavy rainfalls, or when the fine dust concentration in the air was high.
To summarize, the primary achievements of this study are as follows:
(1)
Performed multinomial logistic regression analysis and k-means clustering to identify and characterize the factors affecting the extra journey time for trips using public bicycles;
(2)
Used temporal and spatial variables from various sources to analyze the effects of the different factors affecting public bicycle usage behaviors;
(3)
Inferred the public bicycle trip purpose through regression and clustering methods.
However, it is worth noting that the R-squared model is relatively low, indicating that the analyzed factors may not account for a significant portion of the variability.

5. Conclusions

Public bicycle rental systems can significantly reduce urban traffic and environmental pollution. To improve the operational performance of public bicycle systems and increase user satisfaction, research is being continuously conducted by many groups to analyze the usage patterns of public bicycles using actual usage data. However, previous research focused only on the frequency, rate, and time of public bicycle usage. Moreover, the trip purpose could not be determined due to data limitations. Therefore, this study defined the extra journey time as the ratio of the actual to the estimated/standard trip time. Then, k-means clustering was performed to classify public bicycle usage according to the extra journey time. Public bicycle usage was optimally clustered into three groups. In Cluster 1, the actual usage time did not differ significantly from the standard usage time. Moreover, bicycle trips in this cluster were primarily concentrated during morning peak hours on weekdays and during evening peak hours on weekends, indicating that riders were using bicycles for commuting or work-related trips. Public bicycle trips in Clusters 2 and 3 were for purposes other than commuting and were concentrated during weekend interpeak hours. Public bicycle trips in Cluster 3 took longer but were primarily taken to travel within a limited area.
The effects of location characteristics, weather and date conditions, and road and environmental conditions on the probability of classification under a specific cluster were analyzed using multinomial logistic regression. In terms of location characteristics, the probability of classification under Cluster 1 was high when many restaurants were near the bicycle rental station. The probabilities of classification under Clusters 2 and 3 were high when subways or cultural and leisure facilities were near the bicycle rental station. In terms of meteorological conditions, the utilization rates for Clusters 2 and 3 decrease under poor weather conditions. In terms of the day of the week, the probabilities of classification under Clusters 2 and 3 were high for trips taken during interpeak hours on weekends, consistent with the clustering results. Under road environmental conditions, the probabilities of classification under Clusters 2 and 3 were high when an exclusive bicycle lane was near the rental station. Installing additional bicycle-only roads can promote bicycle usage rates in Clusters 2 and 3.
The limitations of this study and future research directions are summarized as follows. First, although the spatial scope of this study was limited to Yeongdeungpo-gu, Seoul, additional research should be conducted to empirically identify the actual public bicycle usage behavior by district by comparing the extra journey times between districts. Second, in addition to the independent variables analyzed in this study, a complementary study considering user characteristics (demographics, socioeconomic traits, gender, occupation, and health conditions) is necessary.

Author Contributions

Writing—original draft, J.J.; Writing—review & editing, D.J. All authors have read and agreed to the published version of the manuscript.

Funding

This research was funded by a Program (2023 Road Traffic Survey(TMS)) from Ministry of Land, Infrastructure and Transport of Korean government.

Institutional Review Board Statement

Not applicable.

Informed Consent Statement

Not applicable.

Data Availability Statement

The data presented in this study are available upon request from the corresponding author.

Conflicts of Interest

The authors declare no conflict of interest.

References

  1. Jeong, S.W. Impacts of Automated Vehicles on Running Stability, Traffic Flow and Traffic Safety. Ph.D. Thesis, Hongik University, Seoul, Republic of Korea, 2017. [Google Scholar]
  2. Park, H.K. An Analytic Study on Usage Characteristics of the Public Bike Rental Service, “Seoul Bike” at Rush Hours. Master’s Thesis, Seoul City University, Seoul, Republic of Korea, 2018. [Google Scholar]
  3. Choi, J.S.; Lee, J.Y.; Park, E.A.; Heo, G.H. A Study on Green Transport Mode Choice and Environmental Awareness; The Korea Transport Institute: Sejong, Republic of Korea, 2011; pp. 1–157.
  4. Shin, H.C.; Kim, D.J. Impact Analysis on Bike-Sharing and Its Improvement Plan; The Korea Transport Institute: Sejong, Republic of Korea, 2012; pp. 1–310.
  5. Zhang, Y.; Thomas, T.; Brussel, M.; Van Maarseveen, M. Exploring the impact of built environment factors on the use of public bikes at bike stations: Case study in Zhongshan, China. J. Transport. Geogr. 2017, 58, 59–70. [Google Scholar] [CrossRef]
  6. Lyu, C.; Liu, Y.; Liu, Z.; Wu, X.; Yang, X. Exploring multi-scale spatial relationship between built environment and public bicycle ridership. J. Transp. Land Use 2020, 13, 447–467. [Google Scholar] [CrossRef]
  7. Midgley, P. Bicycle-sharing schemes: Enhancing sustainable mobility in urban areas. In Proceedings of the Commission on Sustainable Development, 19th Session, New York, NY, USA, 2–13 May 2011; United Nations, Department of Economic and Social Affairs: New York, NY, USA, 2011; Volume 8, pp. 1–12. [Google Scholar]
  8. Kim, M.H. Forecasting Public Bicycle Demand of Seoul Based on Time Series Clustering. Master’s Thesis, Hanyang University, Seoul, Republic of Korea, 2018. [Google Scholar]
  9. Ricci, M. Bike sharing: A review of evidence on impacts and processes of implementation and operation. Res. Transp. Bus. Manag. 2015, 15, 28–38. [Google Scholar] [CrossRef]
  10. Lee, S.Y.; Shin, E.K.; Kim, S.Y. Impacts of the Regional Environment Characteristics on the Public Bicycle Use: Analysis of the Spatial Information Using the Public Bicycles OD Flow-data in Changwon-si. J. Archit. Inst. Korea Plan. Des. 2014, 30, 215–223. [Google Scholar] [CrossRef]
  11. Sa, K.E.; Lee, S.G. Analysis of Physical Characteristics Affecting the Usage of Public Bike in Seoul, Korea: Focused on the Different Influences of Factors by Distance to Bike Station. J. Korea Plan. Assoc. 2018, 53, 39–59. [Google Scholar] [CrossRef]
  12. Jang, J.M.; Kim, T.H.; Lee, M.Y. A Study on the Seoul Public Bikes Use Characteristics: A Case of the Districts of Yeouido and Sangam. Seoul Stud. 2016, 17, 77–91. [Google Scholar]
  13. Kim, D.J.; Shin, H.C.; Park, J.S.; Im, H.J. The Impact of Weather on Bicycle Usage: Focus on Usage of Bike-sharing System in Goyang. J. Transp. Res. 2012, 19, 77–88. [Google Scholar] [CrossRef]
  14. Pucher, J.; Komanoff, C.; Schimek, P. Bicycling renaissance in North America?: Recent trends and alternative policies to promote bicycling. Transp. Res. Part A Policy Pract. 1999, 33, 625–654. [Google Scholar] [CrossRef]
  15. Lee, J.H.; Jeong, K.O.; Shin, H.C. Impact Analysis of Weather Condition and Locational Characteristics on the Usage of Public Bike Sharing System. J. Korean Soc. Transp. 2016, 34, 394–408. [Google Scholar] [CrossRef]
  16. Faghih-Imani, A.; Eluru, N.; El-Geneidy, A.M.; Rabbat, M.; Haq, U. How land-use and urban form impact bicycle flows: Evidence from the bicycle-sharing system (BIXI) in Montreal. J. Transp. Geogr. 2014, 41, 306–314. [Google Scholar] [CrossRef]
  17. Tran, T.D.; Ovtracht, N.; d’Arcier, B.F. Modeling bike sharing system using built environment factors. Procedia CIRP 2015, 30, 293–298. [Google Scholar] [CrossRef]
  18. Mateo-Babiano, I.; Bean, R.; Corcoran, J.; Pojani, D. How does our natural and built environment affect the use of bicycle sharing? Transp. Res. Part A Policy Pract. 2016, 94, 295–307. [Google Scholar] [CrossRef]
  19. Corcoran, J.; Li, T.; Rohde, D.; Charles-Edwards, E.; Mateo-Babiano, D. Spatio-temporal patterns of a Public Bicycle Sharing Program: The effect of weather and calendar events. J. Transp. Geogr. 2014, 41, 292–305. [Google Scholar] [CrossRef]
  20. Gebhart, K.; Noland, R.B. The impact of weather conditions on bikeshare trips in Washington, DC. Transportation 2014, 41, 1205–1225. [Google Scholar] [CrossRef]
  21. Puello, L.L.P.; Geurs, K. Modelling observed and unobserved factors in cycling to railway stations: Application to transit oriented developments in the Netherlands. Eur. J. Transp. Infrastruct. Res. 2015, 15, 27–50. [Google Scholar]
  22. Fuller, D.; Sahlqvist, S.; Cummins, S.; Ogilvie, D. The impact of public transportation strikes on use of a bicycle share program in London: Interrupted time series design. Prev. Med. 2012, 54, 74–76. [Google Scholar] [CrossRef]
  23. García-Palomares, J.C.; Gutiérrez, J.; Latorre, M. Optimizing the location of stations in bike-sharing programs: A GIS approach. Appl. Geogr. 2012, 35, 235–246. [Google Scholar] [CrossRef]
  24. Fishman, E.; Washington, S.; Haworth, N. Bike share: A synthesis of the literature. Transp. Rev. 2013, 33, 148–165. [Google Scholar] [CrossRef]
  25. Wang, X.; Lindsey, G.; Schoner, J.E.; Harrison, A. Modeling bike share station activity: Effects of nearby businesses and jobs on trips to and from stations. arXiv 2022, arXiv:2207.10577. [Google Scholar] [CrossRef]
  26. Midgley, P. The role of smart bike-sharing systems in urban mobility. Journeys 2009, 2, 23–31. [Google Scholar]
  27. Shang, W.-L.; Chen, J.; Bi, H.; Sui, Y.; Chen, Y.; Yu, H. Impacts of COVID-19 pandemic on user behaviors and environmental benefits of bike sharing: A big-data analysis. Appl. Energy 2021, 285, 116429. [Google Scholar] [CrossRef]
  28. Xing, Y.; Wang, K.; Lu, J.J. Exploring travel patterns and trip purposes of dockless bike-sharing by analyzing massive bike-sharing data in Shanghai, China. J. Transp. Geogr. 2020, 87, 102787. [Google Scholar] [CrossRef]
  29. Scarano, A.; Aria, M.; Mauriello, F.; Riccardi, M.R.; Montella, A. Systematic literature review of 10 years of cyclist safety research. Accid. Anal. Prev. 2023, 184, 106996. [Google Scholar] [CrossRef] [PubMed]
  30. McBain, C.; Caulfield, B. An analysis of the factors influencing journey time variation in the cork public bike system. Sustain. Cities Soc. 2018, 42, 641–649. [Google Scholar] [CrossRef]
  31. Sathishkumar, V.E.; Cho, Y. Season-wise bike sharing demand analysis using random forest algorithm. Comput. Intell. 2020, 1–26. [Google Scholar] [CrossRef]
  32. Fournier, N.; Christofa, E.; Knodler, M.A., Jr. A sinusoidal model for seasonal bicycle demand estimation. Transp. Res. D Transp. Environ. 2017, 50, 154–169. [Google Scholar] [CrossRef]
  33. Haque, M.A.; Yamamoto, S.S.; Malik, A.A.; Sauerborn, R. Households’ perception of climate change and human health risks: A community perspective. Environ. Health 2012, 11, 1. [Google Scholar] [CrossRef]
  34. Zhao, J.; Wang, J.; Xing, Z.; Luan, X.; Jiang, Y. Weather and cycling: Mining big data to have an in-depth understanding of the association of weather variability with cycling on an off-road trail and an on-road bike lane. Transp. Res. Part A Policy Pract. 2018, 111, 119–135. [Google Scholar] [CrossRef]
  35. McQueen, J. Some methods for classification and analysis of multivariate observations. In Proceedings of the 5th Berkeley Symposium on Mathematical Statistics and Probability, Statistical Laboratory, University of California, Berkeley, CA, USA, 21 June–18 July 1965 and 27 December 1965–7 January 1966; Le Cam, L.M., Neyman, J., Eds.; University of California Press: Durham, NC, USA, 1967; pp. 281–297. [Google Scholar]
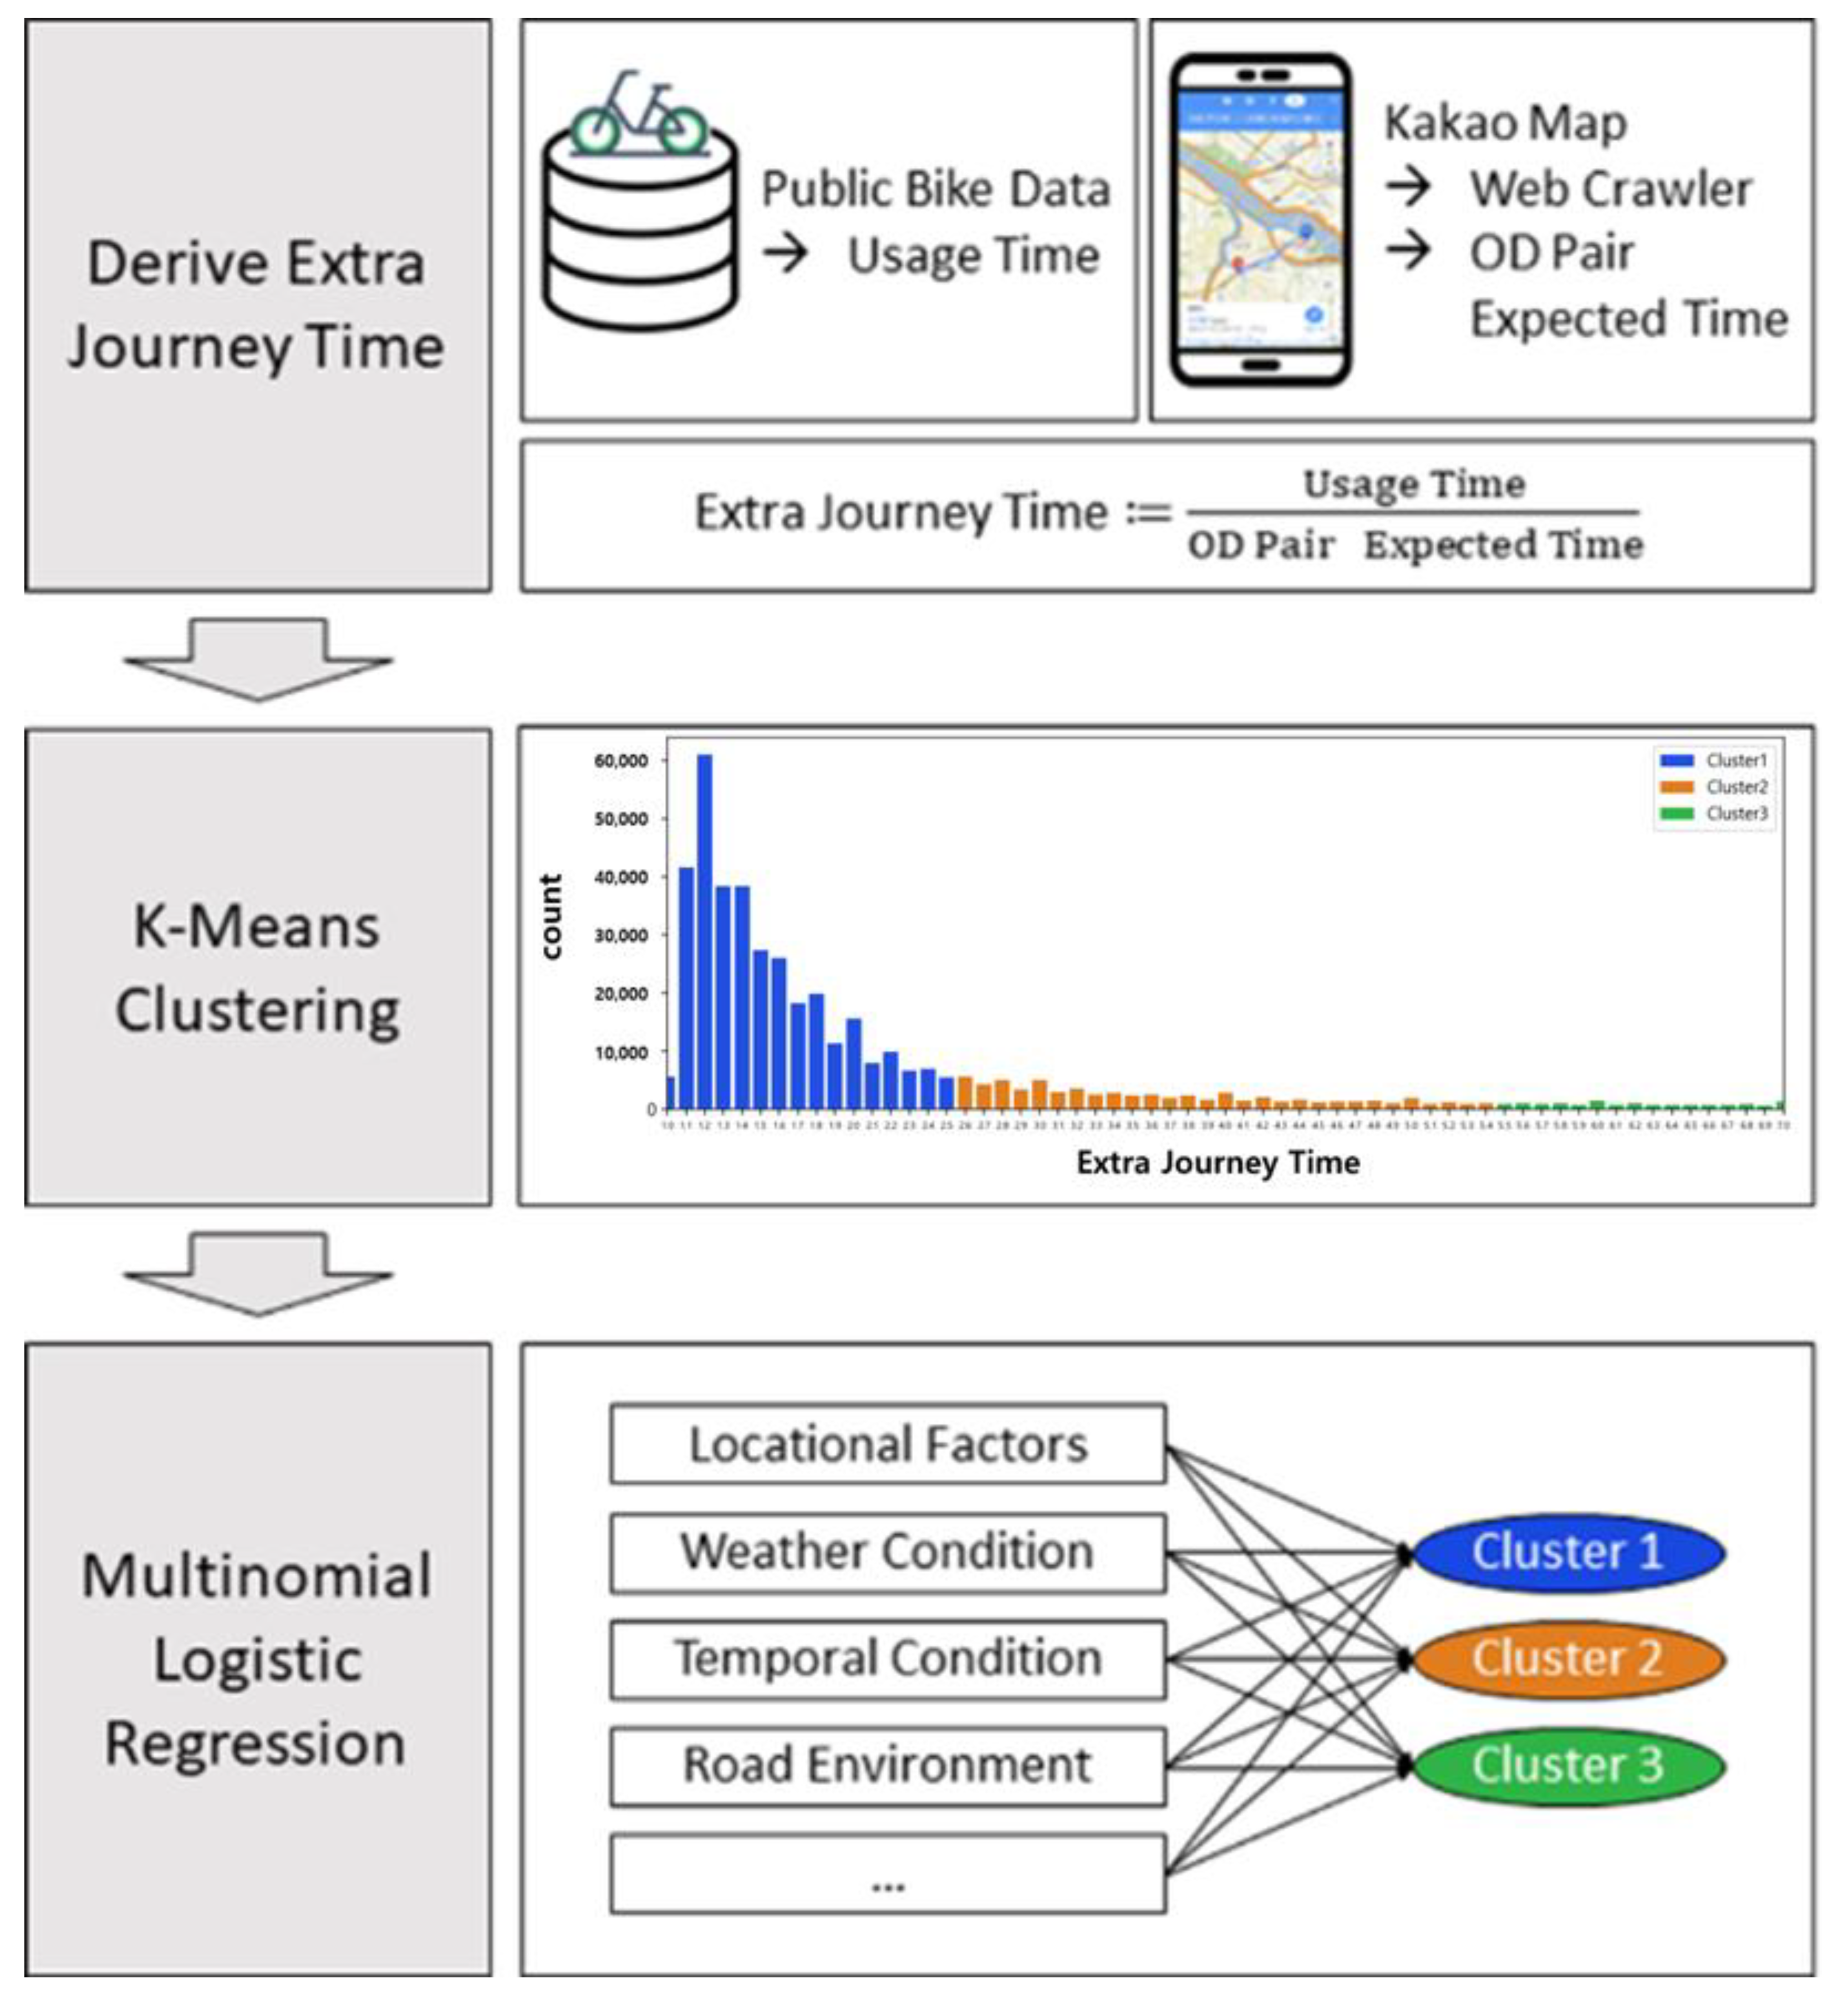
Figure 1. Analysis framework.
Sustainability 15 13804 g001
Figure 2. Graph showing the relationship between the number of clusters and SSE. The elbow method was used to determine the optimum number of clusters.
Sustainability 15 13804 g002
Figure 3. Extra journey time distribution.
Sustainability 15 13804 g003
Figure 4. Daily usage of public bikes.
Sustainability 15 13804 g004
Figure 5. Weekday public bike usage pattern.
Sustainability 15 13804 g005
Figure 6. Spatial usage patterns of public bikes.
Sustainability 15 13804 g006
Table 1. Example data for public bicycles in Seoul.
Bike No.Rental InformationReturn InformationUsage Time
(min)
Trip
Distance
(m)
DateStation No.Station NameDateStation No.Station Name
SPB-103243 July 2018 12:48215Yeouido High School3 July 2018 13:03209Building of Eugene Investment Co.141640
SPB-176383 July 2018 13:21212Exit 1 of Yeouido Subway Station3 July 2018 13:32212Exit 1 of Yeouido Subway Station101160
SPB-068863 July 2018 13:23260Yeouido Marina Quay3 July 2018 13:35206Yeouido KBS101600
Table 2. Variables and data sources.
VariablesDescriptionSource
Usage
Factors
Station Size Start/EndNumber of rental/return station standsSeoul public bike rental history (2018)
OD-Pair Station Distance (m)Straight distance in latitude and longitude to the rental/return station
Usage Distance (m)User’s actual distance to the rental/return station
Speed (km/h)Average riding speed of the bike to the rental/return station
DayTime of use of public bikes in rental stations (weekdays/weekend)
TOD
(Time of Day)
AM peak (07:00–10:00), PM peak (18:00–21:00),
Interpeak (11:00–17:00), Off peak (22:00–06:00)
Location
Factors
Bike Priority RoadBike priority road within a 100 m radius of the rental stationSeoul open data plaza (2018)
Nearest Subway Dist. Start/End (m)Distance from the rental/return station to the nearest subway station
Restaurants Start/EndNumber of restaurants within 100 m of the rental/return stationBusiness information DB (2018)
Leisure Start/EndThe number of tour/entertainment/leisure shops within 100 m of the rental/return station
Weather
Factors
Temperature (°C)Hourly average temperatures in Yeongdeungpo-gu, SeoulWeather information DB (2018)
Rainfall (mm)Hourly average rainfall in Yeongdeungpo-gu, Seoul
Fine Dust (μg/m³)Daily average fine dust in Yeongdeungpo-gu, Seoul PM10
Table 3. Extra journey time classification.
Cluster 1Cluster 2Cluster 3
count339,17865,72427,893
mean1.53.67.4
std0.30.81.3
min0.02.65.5
max2.55.410.0
Table 4. Descriptive statistics.
Cluster 1Cluster 2Cluster 3
OD-Pair Station Distance (m)mean2728.482088.571006.62
std2422.511561.77651.23
Usage Distance (m)mean4153.575261.675167.34
std3940.454283.704109.02
OD-Pair Expected Time (min)mean16.3113.017.41
std21.217.803.54
Usage Time (min)mean24.5845.0753.31
std19.1025.6823.50
Table 5. Estimation results: multinomial logistic regression model.
Cluster 2Cluster 3
Const.−4.57 ***−8.65
Usage FactorsStation Size Start10–200.03 **0.01
>210.020.10 ***
(Ref.) < 10
Station Size End10–200.16 ***0.24 ***
>210.22 ***0.30 ***
(Ref.) < 10
OD-Pair Station Distance881–1621 m−1.81 ***−3.36 ***
1621–3152 m−3.62 ***−7.11 ***
>3152 m−5.99 ***−12.16 ***
(Ref.) < 881 m
Usage Distance1581–3120 m2.81 ***4.26 ***
3120–6140 m5.37 ***8.33 ***
>6140 m8.24 ***13.04 ***
(Ref.) < 1581 m
Speed<5 km/h5.14 ***8.00 ***
5–10 km/h1.48 ***2.66 ***
10–20 km/h−0.28 **0.18
(Ref.) > 20 km/h
DayWeekday−0.29 ***−0.22 ***
(Ref.) Weekend
TOD (Time of Day)AM and PM peak0.05 ***0.18 ***
Interpeak0.37 ***0.70 ***
(Ref.) Off peak
Location FactorsNearest Subway Start≤250 m0.16 ***0.16 ***
(Ref.) > 250 m
Nearest Subway End≤250 m0.12 ***0.06 ***
(Ref.) > 250 m
Restaurants Start10–34 shops−0.42 ***−0.35 ***
≥35 shops−0.41 ***−0.39 ***
(Ref.) < 10 shops
Restaurants End10–34 shops−0.36 ***−0.44 ***
≥35 shops−0.38 ***−0.44 ***
(Ref.) < 10 shops
Leisure Start≥1 shop0.10 ***0.11 ***
(Ref.) 0
Leisure End≥1 shop0.010.04 *
(Ref.) 0
Bike Priority RoadYes0.31 ***0.56 ***
(Ref.) No
Weather FactorsTemperature≤10 °C−0.12 ***−0.08 ***
≥33 °C−0.05 *−0.15 ***
(Ref.) 11–32 °C
Rainfall<10 mm0.020.03
≥10 mm−0.59−2.18 **
(Ref.) 0 mm
Fine dustPoor/Very poor−0.05 ***−0.07 ***
(Ref.) other
Model fit statistics (Ref.) is a reference term
The reference category is:Cluster 1 * This has a significance p-value < 0.10
Pseudo-R-squared:0.454Degrees of Freedom: 60** This has a significance p-value < 0.05
AIC:309,261BIC: 309,942*** This has a significance p-value < 0.01
Disclaimer/Publisher’s Note: The statements, opinions and data contained in all publications are solely those of the individual author(s) and contributor(s) and not of MDPI and/or the editor(s). MDPI and/or the editor(s) disclaim responsibility for any injury to people or property resulting from any ideas, methods, instructions or products referred to in the content.