Article

A Simulation Optimization Approach for Wetland Conservation and Management in an Agricultural Basin

Civil, Water and Environmental Engineering Faculty, Shahid Beheshti University, Tehran 1983969411, Iran
*
Author to whom correspondence should be addressed.
Sustainability 2023, 15(18), 13926; https://doi.org/10.3390/su151813926
Submission received: 15 July 2023 / Revised: 12 September 2023 / Accepted: 18 September 2023 / Published: 19 September 2023
(This article belongs to the Section Sustainable Water Management)

Abstract

:
Decreasing water quantity and growth in water demand have increased the competition between satisfying societal water needs and protecting ecosystem requirements. Wetlands are some of the most productive ecosystems on Earth. They provide various services to people’s livelihoods, in addition to being suitable habitats for many plant and wildlife species. However, wetlands are under threat of loss and degradation due to anthropogenic activities, particularly the diversion of water for irrigation. The flow regime is usually considered the most crucial ecological factor and a key component of wetland management. So, determining the allocation of environmental requirements is a main factor for managing, restoring, and protecting wetlands, and it is crucial to reach a compromise for optimal water allocation between different sectors. For this purpose, in this research, a new approach is developed to achieve the optimal environmental flow of the wetland in an agricultural-dominated basin using a combination of remote sensing and the simulation optimization method. Waterbirds and vegetation are used as bioindicators of wetland ecosystems. First, using remote sensing data and analyses, we obtained the interrelation between the wetland water regime, vegetation, and waterbird characteristics using different time series of Landsat spectral indices. Then, by employing the long-term simulation optimization (WEAP-MOPSO) model, the optimal e-flow of the wetland is evaluated in such a way that the suitable ecological condition of the wetland is achieved and the wetland is able to provide its functions and services.

1. Introduction

Balancing the supply of growing demand and protecting water ecosystems is one of the most important problems faced by water resource planners, especially in arid and semi-arid regions. The flow regime is regarded as a vital element in the conservation of water-related ecosystems [1]. Changes in the streamflow regime have led to the potential for significant threats and the collapse of many ecosystems worldwide [2]. Withdrawals of water for different demands, including agricultural and industrial, can decrease the amount of flow and change the timing of water regimes [3,4,5].
Wetlands provide a variety of ecosystem services to human livelihood and habitats for a wide diversity of animals and plants. The main reason for wetland loss and degradation is the disturbance of the streamflow for satisfying anthropic activities, especially agriculture demand, which causes the shortage of environmental flow [6,7]. Environmental flows (e-flows) are the water required to preserve ecosystems and the services they provide to human livelihoods. Wetlands are highly depend on the e-flow to maintain plant and wildlife habitats [8,9]. So, providing appropriate e-flow is a major factor for preserving and managing wetlands [5,10].
Despite progress in recent years regarding e-flow science, employing environmental water allocations, especially based on the ecological requirements of wetlands, in optimal water allocation and management has been limited [11,12]. In this research, a new approach is proposed to determine the optimal e-flow and management of the wetland in an agricultural basin, using a combination of remote sensing, a water resource allocation model, and multi-objective optimization.
E-flow is identified as the main component in creating the ecological status of floodplain wetlands because of its essential role in providing and maintaining plant and animal habitats [13,14]. As a main component of wetlands, vegetation has a pivotal role in the ecological services and functions of the wetlands [15,16]. Wetland vegetation is a very good indicator of ecological conditions for a variety of causes, such as their high species richness, fast growth rates, and rapid response to environmental conditions [17,18]. The productivity and growth of wetland plants have a vital ecological response to flow regimes and stand for ecosystem health and can be associated with numerous other ecosystem services [19]. Understanding how wetland vegetation is impacted by water regimes and the interrelations between vegetation condition and e-flow can be employed in wetland effective management and the allocation of appropriate e-flow [20].
Climatic or human-related parameters that affect wetland plants can also have an impact on wetland birds and wildlife habitats [21]. The hydrological conditions of floodplain wetlands are among the most significant factors that can influence the distribution of waterbirds (abundance and distribution) because they affect their habitat and food availability [22,23]. Waterfowl are excellent indicators of environmental changes in aquatic ecosystems [24,25]. Waterbird abundance is highly correlated with the accessibility of suitable habitats [26,27], including food availability [28,29], adequate habitat size and structure [30], and required water level [31]. Between these circumstances, the availability of food and water flow regimes are considered the most crucial parameters that affect the abundance and distribution of waterfowl [32,33]. These two factors (vegetation and waterbirds) are used as indicators to measure the ecological health and conditions of the wetland concerning the hydrological changes (e-flow rate) of the wetland.
Since wetlands are usually located in remote areas and it is hard to access and survey them, traditional approaches to assessing and monitoring, such as field sampling and surveys, are normally labor-intensive, costly, time-consuming, and often cannot detect changes in wetland areas [34]. Satellite images with wide spatial coverage and high time intervals are a good option for mapping and monitoring wetlands. Digital image processing of satellite data prepares adequate tools for image analysis using different indexes and algorithms [35].
For monitoring vegetation changes, the Normalized Difference Vegetation Index (NDVI) is used. The NDVI is considered to be one of the most accurate measures of vegetation indices. NDVI is an efficient index for the spatiotemporal monitoring of vegetation and has been employed broadly to represent the attributes of vegetation growth, density and coverage [36], and health or greenness [37]. In addition to the fact that NDVI shows the status of vegetation, it can demonstrate the availability of food for waterbirds [38]. Therefore, the use of remote sensing to map wetland vegetation conditions is substantial for biodiversity conservation and the assessment of suitable habitat conditions for wintering waterbirds.
The habitat conditions of waterbirds are dependent on the water area and depth of the wetland. For this reason, monitoring wetland water resources and their changes is very important. Monitoring open water bodies is among the major implementations of remote sensing. Different monitoring methods have been employed for water extraction from remotely sensed imagery. The Normalized Difference Water Index (NDWI) and Modified Normalized Difference Water Index (MNDWI) are among the most accurate and accepted methods [39] that are used in this study to extract the water area of the wetland.
The primary goal of this research is to analyze the wide range of satellite images to reach a time series of wetland indices for mapping wetlands and finding a relation between wetland hydrological and ecological conditions and determining optimal environmental water allocation for wetland conservation. The proposed approach in this paper is capable of representing the changes in vegetation and waterbirds’ condition based on wetland characteristics (NDVI and open water bodies extract indexes) and linking the remote sensing results with the simulation optimization framework to estimate the e-flow and tend toward a more sustainable and optimal management of wetlands in an agricultural basin.
Water evaluation and planning (WEAP) is used to allocate water at the catchment between various demand sectors. The model uses a linear optimization algorithm for water allocation between the different demand sites at each time step. The WEAP is linked to the well-known multi-objective particle swarm optimization (MOPSO) for sustainable management of the basin and achieving the best compromise between agriculture and the environment. The monthly e-flows of the wetland are decision variables of the optimization problem. The objective functions are to maximize the utility function of the wetland based on vegetation and waterbird conditions and to minimize the deficit of agriculture demands.

2. Methods

2.1. Case Study

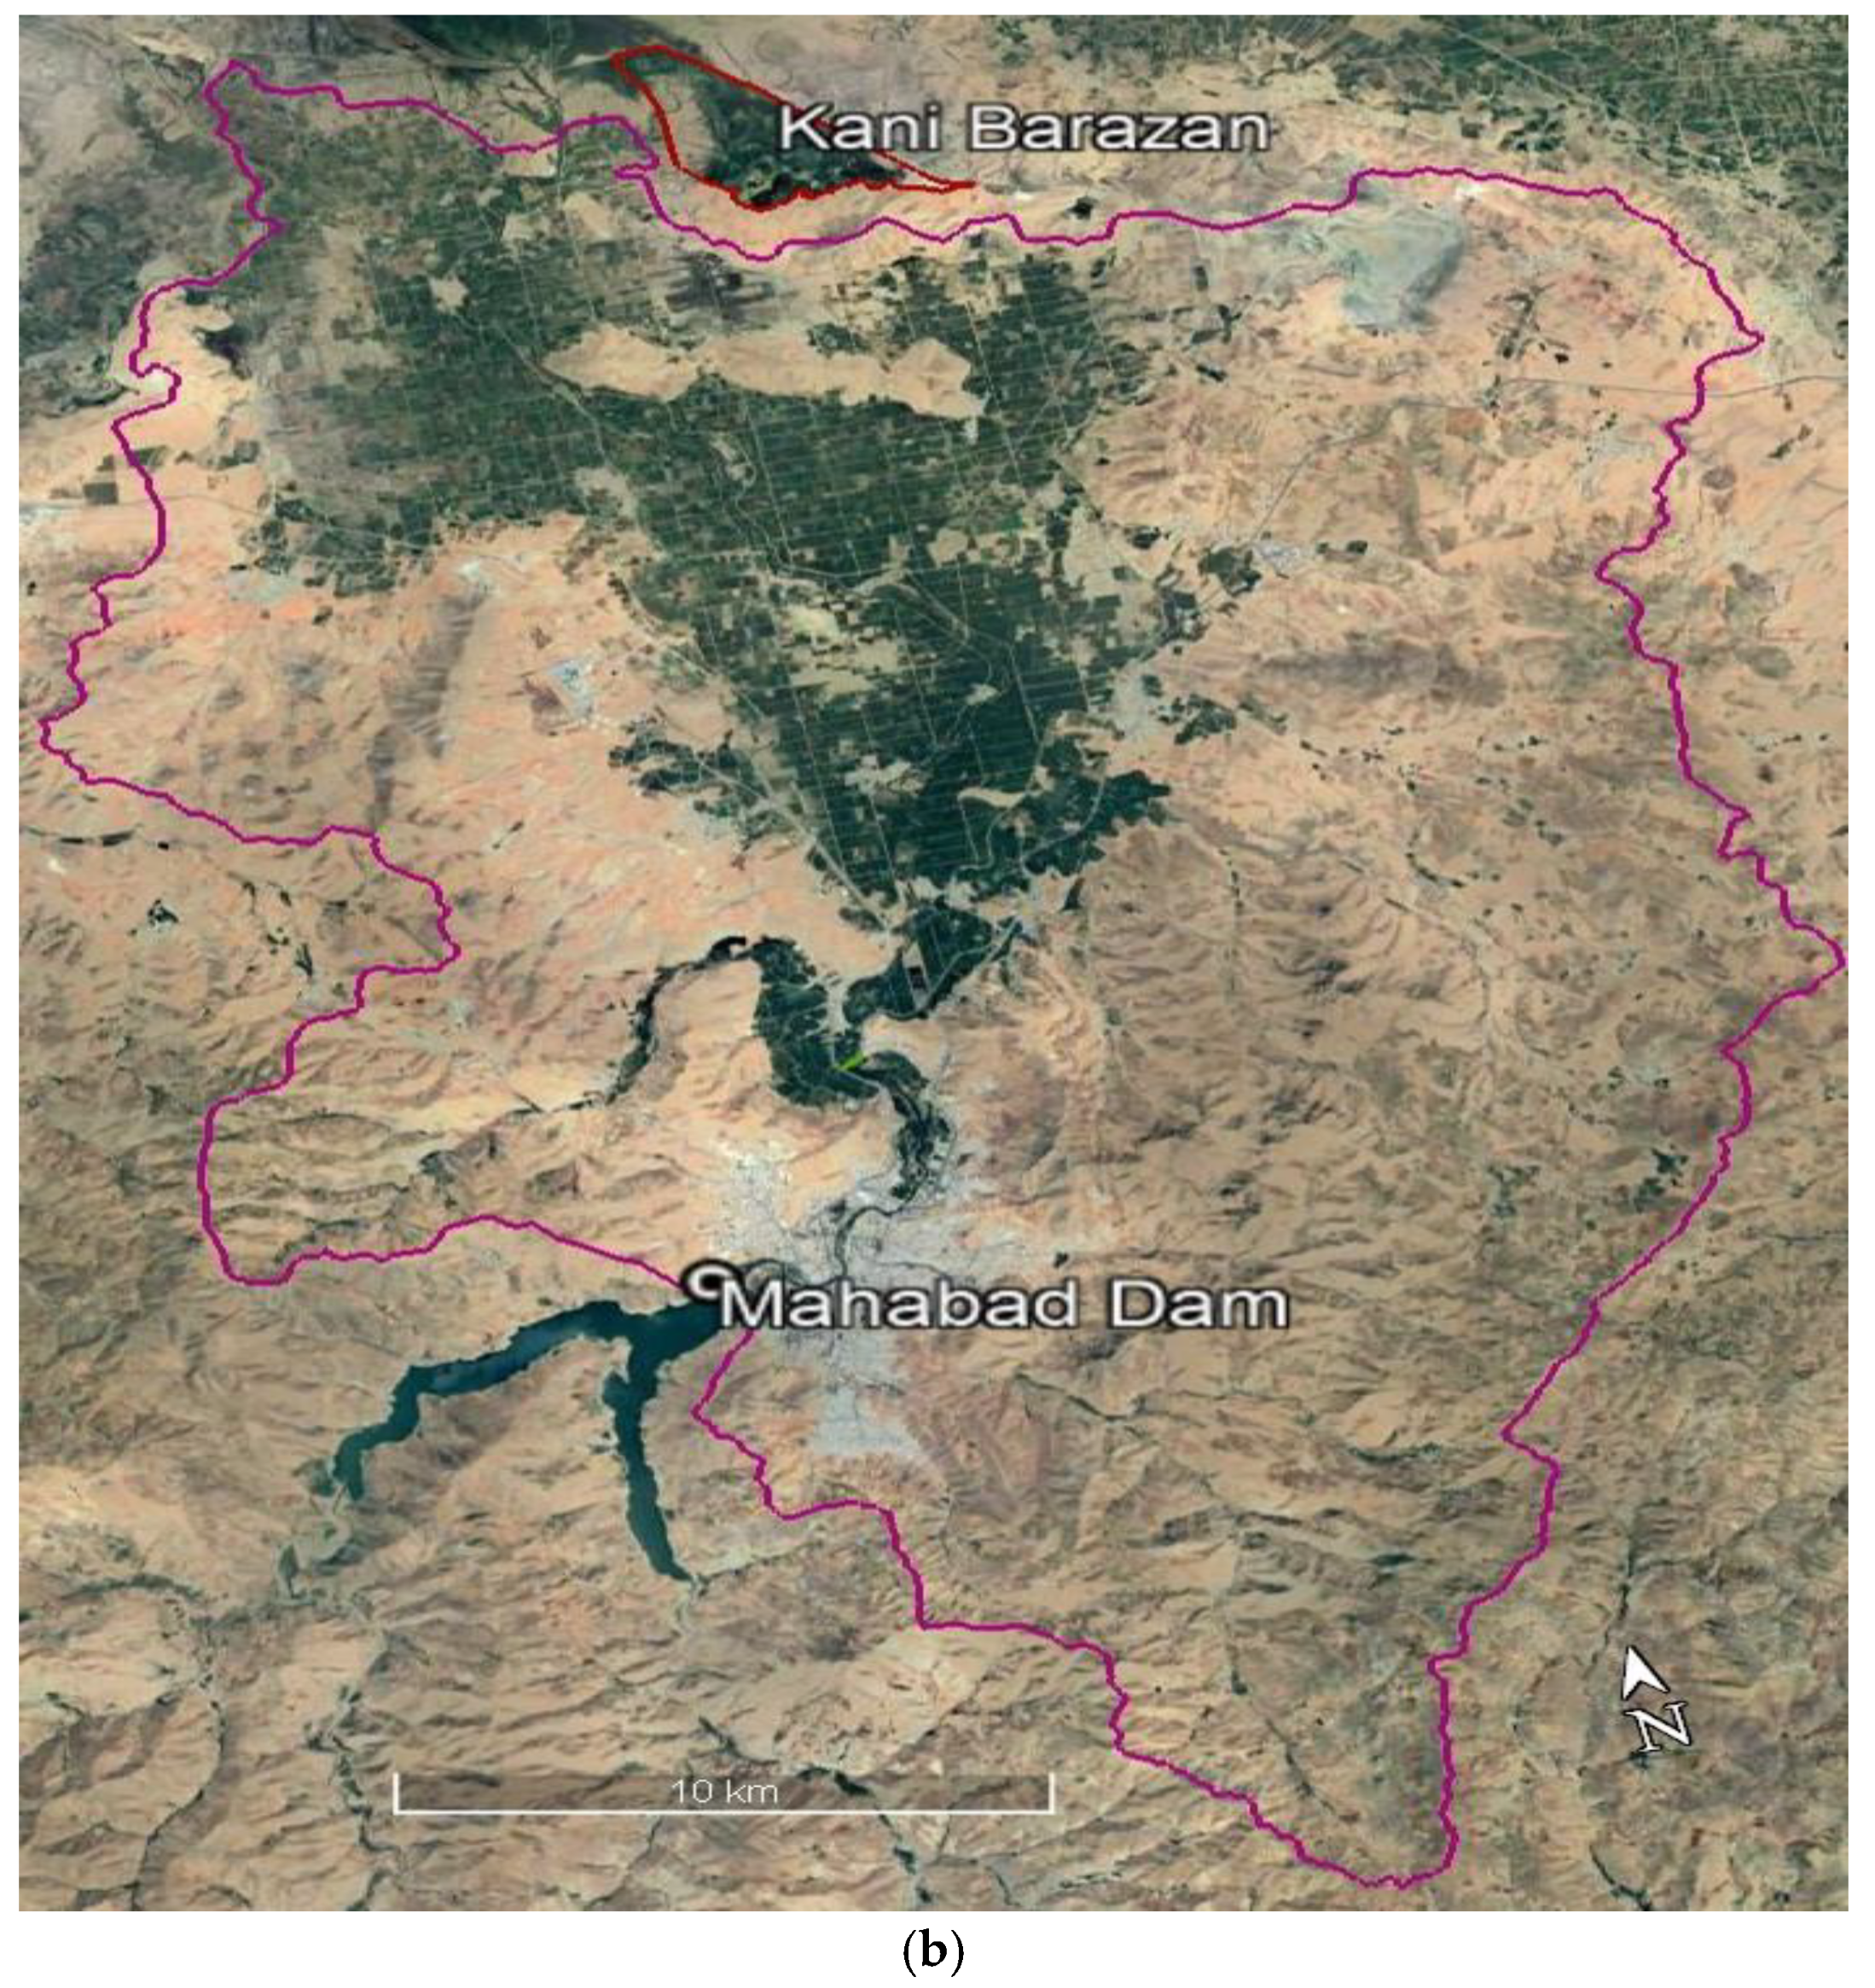
Mahabad basin is located in West Azerbaijan province in northwestern Iran. The Mahabad basin and its location in Iran are illustrated in Figure 1.
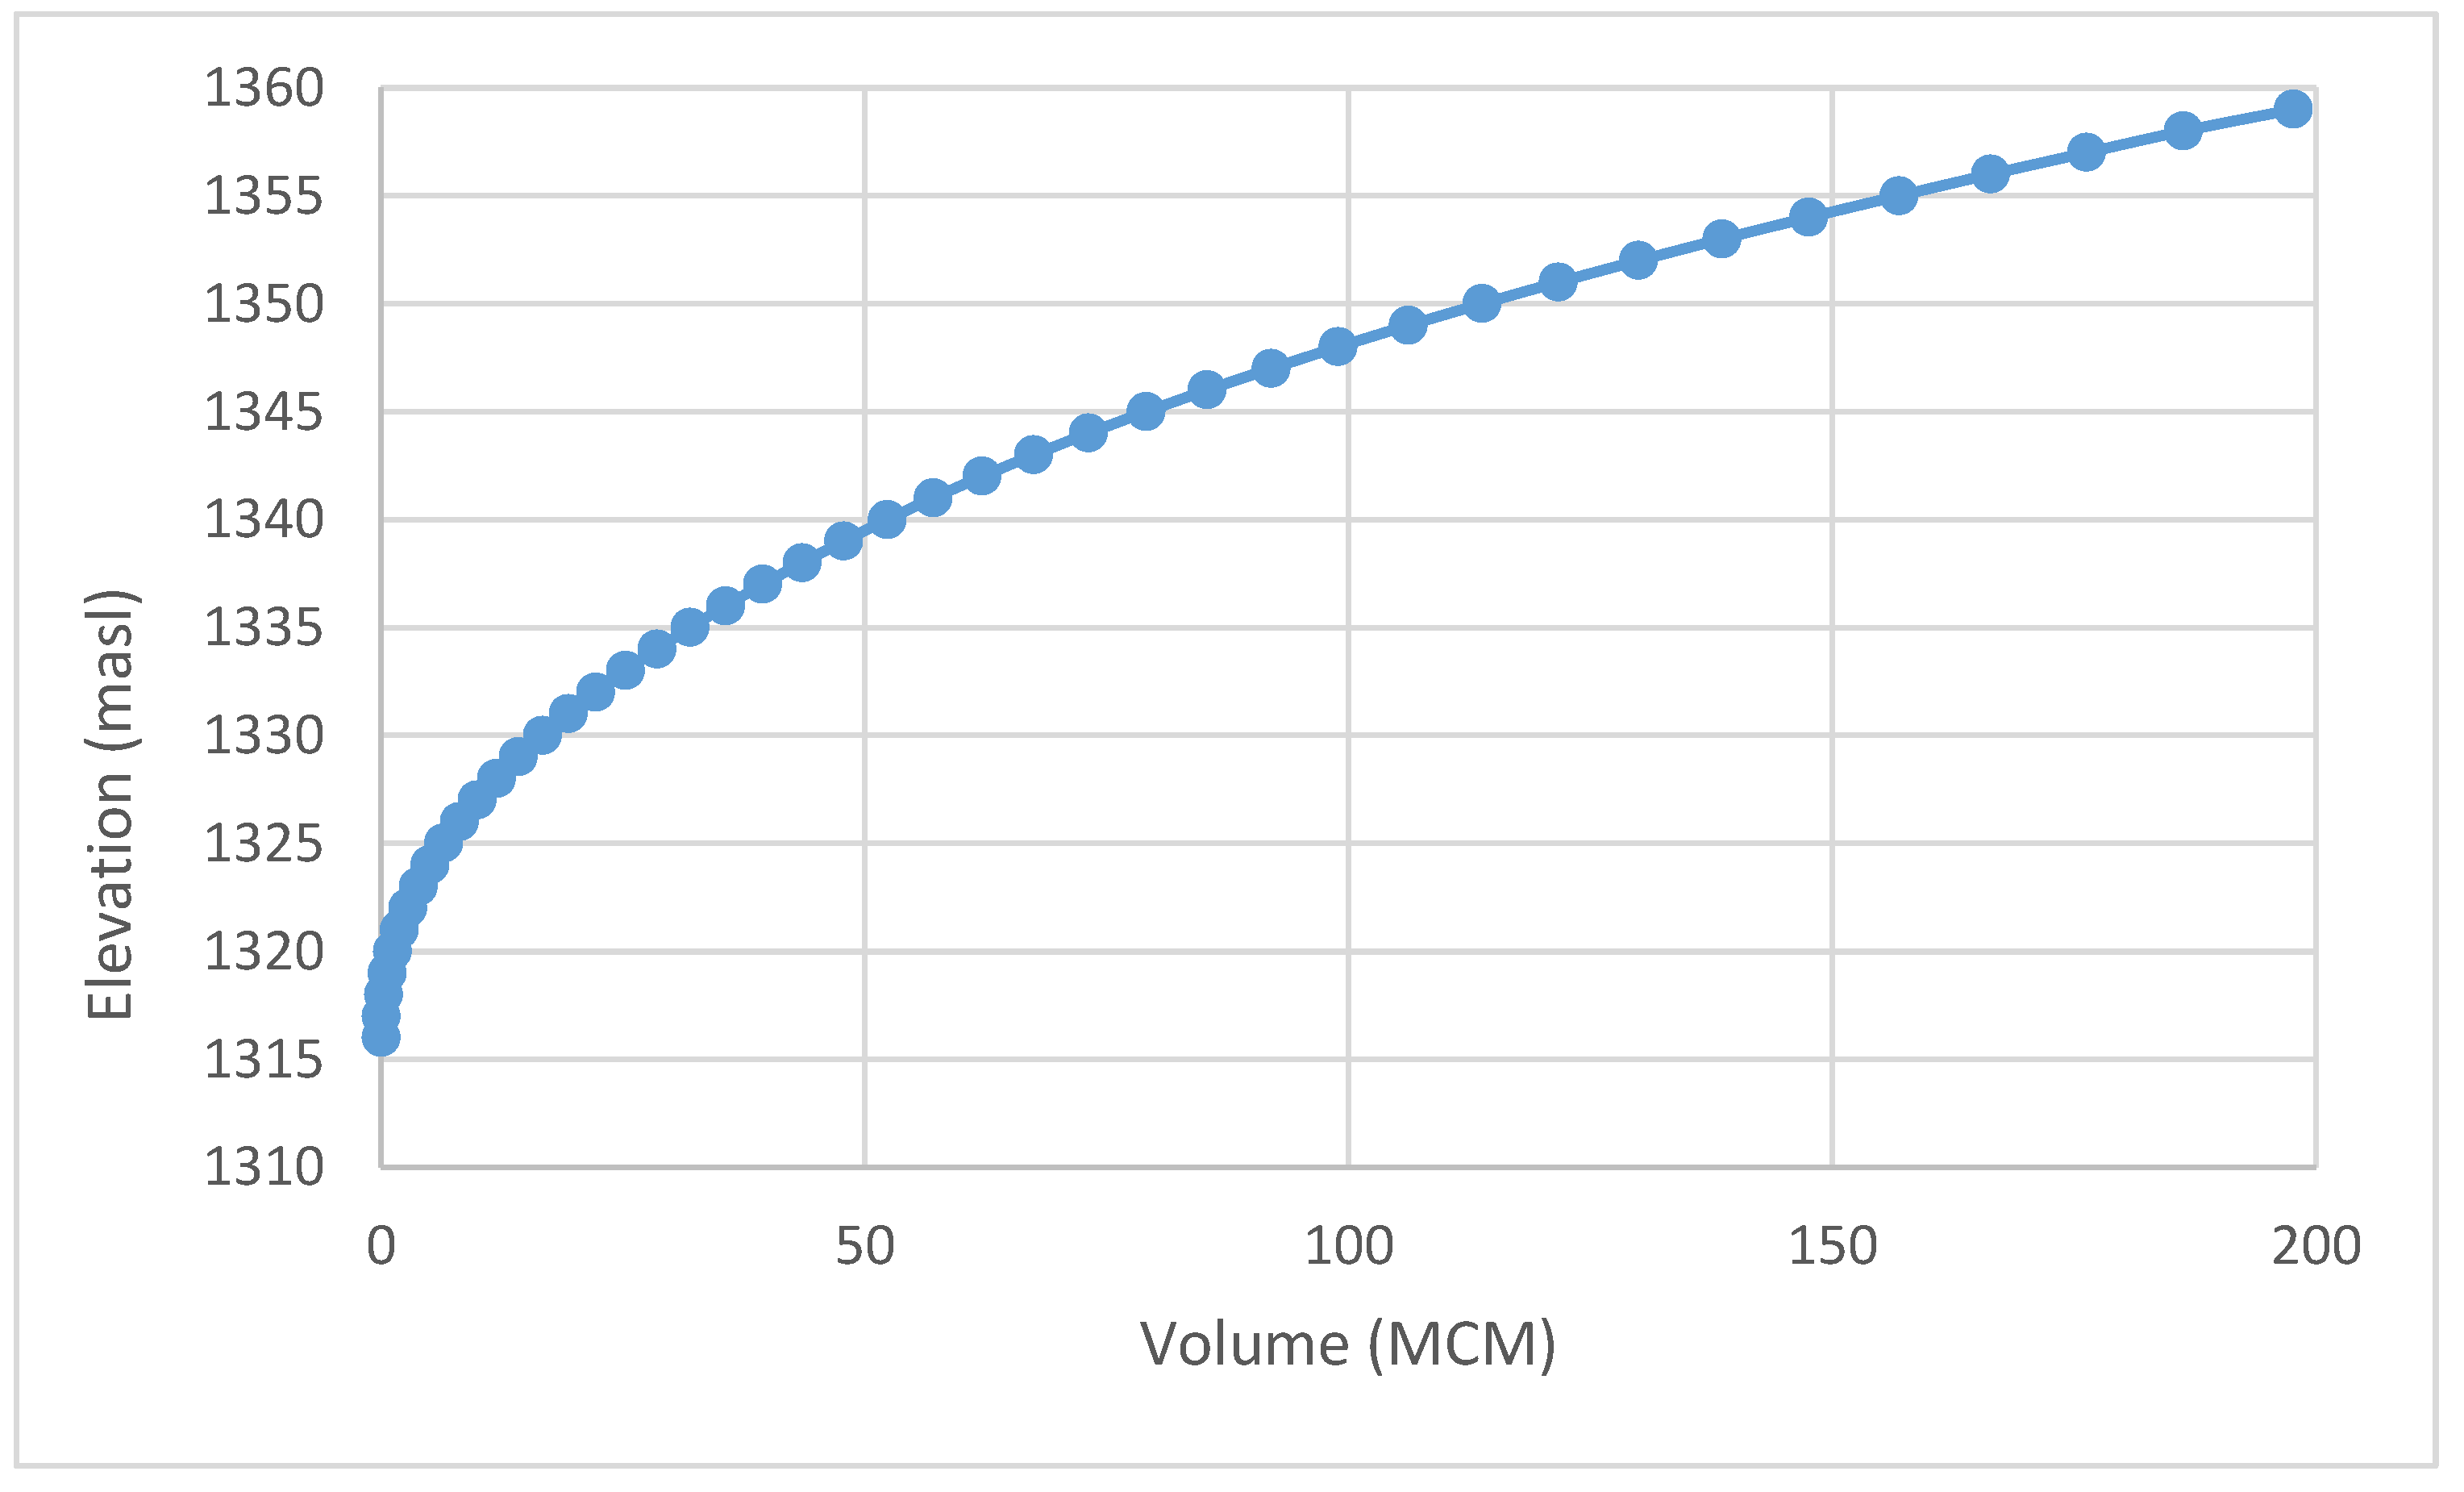
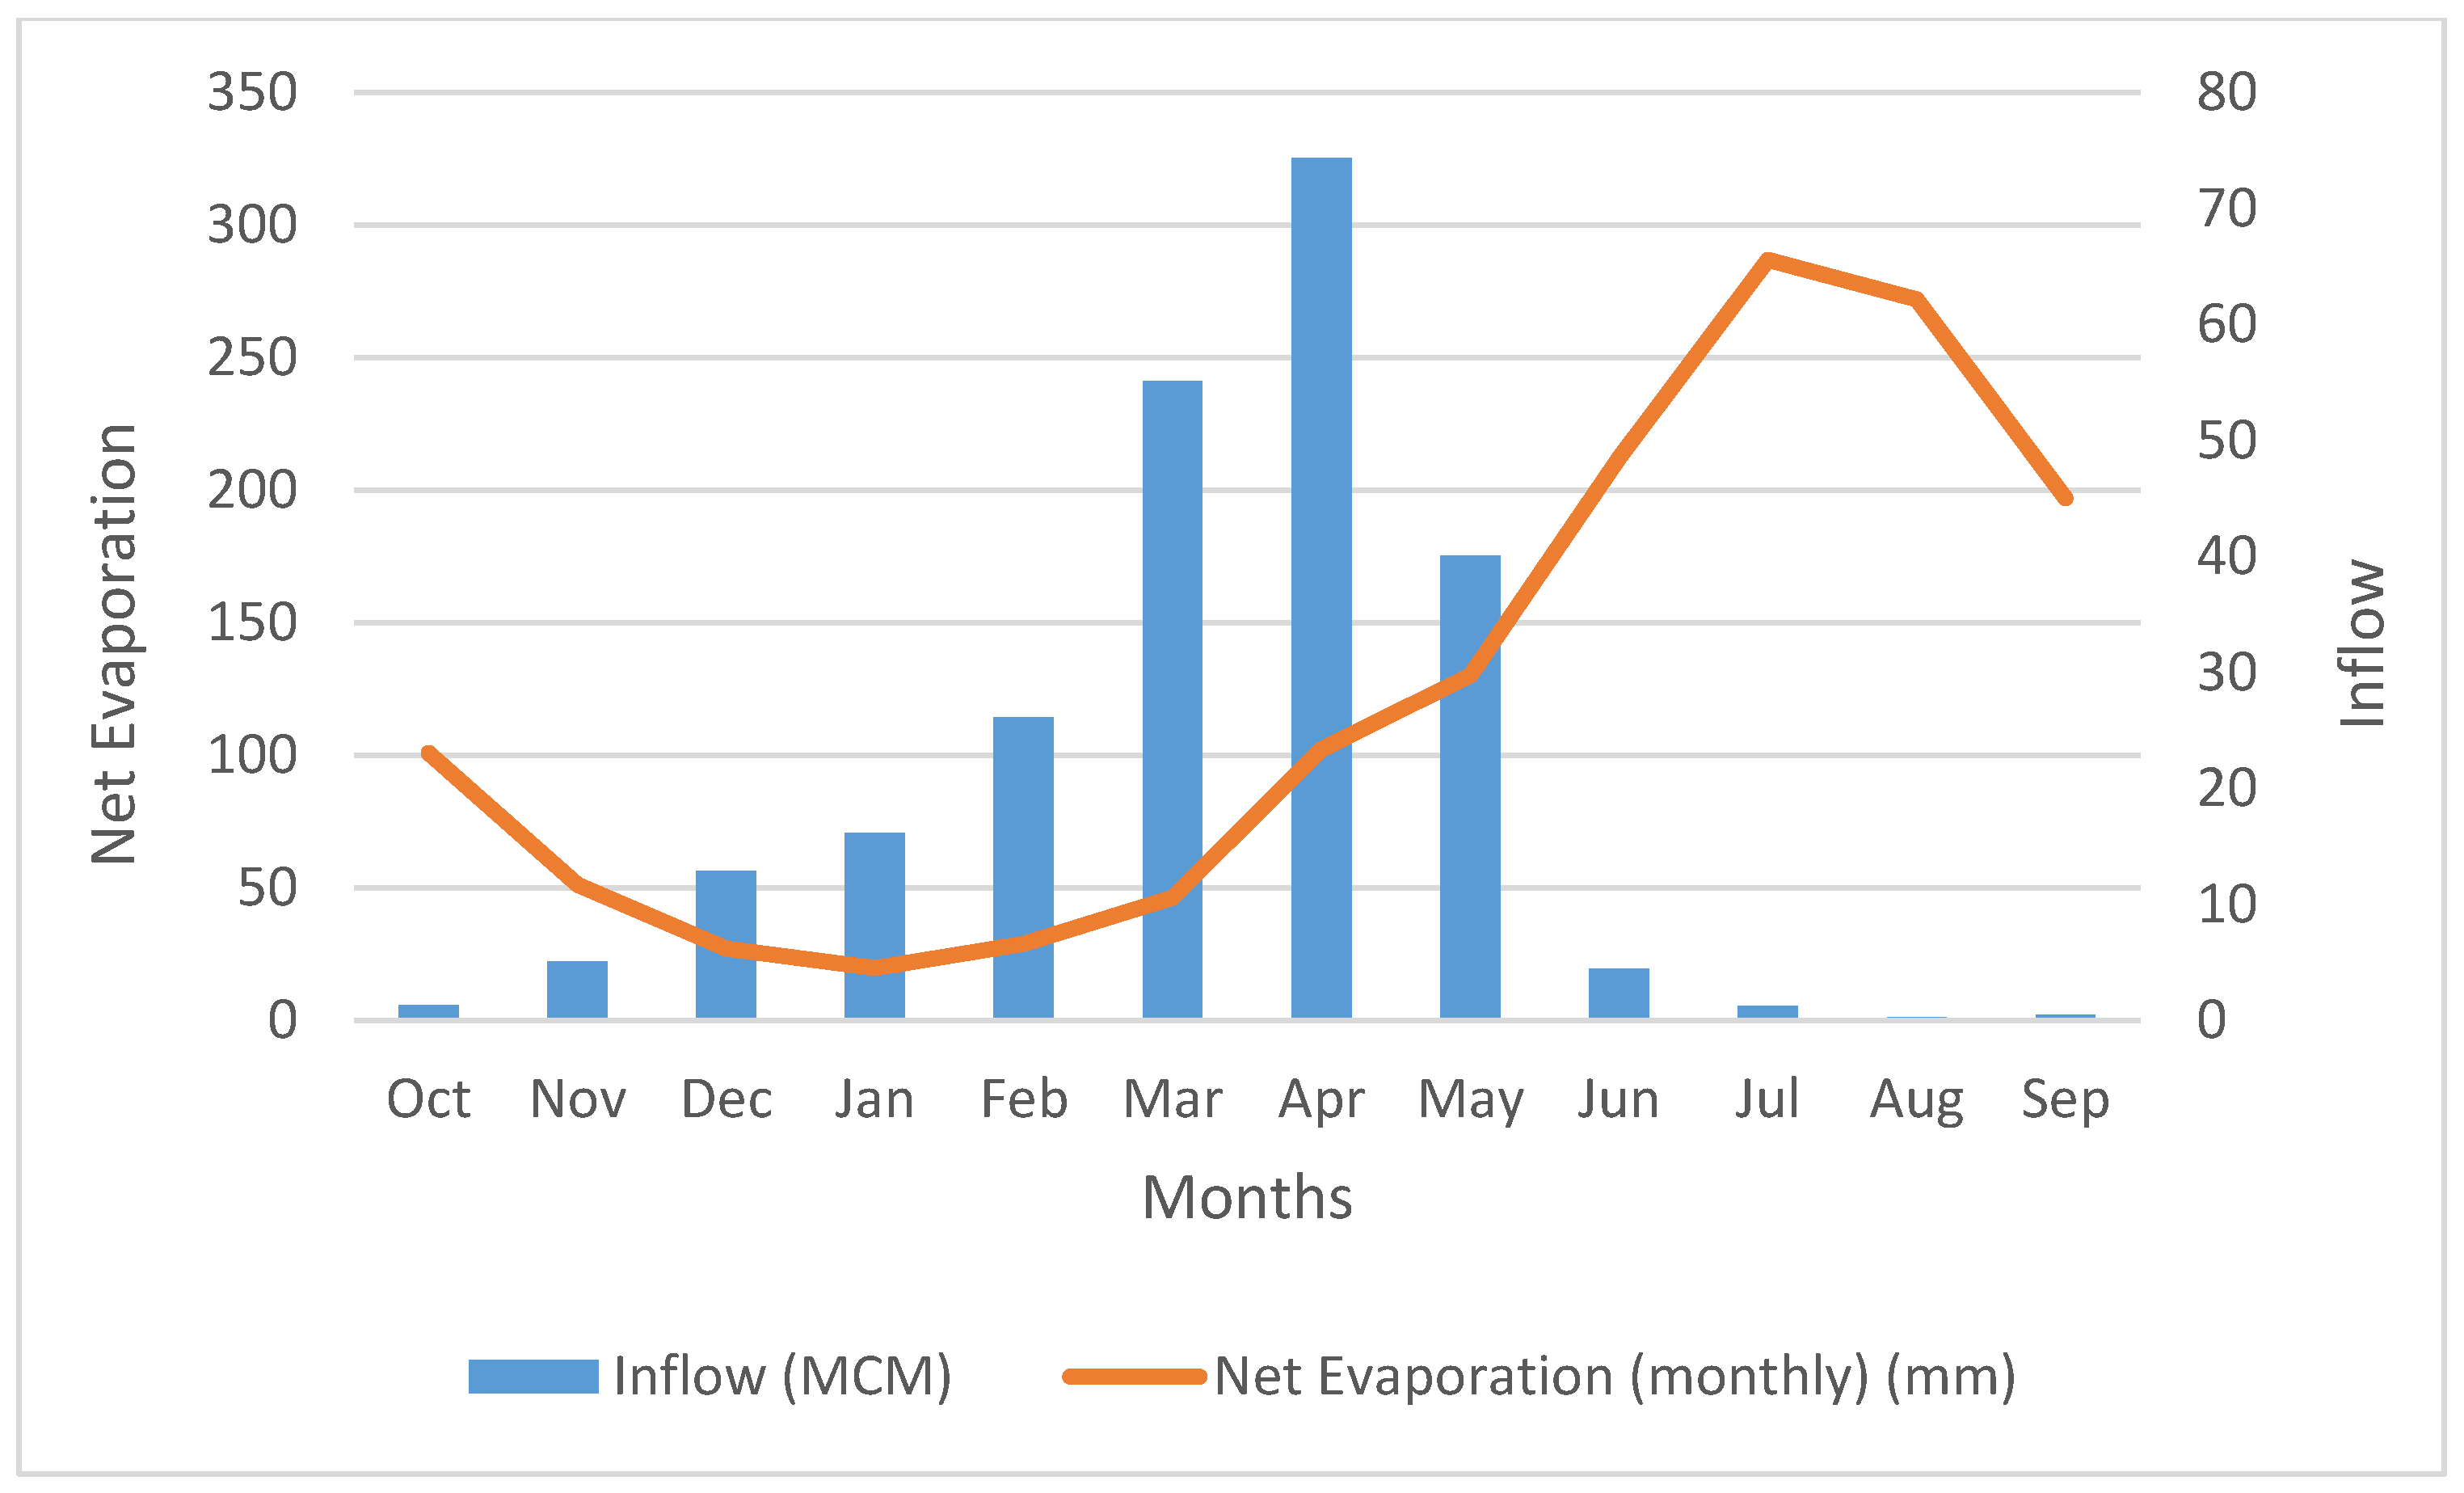
Mahabad reservoir is on the Mahabad river, and this dam regulates water for downstream demands, such as irrigated area and domestic and industry demands. The volume–elevation curve of the Mahabad dam reservoir is demonstrated in Figure 2 and Figure 3, showing the monthly inflow to the reservoir and evaporation of Mahabad dam.
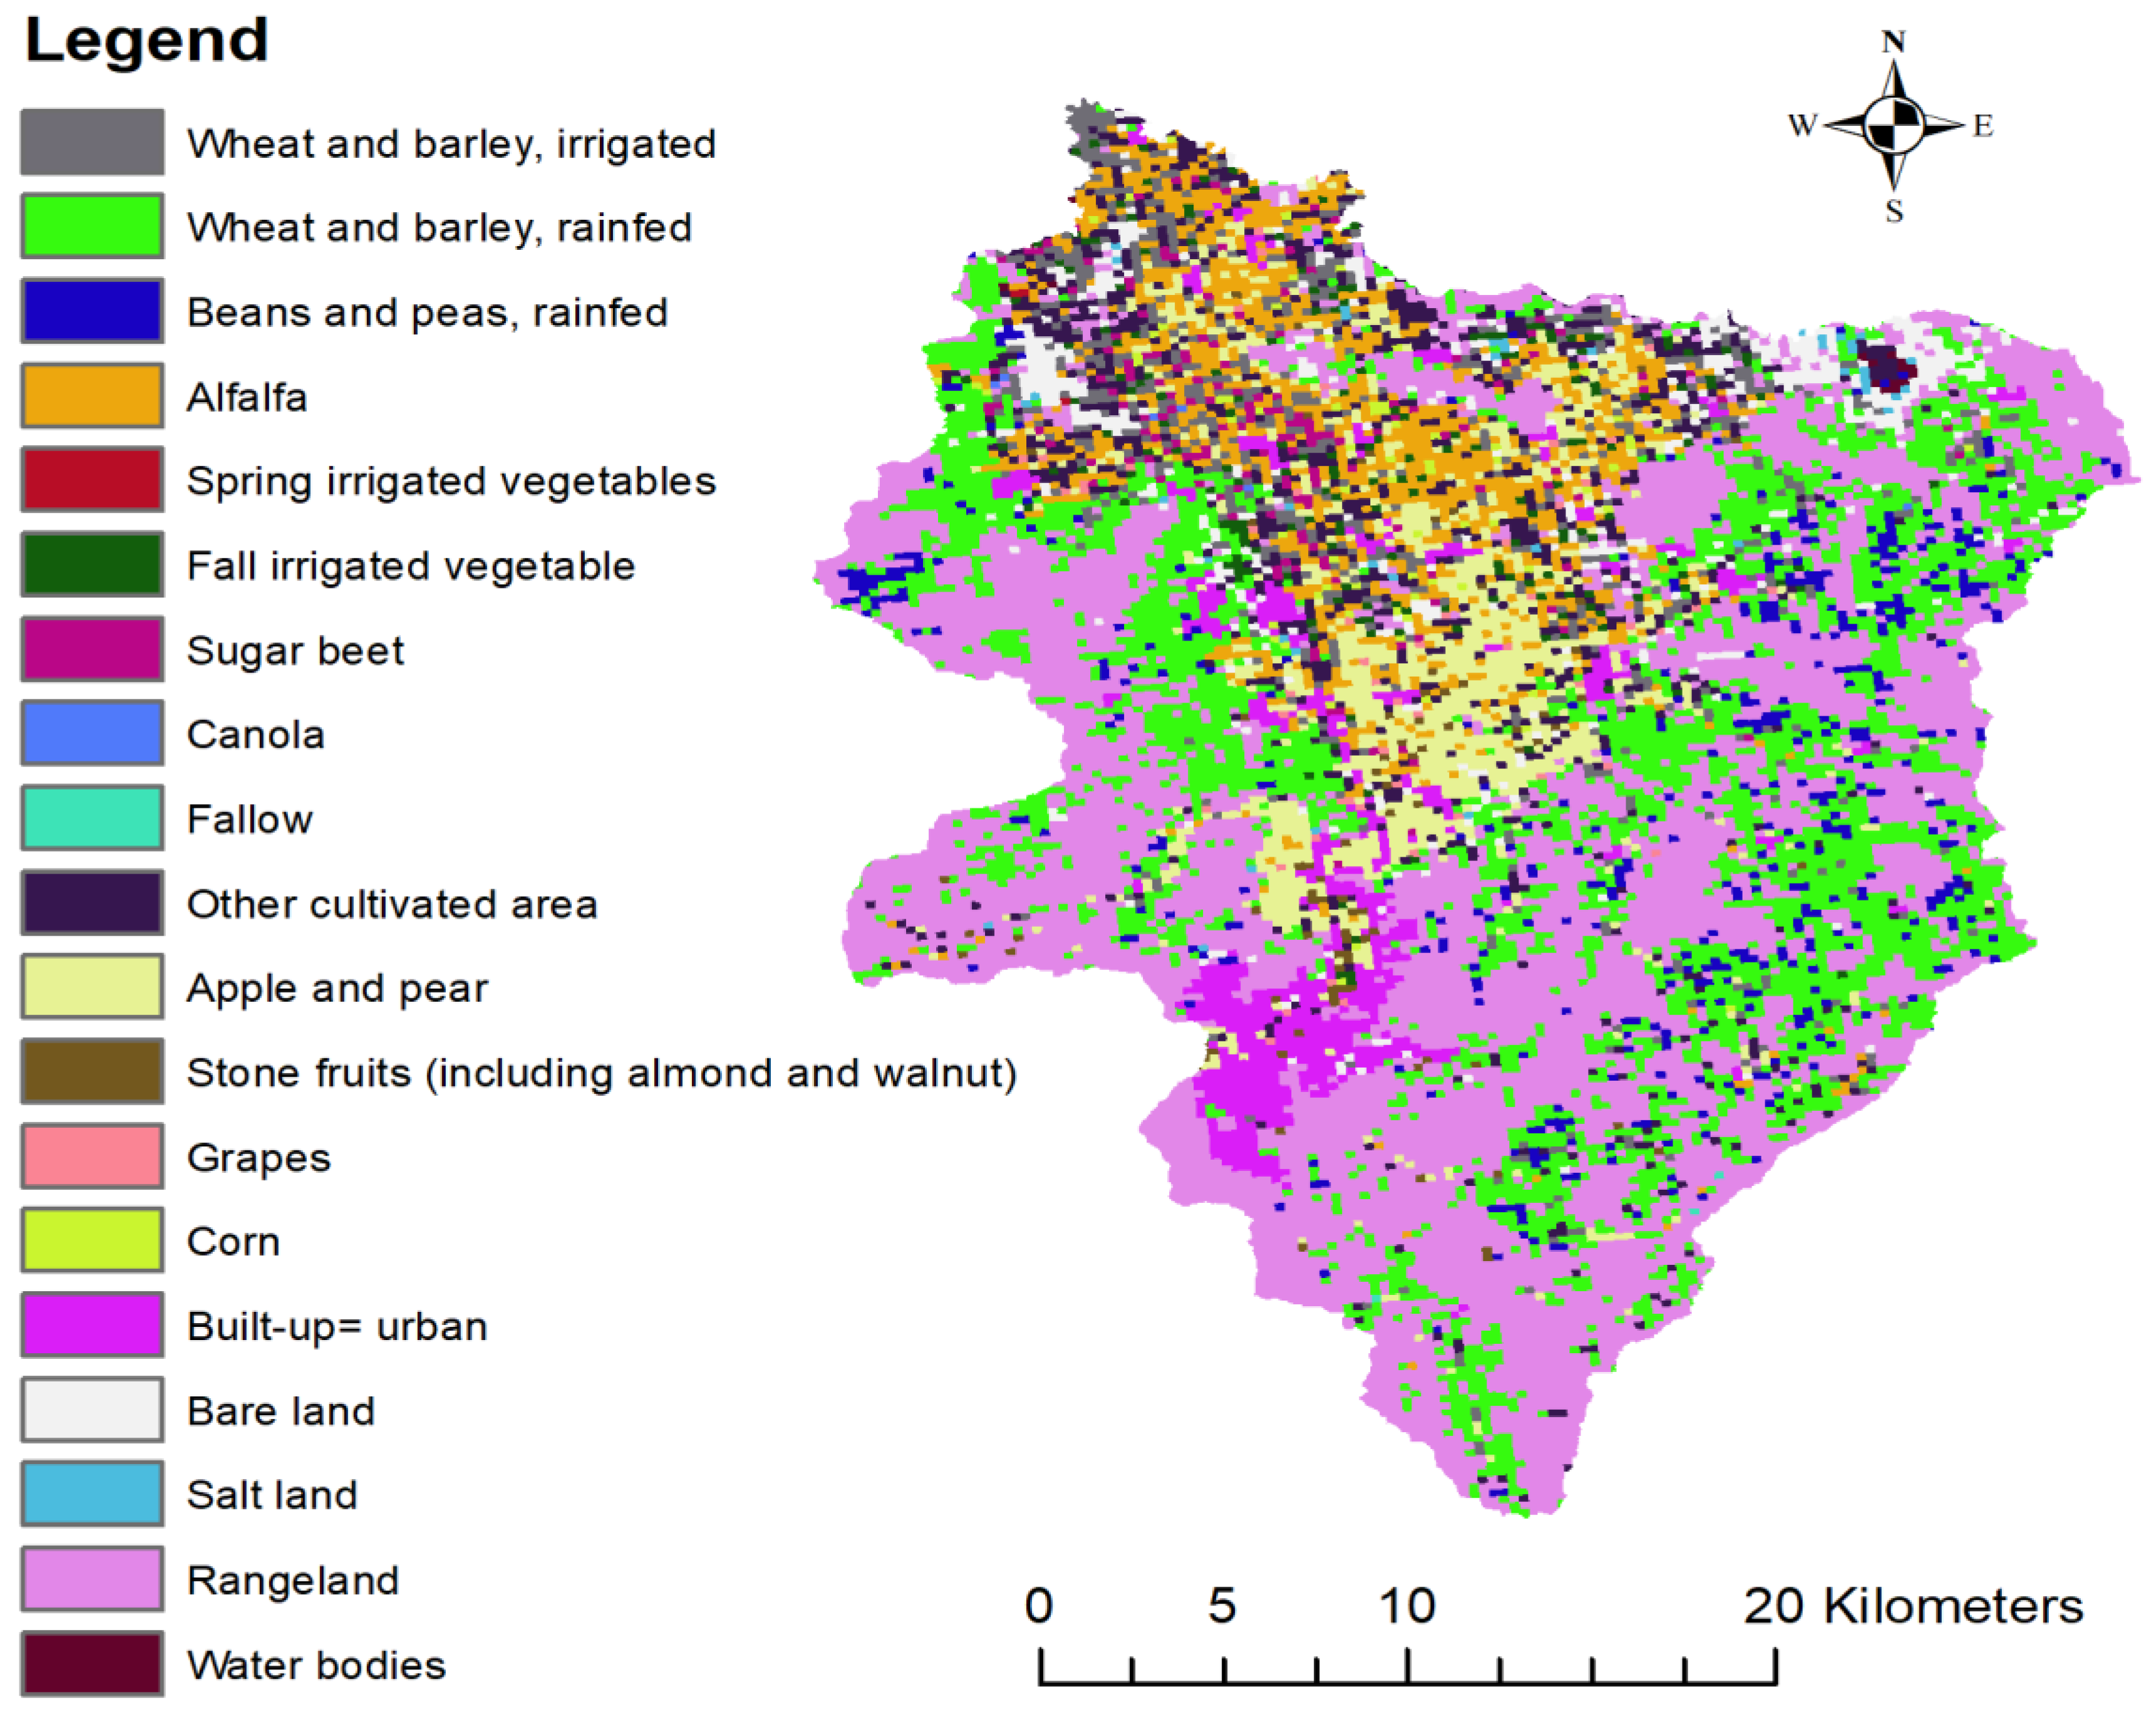
The urban and industrial demands of the basin have constant values and are equal to 18.9 and 5.2 million cubic meters, respectively. Figure 4 shows a land use map of the Mahabad dam downstream. The most important irrigated crops in this region include wheat, alfalfa, sugar beet, corn, apples, grapes, walnuts, and almonds.
Kani Brazan wetland is located in the northern part of the Mahabad River basin, south of Urmia Lake, and has an area of about 927 hectares. Kani Brazan Wetland is under the management of The Iranian Department of Environment and is protected under the title of Kani Brazan Wildlife Sanctuary. Kani Brazan is a Ramsar site and is considered the first bird-watching site in Iran. It provides a valuable habitat for numerous bird species, especially wintering waterfowl. According to a study by the Iranian Department of Environment, 75 species of waterbirds exist in the wetland region, and it contains a considerable range of wetland plant communities [40]. This wetland has abundant vegetation, especially in the middle of spring and summer, and it forms diverse and vast habitats for birds, including open water with different depths, reeds, dense masses of Typha latifolia, and shallow and wide areas covered with floating and submerged aquatic plants. Today, Kani Brazan wetland acts as a core population of waterbirds and, therefore, has an irreplaceable value in maintaining the survival of these populations. Despite the significance of Kani Brazan, there is usually no clear and specified e-flow for it, and the failure to meet environmental needs has a great impact on its ecological conditions [41].

2.2. Remote Sensing

Remote sensing is used to monitor the vegetation and water extent of the wetland. Landsat 7 (for years before 2013) and 8 (for years after 2013) satellite images with less than 30% cloud cover are used for long-term monitoring of the wetland. Spectral indices are mathematical equations that are applied to different spectral bands of the image, pixel by pixel. Their purpose is to highlight a certain phenomenon on the Earth’s surface, such as plants, water, or soil, and they have been used in many studies in the past [42,43]. In this paper, NDWI and MNDWI indices are employed for the extraction of the wetland water body time series from Landsat images, NDVI is used to extract the vegetation cover, and the Google Earth Engine is used to calculate and analyze the time series of the vegetation and water indices.

2.2.1. Remote Sensing Application for Water Mapping

Considering the different behavior of water in the green and near-infrared (NIR) spectral ranges, McFeeters (1996) introduced the NDWI using these bands to detect surface waters in wetland locations and calculate the water area [44].
N D W I = G r e e n N I R G r e e n + N I R
NDWI values are between 1 and −1. McFeeters proposed a threshold limit of zero for water separation; thus, positive values indicate water and negative values indicate non-water classes, such as soil and vegetation.
MNDWI is calculated by replacing the original near-infrared (NIR) band with shortwave-infrared (SWIR) to reduce commission errors in vegetation, built-up area, and soil. Xu (2006) presented an improved formula for NDWI [45]. Xu reduced the noise by replacing the short-wavelength infrared band with the NIR band and introduced the modified formula of the normalized water difference index or MNDWI.
M N D W I = G r e e n S W I R G r e e n + S W I R
MNDWI is frequently used and is an effective index for extracting water bodies and has a strong ability to identify water [46,47]. The water class has a positive value, and the non-water class has a negative value.
By using the water elevation that was available in the wetland for three years (2017 to 2020) and also the elevation–area–volume curve of the wetland, the observed water area values in the wetland were compared with the calculated values using remote sensing indices. According to the results, the MNDWI index was more compatible with the observational data than the NDWI index. Figure 5 shows this subject. The value of root mean square error (RMSE) is equal to 0.15 m, and the normalized root mean square error (NRMSE) is 0.022 for MNDWI results and, by using NDWI, RMSE, and NRMSE, the results are 0.3 m and 0.05, respectively.

2.2.2. Remote Sensing for Vegetation Mapping

NDVI is a non-dimensional, accurate, and broadly employed index for monitoring and assessing vegetation health and dynamics [48]. NDVI is an index that was developed to describe vegetation and, by using the difference between NIR (which is strongly reflected by plants) and RED (which is absorbed by plants), it can determine the regions with vegetation. NDVI maps use a combination of near-infrared and red wavelengths to measure plant health. The following mathematical formula calculates the NDVI, which is the normalized difference between NIR and red (RED) reflectance.
N D V I = N I R R E D N I R + R E D
The range of the NDVI is defined between −1 and +1. Values below zero indicate dead plants or no vegetation features, such as rock, soil, and water bodies. NDVI index values for living plants are between 0 and 1, and a higher value of the NDVI indicates an increase in the amounts of green vegetation [49].
In this research, after calculating the water area time series using MNDWI, the relation between the greenness level of vegetation cover and the water in the wetland was calculated using NDVI. Also, the relationship between the number of birds and NDVI was calculated as the indicator of the habitat conditions of waterbirds (food availability).

2.2.3. Google Earth Engine

The Google Earth Engine (GEE) is a powerful web-based remote sensing tool for extracting useful information from satellite images and has facilitated many satellite image processing processes in recent years. Traditional remote sensing methods normally need a lot of time and energy to download and preprocess satellite image collections. By using GEE, it is possible to view and analyze all covers and uses of the earth with high spatial details in two and three dimensions. Many studies in different fields, such as vegetation monitoring [50], land use/cover maps [51] and their characteristics, such as the temperature of the earth’s surface [52], monitoring of protected areas [53], monitoring of water resources and water bodies [54], agricultural products [55], and other types of remote sensing studies, have been carried out using this system.

2.3. Simulation Optimization

Simulation is an approach for examining and analyzing the behavior of a real-world system. A simulation model will develop based on a mathematical relation between system components. Optimization models are employed to maximize or minimize one or more goals based on predefined constraints and decision variables. In the simulation optimization method, the simulation model is developed from the present situation of the system. Then, by defining the objective function, decision variables, and constraints, the simulation model is linked to an optimizer. The optimizer determines the decision variables’ value to reach the best value of the objective function. The simulation models can consider complicated systems, but resolving many environmental problems needs optimization procedures to reach optimal results and achieve the best decision making [56].
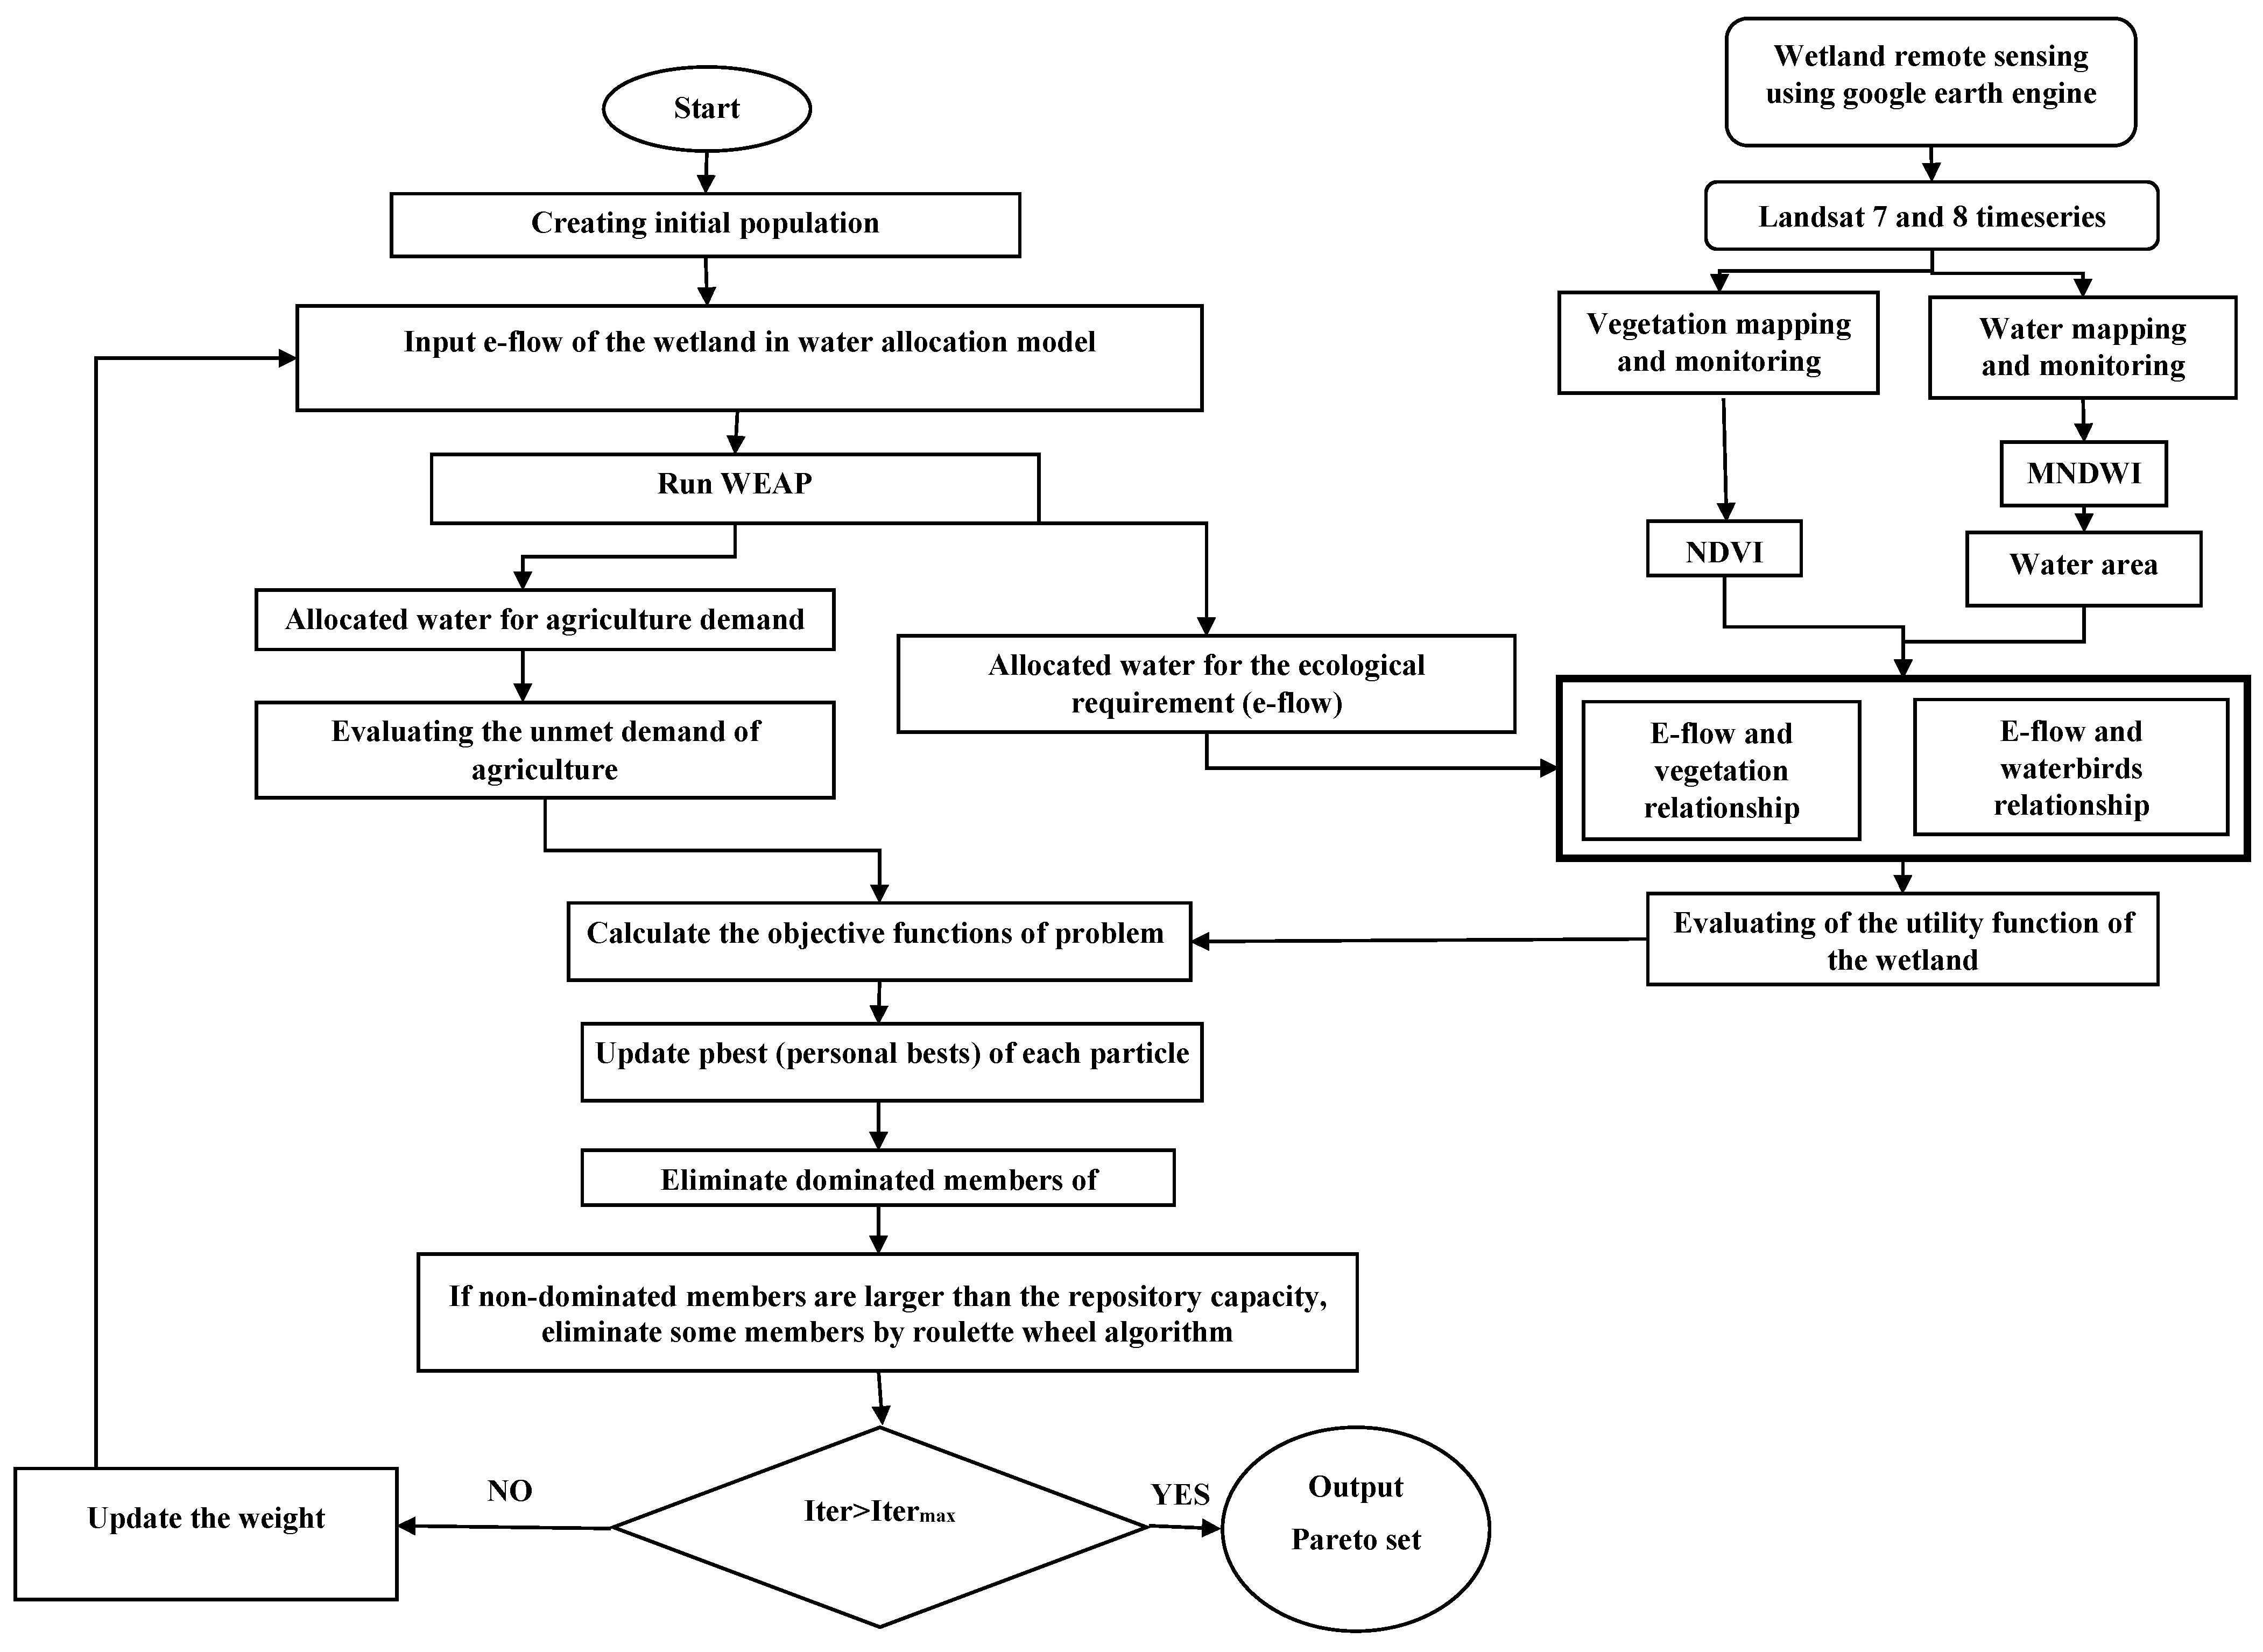
In the optimal e-flow design problem, the values of monthly e-flow are the decision variables. Various decision variables will result in different performances of the objective function. So, in this study, a simulation optimization (WEAP-MOPSO) model is used to determine the trade-offs between two conflicting objectives (environment and agriculture). A flowchart of the developed model is presented in Figure 6.
WEAP incorporates demand-related issues along with resource-related issues to find the optimal allocation of water between various demands at each time step [57]. Among the advantages of the model are its application at different temporal and spatial scales, the ability to create, manage, evaluate, and compare different scenarios, the allocation of water based on priorities, and the ability to create a dynamic relationship between groundwater and surface water models can be mentioned [58]. In the developed WEAP model, the needs of urbanism and industry have the highest supply priority, followed by environmental and agricultural demands. The simulation of water resource allocation is conducted for 14 years from April 2008 to March 2022.
PSO is a robust optimization technique, which was proposed by James Kennedy and Russell Eberhart (1995) [59]. This optimization algorithm is a precise, innovative search method with a low computational cost. PSO uses the concept of social interaction to solve the problem and consists of some agents (particles) that form a group and move in the feasible search space to reach the best objective function (solution). In MOPSO, an external secondary table (reservoir) is used to store the information of representatives (particles) so that each particle can make the most of this information later [60]. In Table 1, the values of the parameters used in the PSO algorithm are presented.
This study aims to calculate the optimal e-flow requirement in the agriculture catchment to achieve the best compromise for water allocation between the wetland’s ecological and agricultural demands. Due to the existence of different resources and demands in the basin and the effect of sectors on each other, identifying the e-flow in a water-scarce basin with high agriculture demand is a difficult problem. The first objective of this research is to maximize the utility function of the wetland based on vegetation and waterbirds as bioindicators of wetland ecosystems. The other objective of the study is to minimize the deficit in supplying agricultural demands. The decision variables are the monthly e-flow of the wetland. The formulation of the optimization is presented as follows.
Max W U F = U F V + U T B
M i n   W D A g r = Σ ( D A g r , t R A g r , t ) t = 1 . . T
Subject to:
S min S t S max t = 1 , . . . , T
S t + 1 = S t + I t E V t S t + 1 , S t R t t = 1 , . . . , T
R t = f S t , I t , D t t = 1 , . . . , T
S D t D t t = 1 , . . . , T
R t = R W e t , t + R A g r , t + R O t h , t + R S p i l , t t = 1 . . T
U F V = g   ( N D V I )
U T B = k   ( N D V I ,   A W e t )
V W e t , t + 1 = V W e t , t + R W e t , t + V R a i n , t E V W e t , t V G W , t t = 1 , . . . , T
A W e t = J   ( V W e t , t )
t: time steps index;
T: number of time steps;
S t : the reservoir’s volume (MCM);
E V t S t + 1 , S t : net evaporation from the reservoir (MCM);
I t : inflow to the reservoir (MCM);
R t : release from the reservoir (MCM);
S min : reservoir’s minimum storage (dead storage) (MCM);
S max : reservoir’s maximum storage (reservoir capacity) (MCM);
R W e t , t : release for the wetland requirement;
R A g r , t : reservoir release for irrigation;
D A g r , t : agriculture demand;
W D A g r : deficit between agriculture demand and supply;
R O t h . t : reservoir release for other demands;
R S p i l . t : spill release from reservoir;
A W e t : water area of the wetland;
V W e t : volume of water in the wetland;
V R a i n : wetland inflow volume from direct precipitation;
E V W e t : net evaporation volume from the wetland;
V G W : volume caused by recharge or discharge of groundwater;
U F V : the utility function of wetland’s vegetation;
U F B : the utility function of wetland’s waterbirds.
Equation (4) is the maximization of the utility function of the wetland’s ecological condition based on vegetation and waterbird indicators. Equation (5) is the minimization of the deficit in supplying the agriculture sector demand. In Equation (6), the reservoir volume in each time step is bounded to the minimum capacity (dead) and maximum capacity (normal water level) of the reservoir. The water balance model for reservoirs is presented in Equation (7). Equation (8) illustrates the amount of release according to the storage volume, inflow to the reservoirs, and demands. Equation (9) shows that the maximum amount of release is limited to the demand requirement. Equation (10) shows the monthly release is separated into the releases for the wetland requirement, irrigation requirement, other downstream demands, and the spill from the reservoir. Equation (11) represents the utility function of the wetland’s vegetation in the growing season as a function of NDVI. In Equation (12), the utility function of wetland’s waterbirds is a function of the vegetation NDVI (food availability) and water in the wetland (adequate habitat). Equation (13) demonstrates the wetland’s general water balance equation. In Equation (14), the area of the water in the wetland is a function of the wetland’s water volume (volume–elevation–area of the wetland).

4. Results

4.1. Water Area and NDVI Interrelation
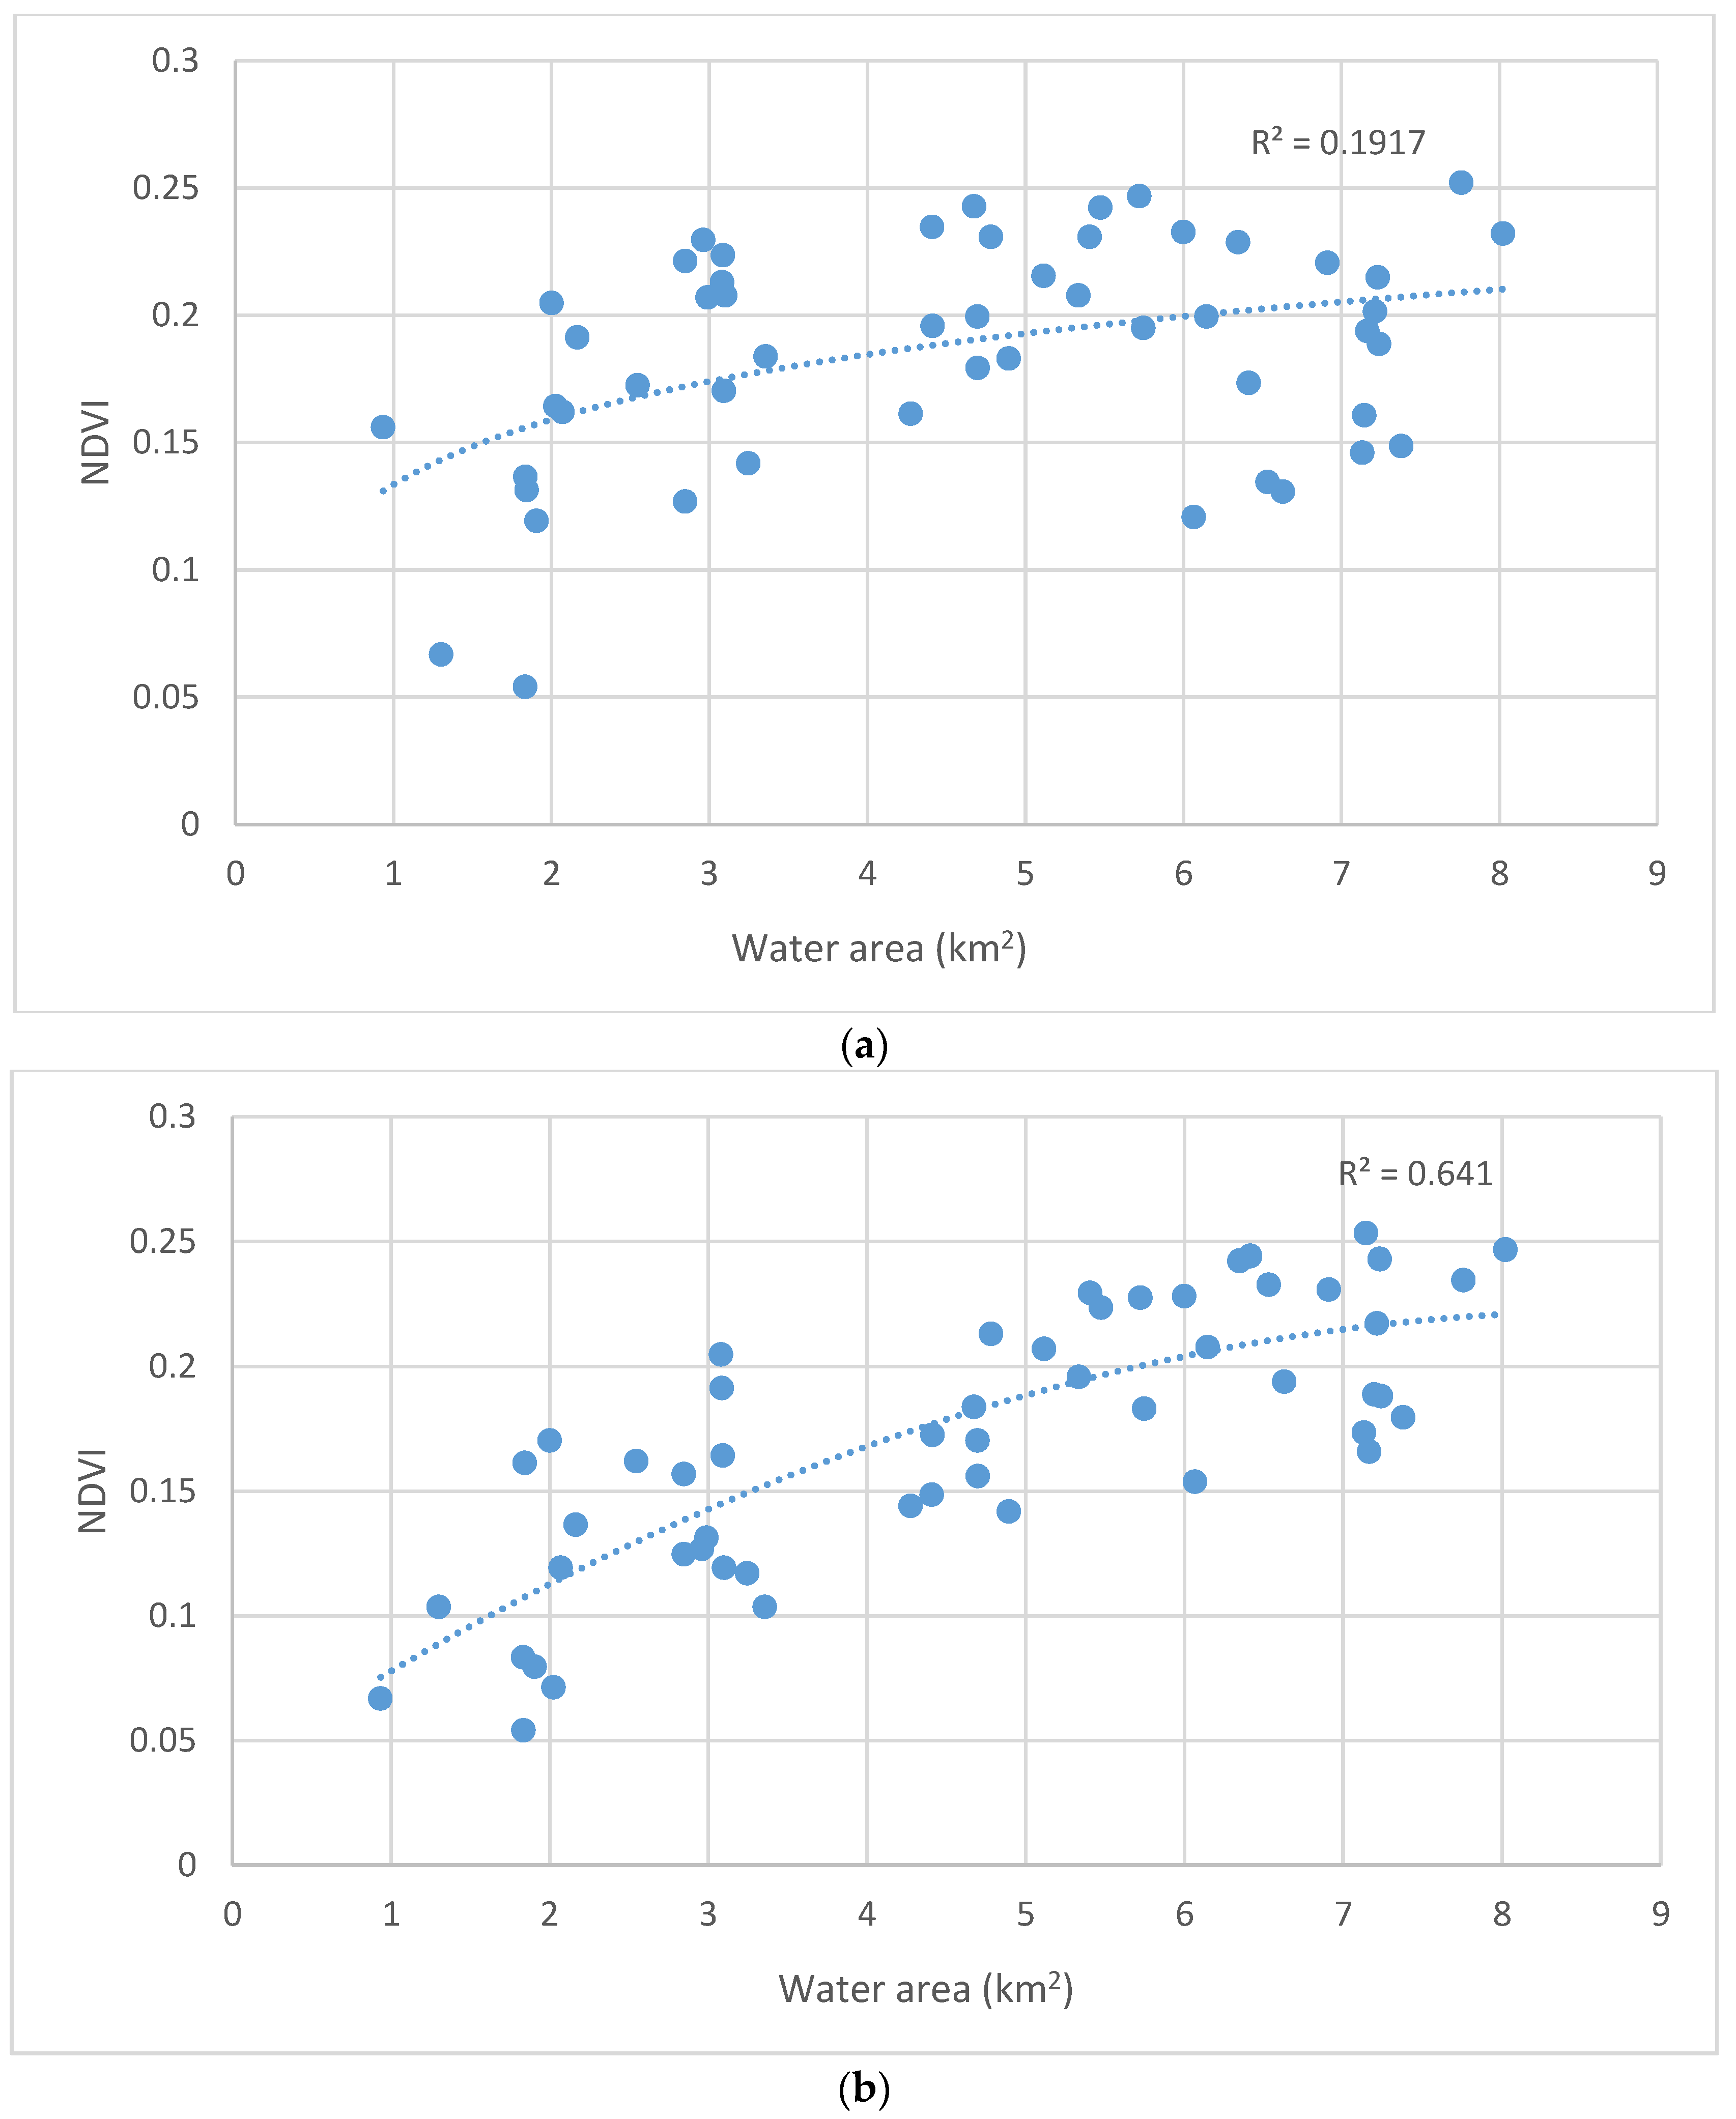
The NDVI relationship with meteorological parameters, like precipitation and temperature, is mentioned as time-lag effects in the literature [61,62,63,64] and has been well studied [65,66,67]. However, the amount of time lag is different from region to region [68,69]. In general, most academic studies demonstrate that there is around a 1–3 month lag. In this study, the relationship between the wetland’s water area and NDVI time series in the growth season (June to September) was estimated using Landsat 8 satellite images. According to the results, NDVI shows a good interrelation with water area with one time step lag (Figure 7). This result is consistent with the research from [70,71]. Therefore, the relationship between NDVI and the water area of the wetland during the growth season is calculated from the following equation:
N D V I t + 1   =   0.0024   A W e t , t 2 + 0.0421   A W e t , t + 0.0381
U F V i =   ( N D V I t / N D V I d e s , t )
U F V = U F V i I
I: number of years (simulation period)
N D V I t : NDVI value at the time step t
A W e t , t : water area of wetland at the time step t
N D V I d e s , t : the desired value of NDVI at each time step (based on remote-sensed NDVI time series)
U F V i : yearly utility function of vegetation
U F V : vegetation’s utility function for the entire simulation period.
Figure 7. Water area and NDVI correlation (a) without time lag and (b) with one-month lag.
Sustainability 15 13926 g007
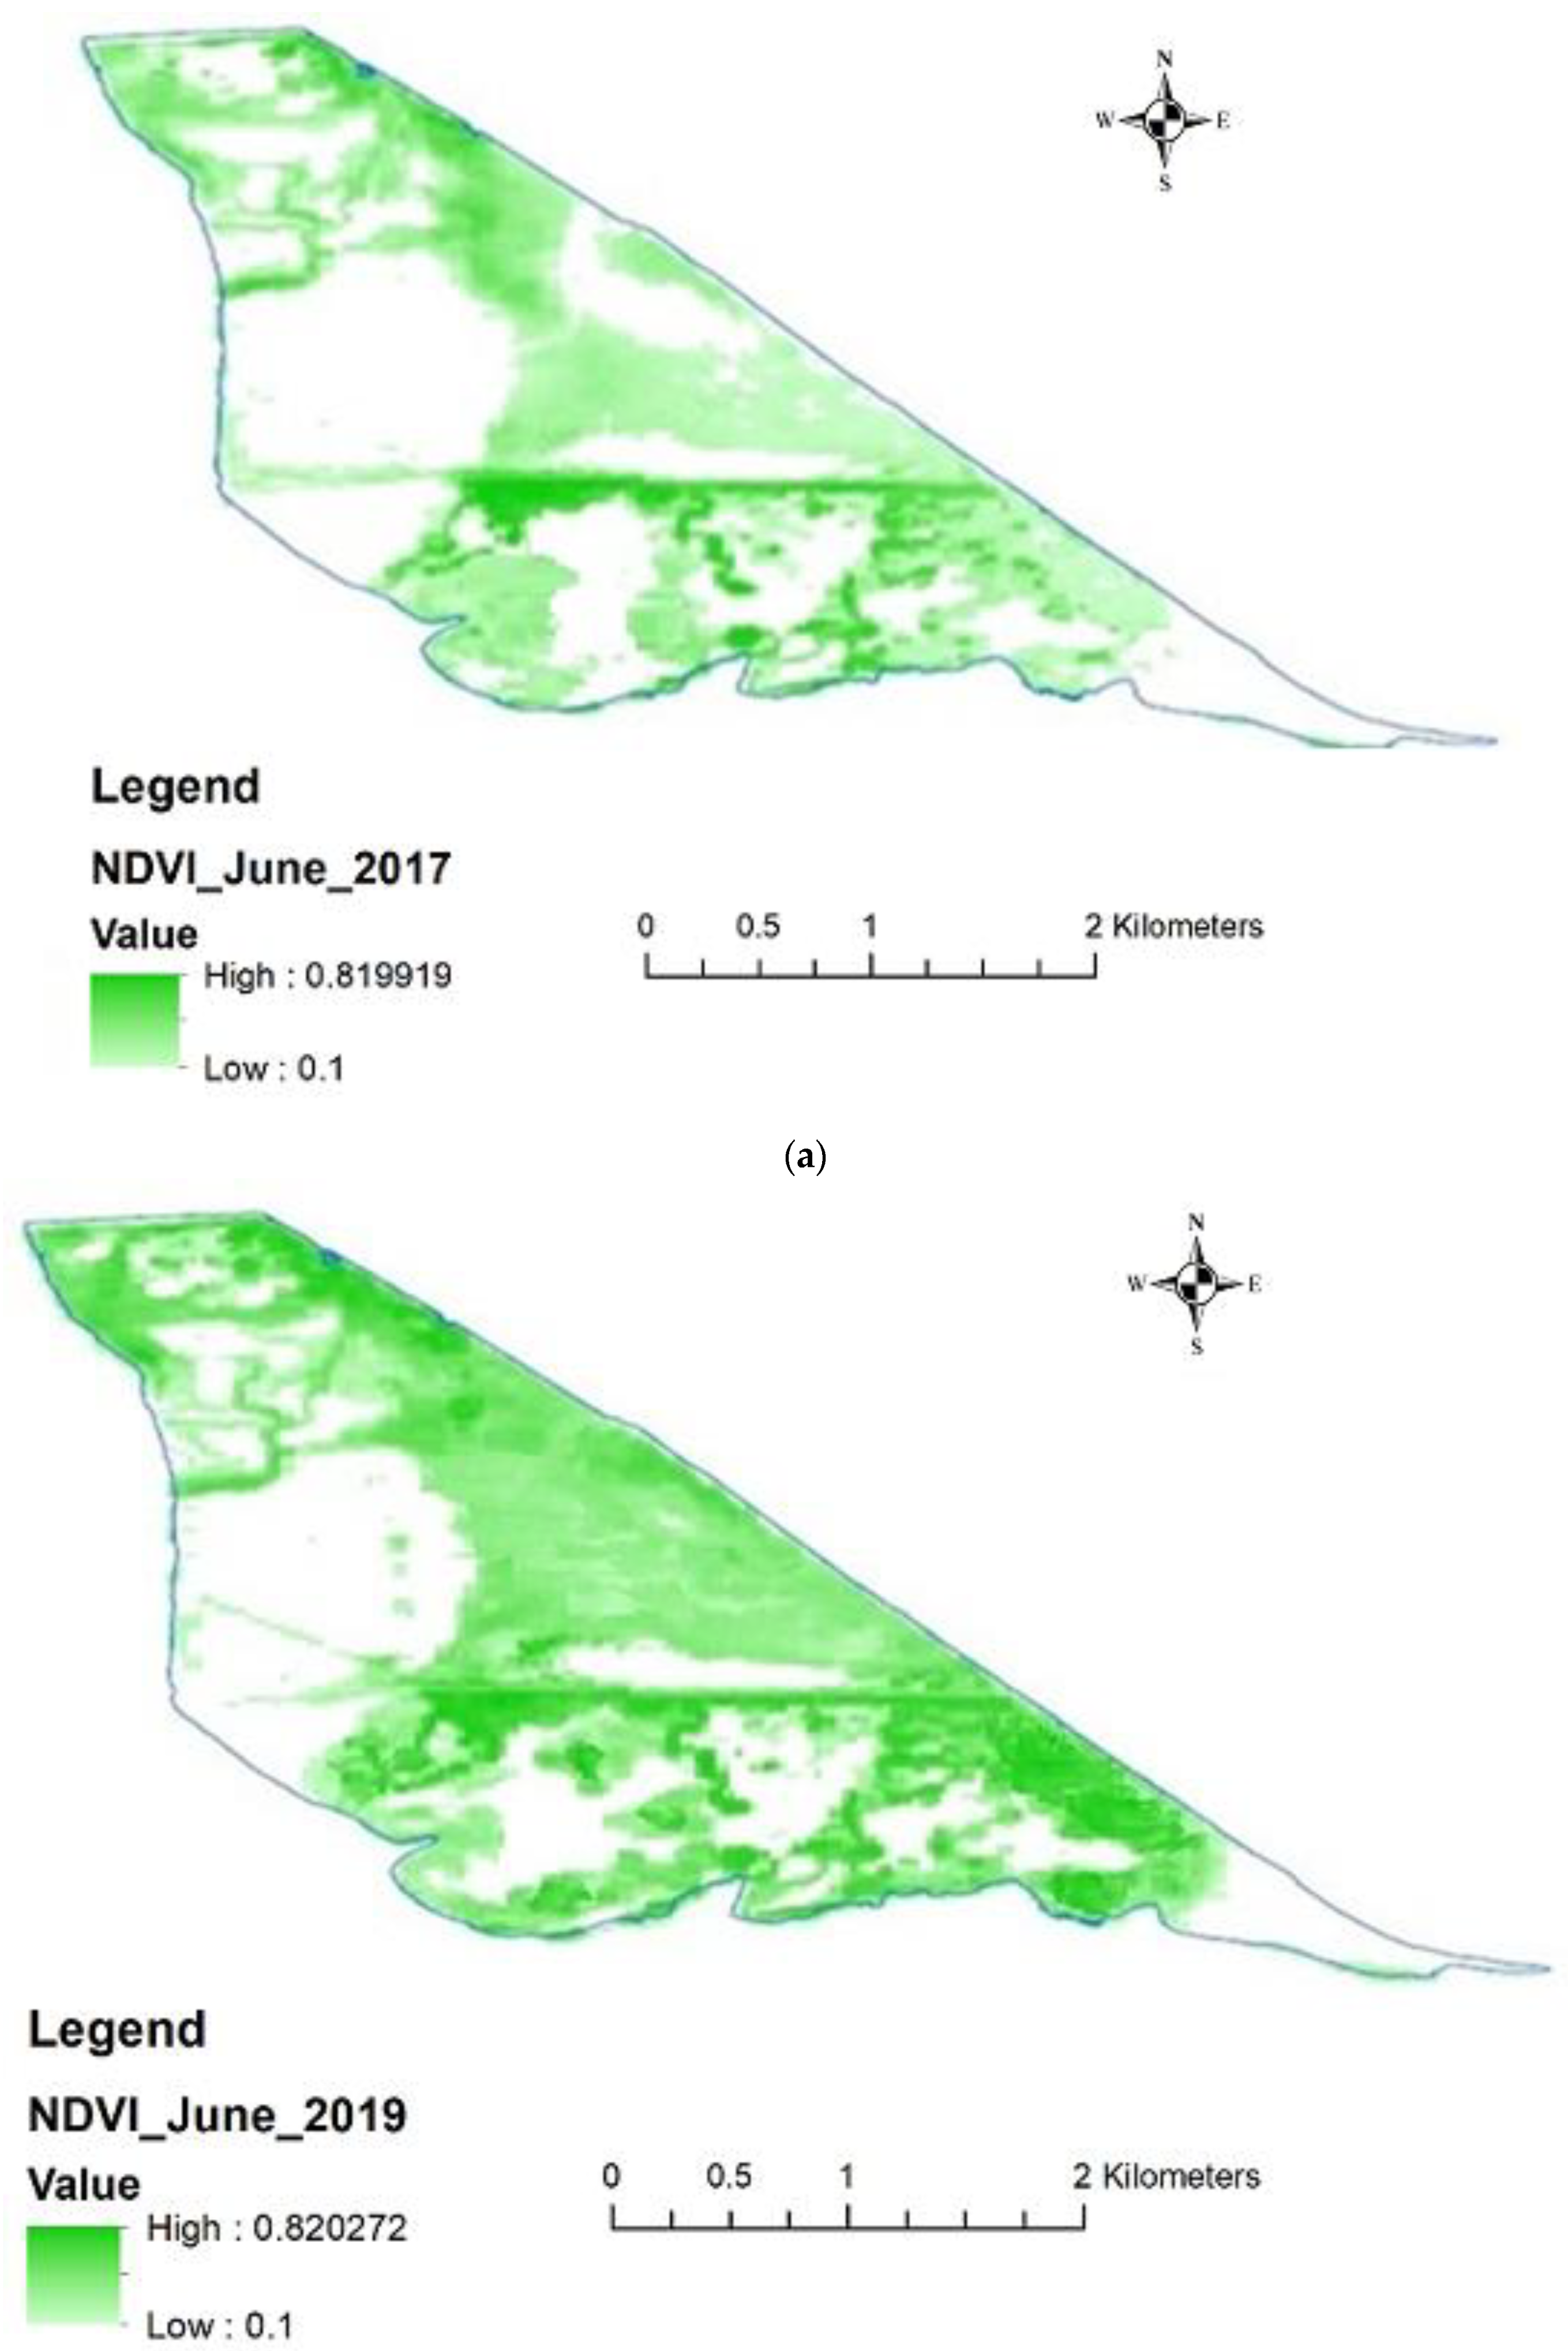
The effect of wetland water on wetland vegetation is clear in satellite images in dry and wet conditions. Notably, 2019 was one of the wettest years in recent years, and this year, the environmental requirement of the wetland is well met. On the other hand, 2017 was a dry year, so due to the water shortage and the upstream demands, the ecological needs of the wetland were not supplied. For this reason, the wetland vegetation with an NDVI higher than 0.1 in 2019 and 2017 is shown in Figure 8.

4.2. Relationship between Water Level, NDVI, and Number of Birds

Waterbirds are bioindicators of wetland ecosystems. Waterbirds have a faster response to changes in vegetation and water conditions than other animals [72,73,74]. Water availability is the main parameter for the productivity of the ecosystem, and wetland plants can provide adequate breeding, nesting, loafing, and foraging locations for wintering waterbirds [75,76,77].
The results of other studies show that the NDVI can efficiently represent productivity and food [78,79], and MNDWI is used for measuring the availability of required water in the wetland. Therefore, a bivariate relationship between the number of wetland birds and vegetation NDVI (available food) and water in the wetland (suitable habitat) was obtained. The parameters of the regression between the number of wetland waterbirds, NDVI, and water area are presented in Table 2. The values of the statistical coefficients indicate that these relationships are statistically significant.
Therefore, the following equations are used to calculate the interrelation between water area, NDVI, and the number of wintering waterbirds in the wetland.
N B i = 9565   N D V I a v e , i + 77469.7   A W e t , a v e , i 56635.4
U F B i = N B i / N B d e s
U F B = U F B i / I
i: year index
I: number of years
N D V I a v e , i : average monthly NDVI during the growth period of plants in the year i
A W e t , a v e , i : average monthly water area of the wetland during the wintering season of waterbirds in the year i
N B i : number of waterbirds in the year i
N B d e s : desired number of waterbirds (based on censuses)
U F B i : yearly utility function of birds
U F B : birds’ utility function for the entire simulation period.
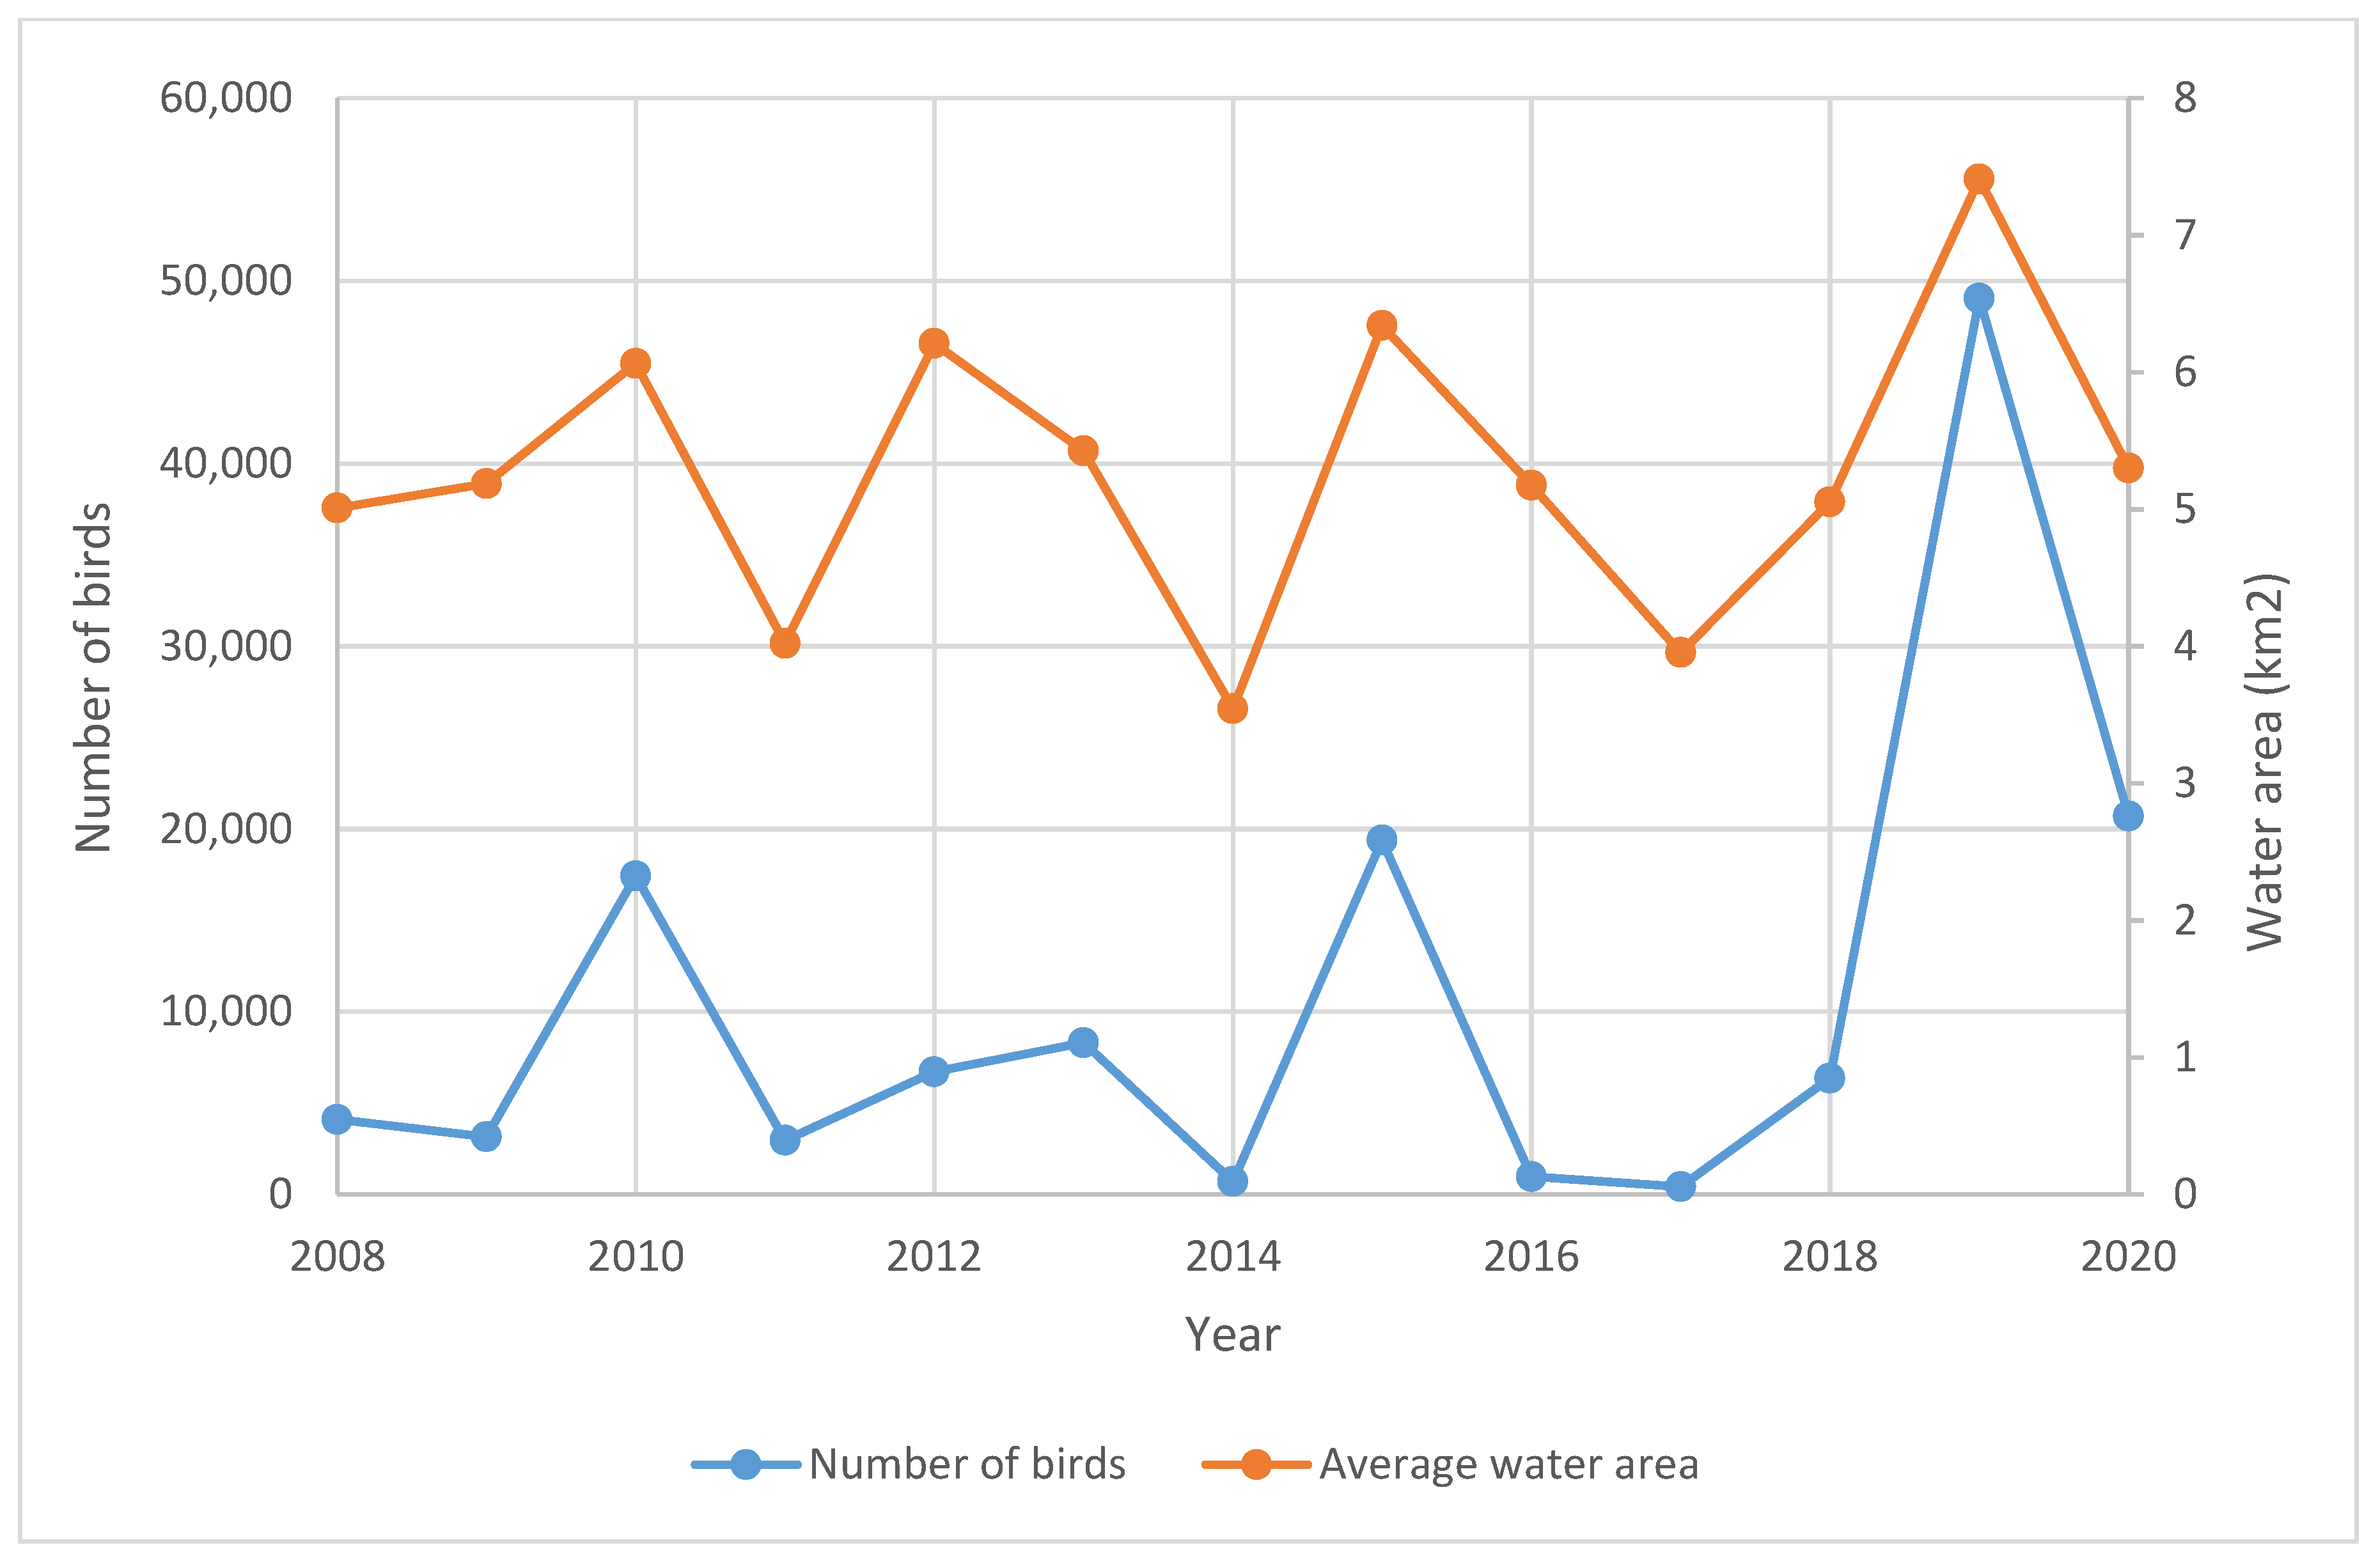
Figure 9 shows the changes in the wetland area with the number of observed birds in different years.
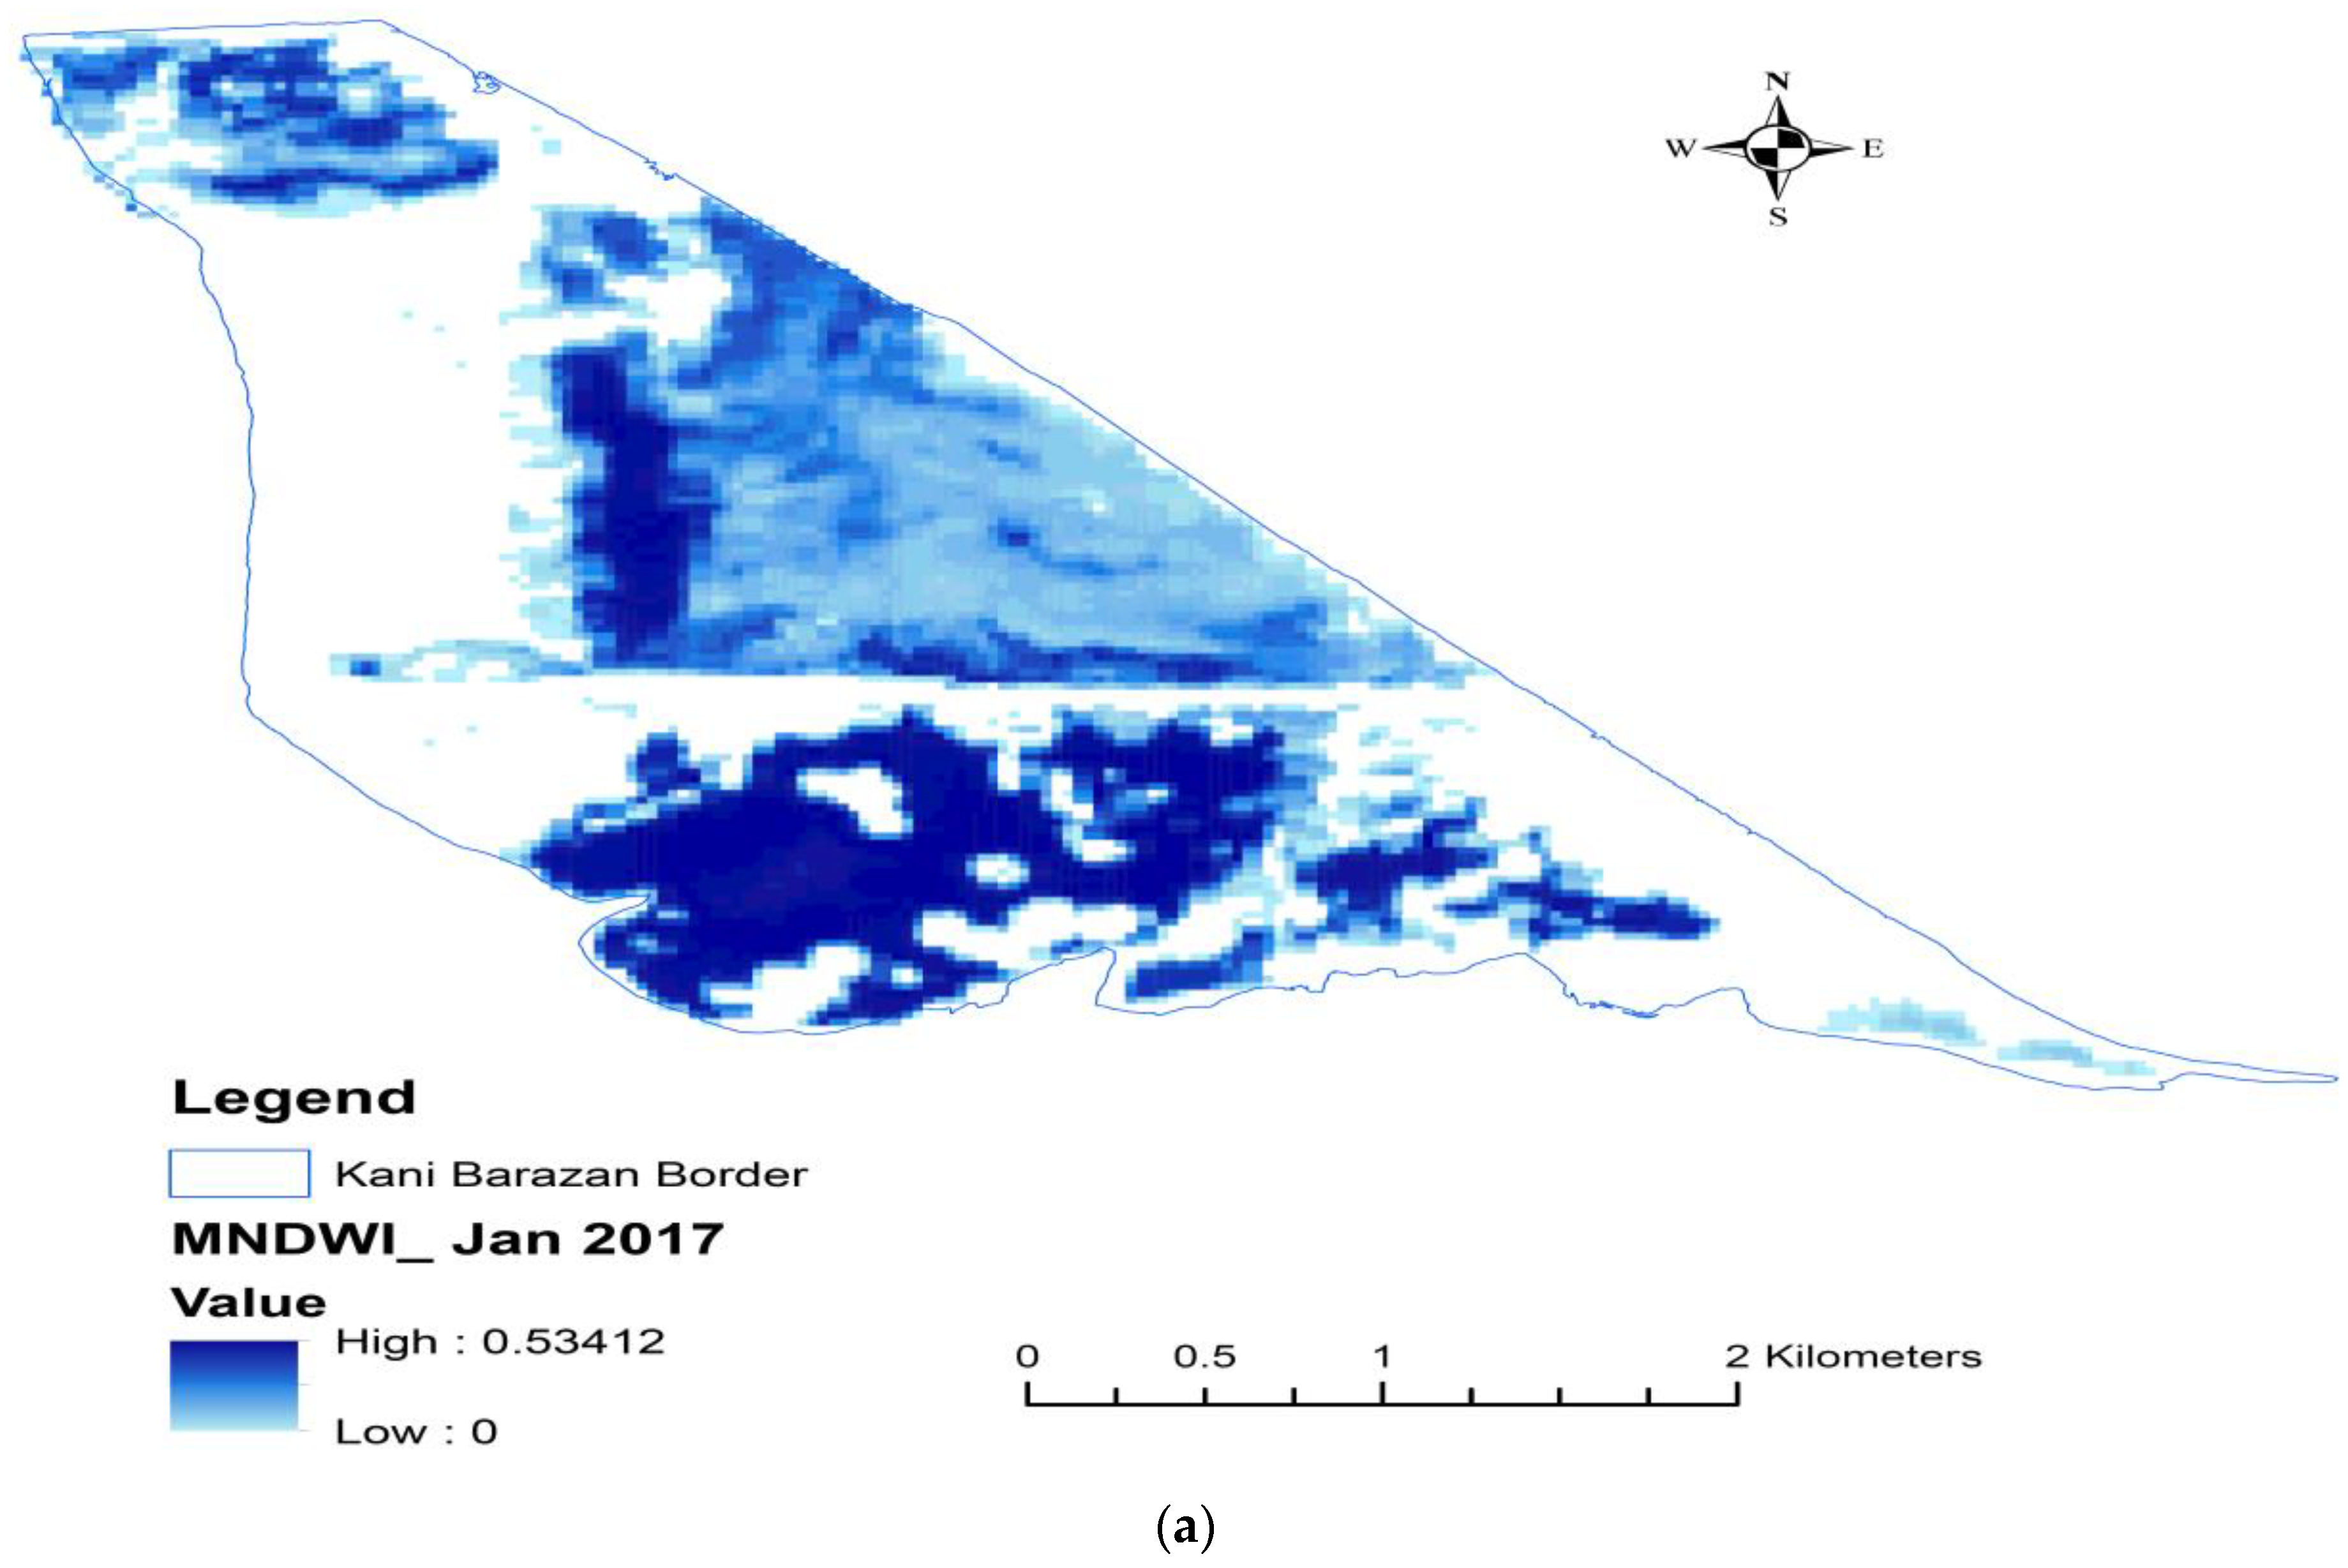
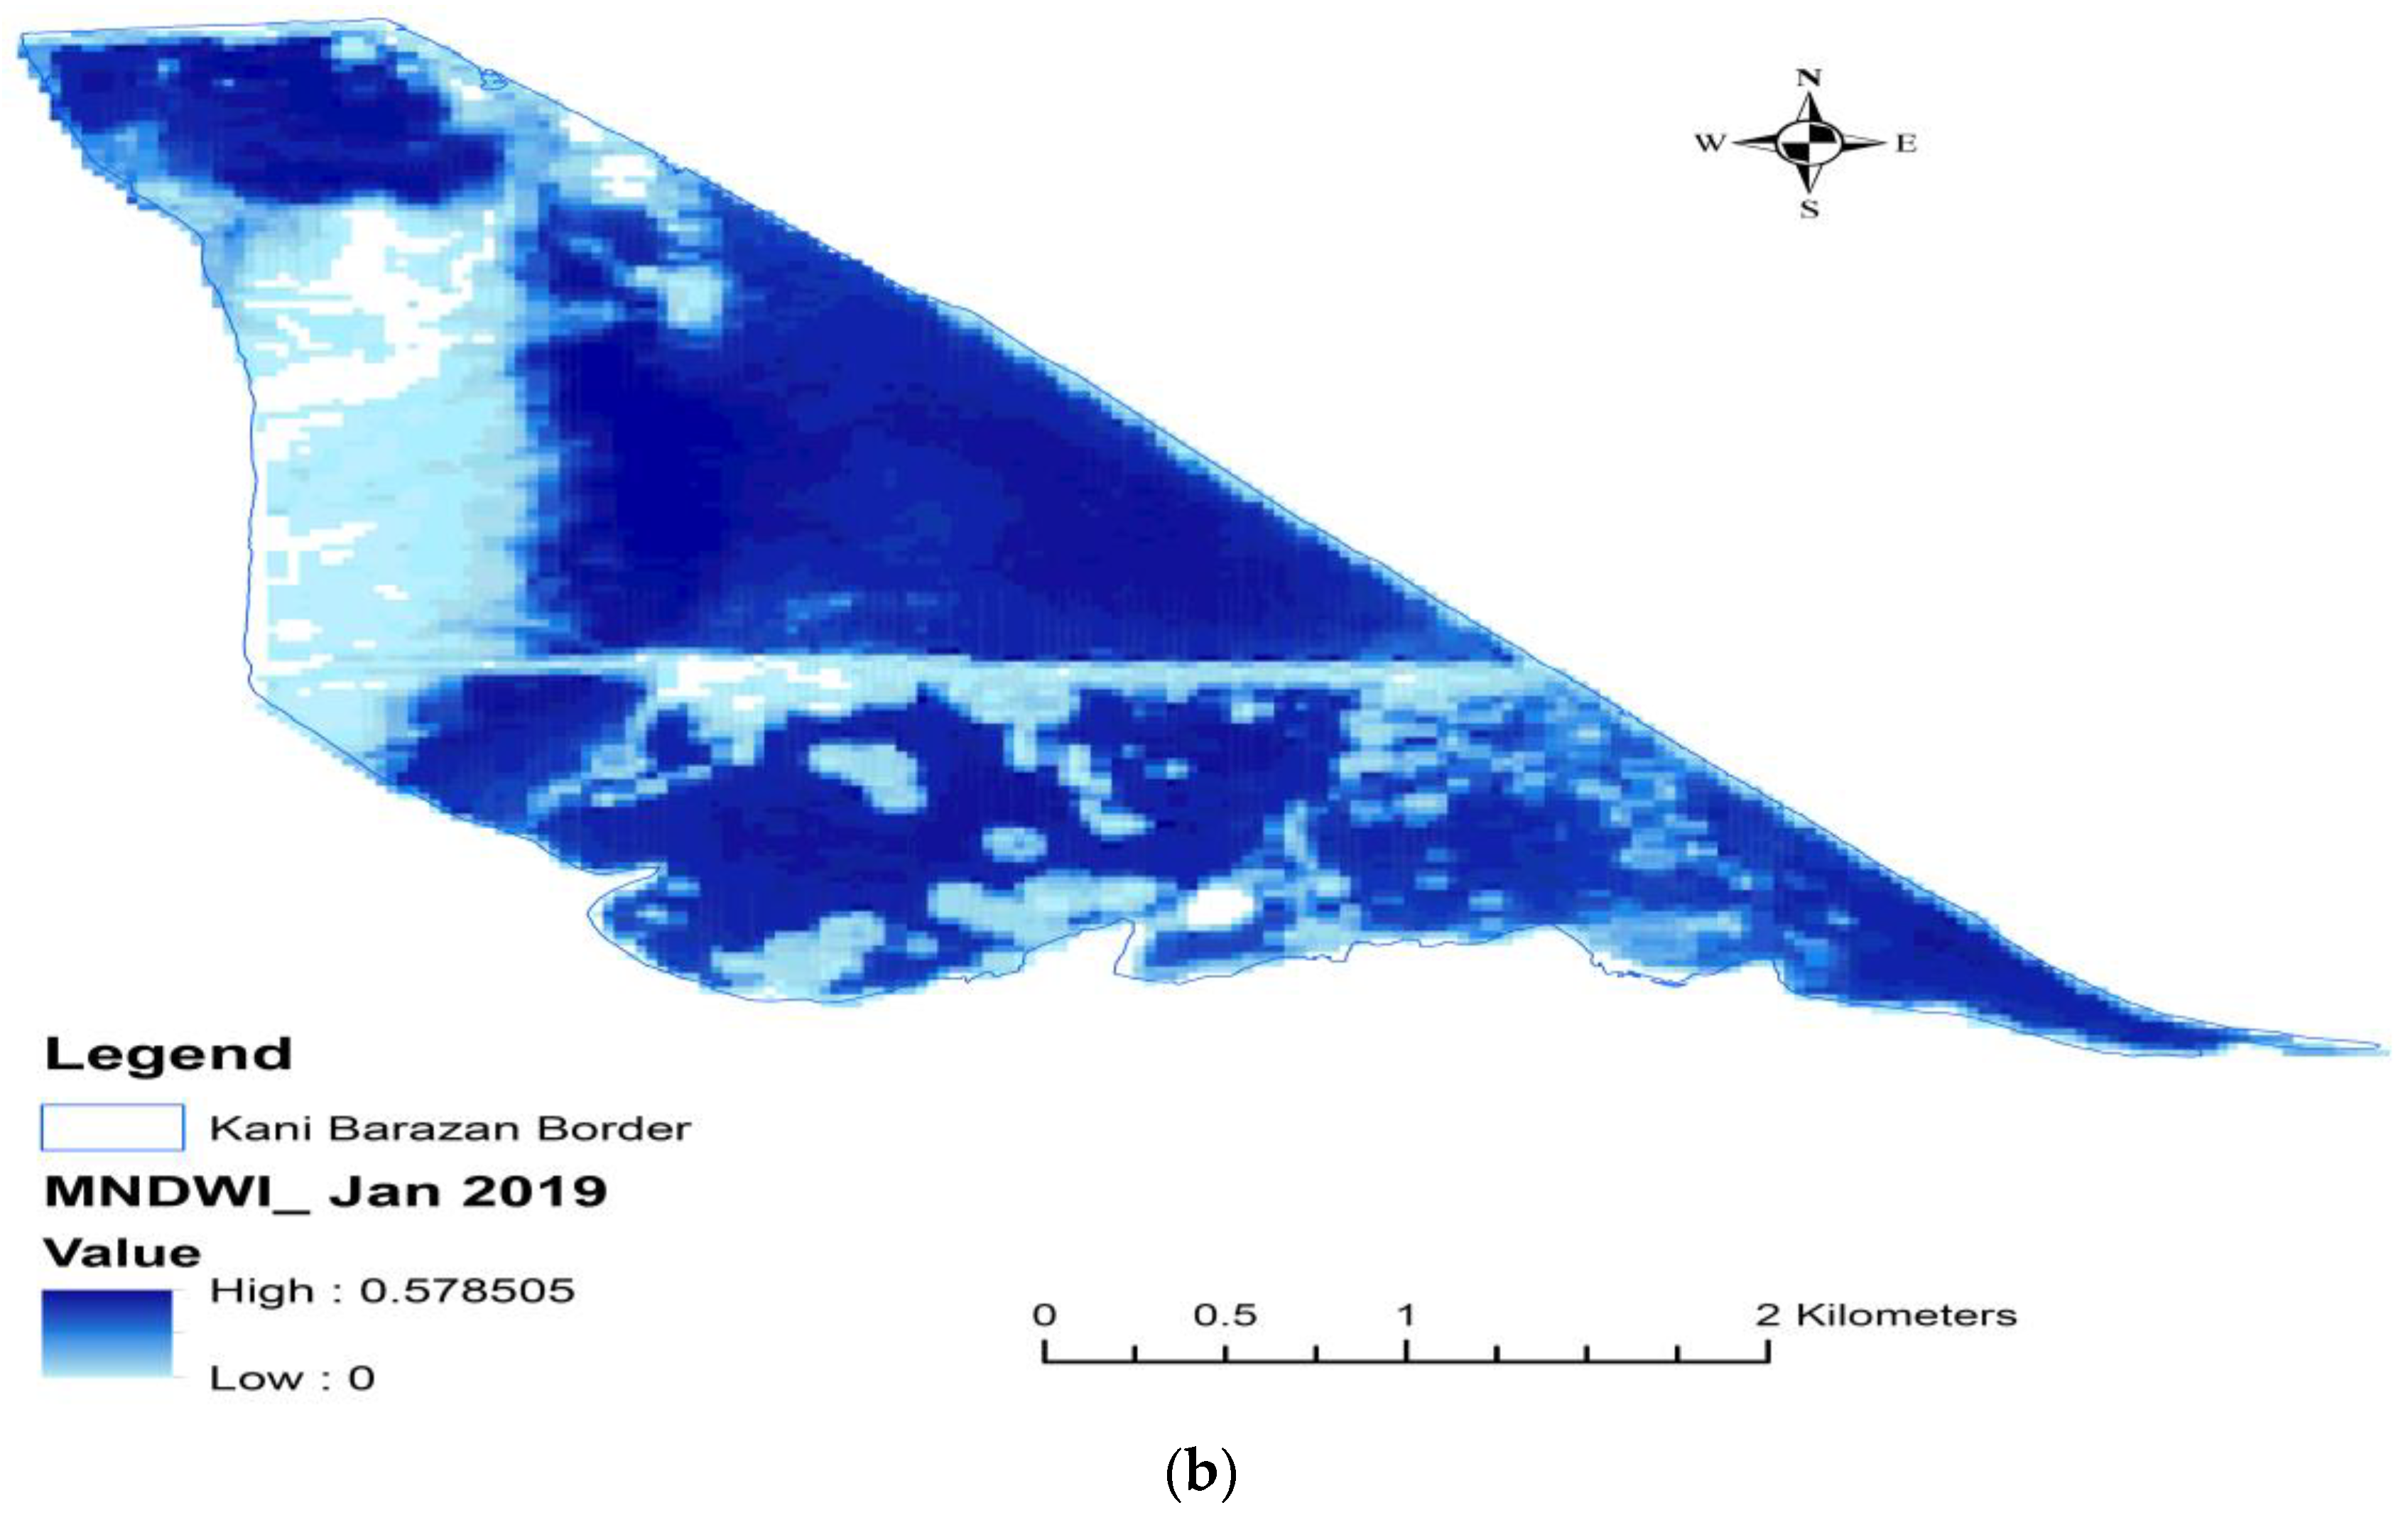
Figure 10 shows the state of the water inside the wetland (extracted using MNDWI) in January of two different years. As is clear, in 2017 and 2019, there were considerable alternates in the available water in the wetland, which affected the number of waterbirds.

4.3. Simulation Optimizaton

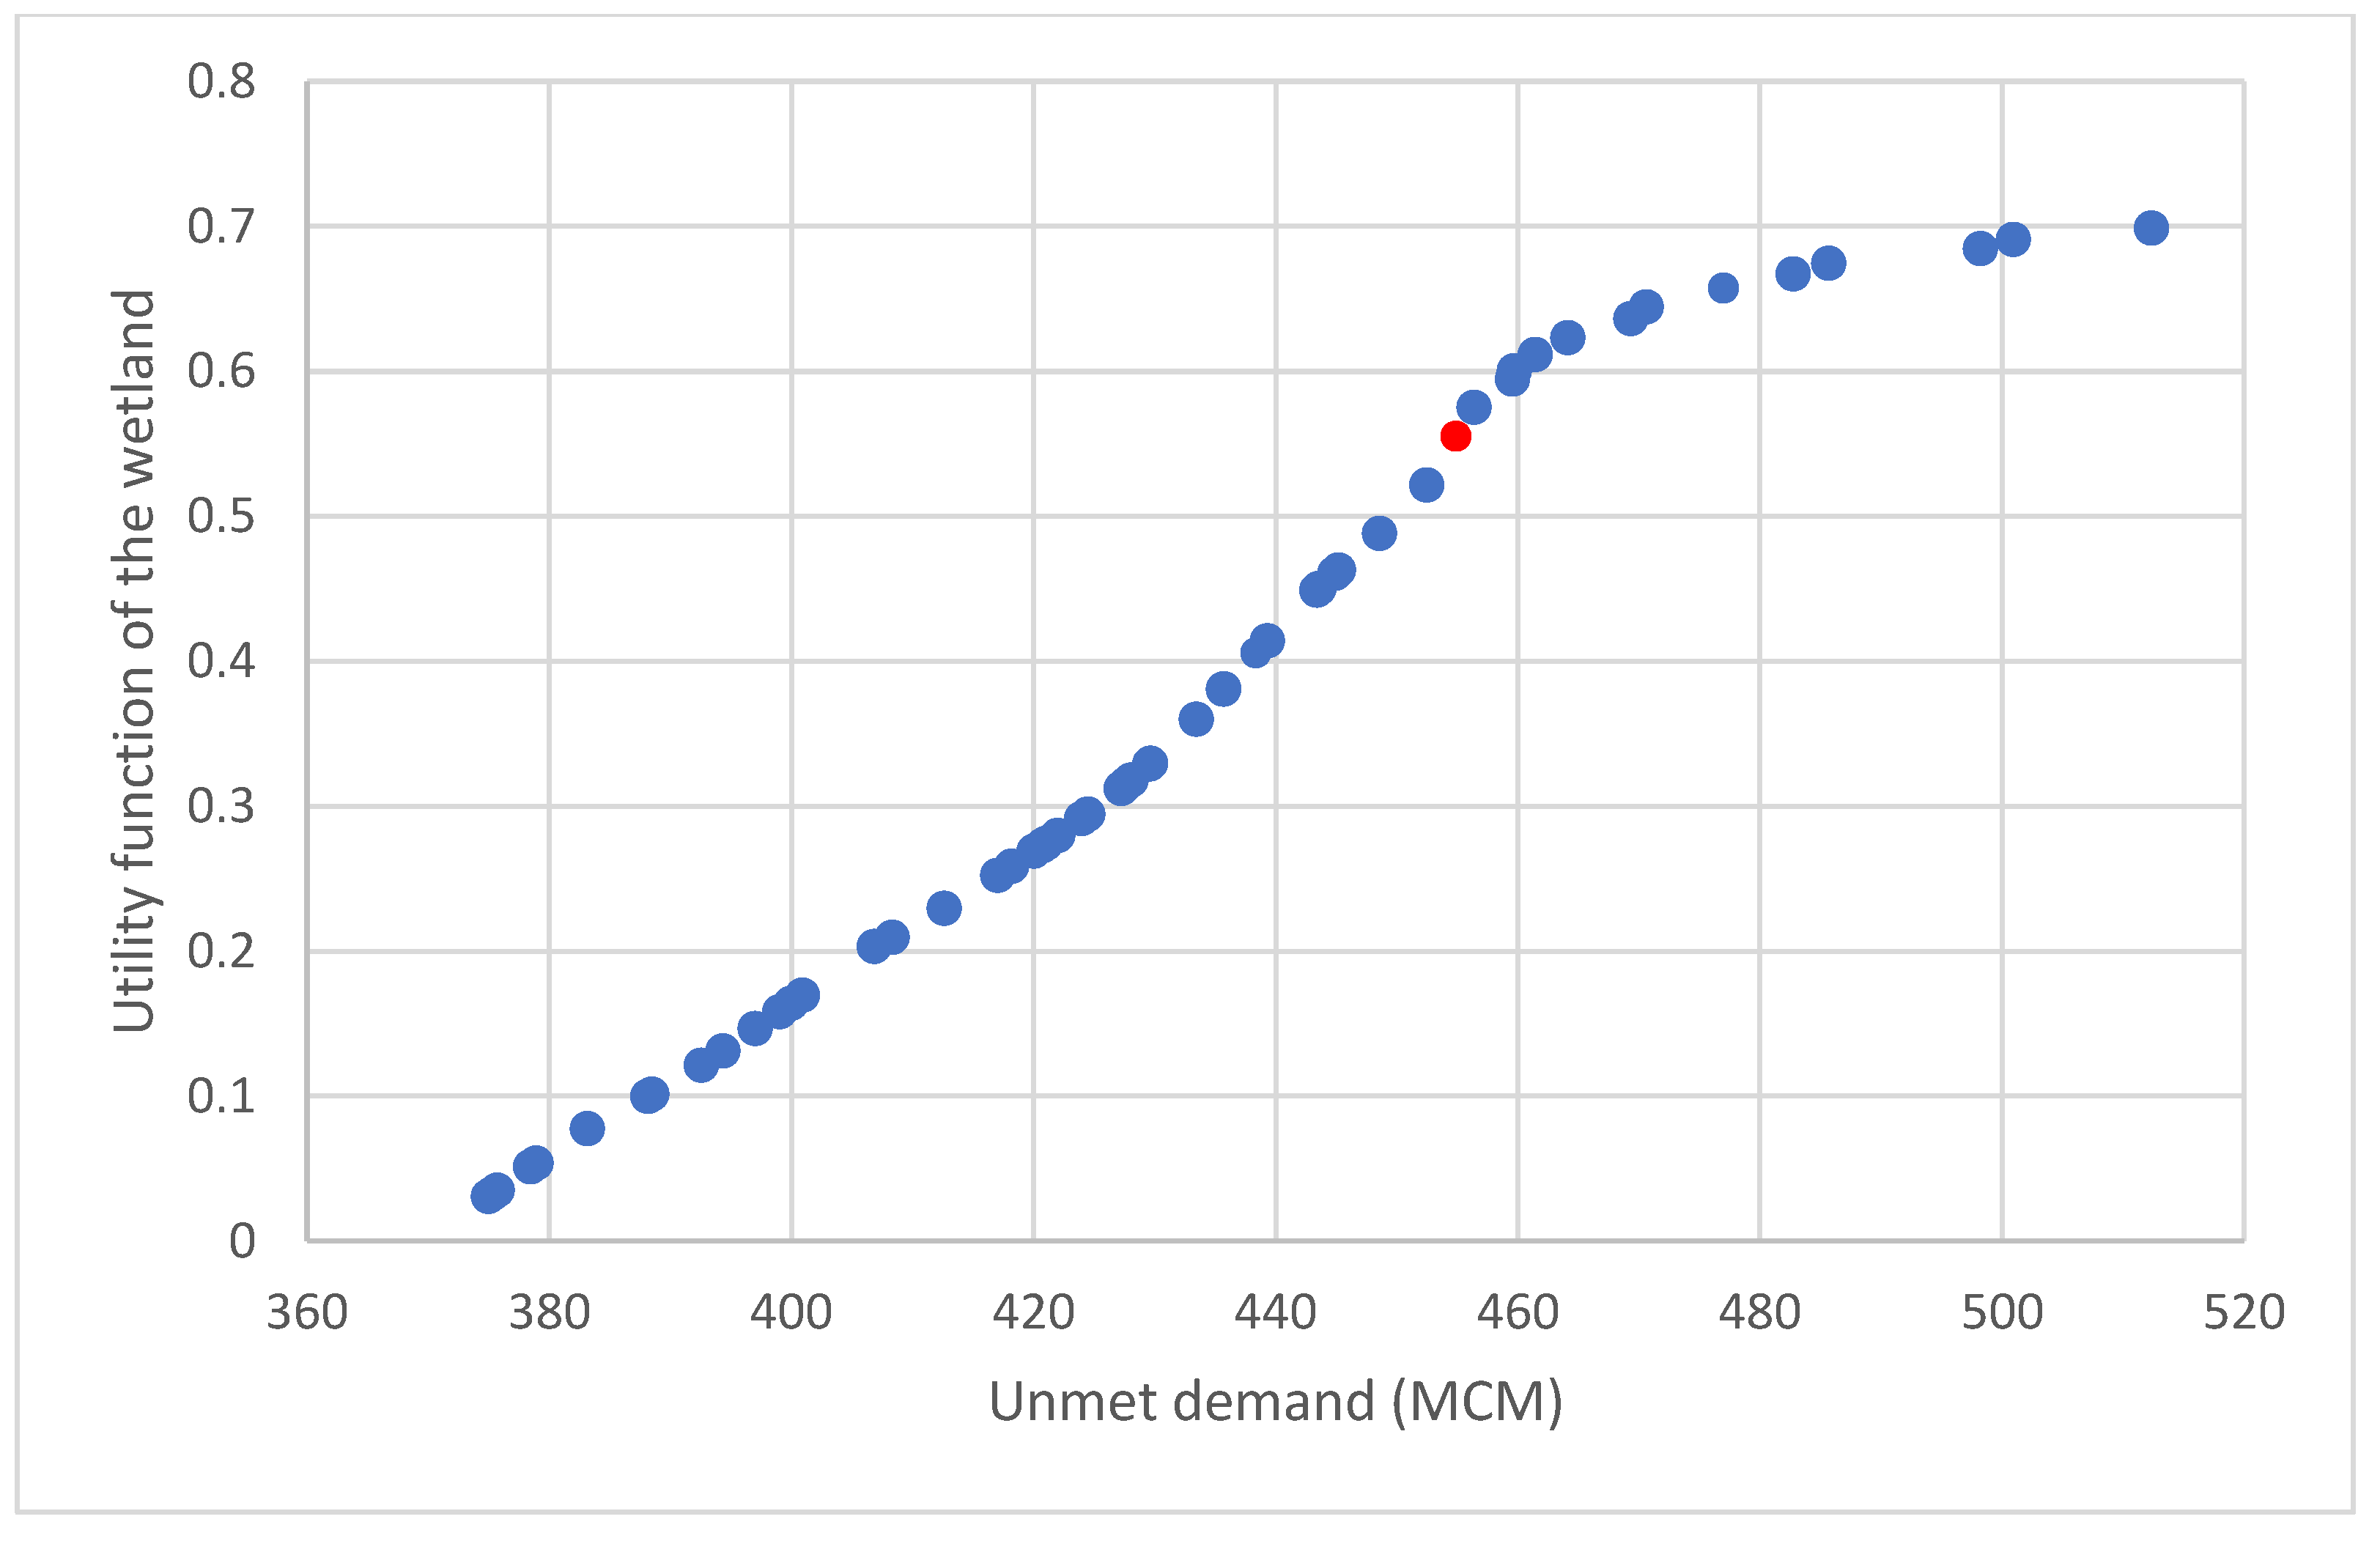
The simulation optimization model is employed for sustainable water management of the Mahabad catchment and solves the problem of determining the proper e-flow for the restoration and conservation of the Kani Barazan wetland (reaching the best compromise between the agricultural and environmental requirements in the Mahabad basin). The decision variables are the monthly e-flow of the wetland. The two objective functions considered in this study include the following: maximizing the utility function of the wetland and minimizing the agricultural demand deficit. These two objectives conflict with each other, especially in a basin that faces a water shortage. The MOPSO algorithm with 20 particles was used to achieve the best trade-off among these goals. The optimal Pareto front obtained is illustrated in Figure 11, which shows the optimal trade-off of the objectives.
As stated in Figure 11, it is shown that the value of the utility function of the ecological conditions of the wetland changes from about 0.03 to 0.699, and, in these cases, the amount of e-flow of the wetland is equal to 1.1 million cubic meters and 19.5 million cubic meters, respectively. In these cases, the total amount of deficiency in supplying agricultural needs downstream of Mahabad Dam in the considered period varies from 375 to 512 million cubic meters.
Most multi-objective methods attempt to find all Pareto-front solutions. However, this confronts decision makers with the problem of choosing the best solution from a large number of Pareto optimal solutions. The knee points are usually the preferred solution to the multi-objective problem and the most convenient to the decision makers [80,81]. In this research, the knee of a Pareto curve is obtained using the method introduced by [82]. In Figure 11, the knee point is shown in red, which is chosen as the preferred answer to the optimization problem. The amount of e-flow in different months in this solution is presented in Figure 12.
According to Figure 12, the highest amount of e-flow is in late spring and early summer, which is the period of biological growth for plants, and the least rainfall occurs. In this solution, the average value of NDVI during the plant growth period is equal to 0.223, which is about 14% less than the optimal conditions, but 21% more than the average conditions in different years based on the remote sensing results. The area of healthy and dense wetland vegetation (with NDVI greater than 0.35) is also calculated as 214 hectares, which improved by about 25% compared to the average of 171 hectares. The number of birds in this answer is calculated as 24,532, which is 49,054 in the maximum state and 9963 in the average state based on the census, which shows a significant increase and improvement. Therefore, by using this method, it is possible to reach a circumstance where the amount of agricultural deficiency is in a more suitable situation, and the environmental needs are met in such a way that the wetland is in an acceptable ecological condition to be able to provide its functions and services.

5. Conclusions

Wetlands in Iran represent very unique and diverse ecosystems, but they are at considerable risk of degradation and loss arising from water shortages and changes in their hydrology. E-flow assessments represent a compromise between anthropic uses and aquatic ecosystem protection. E-flows have both direct and indirect impacts on the health and condition of wetland vegetation and provide a habitat for wintering waterbirds. Therefore, to reach an optimal e-flow, wetland vegetation and waterbirds are used as an indicator for the ecological condition of the wetland. In this research, we examined the effect of water regime variation on plants and bird–vegetation relationships to reach the e-flow requirement, which is the optimal water allocation to preserve ecosystem health, maintain the wildlife habitat, and achieve sustainable water management in the basin.
To achieve this goal, a remote sensing-assisted simulation optimization approach was employed to reach the best plan for wetland restoration and management at the watershed scale. Using time-series-provided remote sensing, the spatio-temporal analyses of variations in wetland vegetation and water content were determined and linked to the wetland’s water flow to evaluate the alternation in the wetland’s ecological health and condition. Then, we employed the remote sensing results in a simulation optimization model for evaluating the e-flow of the wetland in the Mahabad basin to reach a trade-off between the objective functions and realize the optimal water allocation policy. The WEAP simulation model is linked with MOPSO to reach sustainable management at the agricultural catchment.
By finding the relationship between the amount of water and the condition of the plants in the wetland, as well as the relationship between the water extent and vegetation with the number of waterbirds, we reached a utility function between the ecological conditions and e-flow of the wetland. This function is employed to optimize the allocation of water in the basin between competitor sectors of agriculture and the environment (wetland), in order that sustainable planning in the basin can be achieved by designing the e-flow of the wetland. The results of optimization simulation show that in the selected solution, there is a significant improvement compared to the average conditions in the wetland in terms of ecological conditions, such that the amount of NDVI is 21% and the number of birds is about 2.5-times more than the historical conditions.
This approach can be used to inform decision makers who do not have enough environmental knowledge and for whom the environment is a lower priority than development activities (especially in developing countries). Therefore, with this method, the status of the wetland and its conditions can be investigated with understandable indicators so that a better decision can be made to determine the e-flow and preserve wetlands in agricultural basins.
Determining the ecological conditions of the wetland with ecological indicators plays an important role in determining the amount of environmental flow in this method. Therefore, the more accurate the data used (such as type, species, and number of different species), the better the results can be expected to be with less uncertainty. Using satellite images with higher temporal and spatial accuracy can provide better and more accurate results.
Examining the ecological conditions of ecosystems, in addition to the water allocation, can be used in water resource development projects in the planning phase so that we can move forward towards the sustainable development of water resource systems as much as possible.

Author Contributions

Conceptualization, A.H. and A.M.; Methodology, A.H. and A.M.; Software, A.H.; Validation, A.H. and A.M.; Formal analysis, A.H.; Resources, A.H. and A.M.; Data curation, A.H.; Writing—original draft, A.H.; Writing—review & editing, A.H. and A.M.; Visualization, A.H.; Supervision, A.M. All authors have read and agreed to the published version of the manuscript.

Funding

No funding was received for this study.

Institutional Review Board Statement

Not applicable.

Informed Consent Statement

Not applicable.

Data Availability Statement

Data are available on request from the authors.

Conflicts of Interest

The authors declare no conflict of interest.

References

  1. Driver, L.J.; Cartwright, J.M.; Knight, R.R.; Wolfe, W.J. Species-richness responses to water-withdrawal scenarios and minimum flow levels: Evaluating presumptive standards in the Tennessee and Cumberland River Basins. Water 2020, 12, 1334. [Google Scholar] [CrossRef]
  2. Dudgeon, D.; Arthington, A.H.; Gessner, M.O.; Kawabata, Z.-I.; Knowler, D.J.; Lévêque, C.; Naiman, R.J.; Prieur-Richard, A.-H.; Soto, D.; Stiassny, M.L.J.; et al. Freshwater biodiversity: Importance, threats, status and conservation challenges. Biol. Rev. 2006, 81, 163–182. [Google Scholar] [CrossRef]
  3. Doll, P.; Fiedler, K.; Zhang, J. Global-scale analysis of river flow alterations due to water withdrawals and reservoirs. Hydrol. Earth Syst. Sci. 2009, 12, 2413–2432. [Google Scholar] [CrossRef]
  4. Jiang, Y. China’s water security: Current status, emerging challenges and future prospects. Environ. Sci. Policy 2015, 54, 106–125. [Google Scholar] [CrossRef]
  5. Yue, Z.; Huang, W.; Xiong, L.; Wang, Z.; Wang, X.; Wang, Q.; Shen, Q. A new strategy for environmental flow management by using the remote sensing method. J. Clean. Prod. 2021, 325, 129226. [Google Scholar] [CrossRef]
  6. Hatamkhani, A.; KhazaiePoul, A.; Moridi, A. Sustainable water resource planning at the basin scale with simultaneous goals of agricultural development and wetland conservation. AQUA—Water Infrastruct. Ecosyst. Soc. 2022, 71, 768–781. [Google Scholar] [CrossRef]
  7. Xu, Y.; Wang, Y.; Li, S.; Huang, G.; Dai, C. Stochastic optimization model for water allocation on a watershed scale considering wetland’s ecological water requirement. Ecol. Indic. 2017, 92, 330–341. [Google Scholar] [CrossRef]
  8. Gholami, V.; Khalili, A.; Sahour, H.; Khaleghi, M.R.; Tehrani, E.N. Assessment of environmental water requirement for rivers of the Miankaleh wetland drainage basin. Appl. Water Sci. 2020, 10, 233. [Google Scholar] [CrossRef]
  9. Bigas, H.E. The Global Water Crisis: Addressing an Urgent Security Issue; UNU-INWEH: Hamilton, ON, Canada, 2012. [Google Scholar]
  10. Yi, Y.; Liu, H.; Yang, Z. Integrated ecosystem services-based calculation of ecological water demand for a macrophyte-dominated shallow lake. Glob. Ecol. Conserv. 2020, 21, e00858. [Google Scholar]
  11. Arthington, A.H.; Kennen, J.G.; Stein, E.D.; Webb, J.A. Recent advances in environmental flows science and water management—Innovation in the Anthropocene. Freshw. Biol. 2018, 63, 1022–1034. [Google Scholar] [CrossRef]
  12. Barchiesi, S.; Camacho, A.; Hernández, E.; Guelmami, A.; Monti, F.; Satta, A.; Jordán, O.; Angelini, C. Securing the Environmental Water Requirements of Seasonally Ponding Wetlands: Partnering Science and Management through Benefit Sharing. Wetlands 2022, 42, 46. [Google Scholar] [CrossRef]
  13. Shen, R.; Lan, Z.; Huang, X.; Chen, Y.; Hu, Q.; Fang, C.; Jin, B.; Chen, J. Soil and plant characteristics during two hydrologically contrasting years at the lakeshore wetland of Poyang Lake, China. J. Soils Sediments 2020, 20, 3368–3379. [Google Scholar] [CrossRef]
  14. Brotherton, S.J.; Joyce, C.B.; Berg, M.J.; Awcock, G.J. Immediate and lag effects of hydrological change on floodplain grassland plants. Plant Ecol. 2019, 220, 345–359. [Google Scholar] [CrossRef]
  15. Wang, M.; Gu, Q.; Liu, G.; Shen, J.; Tang, X. Hydrological condition constrains vegetation dynamics for wintering waterfowl in China’s East Dongting Lake wetland. Sustainability 2019, 11, 4936. [Google Scholar] [CrossRef]
  16. Palanisamy, B.; Chui, T.F.M. Understanding wetland plant dynamics in response to water table changes through ecohydrological modelling. Ecohydrology 2013, 6, 287–296. [Google Scholar] [CrossRef]
  17. Ndlala, N.C.; Dube, T. Use of remotely sensed derived metrics to assess wetland vegetation responses to climate variability-induced drought at the Soetendalsvlei wetland system in the Heuningnes Catchment, Western Cape province, South Africa. Afr. J. Aquat. Sci. 2022, 47, 185–196. [Google Scholar] [CrossRef]
  18. Cronk, J.K.; Fennessy, M.S. Wetland Plants. In Encyclopedia of Inland Waters; Elsevier: Amsterdam, The Netherlands, 2009; pp. 590–598. [Google Scholar]
  19. Sims, N.C.; Colloff, M.J. Remote sensing of vegetation responses to flooding of a semi-arid floodplain: Implications for monitoring ecological effects of environmental flows. Ecol. Indic. 2012, 18, 387–391. [Google Scholar] [CrossRef]
  20. Barrett, R.; Nielsen, D.L.; Croome, R. Associations between the plant communities of floodplain wetlands, water regime and wetland type. River Res. Appl. 2010, 26, 866–876. [Google Scholar] [CrossRef]
  21. Robledano, F.; Esteve, M.A.; Farinós, P.; Carre, M.F.; Martínez-Fernández, J. Terrestrial birds as indicators of agricultural-induced changes and associated loss in conservation value of med terranean wetlands. Ecol. Indic. 2010, 10, 274–286. [Google Scholar] [CrossRef]
  22. Teng, J.; Xia, S.; Liu, Y.; Yu, X.; Duan, H.; Xiao, H.; Zhao, C. Assessing habitat suitability for wintering geese by using Normalized Difference Water Index (NDWI) in a large floodplain wetland, China. Ecol. Indic. 2021, 122, 107260. [Google Scholar] [CrossRef]
  23. Guan, L.; Lei, J.; Zuo, A.; Zhang, H.; Lei, G.; Wen, L. Optimizing the timing of water level recession for conservation of wintering geese in Dongting Lake, China. Ecol. Eng. 2016, 88, 90–98. [Google Scholar] [CrossRef]
  24. Zhang, C.; Yuan, Y.; Zeng, G.; Liang, J.; Guo, S.; Huang, L.; Hua, S.; Wu, H.; Zhu, Y.; An, H.; et al. Influence of hydrological regime and climatic factor on waterbird abundance in Dongting Lake Wetland, China: Implications for biological conservation. Ecol. Eng. 2016, 90, 473–481. [Google Scholar] [CrossRef]
  25. Szostek, K.L.; Becker, P.H. Survival and local recruitment are driven by environmental carry-over effects from the wintering area in a migratory seabird. Oecologia 2015, 178, 643–657. [Google Scholar] [CrossRef] [PubMed]
  26. Mistry, J.; Berardi, A.; Simpson, M. Birds as indicators of wetland status and change in the North Rupununi, Guyana. Biodivers. Conserv. 2008, 17, 2383–2409. [Google Scholar] [CrossRef]
  27. Sekercioglu, C.H. Increasing awareness of avian ecological function. Trends Ecol. Evol. 2006, 21, 464–471. [Google Scholar] [CrossRef]
  28. Si, Y.; Skidmore, A.K.; Wang, T.; de Boer, W.F.; Toxopeus, A.G.; Schlerf, M.; Oudshoorn, M.; Zwerver, S.; van der Jeugd, H.; Exo, K.M.; et al. Distribution of Barnacle Geese Branta leucopsis in relation to food resources, distance to roosts, and the location of refuges. Ardea 2011, 99, 217–226. [Google Scholar] [CrossRef]
  29. Durant, D.; Fritz, H.; Duncan, P. Feeding patch selection by herbivorous Anatidae: The influence of body size, and of plant quantity and quality. J. Avian Boil. 2004, 35, 144–152. [Google Scholar] [CrossRef]
  30. Liu, X.; Hu, G.; Chen, Y.; Li, X.; Xu, X.; Li, S.; Pei, F.; Wang, S. High-resolution multitemporal mapping of global urban land using Landsat images based on the Google Earth Engine Platform. Remote Sens. Environ. 2018, 209, 227–239. [Google Scholar] [CrossRef]
  31. Rajashekara, S.; Venkatesha, M. Eco-spatial and temporal variation in waterbirds composition and their relationship with habitat characteristics of Urban Lakes of Bengaluru city, India. Int. J. Adv. Res. 2014, 2, 60–80. [Google Scholar]
  32. Xia, S.; Liu, Y.; Chen, B.; Jia, Y.; Zhang, H.; Liu, G.; Yu, X. Effect of water level fluctuations on wintering goose abundance in Poyang Lake wetlands of China. Chin. Geogr. Sci. 2017, 27, 248–258. [Google Scholar] [CrossRef]
  33. Dronova, I.; Beissinger, S.R.; Burnham, J.W.; Gong, P. Landscape-Level Associations of Wintering Waterbird Diversity and Abundance from Remotely Sensed Wetland Characteristics of Poyang Lake. Remote. Sens. 2016, 8, 462. [Google Scholar] [CrossRef]
  34. Yan, D.; Luan, Z.; Xu, D.; Xue, Y.; Shi, D. Modeling the spatial distribution of three typical dominant wetland vegetation species’ response to the hydrological gradient in a Ramsar Wetland, Honghe National Nature Reserve, Northeast China. Water 2020, 12, 2041. [Google Scholar] [CrossRef]
  35. Ashok, A.; Rani, H.P.; Jayakumar, K.V. Monitoring of dynamic wetland changes using NDVI and NDWI based landsat imagery. Remote Sens. Appl. Soc. Environ. 2021, 23, 100547. [Google Scholar] [CrossRef]
  36. Zheng, Y.; Han, J.; Huang, Y.; Fassnacht, S.R.; Xie, S.; Lv, E.; Chen, M. Vegetation response to climate conditions based on NDVI simulations using stepwise cluster analysis for the Three-River Headwaters region of China. Ecol. Indic. 2018, 92, 18–29. [Google Scholar] [CrossRef]
  37. Gómez-Sapiens, M.M.; Jarchow, C.J.; Flessa, K.W.; Shafroth, P.B.; Glenn, E.P.; Nagler, P.L. Effect of an environmental flow on vegetation growth and health using ground and remote sensing metrics. Hydrol. Process. 2020, 34, 1682–1696. [Google Scholar] [CrossRef]
  38. Liang, J.; Hua, S.; Zeng, G.; Yuan, Y.; Lai, X.; Li, X.; Li, F.; Wu, H.; Huang, L.; Yu, X. Application of weight method based on canonical correspondence analysis for assessment of Anatidae habitat suitability: A case study in East Dongting Lake, Middle China. Ecol. Eng. 2015, 77, 119–126. [Google Scholar] [CrossRef]
  39. Du, Y.; Zhang, Y.; Ling, F.; Wang, Q.; Li, W.; Li, X. Water bodies’ mapping from Sentinel-2 imagery with modified normalized difference water index at 10-m spatial resolution produced by sharpening the SWIR band. Remote Sens. 2016, 8, 354. [Google Scholar] [CrossRef]
  40. Iranian Wetlands Protection Plan. 2018. Available online: http://www.wetlandsproject.ir/publications/technical-reports/ (accessed on 21 June 2020).
  41. Aban Pazhouh Consulting Engineers Company. Lake Urmia; Iran Shenasi: Tehran, Iran, 2017; pp. 245–247. [Google Scholar]
  42. Sarp, G.; Ozcelik, M. Water body extraction and change detection using time series: A case study of Lake Burdur, Turkey. J. Taibah Univ. Sci. 2017, 11, 381–391. [Google Scholar] [CrossRef]
  43. Gautam, V.K.; Gaurav, P.K.; Murugan, P.; Annadurai, M.J.A.P. Assessment of surface water Dynamics in Bangalore using WRI, NDWI, MNDWI, supervised classification and KT transformation. Aquat. Proc. 2015, 4, 739–746. [Google Scholar] [CrossRef]
  44. McFeeters, S.K. The use of the Normalized Difference Water Index (NDWI) in the delineation of open water features. Int. J. Remote Sens. 1996, 17, 1425–1432. [Google Scholar] [CrossRef]
  45. Xu, H. Modification of normalised difference water index (NDWI) to enhance open water features in remotely sensed imagery. Int. J. Remote Sens. 2006, 27, 3025–3033. [Google Scholar] [CrossRef]
  46. Lu, S.; Wu, B.; Yan, N.; Wang, H. Water body mapping method with HJ-1A/B satellite imagery. Int. J. Appl. Earth Obs. Geoinf. 2011, 13, 428–434. [Google Scholar] [CrossRef]
  47. Kwang, C.; Jnr, E.M.O.; Amoah, A.S. Comparing of landsat 8 and sentinel 2A using water extraction indexes over Volta River. J. Geogr. Geol. 2018, 10, 1–7. [Google Scholar] [CrossRef]
  48. Vrieling, A.; De Leeuw, J.; Said, M.Y. Length of growing period over Africa: Variability and trends from 30 years of NDVI time series. Remote Sens. 2013, 5, 982–1000. [Google Scholar] [CrossRef]
  49. Hatamkhani, A.; Moridi, A.; Asadzadeh, M. Water allocation using ecological and agricultural value of water. Sustain. Prod. Consum. 2022, 33, 49–62. [Google Scholar] [CrossRef]
  50. Wang, Z.; Liu, K.; Cao, J.; Peng, L.; Wen, X. Annual Change Analysis of Mangrove Forests in China during 1986–2021 Based on Google Earth Engine. Forests 2022, 13, 1489. [Google Scholar] [CrossRef]
  51. Sun, Z.; Xu, R.; Du, W.; Wang, L.; Lu, D. High resolution urban land mapping in China from sentinel 1A/2 imagery based on Google Earth Engine. Remote Sens. 2019, 11, 752. [Google Scholar] [CrossRef]
  52. Xu, H. Analysis of impervious surface and its impact on urban heat environment using the normalized difference impervious surface index (NDISI). Photogramm. Eng. Remote Sens. 2010, 76, 557–565. [Google Scholar] [CrossRef]
  53. Huang, H.; Chen, Y.; Clinton, N.; Wang, J.; Wang, X.; Liu, C.; Gong, P.; Yang, J.; Bai, Y.; Zheng, Y.; et al. Mapping major land cover dynamics in Beijing using all Landsat images in Google Earth Engine. Remote Sens. Environ. 2017, 202, 166–176. [Google Scholar] [CrossRef]
  54. Ismail, M.A.; Waqas, M.; Ali, A.; Muzzamil, M.M.; Abid, U.; Zia, T. Enhanced index for water body delineation and area calculation using Google Earth Engine: A case study of the Manchar Lake. J. Water Clim. Change 2022, 13, 557–573. [Google Scholar] [CrossRef]
  55. Shelestov, A.; Lavreniuk, M.; Kussul, N.; Novikov, A.; Skakun, S. Exploring Google Earth Engine platform for big data processing: Classification of multi-temporal satellite imagery for crop mapping. Front. Earth Sci. 2017, 5, 17. [Google Scholar] [CrossRef]
  56. Hatamkhani, A.; Moridi, A.; Haghighi, A.T. Incorporating ecosystem services value into the optimal development of hydropower projects. Renew. Energy 2023, 203, 495–505. [Google Scholar] [CrossRef]
  57. Hatamkhani, A.; Moridi, A. Optimal development of agricultural sectors in the basin based on economic efficiency and social equality. Water Resour. Manag. 2021, 35, 917–932. [Google Scholar] [CrossRef]
  58. Yates, D.; Sieber, J.; Purkey, D.; Huber-Lee, A. WEAP21—A demand-, priority-, and preference-driven water planning model: Part 1: Model characteristics. Water Int. 2005, 30, 487–500. [Google Scholar] [CrossRef]
  59. Eberhart, R.; Kennedy, J. A new optimizer using particle swarm theory. In Proceedings of the Sixth International Symposium on Micro Machine and Human Science, MHS’95, Nagoya, Japan, 4–6 October 1995; IEEE: Piscataway, NJ, USA, 1995; pp. 39–43. [Google Scholar]
  60. Coello, C.C.; Lechuga, M.S. MOPSO: A proposal for multiple objective particle swarm optimization. In Proceedings of the 2002 Congress on Evolutionary Computation, CEC’02 (Cat. No. 02TH8600), Honolulu, HI, USA, 12–17 May 2002; IEEE: Piscataway, NJ, USA, 2002; Volume 2, pp. 1051–1056. [Google Scholar]
  61. Malik, S.; Pal, S.C.; Das, B.; Chakrabortty, R. Intra-annual variations of vegetation status in a sub-tropical deciduous forest-dominated area using geospatial approach: A case study of Sali watershed, Bankura, West Bengal, India. Geol. Ecol. Landsc. 2020, 4, 257–268. [Google Scholar] [CrossRef]
  62. Zhe, M.; Zhang, X. Time-lag effects of NDVI responses to climate change in the Yamzhog Yumco Basin, South Tibet. Ecol. Indic. 2021, 124, 107431. [Google Scholar] [CrossRef]
  63. Phiri, M.; Shiferaw, A.Y.; Tesfamichael, G.S. Biomelevel relationships between vegetation indices andclimate variables using time-series analysis of remotely-sensed data. GIScience Remote Sens. 2020, 57, 464–482. [Google Scholar] [CrossRef]
  64. Wu, D.; Zhao, X.; Liang, S.; Zhou, T.; Huang, K.; Tang, B.; Zhao, W. Time-lag effects of globalvegetation responses to climate change. Glob. Change Biol. 2015, 21, 3520–3531. [Google Scholar] [CrossRef]
  65. Wu, C.; Webb, J.A.; Stewardson, M.J. Modelling impacts of environmental water on vegetation of a semi-arid floodplain–lakes system using 30-year Landsat data. Remote Sens. 2022, 14, 708. [Google Scholar] [CrossRef]
  66. Chuai, X.W.; Huang, X.J.; Wang, W.J.; Bao, G. NDVI, temperature and precipitation changes and their relationships with different vegetation types during 1998–2007 in Inner Mongolia, China. Int. J. Clim. 2013, 33, 1696–1706. [Google Scholar] [CrossRef]
  67. Menendez, H.M.; Wuellner, M.R.; Turner, B.L.; Gates, R.N.; Dunn, B.H.; Tedeschi, L.O. A spatiallandscape scale approach for estimating erosion, water quantity, and quality in response to South Dakotagrassland conversion. Nat. Resour. Model. 2019, 3, 32–828. [Google Scholar]
  68. Hou, W.; Gao, J.; Wu, S.; Dai, E. Interannual variations in growing-season NDVI and its correlation with climate variables in the southwestern Karst region of China. Remote Sens. 2015, 7, 11105–11124. [Google Scholar] [CrossRef]
  69. Hou, G.; Xu, C.; Dong, K.; Zhao, J.; Liu, Z. Spatial-temporal difference of time lag for response of NDVI to climatic factors in Changbai mountains. Fresen Env. Bull. 2016, 25, 3348–3362. [Google Scholar]
  70. Omute, P.; Corner, R.; Awange, J.L. The use of NDVI and its derivatives for monitoring Lake Victoria’s water level and drought conditions. Water Resour. Manag. 2012, 26, 1591–1613. [Google Scholar] [CrossRef]
  71. Wu, T.; Bai, H.; Feng, F.; Lin, Q. Multi-month time-lag effects of regional vegetation responses to precipitation in arid and semi-arid grassland: A case study of Hulunbuir, Inner Mongolia. Nat. Resour. Model. 2022, 35, e12342. [Google Scholar] [CrossRef]
  72. Siriwardena, G.M.; Baillie, S.R.; Buckland, S.T.; Fewster, R.M.; Marchant, J.H.; Wilson, J.D. Trends in the abundance of farmland birds: A quantitative comparison of smoothed Common Birds Census indices. J. Appl. Ecol. 1998, 35, 24–43. [Google Scholar] [CrossRef]
  73. De, M.; Medda, S.; Dey, S.R. Ecological Health of Wetland Ecosystem: An overview. Int. J. Exp. Res. Rev. 2018, 17, 20–29. [Google Scholar] [CrossRef]
  74. Jiang, H.; Liu, C.; Sun, X.; Lu, J.; Zou, C.; Hou, Y.; Lu, X. Remote sensing reversion of water depths and water management for the stopover site of siberian cranes at Momoge, China. Wetlands 2015, 35, 369–379. [Google Scholar] [CrossRef]
  75. Celdrán, P.F.; Aymerich, F.R. Structure and Distribution of the Waterbird Community in the Mar Menor Coastal Lagoon (SE Spain) and Relationships with Environmental Gradients. Waterbirds 2010, 33, 479–494. [Google Scholar] [CrossRef]
  76. Paillisson, J.-M.; Reeber, S.; Marion, L. Bird assemblages as bio-indicators of water regime management and hunting disturbance in natural wet grasslands. Boil. Conserv. 2002, 106, 115–127. [Google Scholar] [CrossRef]
  77. Rajpar, M.N.; Zakaria, M. Effects of water level fluctuation on waterbirds distribution and aquatic vegetation composition at natural wetland reserve, Peninsular Malaysia. Int. Sch. Res. Not. 2011, 2011, 324038. [Google Scholar] [CrossRef]
  78. Shaoxia, X.; Dingkun, Y.; Peng, C.; Houlang, D.; Jiakun, T.; Xiubo, Y. Suitable-habitat dynamics for wintering geese in China’s largest freshwater lake. Glob. Ecol. Conserv. 2021, 27, e01528. [Google Scholar] [CrossRef]
  79. Wu, X.; Lv, M.; Jin, Z.; Michishita, R.; Chen, J.; Tian, H.; Tu, X.; Zhao, H.; Niu, Z.; Chen, X.; et al. Normalized difference vegetation index dynamic and spatiotemporal distribution of migratory birds in the Poyang Lake wetland, China. Ecol. Indic. 2014, 47, 219–230. [Google Scholar] [CrossRef]
  80. Liang, J.J.; Zhu, X.P.; Yue, C.T.; Li, Z.H.; Qu, B.Y. Performance analysis on knee point selection methods for multi-objective sparse optimization problems. In Proceedings of the 2018 IEEE Congress on Evolutionary Computation (CEC), Rio de Janeiro, Brazil, 8–13 July 2018; IEEE: Piscataway, NJ, USA, 2018; pp. 1–8. [Google Scholar]
  81. Li, W.; Zhang, G.; Zhang, T.; Huang, S. Knee point-guided multiobjective optimization algorithm for microgrid dynamic energy management. Complexity 2020, 2020, 8877008. [Google Scholar] [CrossRef]
  82. Branke, J.; Deb, K.; Dierolf, H.; Osswald, M. Finding knees in multi-objective optimization. In Proceedings of the International Conference on Parallel Problem Solving from Nature, Birmingham, UK, 18–22 September 2004; pp. 722–731. [Google Scholar]
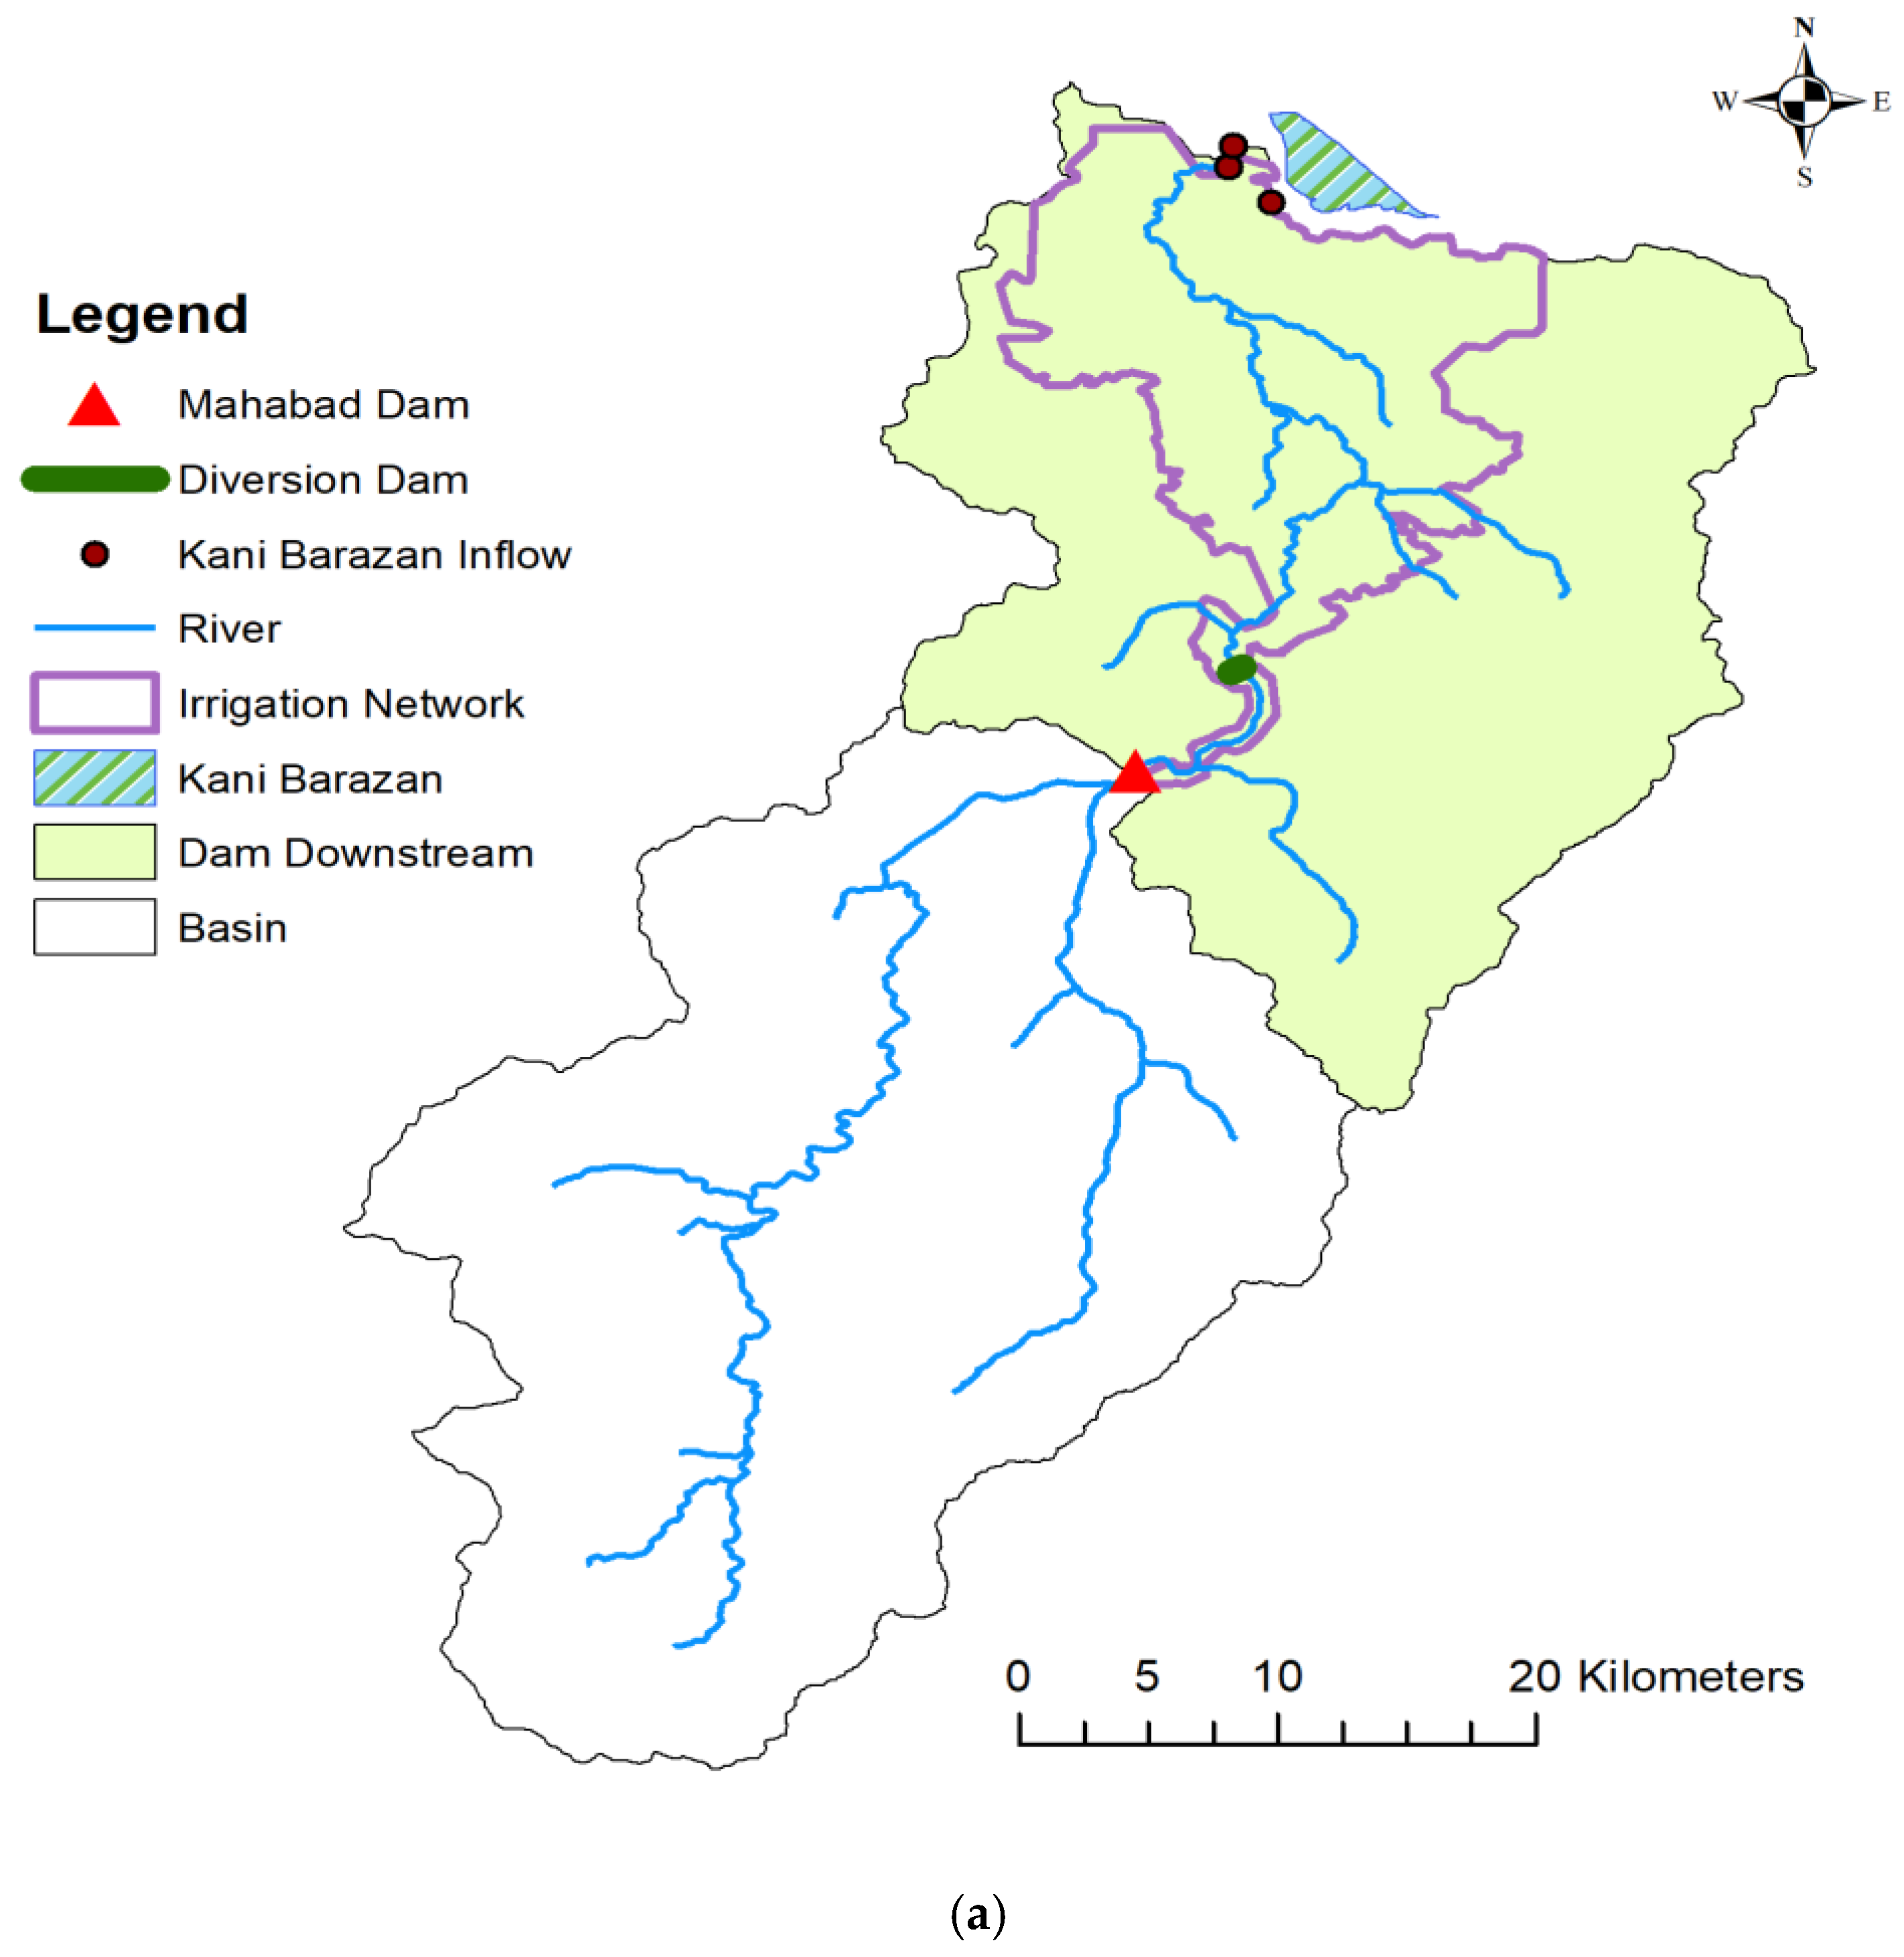
Figure 1. (a) Map of the Mahabad basin, (b) satellite image of the location of the Kani Brazan wetland in the northwest of the Mahabad basin.
Sustainability 15 13926 g001aSustainability 15 13926 g001b
Figure 2. Geometric curve of the Mahabad reservoir.
Sustainability 15 13926 g002
Figure 3. Average inflow and evaporation of the Mahabad reservoir.
Sustainability 15 13926 g003
Figure 4. Land use map of Mahabad Dam downstream.
Sustainability 15 13926 g004
Figure 5. Observed and extracted wetland’s water area using (a) NDWI and (b) MNDWI.
Sustainability 15 13926 g005
Figure 6. Flowchart of simulation optimization model.
Sustainability 15 13926 g006
Figure 8. NDVI distribution in (a) June 2017, (b) June 2019.
Sustainability 15 13926 g008
Figure 9. Changes in the wetland area and the quantity of observed waterbirds in various years.
Sustainability 15 13926 g009
Figure 10. NDWI in (a) January 2017, (b) January 2019.
Sustainability 15 13926 g010aSustainability 15 13926 g010b
Figure 11. Pareto front curve of non-dominated solution of the problem.
Sustainability 15 13926 g011
Figure 12. E-flow of the Kani Barazan in the preferred solution.
Sustainability 15 13926 g012
Table 1. PSO algorithm parameter values.
ParameterValue
χ 1
W m a x 0.9
W m i n 0.4
C 1 1.8
C 2 1.8
Table 2. The linear regression coefficients.
Variables Standard Errort Statp-ValueSignificance FMultiple RR Square
X Variable 1 (NDVI)1799.32435.31590.00030.00040.88750.7876
X Variable 2 (Water area)34163.06722.26760.0468
Disclaimer/Publisher’s Note: The statements, opinions and data contained in all publications are solely those of the individual author(s) and contributor(s) and not of MDPI and/or the editor(s). MDPI and/or the editor(s) disclaim responsibility for any injury to people or property resulting from any ideas, methods, instructions or products referred to in the content.