Abstract
In the current era, economic growth is inevitable for global prosperity but achieving sustainable economic development is one of the significant challenges for the developing world. The present study explores the impacts of foreign direct investment, energy use, and technological innovations on the economic growth and environmental quality of BRICS countries for the period 1990–2018. We used the augmented mean group (AMG), the common correlated effects mean group estimator (CCEMG), and several other modern-day empirical techniques to analyze data. The findings show that foreign direct investment increases economic growth but harms the environmental sustainability of BRICS countries. Moreover, we have seen that energy use is directly proportional to economic growth and CO2 emissions. This confirms that energy use is one of the factors which harms the environmental quality in BRICS economies. Likewise, economic growth increases CO2 emissions. On the other hand, technology innovation has a direct relationship with economic growth but an inverse relationship with CO2 emissions as it improves the environmental sustainability of the BRICS region. This research adds to the existing literature by exploring the interplay between FDI, innovation, energy use, economic growth, and environmental outcomes in the context of major emerging economies. The study’s findings provide empirical evidence on the role of these factors in shaping the environmental outcomes in the BRICS economies, and they have implications for policymakers and stakeholders in addressing environmental challenges such as global warming and climate change.
1. Introduction
In the current global scenario, all nations aim to achieve higher economic growth for the prosperity of their people. However, the process of huge economic growth is dependent on a high level of energy consumption, which is harmful to the natural environment. Foreign direct investment plays an important role in boosting economic growth by utilizing energy resources, but it can deteriorate the environment of the host countries. Global warming and climate change are the most persistent environmental concerns in the contemporary world. Arguably, climate change and global warming pose severe threats to sustainable development across the globe [1,2,3,4]. One significant cause of global warming and environmental degradation is greenhouse emissions. For a couple of decades, carbon dioxide emissions (CO2) have gained wide attention in the literature to assess environmental degradation. On the other hand, rapid globalization (FDI and trade openness), increased energy consumption, rising industrialization, and urbanization change the human lifestyle and cause potential environmental concerns throughout the world [5,6,7,8]. Due to global manufacturing, global energy use has significantly risen to 1922.5 kg of oil equivalent from 1662.93 kg between 1990 and 2014. Environmental degradation has affected emerging economies more than developing economies due to their weak ecosystem [9,10,11]. The increase in economic growth in these countries usually deteriorates the environmental quality. Therefore, sustainable economic growth is the focus of all policymakers and researchers. In dealing with the issue of environmental degradation, researchers and policymakers have considered technological innovation to be one of the essential solutions. Technological innovation can deal with environmental issues arising from FDI, economic growth, and energy consumption. Policymakers and researchers have recommended technology innovation as an energy-efficient source for production processes, ensuring sustainable economic growth worldwide. Various variables such as FDI, trade openness, economic growth, and energy use depend on fossil fuels. Modern technologies and sustainable economic policies must transform these fossil fuels into sustainable and energy-efficient sources [12,13,14,15].
Foreign direct investment (FDI) has been playing a significant role in bringing new technologies, supporting developmental activities, augmenting productivity, and boosting economic growth since the early 90s [16]. Policymakers have experienced rapid economic growth in emerging economies but with substantial environmental degradation due to a higher level of energy consumption [17,18,19]. The studies on the FDI, energy use, and environment nexus provide inconclusive and contradictory results. There are two main theories related to environmental quality: “the pollution haven hypothesis” and “the pollution halo hypothesis”. Several studies endorse “the pollution haven hypothesis”, which posits that the consequences of FDI inflows are deteriorative for the environment [20,21,22,23]. For example, Hanif [24] explored the nexus among FDI, fossil fuels, income, and the environment from 1990 to 2013. The study’s outcomes confirm “the pollution haven hypothesis”, indicating that FDI causes pollution. Likewise, Tang and Tan [25] studied the impact of FDI on the environment of Asian economies and revealed that FDI results in environmental degradation. On the other hand, other studies confirm the pollution halo hypothesis, indicating that FDI reduces carbon emissions in emerging Asian countries. In the same way, Zhu et al. [20] examined the nexus between FDI, energy consumption, and the environment and validated the pollution halo hypothesis. Zhao and Zhang [26] examined the impacts of FDI on the environmental degradation of China during 1995–2010. The study concludes that FDI increases carbon emissions.
The current study is significant in the literature based on the constant economic activities and rising energy consumption in the BRICS economies due to rising production. The BRICS countries contribute to approximately 23% of the world’s GDP, accounting for 41% of the global population, and consume 38% of the total world energy. Additionally, more than a quarter of the world’s total area is covered by BRICS countries [26]. BRICS countries have witnessed a 19% rise in FDI inflows, resulting in new technologies and economic growth in the last two decades. On the other side, the rapid economic development has posed severe environmental threats in the region. The BRICS region produces approximately 41% of the total CO2 emissions. Governments and policymakers have been striving hard to tackle the issues related to environmental degradation without hindering the production level [5,27].
Considering the importance of the BRICS region, this study primarily aims to investigate the impact of FDI, energy use, and technological innovations on the economic growth and environmental quality of the BRICS region for 1990–2018. This study will contribute to the existing literature in several ways. First, it will provide fresh insights into the impact of foreign direct investment, energy use, and technological innovation on economic growth and environmental sustainability in the context of BRICS economies. The study’s second objective is to test the impression of foreign direct investment (FDI), energy use, and technology innovations on the economic growth and environmental quality of BRICS economies using the latest estimators that account for heteroscedasticity endogeneity and cross-sectional dependence. Additionally, the study’s results will be helpful in policymaking regarding sustainable development in BRICS economies. Finally, the study will serve as a valuable reference for future research, providing a starting point for further exploration and analysis.
2. Review of Literature
We have divided the literature into three sub-strands. The first sub-strand of the research sheds light on the FDI, economic growth, and environmental quality nexus. The second part highlights the related literature on energy use, economic growth, and environmental quality. Finally, the third sub-strand of the literature explains the related literature on technology innovation, economic growth, and environmental quality.
2.1. FDI, Economic Growth and Environmental Quality
The relationship between FDI, economic growth, and environmental quality has been discussed previously but the studies have obtained mixed results so far. FDI is considered an important stimulus to enhance economic growth. However, the effects of FDI may deteriorate the environmental quality of host economies. In the existing literature, there are two opinions regarding FDI and the environment: the “pollution haven hypothesis” and the “pollution halo hypothesis”. The pollution haven hypothesis indicates that FDI results in environmental degradation in emerging economies due to their vulnerable ecosystems. Developing economies attract foreign investment for industrialization and economic growth but it affects their environmental sustainability [28,29,30]. The developed economies introduce heavily polluting enterprises into emerging economies, resulting in high CO2 emissions [31]. In line with the pollution haven hypothesis, developed countries participating in FDI typically disseminate technologies that contribute to increasing the release of carbon dioxide emissions [32]. Liu and Zhang [33] analyzed the impact of FDI on the environmental quality of China and found that FDI significantly deteriorated air quality in China. The environmental quality is comparatively worsened in big cities. On the contrary, the pollution halo hypothesis posits that FDI positively impacts emerging economies’ economic growth and environmental quality as FDI transfers environmentally friendly technologies to the host countries. Several studies have confirmed the pollution halo hypothesis. For example, Shahbaz et al. [34] analyzed the nexus between FDI and CO2 emissions in 99 economies for the period 1975–2012. The study concluded that FDI positively impacts environmental quality by reducing CO2 emissions. Similarly, Bhattacharya et al. [35] and Omri et al. [36] also confirmed that FDI reduces CO2 emissions in the long run. Wheeler [37] explored the impact of FDI on CO2 emissions in AESAN economies and found that FDI inflows decrease pollution. Demena and van Bergeijk [38] analyzed the FDI and environment nexus using meta-analysis. The results indicated that FDI decreases CO2 emissions. Ju et al. [39] investigated the impressions of foreign direct investment, financial development, and governance on the environmental quality of Arab countries and found that FDI significantly improves the environmental quality in Arab economies. Pao and Tsai [40] examined the long-run relationship between energy use, FDI, and CO2 emissions for BRIC (Brazil, Russia, India, and China) economies by using panel cointegration and causality analyses. The results indicate that FDI increases pollution in BRICS countries. The empirical results also supported the validity of the EKC hypothesis in the BRIC economies. Merican et al. [41] examined the relationship between FDI inflows and CO2 emissions for Malaysia, Thailand, Indonesia, Singapore, and the Philippines by using the ARDL bounds testing approach. The authors found a long-run-level relationship between the variables for each country. However, the coefficient of FDI inflows on environmental pollution was found to be positive and significant only for Malaysia, Thailand, and the Philippines. On the contrary, it was found that FDI inflows positively affect environmental quality in the case of Indonesia and have no significant environmental impact in the case of Singapore. Chandran and Tang [42] also examined the relationship between income, energy, FDI, and CO2 emissions by employing Johansen cointegration and Granger causality tests for the same five Asian economies.
Alshubiri et al. [43] employed GMM and applied the fixed-effect method to examine the nexus between FDI and CO2 emissions and shows that FDI improves the environmental quality of selected OECD countries in the long run. Islam et al. [44] conducted a study in Bangladesh and found similar results and revealed that FDI has a negative impact on CO2 emissions; however, the short-term and long-term economic growth in the country negatively influences the environmental quality. Recently, Zhuang et al. [45] also conducted an analogous study from China’s perspective and found that FDI and technological innovation both reduce the emissions of CO2 in the long run. Liu and Wang [46] analyzed the impact of Chinese FDI on OBRI economies and revealed that FDI from other countries in the OBRI region is not helping this region protect its environment. However, Chinese FDI in this region positively impacts the region’s environmental quality. The authors further explained that China is not only trying to boost this region economically but also to introduce policies that protect the environment. Most of the above-mentioned studies used the data of a single country and found mixed results. Azam and Raza [47] extensively examined the impact of FDI on environmental quality using data from 125 countries. This study found that FDI negatively influences the environmental quality of Asia and Africa and positively influences the European and Latin American regions. This study further finds that developing countries are not following the policies that protect their environment while attracting FDI. The study suggested that these developing countries should develop policies that not only attract FDI but also protect their environment. From the above discussion, we found that the studies on the relationship between FDI, economic growth, and environmental quality have obtained mixed and inconclusive results. Therefore, this study will provide some new perspectives on sustainable economic growth and environmental prosperity.
2.2. Energy Use, Economic Growth, and Environmental Quality
The nexus between energy use, economic growth, and CO2 emissions has been one of the hot issues for the last two decades, but so far, the studies have obtained mixed results. Conventionally, energy has been considered as a rapid accelerator for the economic progress of any country. However, this traditional energy consumption puts huge pressure on the environment. So, traditional energy consumption becomes a point of contradiction between economic growth and the goals of environmental sustainability. Therefore, recently, renewable energy sources have gained much attention from researchers and policymakers in addressing the issues arising from CO2 emissions [48,49]. Hu et al. [2] investigated the effects of energy use on the environmental quality of ASEAN countries for the period 1990–2014. By employing DOLS and FMOLS empirical techniques, the study found that energy consumption significantly increases CO2 emissions. Shahbaz et al. [50] studied the effect of energy use and economic growth on the environment in the case of Malaysia. The study found that energy use and economic growth significantly increase CO2 emissions. Similarly, Jammazi and Aloui [51] explored the nexus between energy consumption and environmental quality in Gulf economies and found that energy use increases environmental pollution. Pao and Tsai [40] found a bidirectional causal connection between energy use and CO2 emissions in BRICS countries. In a similar vein, Lean and Smyth [52] confirmed a unidirectional causal direction from energy consumption to CO2 emissions and from economic growth to CO2 emissions in the case of ASEAN countries. Kasman and Duman [53] studied the impact of energy use and CO2 emissions in Croatia and concluded that energy consumption contributes to environmental pollution. Likewise, ref. [54] confirmed that energy use is one of the most significant contributing factors to China’s environmental degradation. Sharif Hossain [55] studied newly industrialized countries and found that energy use, economic growth, and CO2 emissions are causal. Apergis et al. [56] recommended renewable energy sources as alternatives to traditional energy sources to combat environmental pollution. In another study, Huang et al. [57] revealed that long-term projects in economies resulted in more emissions of CO2. However, green energy is the best alternative with which to protect the environment in short as well as long-term projects. Ref. [58] stated that countries should develop such economic policies that incentivize investors to continue their business operations while protecting the environment and smoothing their business activities. Recently, Jiang and Khan (2023) [59] also confirmed these results and revealed that the traditional use of energy resources is creating environmental pollution and challenging our traditional industrial system. Studies have also suggested that countries should use renewable energy resources to protect the environment and save industries. Moreover, Destek and Sarkodie [60], Murshed et al. [61], Wang et al. [62] and many other studies found that there is a significant and positive relationship between energy use, economic growth, and CO2 emissions.
2.3. Technology Innovation, Economic Growth, and Environmental Quality
The mainstream literature on FDI posits that FDI improves the economic growth of host countries; however, it adversely affects the environment by increasing CO2 emissions. Grossman and Helpman [63] explored the impact of FDI on the environment and concluded that there is a possibility that FDI reduces CO2 emissions by transferring advanced technology to the host countries. FDI can mitigate CO2 emissions, transfer environmentally friendly technologies to host countries, and improve local businesses of host countries. Romer [64] explored the effect of technological innovation on CO2 emissions globally and found that technological innovation enhances environmental quality by reducing CO2 emissions. Mainstream literature confirms that technological innovation benefits the host economy’s environmental sustainability. Technological innovation significantly reduces environmental emissions with the help of the spillover effect [65,66,67,68]. Similarly, Fei et al. [69] explored the association between technological innovation and CO2 emissions in Norway and New Zealand for the period 1971–2010. The study revealed that research and development improve environmental quality through green energy. Likewise, Henriques and Borowiecki [70] confirm that technological innovation has a significant positive role in the environmental quality of twelve selected high-income economies in the long run. Ahmad et al. [71] investigated the nexus between technological innovation and environmental quality in BRICS economies from 2004 to 2018. By employing panel data, the study found that technological innovation improves the environmental quality of BRICS countries. Sohag et al. [31] studied the nexus between technological innovation, energy use, and CO2 emissions and found that technology innovation significantly reduces energy consumption and CO2 emissions. Lin and Ma [72] analyzed the nexus between technological innovation and CO2 emissions in 30 provinces of China from 2008 to 2017. The study outcomes reveal that technological efficiency improves environmental quality in China. Recently, Suki et al. [73] also conducted a similar study from the perspective of Malaysia. This study argues that technological innovation not only boosts the production capacity of businesses but also helps reduce CO2 emissions. Another study conducted by Li et al. [74] in MINT economies also confirmed these results and revealed that neutralizing environmental pollution is possible through green financing and technological innovation. Recently, a study conducted by Suki et al. [73] in the ASEAN region also confirmed these results and stated that the ASEAN region’s economic activities are mainly based on traditional energy sources resulting in more CO2 emissions. This perspective study suggested that this region should use alternatives to traditional energy sources and enhance the number of technology patents in order to control the degradation of the environment. Similarly, Gao et al. [75] also stated that green technological innovation is more helpful in reducing CO2 emissions and helps countries to tackle the problem of climate change. This study further suggests that countries should formulate their industrial structure to use innovative green technologies primarily. This upgrade of industry will not only be beneficial for the industry but also for the sustainability of the environment. Jiang and Khan [59] also confirm this result and revealed that the traditional mode of industrial development, trading, and the use of energy is harmful to our environment and creates environmental challenges for different countries. To resolve this issue, the study suggested that countries should use innovative technologies and use renewable energy resources. Zhuang et al. [45] also confirm these results from the perspective of China and revealed that technological innovation brings environmental sustainability.
From reviewing the above literature, we find that FDI, energy use and technological innovation play an important role in economic growth and environmental sustainability. Apart from stringent environmental regulations, Porter’s hypothesis proposes that environmental regulations can drive firms to adopt cleaner production methods and technologies, which can lead to cost savings, increased competitiveness, and new market opportunities [76]. Moreover, technological advancements and research progress have enabled leading economies to focus on energy efficiency in both consumption and generation. These economies are also shifting toward renewable energy resources and mitigating the release of dangerous gases. Such actions are considered critical strategies in addressing the risks linked to energy demand [77].
2.4. The Conceptual Framework
The mainstream literature posits that FDI, energy use, and trade openness improves economic growth. However, these variables decrease the environmental quality. On the other hand, patents improve both economic growth and environmental sustainability, as mentioned in Figure 1.
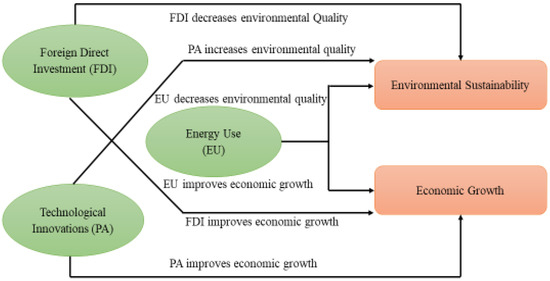
Figure 1.
The conceptual framework.
3. Methodology and Model Specification
In the following, the literature we have consulted used CO2 emissions to assess environmental quality. Environmental quality is associated with higher and lower levels of CO2 emissions: good environmental quality is associated with lower CO2 emissions; while higher CO2 emissions mean poor environmental quality. We have measured technology innovation by patent numbers, and economic growth is measured by GDP. Other essential variables include FDI, trade openness (TO), and energy use [6,78]. The existing literature revealed that all variables stated above affect environmental quality. Rafiq et al. [1] also investigated the relationship among these variables; however, in our study, we have used two models for empirical investigation, i.e., the CO2 model and the GDP model. Given this, we have attempted to investigate the impact of FDI, technology innovation, and energy use on the economic growth and environmental quality of BRICS. These arguments provide a base for our study’s model, as given below.
We have transformed all study variables into a log form for our convenience. Logarithmic transformation is a convenient means of transforming a highly skewed variable into a more normalized dataset. When modeling variables with non-linear relationships, the chances of producing errors may also be skewed negatively [79].
where and represent constant term and the error term, respectively; , , , , and stand for undermined coefficients.
3.1. Descriptive Statistics
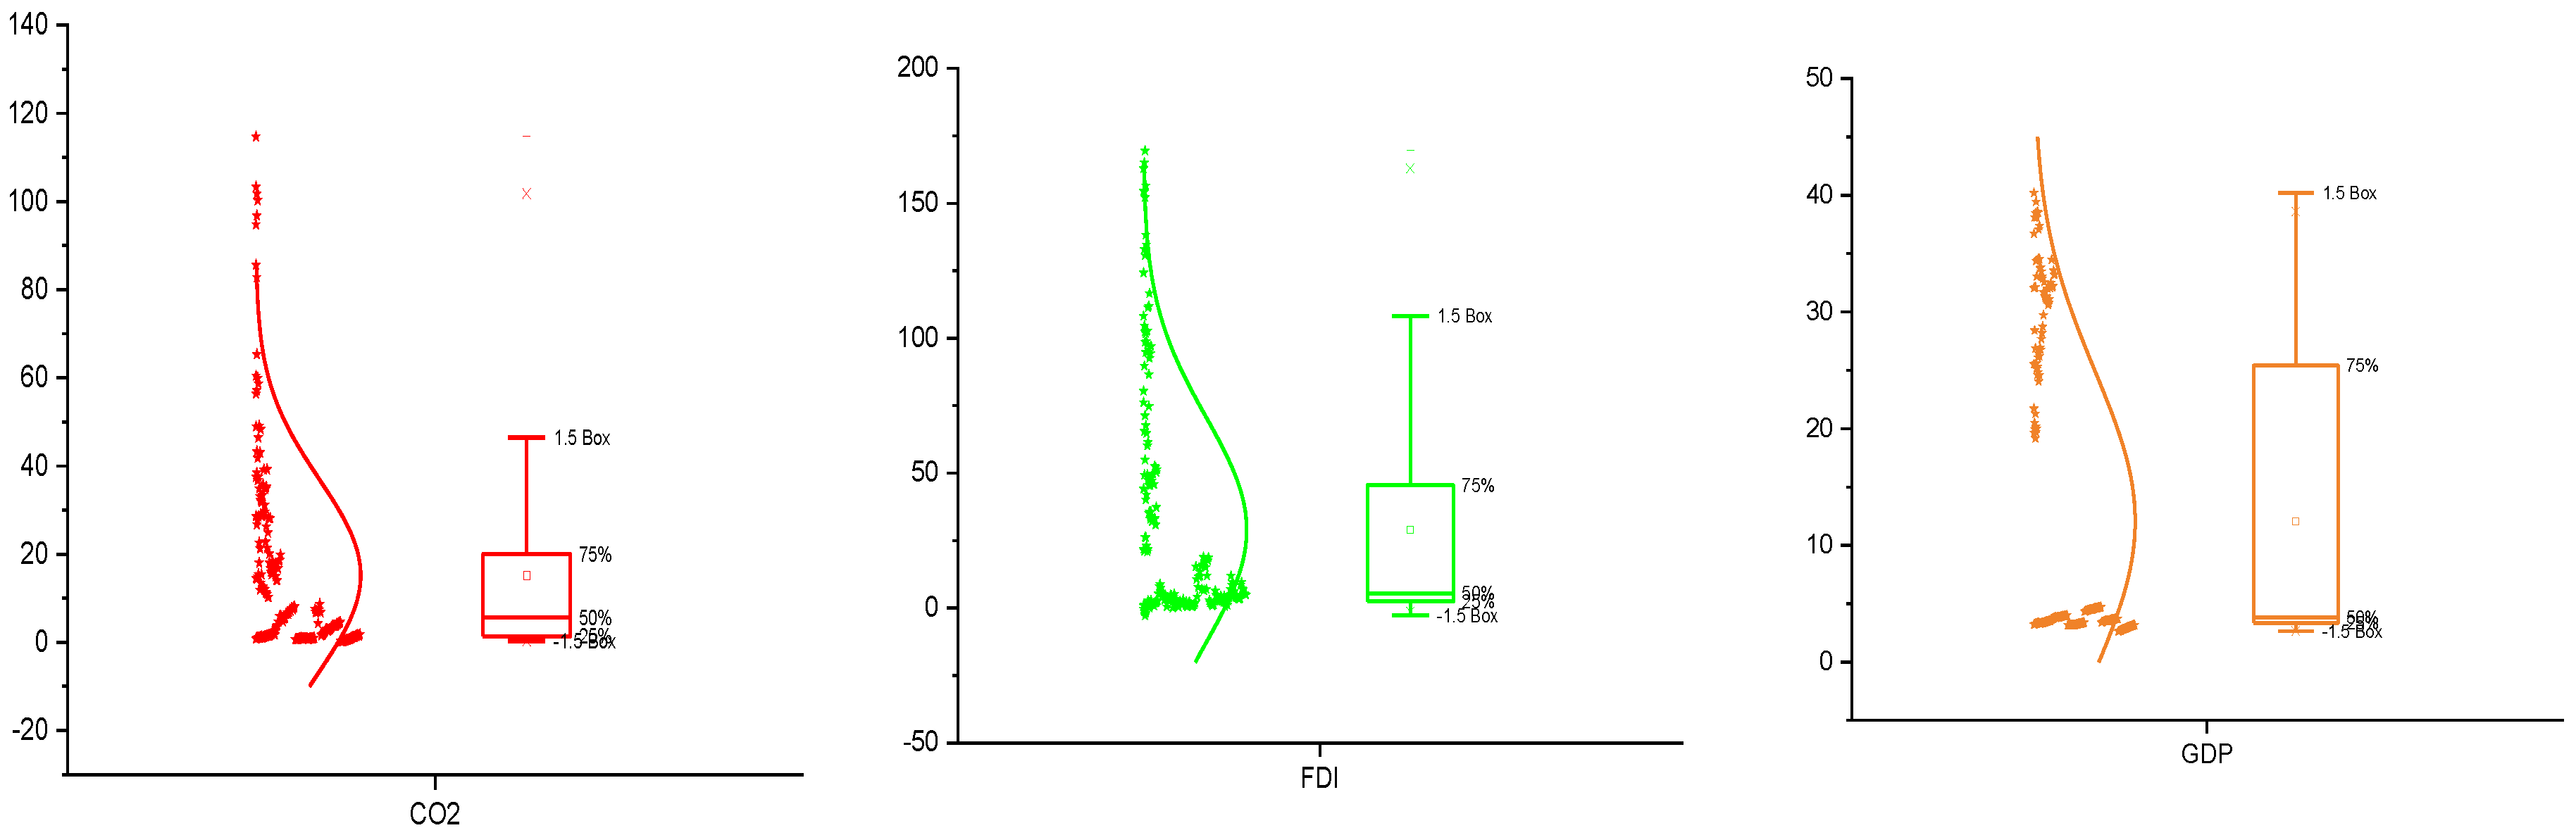
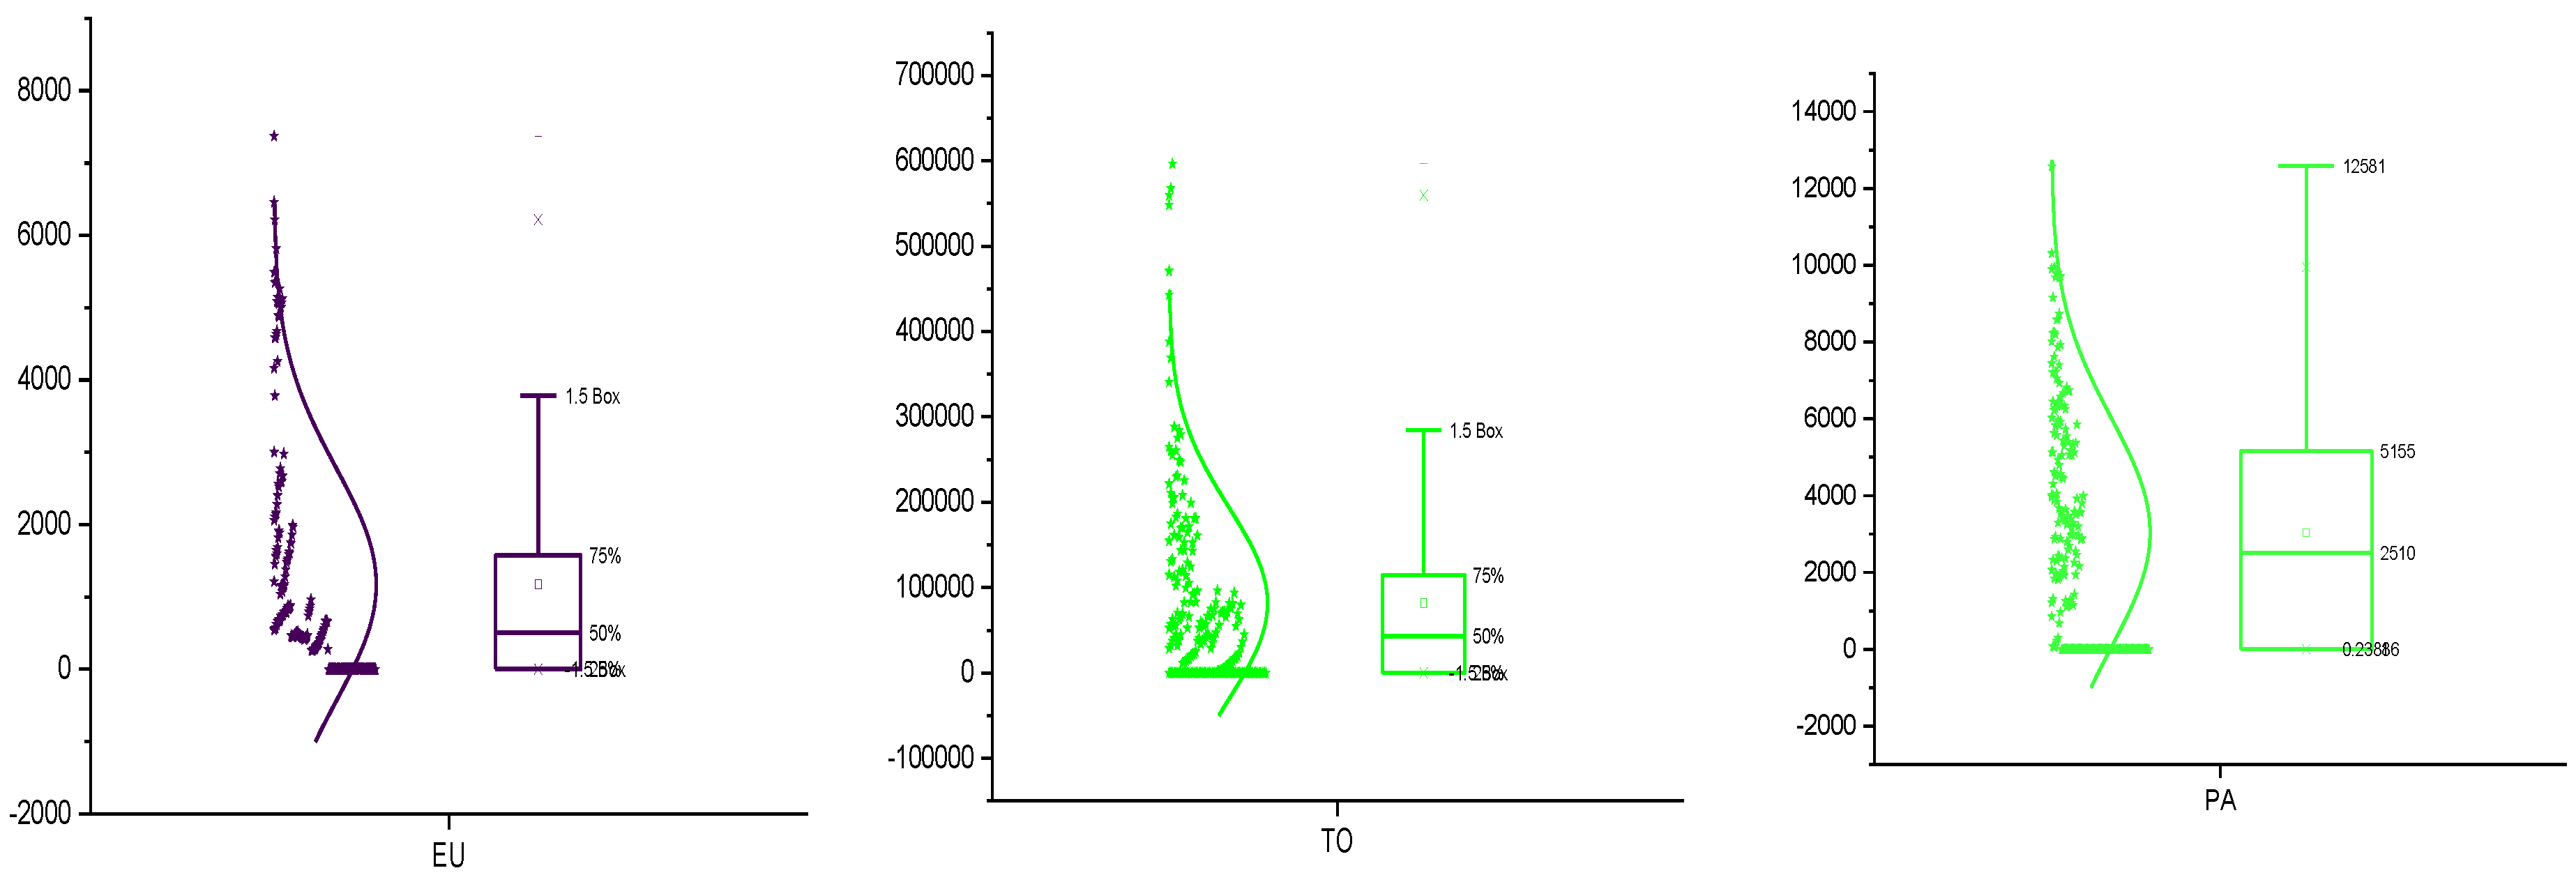
Our study used data collected from five entire BRICS member countries (Russia, China, India, Brazil, and South Africa), covering the period 1990–2018. We collected data from the databases of the World Bank and UNTCAD. Additionally, a description of variables is provided in Table 1, and the data description is provided in Table 2. We have chosen the study period according to the availability of data. The leading economy regarding FDI inflow as a percentage of FDI inflow is 6.277883%. In comparison, the lowest country has 0.076621%, with an average value of 2.095888%, which shows a significant difference across the BRICS region. The trade openness varied between USD 2,462,903 (maximum) and USD 22,912.07 (minimum), with an average value of UDS 293,702.6. The most technologically advanced country among BRICS economies has a maximum value of 801,136 patent numbers. In comparison, the least developed country has 139 patent numbers, with an average of 37,647.39 patent numbers across BRICS countries. The wealthiest country among BRICS countries has 13.63583% per capita GDP. In contrast, the poorest country has −14.6139% per capita GDP. The maximum value of trade openness is USD 2,462,903, with a minimum value of USD 22,912.07. The average energy use and CO2 emission values are 2031.53 and 5.669826, respectively. The box chart of the variables is presented in Figure 2.

Table 1.
Variables, measurement units, and definitions.
Table 2.
Descriptive statistics.
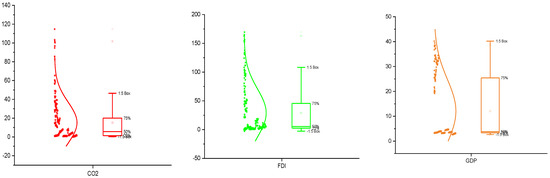
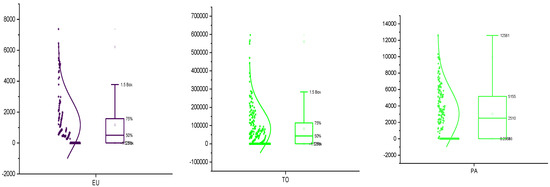
Figure 2.
Box chart. The average value is represented by the square, the median is indicated by the bar, while the dots show the minimum and maximum values. The lower and upper edges are indicated by the 25th and 75th percentage points.
3.2. Estimation Techniques
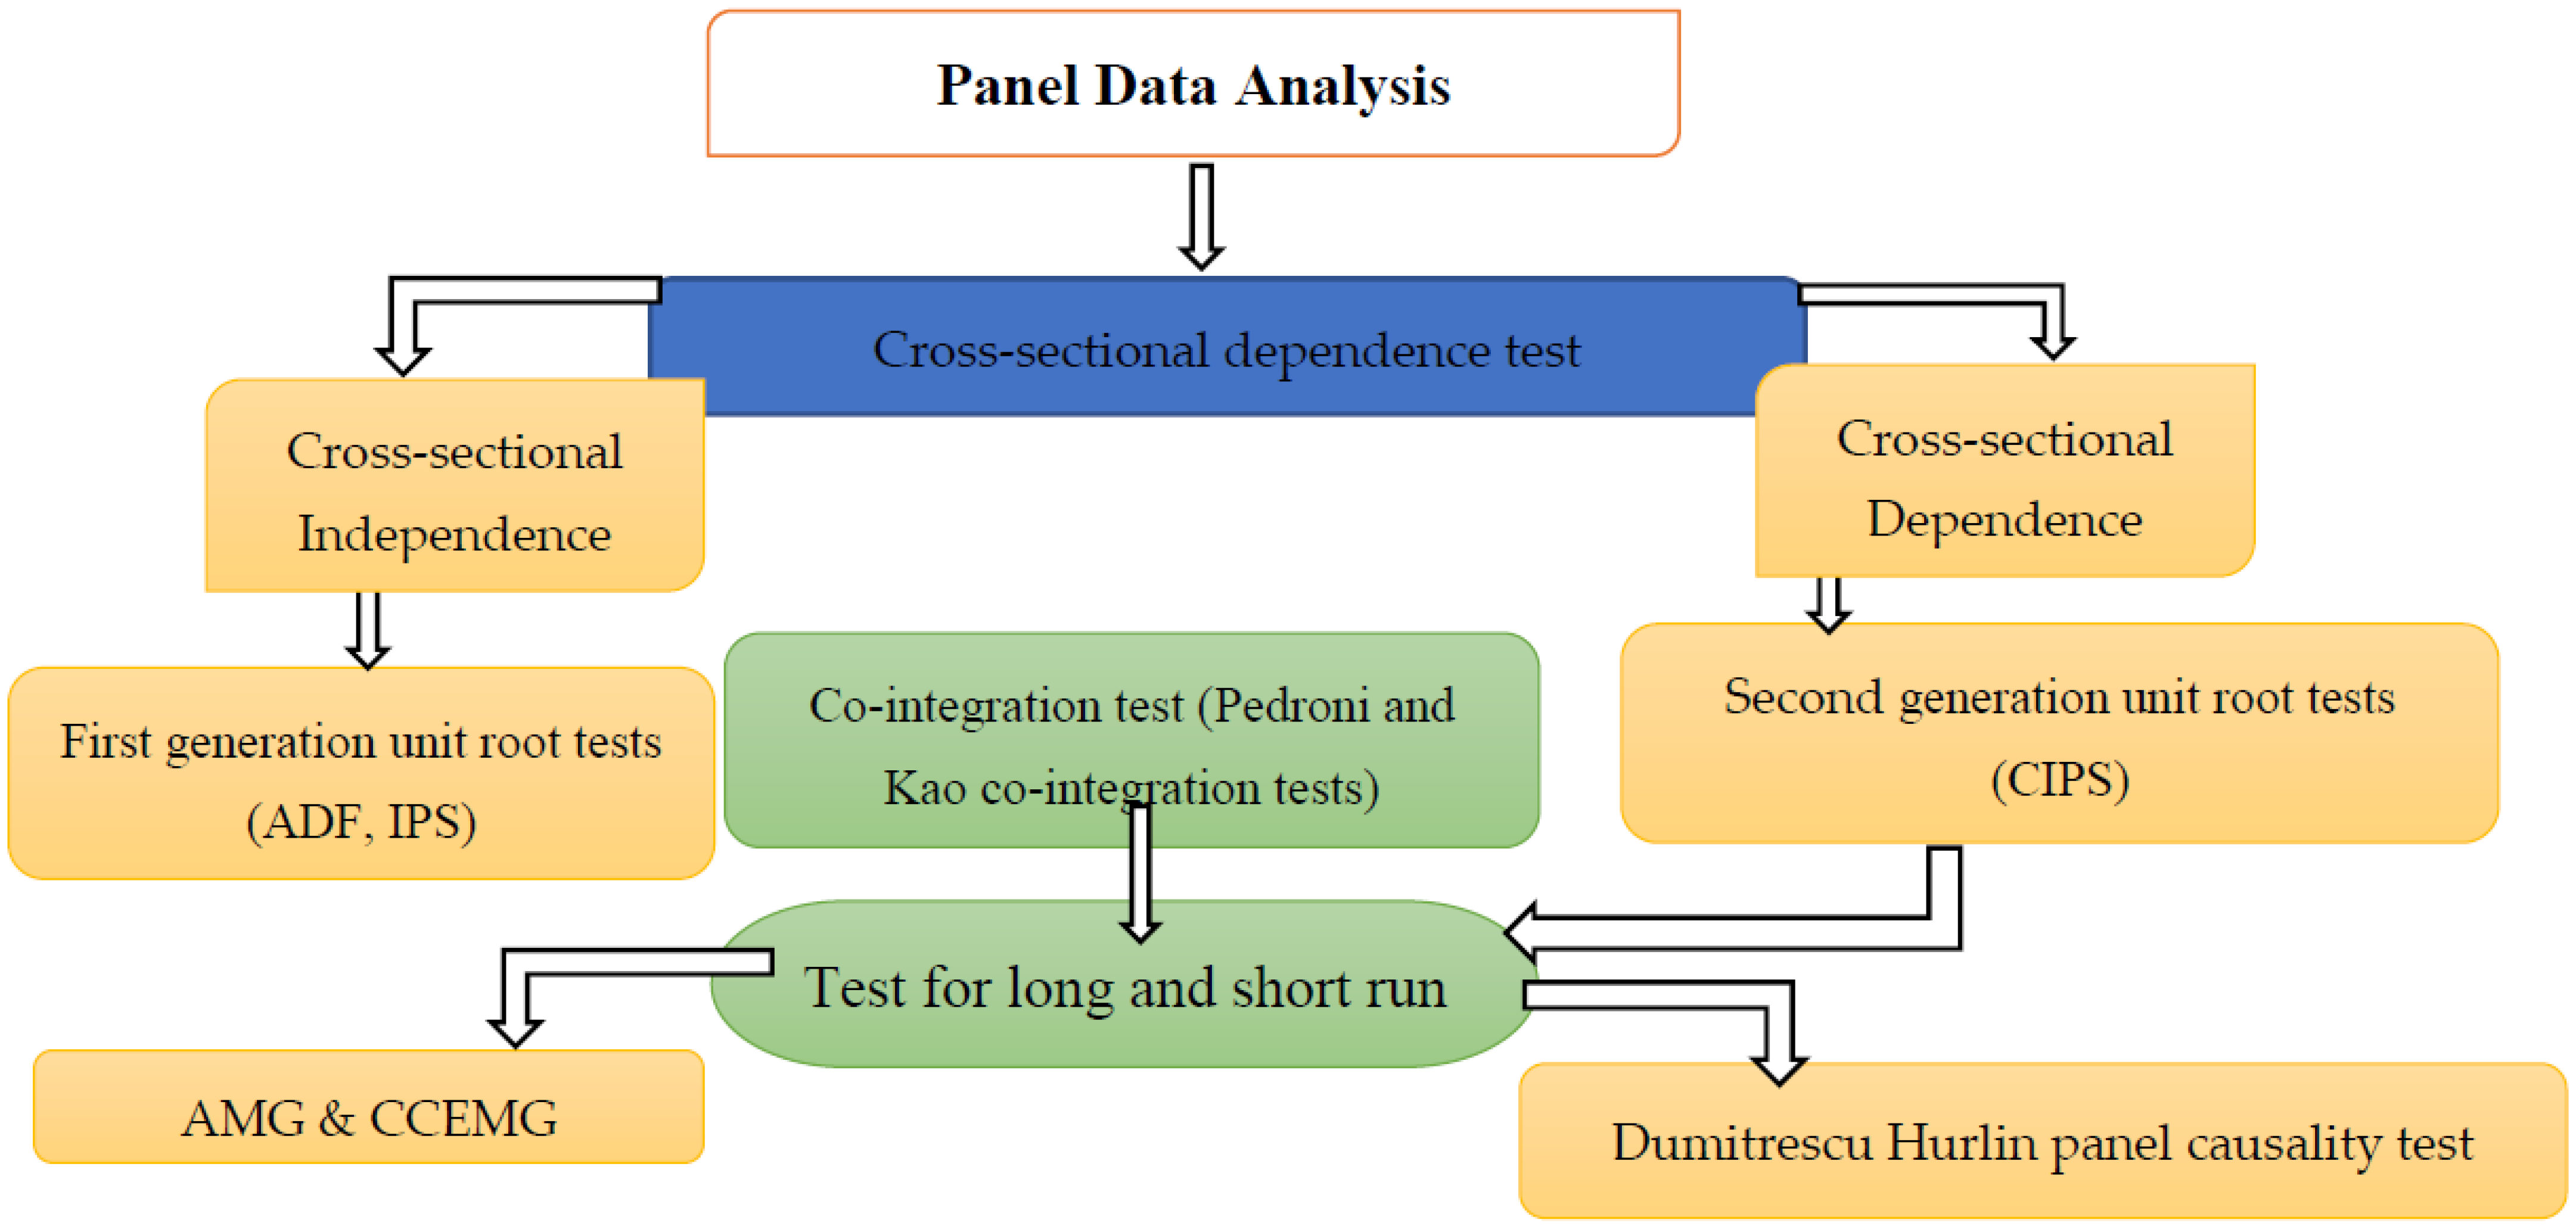
The study followed a systematic procedure for empirical investigation, as shown in Figure 3. The cross-sectional dependence test is essential in every empirical investigation. We have used several techniques to check cross-sectional dependence, such as Pesaran CD, Pesaran scaled LM, and Breusch-Pagan LM. The second step in the empirical analysis is the unit root test. We employed Pesaran CADF and Pesaran CIPS panel unit root tests. After the unit root test, the cointegration test is the next step in the empirical investigation. For this purpose, we used Pedroni-cointegration and Kao-cointegration tests. The AMG estimator has been employed for the long-run investigations in the next stage. Finally, to check our model’s robustness, we applied the CCEMG estimator. Moreover, we checked the causality direction with the help of the Dumitrescu and Hurlin panel causality test.
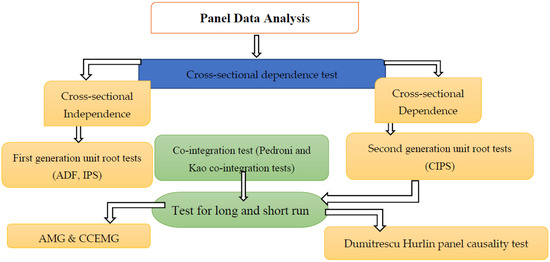
Figure 3.
The estimation scheme for investigating the impact of foreign direct investment, technological innovation, and energy use on economic growth and the environment.
3.2.1. Cross-Sectional Dependence
The cross-sectional dependence test is one of the essential prerequisites in empirical analysis employed to obtain error-free results [10,80]. To better understand this issue, we have used the Pesaran scaled and Pesaran cross-section dependence test [81] to confirm the cross-section dependence. Because Breusch–Pagan [82], with respect to cross-section dependence, is adequate in the presence of a large time dimension (T) and small cross-sections (N), Pesaran proposed a scaled version of the Lagrange multiplier test, which has the advantage of presenting efficient results in the presence of large N and small T. Due to limitations of Breusch–Pagan and Godfray Lagrange multiplier (B-G LM) test and the scaled version of the LM test in size distortions, Pesaran [83] proposed another reliable test with which to observe cross-sectional dependence, i.e., the Pesaran CD test. This test addresses the size distortion from previous tests, and it is feasible for a large N and a fixed T.
3.2.2. Panel Unit Root Test
In this study, the first-generation unit root tests seem invalid. The first-generation unit root tests (e.g., Phillip–Perron, Levin, Lin, and Chu) failed to detect the cross-sectional dependence of the panel. To approach this limitation, the Pesaran CIPS unit root test is used, introduced by Pesaran [81]. Pesaran improved the “Dickey–Fuller (ADF)” regressions with cross-sectional averages of lags of the dependent variable and the first difference of each unit of a cross-section. Moreover, the augmented regressions are called “Cross-Sectional ADF (CADF). We confirmed the cross-sectional dependence of the model; the next step of our empirical investigation was the unit root test. We employed “Pesaran augmented Dickey–Fuller (CADF)” and the “Pesaran cross-sectionally Aagmented Im Pesaran Shin (IPS)” tests, which are second-generation unit root tests [81].
3.2.3. Panel Cointegration Test
Another essential step in the empirical investigation is the cointegration test. We have used the Pedroni et al. [83] panel cointegration test and the Kao [84] panel cointegration test in this study. We have used cointegration tests of panel-specific and same-specific autoregressive test statistics.
3.2.4. Panel Long-Run Parameter Estimation
We employed an AMG estimator for long run estimations. It is a beneficial empirical method for heterogeneous panel data [60]. This method does not have the problem of cross-sectional dependence [10].
3.2.5. Panel Causality Test
In the empirical analysis, the panel causality test is also essential. For this purpose, we employed a Dumitrescu–Hurlin panel causality test to check the causality directions [85].
4. Results and Discussions
4.1. Outcomes of Cross-Sectional Dependence
Cross-sectional dependence is an essential step in an empirical investigation. We used several tests to examine the cross-sectional dependence among the variables across the BRICS panel, as shown in Table 3. According to the obtained results from all tests, the null hypothesis in the study of the BRICS panel is rejected at a 1% significance level, which implies strong cross-sectional dependence among the variables.
Table 3.
Estimation of cross-sectional dependence.
4.2. Outcomes of Panel Unit Root Test
We confirmed the stationarity level by employing the Pesaran (CIPS) unit root test. The Pesaran (CIPS) unit root test outcomes are presented in Table 4. The null hypothesis is rejected at the level of intercept and trends according to the obtained results. At first, stationarity was observed at a 1% level for intercept and intercept and trends. This shows the integration of the underlying variables at order I. Hence, the study variables are integrated at order I (1), which justifies the long-run relationship.
Table 4.
Pesaran CIPS panel unit root test.
4.3. Outcomes of Panel Cointegration Test
We utilized Pedroni [85] and Kao [82] to find the cointegration among the variables, as shown in Table 5 and Table 6. According to the Pedroni test, the study’s variables seemed significant in both the CO2 model and the growth model. It implies that there is cointegration among the variables. Furthermore, the Kao test outcomes also show cointegration among the underlying variables of our model. Hence, the results of the Pedroni and Kao tests justified an investigation of the long-run estimates for both models. Consequently, AMG and CCEMG estimators are used to determine the long-run relationship.
Table 5.
Panel cointegration results (CO2 model).
Table 6.
Panel cointegration results (growth model).
4.4. Outcomes of Panel AMG Estimator
In this study, we explored the impact of FDI, technology innovation, energy use, and trade openness on the economic growth and environmental quality of BRICS. The obtained results reveal that FDI, trade openness, GDP, and energy use significantly and positively impact CO2 emissions in BRICS countries, as presented in Table 7. More specifically, a unit rise in foreign direct investment results in an upsurge of 0.0591% emissions in the case of the BRICS region. Demena and Afesorgbor [86] and Hu et al. [2] also obtained similar results. Moreover, the study reveals 0.00644% emissions with every unit increase in GDP. Wang et al. [87] and Wen et al. [14] found similar results. The results have shown that a unit rise in trade openness will cause a 0.0823% increase in emissions. The findings also depict that a unit rise in energy use brings 1.8537% carbon emissions. Refs. [6,88] also obtained the same kind of results. Additionally, we found a significant inverse relationship of patent numbers with CO2 emissions. We found that a unit increase in patent number will reduce 0.947% CO2 environmental emissions in the BRICS region. Our results significantly matched the results of Kanto and Mazzanti [89]. On the other hand, technological innovations significantly and negatively affect CO2 emissions. The results indicate that a unit increase in patents decreased 0.0669% carbon emissions in the BRICS region.
Table 7.
Results of panel AMG and CCEMG estimators (CO2 Model).
Moving to the growth model, trade openness, technological innovations, and energy use have a significant and positive relationship with economic growth. More specifically, a unit increase in trade openness will raise 0.0712% economic growth in the BRICS countries. Similarly, the results depict that a unit rise in patents will increase 0.0147% of GDP in BRICS economies. Moreover, the results have shown that 0.1881% of GDP will be raised with a unit increase in energy use. FDI has non-significant results, indicating that the FDI infows to this region on average do not support economic growth.
4.5. Robustness Analysis
Robustness analysis is an essential step in every empirical study. Therefore, this study employed CCEMG estimators to check for the robustness of AMG estimators. The estimations of CCEMG reveal that our findings are relatively accurate in both models, as shown in Table 7 and Table 8. In the CO2 model, the findings show that FDI, trade openness, GDP, and energy use positively and significantly affect CO2 emissions in BRICS economies, as shown in Table 7, while the technological innovations significantly and inversely impacts environmental emissions. Moreover, the growth model shows that trade openness, patents, and energy use have a significantly positive relationship with economic growth. While FDI has non-significant results in both models.
Table 8.
Results of panel AMG and CCEMG estimators (growth model).
The Dumitrescu–Hurlin causality test has been used to check the causality directions between the variables. We have found bidirectional causalities between CO2 emissions and patent numbers, trade openness and CO2 emissions, and energy use and CO2 emissions. We have detected a one-way causality from CO2 emissions to GDP.
Based on the above test’s results, the present study revealed that FDI and energy use are directly linked to environmental sustainability in the BRICS region, as shown in Table 9. Increasing FDI and energy use increase CO2 emissions, which is harmful to environmental sustainability. These results support the pollution haven hypothesis, indicating that FDI results in environmental degradation in emerging economies due to their vulnerable ecosystems. Developing economies attract foreign investment in industrialization, affecting environmental sustainability [29,30,31].
Table 9.
Results of the Dumitrescu–Hurlin panel causality test.
Moreover, these results contradict the pollution halo hypothesis, which revealed that foreign firms used energy-efficient strategies and clean technologies to enhance environmental sustainability [86,90,91].
This study further revealed that technological innovation has an inverse relationship with CO2 emissions, resulting in improving the environmental quality in the BRICS region. These findings are consistent with the studies in the literature such as Islam et al. [91], Jordaan et al. [33], and ref. [6], which highlighted that technological innovation in the field of clean and green technology improves environmental quality by reducing CO2 emissions. This emphasis highlights the significance of developing and implementing innovative technologies that promote environmental sustainability and reduce the negative impact on the environment.
This research uncovered that the amount of energy utilized directly correlates with CO2 emissions. The findings confirm that energy consumption is one of the major contributors to environmental degradation in the BRICS economies. Islam et al. [91] in his study pointed out that the reliance on fossil fuels such as coal, natural gas, and oil for energy generation negatively impacts environmental sustainability. The use of natural gas, diesel, coal, heavy oil, and other non-renewable sources for electricity production exacerbates the issue. These results are consistent with the studies in the literature [44,92,93].
5. Conclusions and Policy Implications
In this study, we explored the effects of FDI, technology innovation, and energy use on the economic growth and environmental quality of BRICS economies for the period 1990–2018. The study followed a systematic procedure for empirical investigation. We have used several techniques to check cross-sectional dependence, such as Pesaran CD, Pesaran scaled LM, and Breusch–Pagan LM. The results of the study show that there is a strong cross-sectional dependence among the variables. The study employed Pesaran CADF and Pesaran CIPS panel unit root tests. The findings of the study clearly depict that the variables are integrated at the order I (1), which justifies the long-run relationship. To determine cointegration, the study used Pedroni-cointegration and Kao-cointegration tests. According to the Pedroni test, the study’s variables seemed significant. This implies that there is cointegration among the variables. Furthermore, the Kao test outcomes also show cointegration among the underlying variables of our both models; hence, the results of the Pedroni and Kao tests justified an investigation of the long-run estimates. The AMG estimator has been employed for the long-run investigations. In the CO2 model, the results of the AMG estimator reveal that FDI, trade openness, GDP, and energy use increase CO2 emissions in BRICS countries, while technological innovations decrease carbon emissions. In the growth model, FDI, trade openness, technological innovations, and energy use boost economic growth in the BRICS region. For the robustness analysis, we also used the CCEMG model in our study. The findings of the CCEMG model also confirmed the results. Moreover, we used the Dumitrescu–Hurlin panel causality test. We found bidirectional causalities between CO2 emissions and technology innovation, trade openness and CO2 emissions, and energy use and CO2 emissions. The finding also found a one-way causality from CO2 emissions to GDP.
The study recommends some suggestions for policymakers based on the findings. We found that FDI, trade openness, and energy use boost economic growth but enhance environmental emissions in the BRICS region. Policymakers should adopt environmentally sustainable economic policies to decrease these emissions. Governments should attract environmentally friendly technologies and encourage investment in renewable energy projects. As technology innovation reduces CO2 emissions, so governments should invest more in research and development to enhance environmental quality in the region.
5.1. Theoretical Contribution
The study provides a valuable theoretical contribution by integrating several important economic variables and examining their impact on environmental quality in the BRICS economies. The study advances our understanding of the relationships between foreign direct investment, technological innovation, energy use, and their effect on economic growth and environment. Additionally, the study also contributes to the literature by exploring the bidirectional causality between CO2 emissions and various economic variables and their impact on the environment. The results of the study highlight the importance of considering the interplay between economic development and environmental sustainability when formulating economic policies. The findings of the study could inform future theoretical developments in this area and provide a basis for more comprehensive and integrated models of economic development and environmental sustainability.
5.2. Policy Implications
The study has several policy implications for policymakers in the BRICS economies. The findings suggest that to promote sustainable economic growth while preserving the environment. Policymakers should adopt policies that encourage the adoption of environmentally friendly technologies, invest in renewable energy sources, and reduce reliance on fossil fuels. Additionally, the study highlights the importance of investment in research and development to enhancing the region’s environmental sustainability. The study’s results also suggest that governments should encourage environmentally sustainable practices among businesses by providing incentives and support. Furthermore, the bidirectional causality analysis highlights the need for an integrated and holistic policy approach that considers the interplay between economic growth, technological innovation, and environmental sustainability. The study provides valuable insights for policymakers with respect to developing and implementing policies that promote sustainable economic development while preserving the environment in the BRICS economies.
5.3. Direction for Future Research
Based on the study’s conclusions, future research should explore the mechanisms and policies that can enhance the positive impact of technological innovation and reduce the negative impact of FDI and energy use on the environment in BRICS economies. This could include examining the role of government regulations, incentives for renewable energy sources, and adopting green technologies. Additionally, future research could expand the analysis to a more extended period or a larger sample of countries to strengthen the generalizability of the findings. Furthermore, a comparative study could be conducted with which to compare the environmental sustainability of BRICS economies with other countries and identify best practices that can be adopted. The study highlights the need for a holistic approach to economic growth and environmental sustainability, and further research in this area will contribute to a more sustainable future for all.
Author Contributions
Conceptualization, N.A., A.R. and M.N.S.; methodology, N.A., A.R. and M.N.S.; software, N.A., A.R. and M.N.S.; validation, N.A., A.R. and M.N.S., formal analysis, N.A., A.R. and M.N.S.; investigation, N.A., A.R. and M.N.S.; resources, N.A., A.R. and M.N.S.; data curation, N.A., A.R. and M.N.S.; writing—original draft preparation, N.A., A.R. and M.N.S.; writing—review and editing, N.A., A.R., S.A., S.A.K., A.H. and M.N.S.; visualization, N.A., A.R., S.A.K., A.H. and M.N.S.; supervision, A.R.; project administration, N.A.; funding acquisition, A.R. All authors have read and agreed to the published version of the manuscript.
Funding
This research received no external funding.
Institutional Review Board Statement
Not applicable.
Informed Consent Statement
Not applicable.
Data Availability Statement
Data will be made available upon request.
Acknowledgments
The authors are thankful to the anonymous reviewers.
Conflicts of Interest
The authors declare no conflict of interest.
References
- Rafique, M.Z.; Li, Y.; Larik, A.R.; Monaheng, M.P. The Effects of FDI, Technological Innovation, and Financial Development on CO2 Emissions: Evidence from the BRICS Countries. Environ. Sci. Pollut. Res. 2020, 27, 23899–23913. [Google Scholar] [CrossRef]
- Hu, X.; Ali, N.; Malik, M.; Hussain, J.; Fengyi, J.; Nilofar, M. Impact of Economic Openness and Innovations on the Environment: A New Look into ASEAN Countries. Pol. J. Environ. Stud. 2021, 30, 3601–3613. [Google Scholar] [CrossRef]
- Sun, H.; Clottey, S.A.; Geng, Y.; Fang, K. Trade Openness and Carbon Emissions: Evidence from Belt and Road Countries. Sustainability 2019, 11, 2682. [Google Scholar] [CrossRef]
- Khachoo, Q.; Sharma, R. FDI and Innovation: An Investigation into Intra- and Inter-Industry Effects. Glob. Econ. Rev. 2016, 45, 311–330. [Google Scholar] [CrossRef]
- Saqib, N. Asymmetric Linkages between Renewable Energy, Technological Innovation, and Carbon-Dioxide Emission in Developed Economies: Non-Linear ARDL Analysis. Environ. Sci. Pollut. Res. 2022, 29, 60744–60758. [Google Scholar] [CrossRef] [PubMed]
- Khan, A.; Chenggang, Y.; Hussain, J.; Bano, S. Does Energy Consumption, Financial Development, and Investment Contribute to Ecological Footprints in BRI Regions? Environ. Sci. Pollut. Res. 2019, 26, 36952–36966. [Google Scholar] [CrossRef]
- Managi, S.; Hibiki, A.; Tsurumi, T. Does Trade Openness Improve Environmental Quality? J. Environ. Econ. Manag. 2009, 58, 346–363. [Google Scholar] [CrossRef]
- Wang, Q.; Su, M. A Preliminary Assessment of the Impact of COVID-19 on Environment—A Case Study of China. Sci. Total Environ. 2020, 728, 138915. [Google Scholar] [CrossRef]
- Wang, Q.; Zhang, F.; Li, R. Revisiting the Environmental Kuznets Curve Hypothesis in 208 Counties: The Roles of Trade Openness, Human Capital, Renewable Energy and Natural Resource Rent. Environ. Res. 2023, 216, 114637. [Google Scholar] [CrossRef]
- Hussain, J.; Khan, A.; Zhou, K. The Impact of Natural Resource Depletion on Energy Use and CO2 Emission in Belt & Road Initiative Countries: A Cross-Country Analysis. Energy 2020, 199, 117409. [Google Scholar] [CrossRef]
- Alibekova, G.; Medeni, T.; Panzabekova, A.; Mussayeva, D. Digital Transformation Enablers and Barriers in the Economy of Kazakhstan. J. Asian Financ. Econ. Bus. 2020, 7, 565–575. [Google Scholar] [CrossRef]
- Yang, Q.; Huo, J.; Saqib, N.; Mahmood, H. Modelling the Effect of Renewable Energy and Public-Private Partnership in Testing EKC Hypothesis: Evidence from Methods Moment of Quantile Regression. Renew. Energy 2022, 192, 485–494. [Google Scholar] [CrossRef]
- Ozturk, I.; Acaravci, A. The Long-Run and Causal Analysis of Energy, Growth, Openness and Financial Development on Carbon Emissions in Turkey. Energy Econ. 2013, 36, 262–267. [Google Scholar] [CrossRef]
- Wen, J.; Ali, W.; Hussain, J.; Khan, N.A.; Hussain, H.; Ali, N.; Akhtar, R. Dynamics between Green Innovation and Environmental Quality: New Insights into South Asian Economies. Econ. Politica 2021, 39, 543–565. [Google Scholar] [CrossRef]
- Ali, N.; Phoungthong, K.; Techato, K.; Ali, W.; Abbas, S.; Dhanraj, J.A.; Khan, A. FDI, Green Innovation and Environmental Quality Nexus: New Insights from BRICS Economies. Sustainability 2022, 14, 2181. [Google Scholar] [CrossRef]
- Wang, Q.; Zhang, F. What Does the China’s Economic Recovery after COVID-19 Pandemic Mean for the Economic Growth and Energy Consumption of Other Countries? J. Clean. Prod. 2021, 295, 126265. [Google Scholar] [CrossRef]
- Ali, N.; Phoungthong, K.; Khan, A.; Abbas, S.; Dilanchiev, A.; Tariq, S.; Sadiq, M.N. Does FDI Foster Technological Innovations? Empirical Evidence from BRICS Economies. PLoS ONE 2023, 18, e0282498. [Google Scholar] [CrossRef]
- Jebli, M.B.; Youssef, S.B.; Ozturk, I. Testing Environmental Kuznets Curve Hypothesis: The Role of Renewable and Non-Renewable Energy Consumption and Trade in OECD Countries. Ecol. Indic. 2016, 60, 824–831. [Google Scholar] [CrossRef]
- Bouyghrissi, S.; Murshed, M.; Jindal, A.; Berjaoui, A.; Mahmood, H.; Khanniba, M. The Importance of Facilitating Renewable Energy Transition for Abating CO2 Emissions in Morocco. Environ. Sci. Pollut. Res. 2021, 29, 20752–20767. [Google Scholar] [CrossRef]
- Zhu, H.; Xia, H.; Guo, Y.; Peng, C. The Heterogeneous Effects of Urbanization and Income Inequality on CO2 Emissions in BRICS Economies: Evidence from Panel Quantile Regression. Environ. Sci. Pollut. Res. 2018, 25, 17176–17193. [Google Scholar] [CrossRef]
- liobikienė, G.; Butkus, M. Environmental Kuznets Curve of Greenhouse Gas Emissions Including Technological Progress and Substitution Effects. Energy 2017, 135, 237–248. [Google Scholar] [CrossRef]
- Kihombo, S.; Vaseer, A.I.; Ahmed, Z.; Chen, S.; Kirikkaleli, D.; Adebayo, T.S. Is There a Tradeoff between Financial Globalization, Economic Growth, and Environmental Sustainability? An Advanced Panel Analysis. Environ. Sci. Pollut. Res. 2022, 29, 3983–3993. [Google Scholar] [CrossRef] [PubMed]
- Ma, Q.; Murshed, M.; Khan, Z. The Nexuses between Energy Investments, Technological Innovations, Emission Taxes, and Carbon Emissions in China. Energy Policy 2021, 155, 112345. [Google Scholar] [CrossRef]
- Hanif, I. Impact of Economic Growth, Nonrenewable and Renewable Energy Consumption, and Urbanization on Carbon Emissions in Sub-Saharan Africa. Environ. Sci. Pollut. Res. 2018, 25, 15057–15067. [Google Scholar] [CrossRef]
- Tang, C.F.; Tan, B.W. The Impact of Energy Consumption, Income and Foreign Direct Investment on Carbon Dioxide Emissions in Vietnam. Energy 2015, 79, 447–454. [Google Scholar] [CrossRef]
- Zhao, Z.; Zhang, K.H. FDI and Industrial Productivity in China: Evidence from Panel Data in 2001-06. Rev. Dev. Econ. 2010, 14, 656–665. [Google Scholar] [CrossRef]
- Zhang, Y.J.; Wang, W. Do Renewable Energy Consumption and Service Industry Development Contribute to CO2 Emissions Reduction in BRICS Countries? Environ. Sci. Pollut. Res. 2019, 26, 31632–31643. [Google Scholar] [CrossRef]
- Souza, J. Towards A Long-Term Strategy for BRICS; IPEA: Brasília, Brazil, 2015. [Google Scholar]
- Udemba, E.N.; Magazzino, C.; Bekun, F.V. Modeling the Nexus between Pollutant Emission, Energy Consumption, Foreign Direct Investment, and Economic Growth: New Insights from China. Environ. Sci. Pollut. Res. 2020, 27, 17831–17842. [Google Scholar] [CrossRef]
- Ssali, M.W.; Du, J.; Mensah, I.A.; Hongo, D.O. Investigating the Nexus among Environmental Pollution, Economic Growth, Energy Use, and Foreign Direct Investment in 6 Selected Sub-Saharan African Countries. Environ. Sci. Pollut. Res. 2019, 26, 11245–11260. [Google Scholar] [CrossRef]
- Sohag, K.; Al Mamun, M.; Uddin, G.S.; Ahmed, A.M. Sectoral Output, Energy Use, and CO2 Emission in Middle-Income Countries. Environ. Sci. Pollut. Res. 2017, 24, 9754–9764. [Google Scholar] [CrossRef]
- Yang, M.; Hou, Y.; Ji, Q.; Zhang, D. Assessment and Optimization of Provincial CO2 Emission Reduction Scheme in China: An Improved ZSG-DEA Approach. Energy Econ. 2020, 91, 104931. [Google Scholar] [CrossRef]
- Liu, S.; Zhang, P. Foreign Direct Investment and Air Pollution in China: Evidence from the Global Financial Crisis. Dev. Econ. 2022, 60, 30–61. [Google Scholar] [CrossRef]
- Shahbaz, M.; Sbia, R.; Hamdi, H.; Ozturk, I. Economic Growth, Electricity Consumption, Urbanization and Environmental Degradation Relationship in United Arab Emirates. Ecol. Indic. 2014, 45, 622–631. [Google Scholar] [CrossRef]
- Bhattacharya, M.; Paramati, S.R.; Ozturk, I.; Bhattacharya, S. The Effect of Renewable Energy Consumption on Economic Growth: Evidence from Top 38 Countries. Appl. Energy 2016, 162, 733–741. [Google Scholar] [CrossRef]
- Omri, A.; Nguyen, D.K.; Rault, C. Causal Interactions between CO2 Emissions, FDI, and Economic Growth: Evidence from Dynamic Simultaneous-Equation Models. Econ. Model. 2014, 42, 382–389. [Google Scholar] [CrossRef]
- Wheeler, D. Racing to the Bottom? Foreign Investment and Air Pollution in Developing Countries. J. Environ. Dev. 2001, 10, 225–245. [Google Scholar] [CrossRef]
- Demena, B.A.; van Bergeijk, P.A.G. Observing FDI Spillover Transmission Channels: Evidence from Firms in Uganda. Third World Q. 2019, 40, 1708–1729. [Google Scholar] [CrossRef]
- Ju, S.; Andriamahery, A.; Qamruzzaman, M.; Kor, S. Effects of Financial Development, FDI and Good Governance on Environmental Degradation in the Arab Nation: Dose Technological Innovation Matters? Front. Environ. Sci. 2023, 11, 1094976. [Google Scholar] [CrossRef]
- Pao, H.T.; Tsai, C.M. Multivariate Granger Causality between CO2 Emissions, Energy Consumption, FDI (Foreign Direct Investment) and GDP (Gross Domestic Product): Evidence from a Panel of BRIC (Brazil, Russian Federation, India, and China) Countries. Energy 2011, 36, 685–693. [Google Scholar] [CrossRef]
- Merican, Y.; Yusop, Z.; Mohd Noor, Z.; Siong Hook, L. Foreign Direct Investment and the Pollution in Five ASEAN Nations. Int. J. Econ. Manag. 2007, 1, 245–261. [Google Scholar]
- Chandran, V.G.R.; Tang, C.F. The Impacts of Transport Energy Consumption, Foreign Direct Investment and Income on CO2 Emissions in ASEAN-5 Economies. Renew. Sustain. Energy Rev. 2013, 24, 445–453. [Google Scholar] [CrossRef]
- Alshubiri, F.; Jamil, S.A.; Elheddad, M. The Impact of ICT on Financial Development: Empirical Evidence from the Gulf Cooperation Council Countries. Int. J. Eng. Bus. Manag. 2019, 11, 1847979019870670. [Google Scholar] [CrossRef]
- Islam, M.M.; Khan, M.K.; Tareque, M.; Jehan, N.; Dagar, V. Impact of Globalization, Foreign Direct Investment, and Energy Consumption on CO2 Emissions in Bangladesh: Does Institutional Quality Matter? Environ. Sci. Pollut. Res. 2021, 28, 48851–48871. [Google Scholar] [CrossRef] [PubMed]
- Zhuang, Y.; Yang, S.; Razzaq, A.; Khan, Z. Environmental Impact of Infrastructure-Led Chinese Outward FDI, Tourism Development and Technology Innovation: A Regional Country Analysis. J. Environ. Plan. Manag. 2023, 66, 367–399. [Google Scholar] [CrossRef]
- Liu, Y.; Wang, R. Research on the Environmental Effects of China’s Outward Foreign Direct Investment (OFDI): Empirical Evidence Based on the Implementation of the “Belt and Road” Initiative (BRI). Sustainability 2022, 14, 12868. [Google Scholar] [CrossRef]
- Azam, M.; Raza, A. Does Foreign Direct Investment Limit Trade-Adjusted Carbon Emissions: Fresh Evidence from Global Data. Environ. Sci. Pollut. Res. 2022, 29, 37827–37841. [Google Scholar] [CrossRef]
- Shakib, M.; Yumei, H.; Rauf, A.; Alam, M.; Murshed, M.; Mahmood, H. Revisiting the Energy-Economy-Environment Relationships for Attaining Environmental Sustainability: Evidence from Belt and Road Initiative Countries. Environ. Sci. Pollut. Res. 2021. [CrossRef]
- Khan, A.; Chenggang, Y.; Hussain, J.; Kui, Z. Impact of Technological Innovation, Financial Development and Foreign Direct Investment on Renewable Energy, Non-Renewable Energy and the Environment in Belt & Road Initiative Countries. Renew. Energy 2021, 171, 479–491. [Google Scholar] [CrossRef]
- Shahbaz, M.; Kumar, A.; Nasir, M. The Effects of Fi Nancial Development, Economic Growth, Coal Consumption and Trade Openness on CO2 Emissions in South Africa. Energy Policy 2013, 61, 1452–1459. [Google Scholar] [CrossRef]
- Jammazi, R.; Aloui, C. Wavelet Decomposition and Regime Shifts: Assessing the Effects of Crude Oil Shocks on Stock Market Returns. Energy Policy 2010, 38, 1415–1435. [Google Scholar] [CrossRef]
- Lean, H.H.; Smyth, R. CO2 Emissions, Electricity Consumption and Output in ASEAN. Appl. Energy 2010, 87, 1858–1864. [Google Scholar] [CrossRef]
- Kasman, A.; Duman, Y.S. CO2 Emissions, Economic Growth, Energy Consumption, Trade and Urbanization in New EU Member and Candidate Countries: A Panel Data Analysis. Econ. Model. 2015, 44, 97–103. [Google Scholar] [CrossRef]
- Lin, B.; Moubarak, M.; Ouyang, X. Carbon Dioxide Emissions and Growth of the Manufacturing Sector: Evidence for China. Energy 2014, 76, 830–837. [Google Scholar] [CrossRef]
- Sharif Hossain, M. Panel Estimation for CO2 Emissions, Energy Consumption, Economic Growth, Trade Openness and Urbanization of Newly Industrialized Countries. Energy Policy 2011, 39, 6991–6999. [Google Scholar] [CrossRef]
- Apergis, N.; Eleftheriou, S.; Payne, J.E. The Relationship between International Financial Reporting Standards, Carbon Emissions, and R&D Expenditures: Evidence from European Manufacturing Firms. Ecol. Econ. 2013, 88, 57–66. [Google Scholar] [CrossRef]
- Huang, S.-Z.; Chien, F.; Sadiq, M. A Gateway towards a Sustainable Environment in Emerging Countries: The Nexus between Green Energy and Human Capital. Econ. Res. Istraživanja 2022, 35, 4159–4176. [Google Scholar] [CrossRef]
- Afshan, S.; Ozturk, I.; Yaqoob, T. Facilitating Renewable Energy Transition, Ecological Innovations and Stringent Environmental Policies to Improve Ecological Sustainability: Evidence from MM-QR Method. Renew. Energy 2022, 196, 151–160. [Google Scholar] [CrossRef]
- Jiang, Y.; Khan, H. The Relationship between Renewable Energy Consumption, Technological Innovations, and Carbon Dioxide Emission: Evidence from Two-Step System GMM. Environ. Sci. Pollut. Res. 2023, 30, 4187–4202. [Google Scholar] [CrossRef] [PubMed]
- Destek, M.A.; Sarkodie, S.A. Investigation of Environmental Kuznets Curve for Ecological Footprint: The Role of Energy and Financial Development. Sci. Total Environ. 2019, 650, 2483–2489. [Google Scholar] [CrossRef]
- Murshed, M.; Rahman, M.A.; Alam, M.S.; Ahmad, P.; Dagar, V. The Nexus between Environmental Regulations, Economic Growth, and Environmental Sustainability: Linking Environmental Patents to Ecological Footprint Reduction in South Asia. Environ. Sci. Pollut. Res. 2021, 28, 49967–49988. [Google Scholar] [CrossRef]
- Wang, Z.; Yang, Z.; Zhang, Y.; Yin, J. Energy Technology Patents-CO2 Emissions Nexus: An Empirical Analysis from China. Energy Policy 2012, 42, 248–260. [Google Scholar] [CrossRef]
- Grossman, G.; Helpman, E. Trade Knowledge Spillovers and Growth. Eur. Econ. Rev. 1991, 35, 517–526. [Google Scholar] [CrossRef]
- Romer, P.M. Endogenous Technological Growth. Nber Work. Pap. Ser. 1990, Working Paper No. 3210. Available online: https://www.nber.org/system/files/working_papers/w3210/w3210.pdf (accessed on 17 September 2023).
- Sivalogathasan, V.; Wu, X. The Effect of Foreign Direct Investment on Innovation in South Asian Emerging Markets. Glob. Bus. Organ. Excell. 2014, 33, 63–76. [Google Scholar] [CrossRef]
- Wu, L.; Liu, S.; Liu, D.; Fang, Z.; Xu, H. Modelling and Forecasting CO2 Emissions in the BRICS (Brazil, Russia, India, China, and South Africa) Countries Using a Novel Multi-Variable Grey Model. Energy 2015, 79, 489–495. [Google Scholar] [CrossRef]
- Erdal, L.; Göçer, İ. The Effects of Foreign Direct Investment on R&D and Innovations: Panel Data Analysis for Developing Asian Countries. Procedia Soc. Behav. Sci. 2015, 195, 749–758. [Google Scholar] [CrossRef]
- Li, R.; Wang, Q.; Liu, Y.; Jiang, R. Per-Capita Carbon Emissions in 147 Countries: The Effect of Economic, Energy, Social, and Trade Structural Changes. Sustain. Prod. Consum. 2021, 27, 1149–1164. [Google Scholar] [CrossRef]
- Fei, Q.; Rasiah, R.; Shen, L.J. The Clean Energy-Growth Nexus with CO2 Emissions and Technological Innovation in Norway and New Zealand. Energy Environ. 2014, 25, 1323–1344. [Google Scholar] [CrossRef]
- Henriques, S.T.; Borowiecki, K.J. The Drivers of Long-Run CO2 Emissions in Europe, North America and Japan since 1800. Energy Policy 2017, 101, 537–549. [Google Scholar] [CrossRef]
- Ahmad, M.; Ahmed, Z.; Bai, Y.; Qiao, G.; Popp, J.; Oláh, J. Financial Inclusion, Technological Innovations, and Environmental Quality: Analyzing the Role of Green Openness. Front. Environ. Sci. 2022, 10, 851263. [Google Scholar] [CrossRef]
- Lin, B.; Ma, R. Towards Carbon Neutrality: The Role of Different Paths of Technological Progress in Mitigating China’s CO2 Emissions. Sci. Total Environ. 2022, 813, 152588. [Google Scholar] [CrossRef]
- Suki, N.M.; Suki, N.M.; Sharif, A.; Afshan, S.; Jermsittiparsert, K. The Role of Technology Innovation and Renewable Energy in Reducing Environmental Degradation in Malaysia: A Step towards Sustainable Environment. Renew. Energy 2022, 182, 245–253. [Google Scholar] [CrossRef]
- Li, C.; Sampene, A.K.; Agyeman, F.O.; Brenya, R.; Wiredu, J. The Role of Green Finance and Energy Innovation in Neutralizing Environmental Pollution: Empirical Evidence from the MINT Economies. J. Environ. Manag. 2022, 317, 115500. [Google Scholar] [CrossRef] [PubMed]
- Gao, P.; Wang, Y.; Zou, Y.; Su, X.; Che, X.; Yang, X. Green Technology Innovation and Carbon Emissions Nexus in China: Does Industrial Structure Upgrading Matter? Front. Psychol. 2022, 13, 951172. [Google Scholar] [CrossRef] [PubMed]
- Porter, M.E.; Linde, C. van der Toward a New Conception of the Environment-Competitiveness Relationship. J. Econ. Perspect. 1995, 9, 97–118. [Google Scholar] [CrossRef]
- Xie, P.; Jamaani, F. Does Green Innovation, Energy Productivity and Environmental Taxes Limit Carbon Emissions in Developed Economies: Implications for Sustainable Development. Struct. Chang. Econ. Dyn. 2022, 63, 66–78. [Google Scholar] [CrossRef]
- Ahmad, M.; Khattak, S.I.; Khan, A.; Rahman, Z.U. Innovation, Foreign Direct Investment (FDI), and the Energy–Pollution–Growth Nexus in OECD Region: A Simultaneous Equation Modeling Approach. Environ. Ecol. Stat. 2020, 27, 203–232. [Google Scholar] [CrossRef]
- Hammouri, H.M.; Sabo, R.T.; Alsaadawi, R.; Kheirallah, K.A. Handling Skewed Data: A Comparison of Two Popular Methods. Appl. Sci. 2020, 10, 6247. [Google Scholar] [CrossRef]
- Pesaran, M.H. General Diagnostic Tests for Cross Section Dependence in Panels. SSRN Electron. J. 2004, 69, 1240. [Google Scholar] [CrossRef]
- Breusch, T.S.; Pagan, A.R. The Lagrange Multiplier Test and Its Applications to Model Specification in Econometrics. Rev. Econ. Stud. 1980, 47, 239. [Google Scholar] [CrossRef]
- Pesaran, M.H. A Simple Panel Unit Root Test in the Presence of Cross-Section Dependence. J. Appl. Econom. 2007, 22, 265–312. [Google Scholar] [CrossRef]
- Pedroni, P. Panel Cointegration: Asymptotic and Finite Sample Properties of Pooled Time Series Tests with an Application to the PPP Hypothesis. Econom. Theory 2004, 20, 597–625. [Google Scholar] [CrossRef]
- Kao, C. Spurious Regression and Residual-Based Tests for Cointegration in Panel Data. J. Econom. 1999, 90, 1–44. [Google Scholar] [CrossRef]
- Dumitrescu, E.-I.; Hurlin, C. Testing for Granger Non-Causality in Heterogeneous Panels. Econ. Model. 2012, 29, 1450–1460. [Google Scholar] [CrossRef]
- Demena, B.A.; Afesorgbor, S.K. The Effect of FDI on Environmental Emissions: Evidence from a Meta-Analysis. Energy Policy 2019, 138, 111192. [Google Scholar] [CrossRef]
- Wang, Y.; Chen, L.; Kubota, J. The Relationship between Urbanization, Energy Use and Carbon Emissions: Evidence from a Panel of Association of Southeast Asian Nations (ASEAN) Countries. J. Clean. Prod. 2016, 112, 1368–1374. [Google Scholar] [CrossRef]
- Saqib, N. Nexus between the Renewable and Nonrenewable Energy Consumption and Carbon Footprints: Evidence from Asian Emerging Economies. Environ. Sci. Pollut. Res. 2022, 29, 58326–58340. [Google Scholar] [CrossRef]
- Kanto, S.; Mazzanti, M. Energy Intensity and Green Energy Innovation: Checking Heterogeneous Country Effects in the OECD. Struct. Chang. Econ. Dyn. 2020, 52, 328–343. [Google Scholar]
- Eskeland, G.S.; Harrison, A.E. Moving to Greener Pastures? Multinationals and the Pollution Haven Hypothesis. J. Dev. Econ. 2003, 70, 1–23. [Google Scholar] [CrossRef]
- Jordaan, S.M.; Romo-rabago, E.; Mcleary, R.; Reidy, L.; Nazari, J.; Herremans, I.M. The Role of Energy Technology Innovation in Reducing Greenhouse Gas Emissions: A Case Study of Canada. Renew. Sustain. Energy Rev. 2020, 78, 1397–1409. [Google Scholar] [CrossRef]
- Sasana, H.; Eka Putri, A. The Increase of Energy Consumption and Carbon Dioxide (CO2) Emission in Indonesia. E3S Web Conf. 2018, 31, 01008. [Google Scholar] [CrossRef]
- Maneejuk, P.; Yamaka, W. Revisiting the Environmental Kuznets Curve Hypothesis in OECD during 1970–2016: Panel Smooth Transition Regression. Energy Rep. 2022, 8, 41–47. [Google Scholar] [CrossRef]

Disclaimer/Publisher’s Note: The statements, opinions and data contained in all publications are solely those of the individual author(s) and contributor(s) and not of MDPI and/or the editor(s). MDPI and/or the editor(s) disclaim responsibility for any injury to people or property resulting from any ideas, methods, instructions or products referred to in the content. |
© 2023 by the authors. Licensee MDPI, Basel, Switzerland. This article is an open access article distributed under the terms and conditions of the Creative Commons Attribution (CC BY) license (https://creativecommons.org/licenses/by/4.0/).