Abstract
To make cities more sustainable and livable and to achieve climate targets in transportation, cities around the globe must undergo sustainable transformations. However, disparities in initial conditions pose challenges when trying to implement these sustainable changes. Identifying these differences aids in the comprehension of future developments. In this study, we establish an international comparison by decoding the mobility-related characteristics of cities and determining urban archetypes. Using publicly accessible data, we analyze and classify 96 cities in different countries. Therefore, we utilize principal component analysis to simplify the data. The emerging components serve as input for segmentation. This approach yields nine unique urban archetypes, ranging from Well-Functioning and Ancient Hybrid Cities in Europe to Paratransit and Traffic-Saturated Cities in the southern hemisphere. Our results show that there is a significant advantage to using a multidimensional segmentation basis, which we identify in an extensive literature review. The result is a finer segmentation, which is especially clear for European cities that demonstrate four different clusters. We discuss that the effect of future restrictions on private car usage will vary widely between the urban archetypes.
1. Introduction
The rapid growth of urban areas is leading to uncertainty around the future of motorized individual mobility worldwide. According to the United Nations, the proportion of the population living in cities in 2018 is predicted to double by the year 2050 [1], creating a growing demand for mobility currently not covered by the existing transport infrastructure. Faced with a range of challenges, cities are looking to transform urban mobility by reducing the negative externalities commonly attributed to excessive car usage. Objectives include a reduction in air pollution and greenhouse gas emissions, as well as the implementation of car-free city centers making urban areas more sustainable and livable. However, this sustainable transformation requires a range of specific measures that vary from city to city. Several cities have shown early indications of reconfiguring their built environment around non-motorized transport modes by implementing novel initiatives like the establishment of “superblocks” in Barcelona, the enlargement of the cycling network in Milan and London, or the deceleration of car traffic in Vienna [2].
Nevertheless, this transformation could face challenges to meeting the population’s mobility demands, especially when alternative travel options to private motorized modes are lacking. In order to gain a better understanding of the status quo of urban mobility, a comparison of cities and their different preconditions is necessary. The implementation of this requires a unified and consistent approach. While some studies exist, no comprehensive comparative database currently focuses specifically on motorized individual mobility and its role within urban areas.
This study aims to fill this gap by identifying urban archetypes that can help cities improve their existing infrastructure and develop sustainable mobility solutions. Each archetype refers to a type of city that summarizes the common mobility-related features of their underlying urban areas. We pose the following research questions:
What are crucial dimensions of urban mobility in order to identify urban archetypes of cities?
How do these urban archetypes differ in terms of the role of the car in urban spaces, and how may this change in the future?
To answer these research questions and to identify relevant dimensions as a basis for segmentation, we perform a comprehensive literature review of different approaches to the segmentation of cities. Based on these dimensions, our study compares 96 cities in various countries and continents and classifies them into similar urban archetypes using an explorative clustering method. Cities are described using a set of 26 indicators, with a strong focus on urban mobility.
The following sections describe the outcome and conclusions of our analyses. They are structured as follows: after a literature review and an outline of the database, we describe our methodology for identifying urban archetypes. An in-depth analysis of the cluster and the various formed urban archetypes follows. Based on the cluster solution, we take a closer look at the archetypes specifically located within the European region. This approach will deliver deeper insights regarding future car use and restrictions in Europe. Finally, we discuss our results and draw a conclusion.
2. Literature Review
Clustering is a common and scientifically valid approach when investigating differences and commonalities between cities. More than 80 years ago, Harris [3] was the first researcher to empirically differentiate 984 American cities based on national employment statistics. Using a rule-based cluster algorithm, cities were assigned to one or multiple of the following classes, defining their core industrial functions: Manufacturing, Transportation, Tourism, Wholesale, Retail, Education, Mining, or Diversified. This clustering method established itself as a standard procedure in subsequent studies [4,5].
Bruce and Witt [6] supplemented this analysis of socio-economic indicators with socio-demographic parameters, defining 13 economic city types. Similar analyses of urban prosperity are still relevant to this day [7,8,9]. Hill et al. [8], for example, implemented a segmentation of 508 cities to analyze the regional distribution of wealth across the US. Furthermore, Martin et al. [9] describe a segmentation of 300 cities to support state-level policy decisions. Cities within the same cluster are supposed to react as similarly as possible to fiscal interventions.
In addition to various economic classifications, other approaches provide information on the different geographical features to describe the spatial patterns, layouts, and structures that characterize a city [10,11,12,13]. Huang et al. [11] identified seven spatial metrics to describe said measures of urban shaping using satellite imagery from 77 cities. The four archetypes that emerged in the process indicate urban shapes that vary greatly depending on their region. Thompson [12] used data from 30 megacities to illustrate how different urban systems attempt to solve local traffic problems. The five archetypes, Full Motorization, Weak Centre, Strong Centre, Low Cost, and Traffic Limitation, define distinct forms of urban infrastructure.
A growing body of available data and methodological developments continues to provide new insights into various areas of urban research [14,15,16,17]. For example, Kenworthy and Laube [18] published the Millennium Cities Database for Sustainable Transport, the first international comparison of cities based on a wide range of indicators of urban mobility. The data collection from 1995 contains 230 standardized indicators from 100 cities.
In addition to analyzing the sustainability of various urban transport systems in Kenworthy [19], the Millennium Cities Database forms the data basis of various other studies [20,21]. Based on the database, Priester et al. [22] identified 13 relevant factors for the quantitative mapping of urban mobility in 41 megacities. These factors include their car dependency, traffic fatalities, traffic congestion, and public transit use. The study lists a total of seven city typologies: Paratransit Cities, Auto Cities, Non-Motorized Cities, Hybrid Cities, Traffic-Saturated Cities, Low-Motorized Cities, and Transit Cities.
Oke et al. [23] presented one of the most comprehensive urban segmentations in mobility research, subdividing 331 cities in 124 countries. Relevant indicators include urban shaping, economic performance, and urban mobility behaviors. The broad spectrum of the study is intended to support a large number of actors from politics and business in the development of new mobility solutions and an associated reduction in emissions. In total, the study presents 12 clusters.
A segmentation on a national level can be found in Klinger et al. [24]. The study used data from 44 German cities to cluster different “urban mobility cultures”. In addition to established dimensions such as the socio-demographic and economic characteristics, as well as the travel behavior of the population, the study additionally considered various psychographic indicators to represent the subjective dimensions of urban mobility. Subjective dimensions are described as those characteristics whose assessment depends exclusively on the individual perception of the surveyed population. The multidimensional consideration of objective and subjective indicators describes, in part, strong contradictions between using certain mobility offerings and their general association in the population. However, the lack of comparable psychographic data collection essentially prevents a comparison within international studies.
The role of urban sustainability and energy use is also the focus of several other classifications. Shell [25] used six city archetypes to forecast future urban energy demand. Acuto et al. [26] analyzed sustainability-promoting measures in terms of their sectoral and economic origins. Cantuarias-Villessuzanne et al. [27] identified three “smart city strategies” based on seven predefined “smart city dimensions” [28].
In addition to the areas of use illustrated so far, cluster analyses possess a high economic relevance. The procedure is often used to identify suitable target markets for new products and services [29,30,31]. For example, Lang et al. [30] used an analysis of the urban spatial structure and socio-economic parameters to identify suitable cities for the deployment of autonomous vehicle fleets.
In contrast to the beforementioned approaches, various other segmentations are implemented within individual cities. These usually form part of analyses of the intra-urban spatial structure [32,33] or the urban population [34,35]. As a rule, however, the objective of these cluster analyses is not a direct comparison of cities. For this reason, they will not be discussed further in the remainder of this study.
The abovementioned indicators within the described segmentation approaches can be summarized into five dimensions: 1. Socio-economic indicators provide information on a city’s economic development and its influence on social, political, ecological, and spatial processes. 2. Socio-demographic indicators enable a more precise description of the urban population, its social structure, and the regional level of development of a city. 3. Geographical input values describe the spatial layout of a city. The orientation of the transport network or divergent land use are established measures for segmentation. Urban mobility is of central importance in this work. 4. The dimension of Mobility describes the dependence on individual means of transport or congestion of the regional infrastructure. These form essential indicators in earlier clustering approaches. 5. Psychographic indicators map subjective motives within the urban population. This dimension is key to achieving a holistic view of urban areas.
Figure 1 gives a non-exhaustive overview of the different segmentation approaches, facilitating a better comprehension of the various indicator dimensions. Missing arrows to individual groups do not mean that such approaches do not exist. Often, a clear separation of approaches is only possible to a limited extent.
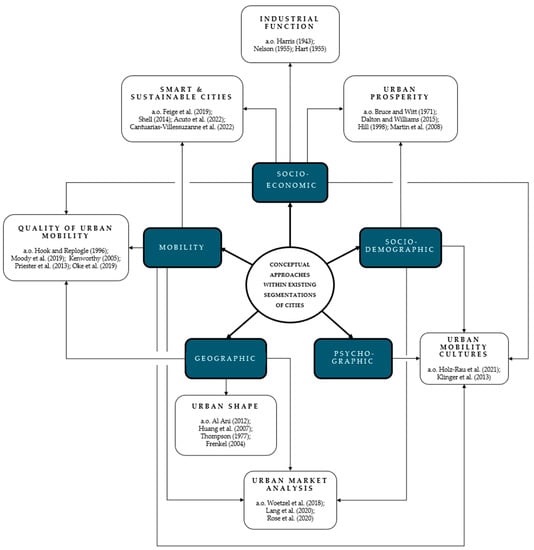
Figure 1.
Overview of the conceptual approach of existing urban segmentations [3,4,5,6,7,8,9,10,11,12,13,14,15,16,17,19,22,23,24,25,26,27,29,30,31].
Our review shows that there is currently no segmentation approach, to our knowledge, that covers all five dimensions within an international comparison of cities. However, in order to gain a better understanding of the different manifestations of urban mobility, a holistic approach is required. This includes the selection of a comprehensive database as well as the consideration of a diverse set of cities. The following section provides a detailed description of the applied methodology.
3. Data Collection
The selection of appropriate indicators is a crucial challenge in the clustering process, closely related to the choice of cities to be considered in the study. As we aimed to achieve a multidimensional segmentation framework, we faced two constraints on selecting indicators: (1) the selected indicators had to represent various areas of the urban environment and (2) the choice of cities had to enable an international comparison. Varying data sources can demand a weighing up of the inclusion of certain indicators against a subsequent reduction in the total number of comparable cities. The goal of achieving a diversified analysis is additionally met with the issues outlined in Murphy’s “curse of dimensionality” [36], which describes an increase in complexity associated with the inclusion of more factors. Hence, a too broad database can have negative implications for the interpretability of the solution. A preliminary step was taken to eliminate highly correlated values within an initial set of 57 indicators to counteract this issue. The resulting dataset used to segment the cities is summarized in Table 1, comprising 26 distinct indicators. The selected indicators encompass all five dimensions identified in the previous chapter, namely socio-economic, socio-demographic, psychographic, geographic, and mobility (see Table 1). Notably, all values, except psychographic indicators, pertain to the corresponding administrative levels of the examined cities. The data were normalized to a uniform scale through min–max scaling to enable comparability of all indicators. In total, a set of 96 cities was found to provide sufficient data and serve as our initial base for segmentation. Of these cities, 43 are located in Europe, 17 in North America, and 19 in the Asian/Pacific region. The remaining 17 cities are mainly situated within the southern hemisphere. A complete listing of all cities under consideration can be found in Table A1 in Appendix A.

Table 1.
Overview of the indicators used in the clustering process.
4. Methodology
In this section, we present our methodological approach to identifying urban archetypes. First, we applied a principal component analysis (PCA) to reduce the complexity of the 26 indicators that served as inputs for our segmentation. Second, we performed a clustering in order to segment cities.
4.1. Principal Component Analysis
The 26 indicators used as segmentation criteria were intended to address different aspects of a city. As a preliminary analysis of our segmentation, and to reduce the complexity, we used a PCA method based on the selected indicators. Before performing the PCA, we conducted Bartlett’s test of sphericity (<0.001), which indicates that the data are suitable for the PCA as that analysis proves that the correlation matrix, which underlies the analysis, is statistically significant [60]. Table 2 shows the results of the PCA. Based on the scree plot (elbow criterion) and Kaiser’s criterion, five factors were extracted: one describing the car dependence, one the prosperity, and one the traffic maturity. In addition, we identified a fourth factor regarding traffic saturation and a fifth regarding the quality of public transit.
Table 2.
Loadings of the selected indicators on the five principal components.
The indicators that have the strongest possible effect on the respective factors are used to describe each principal component. For this purpose, all indicators that show a loading >0.45 are considered [61]. The factor car dependence indicates the degree to which an urban transportation system requires the use of motorized individual mobility. The concept of traffic maturity elucidates the degree to which equitable access to secure and publicly available transportation alternatives is available to all individuals. Traffic saturation characterizes the congestion of the urban road network. Quality of public transit describes the availability of high-quality alternatives to cars through rail-bound offerings (e.g., metro). Prosperity gives an impression of a city’s economic and technological possibilities.
All five factors were found to have sufficient internal consistency (reliability), with a Cronbach’s alpha of 0.83 (car dependence), 0.88 (prosperity), 0.81 (traffic maturity), 0.63 (traffic saturation), and 0.72 (quality of public transit), respectively. The low value for Cronbach’s alpha of traffic saturation (0.63) only shows acceptable reliability [62]. While this is sufficient overall, it must be considered in further analyses.
4.2. Clustering
Segmentation approaches can be broadly classified into supervised (a priori) and unsupervised (post hoc) methodologies. The former is applicable when the segments are known or predefined and aims to categorize new observations into these segments. The latter finds its use when the objective is to identify homogeneous groups within multivariate data [60,63]. In transportation, k-means cluster analysis is one of the most used unsupervised cluster analysis methods [34,35,64,65,66]. It is also used in previous city segmentations [16,24,26]. Therefore, we used the method to identify city archetypes based on the five principal components. Using the cluster packages factoextra and bios2mds in the software R (v4.3.1), the silhouette score [67] and the elbow criterion [68] of the underlying data were determined. Both values implicate a good fit of a 9-cluster solution.
5. Results
The combination of five principal components and an unsupervised cluster analysis yielded nine distinct clusters out of 96 cities, each representing a unique urban archetype with discernible characteristics related to a specific group of cities within our database. A complete listing of all cities and their respective archetypes can be found in Table A1 in Appendix A.
In the following, these urban archetypes are analyzed by comparing their means for the cluster characteristics. Based on these specific attributes, we further describe and name each archetype.
5.1. Cluster Description
Table 3 presents the expressions of the five principal components and the mean values of all individual indicators for each identified cluster. CL 1 shows the lowest value in traffic saturation and the lowest time lost in traffic. Additionally, CL 1 and CL 2 exhibit a well-established traffic system with superior accessibility to public transit. CL 3 has a low car dependence with a low motorization rate and good access to public transit. In contrast, CL 4 has a strong car dependence and rather high motorization rates. Notably, CL 3 and CL 4 exhibit only negligible divergence in terms of traffic saturation. A high level of prosperity and excellent rail network infrastructure distinguishes CL 5. However, it also exhibits an elevated reliance on automobiles, implying a hybrid urban structure. CL 6 exhibits the least reliance on cars. Nonetheless, the level of traffic maturity remains significantly low. Moreover, this cluster exhibits the second-highest rate of traffic fatalities and the second-poorest accessibility to public transit. CL 7 boasts the third-highest traffic maturity level and excellent public transit access. However, a limited number of rail-bound mobility offerings indicates a high reliance on road-based public transit, mainly carried out by buses. CL 8 is characterized by the poorest accessibility to public transit and the lowest score for traffic maturity, coupled with the highest frequency of traffic fatalities. CL 9 displays the highest level of traffic saturation, with minimal dependence on cars. The travel time loss in this cluster can be attributed to various other modes of transport.
Table 3.
Characteristics of the nine clusters based on the five main principal components and averages of their respective cluster-forming indicators.
Based on the analysis of the cluster-forming indicators, we can summarize each cluster’s characteristic features (see Table 4). In addition, each cluster is given a concise name to simplify the understanding of clusters as urban archetypes.
Table 4.
Overview of the urban archetypes and their characteristics.
To facilitate a better comprehension, Figure 2 provides an overview of the manifestation of the five primary components in each urban archetype and highlights some pertinent cluster representatives. A detailed comparison of the individual cities based on their principal component values can be found in Figure A1, Figure A2, Figure A3 and Figure A4 in Appendix B.
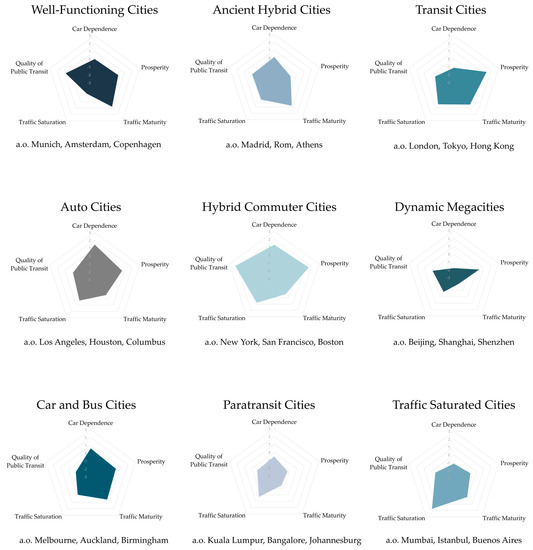
Figure 2.
Expressions of the five principal components in each urban archetype.
5.2. Geographical Location
The geographic distribution of the nine urban archetypes exhibits substantial heterogeneity within the locations of their associated cities. Figure 3 illustrates an accumulation of Well-Functioning and Ancient Hybrid Cities located in Europe, which also encompasses a diverse mix of Transit Cities as well as Car and Bus Cities. Auto Cities and Hybrid Commuter Cities are predominantly situated in North America, while all South American cities fall within the Traffic-Saturated categorization. Paratransit Cities predominantly exist in eastern regions, with a few individual representatives in Africa. The highest degree of regional concentration is observed in the exclusively Chinese Dynamic Megacities cluster. Most of the remaining cities are categorized as Transit Cities and Car and Bus Cities, with the latter primarily concentrated near coastal areas. Notably, this finding warrants further investigation.
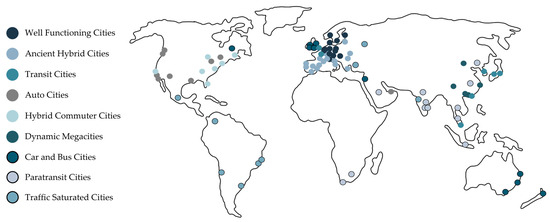
Figure 3.
Geographical location of the nine clusters.
5.3. Cluster Validation
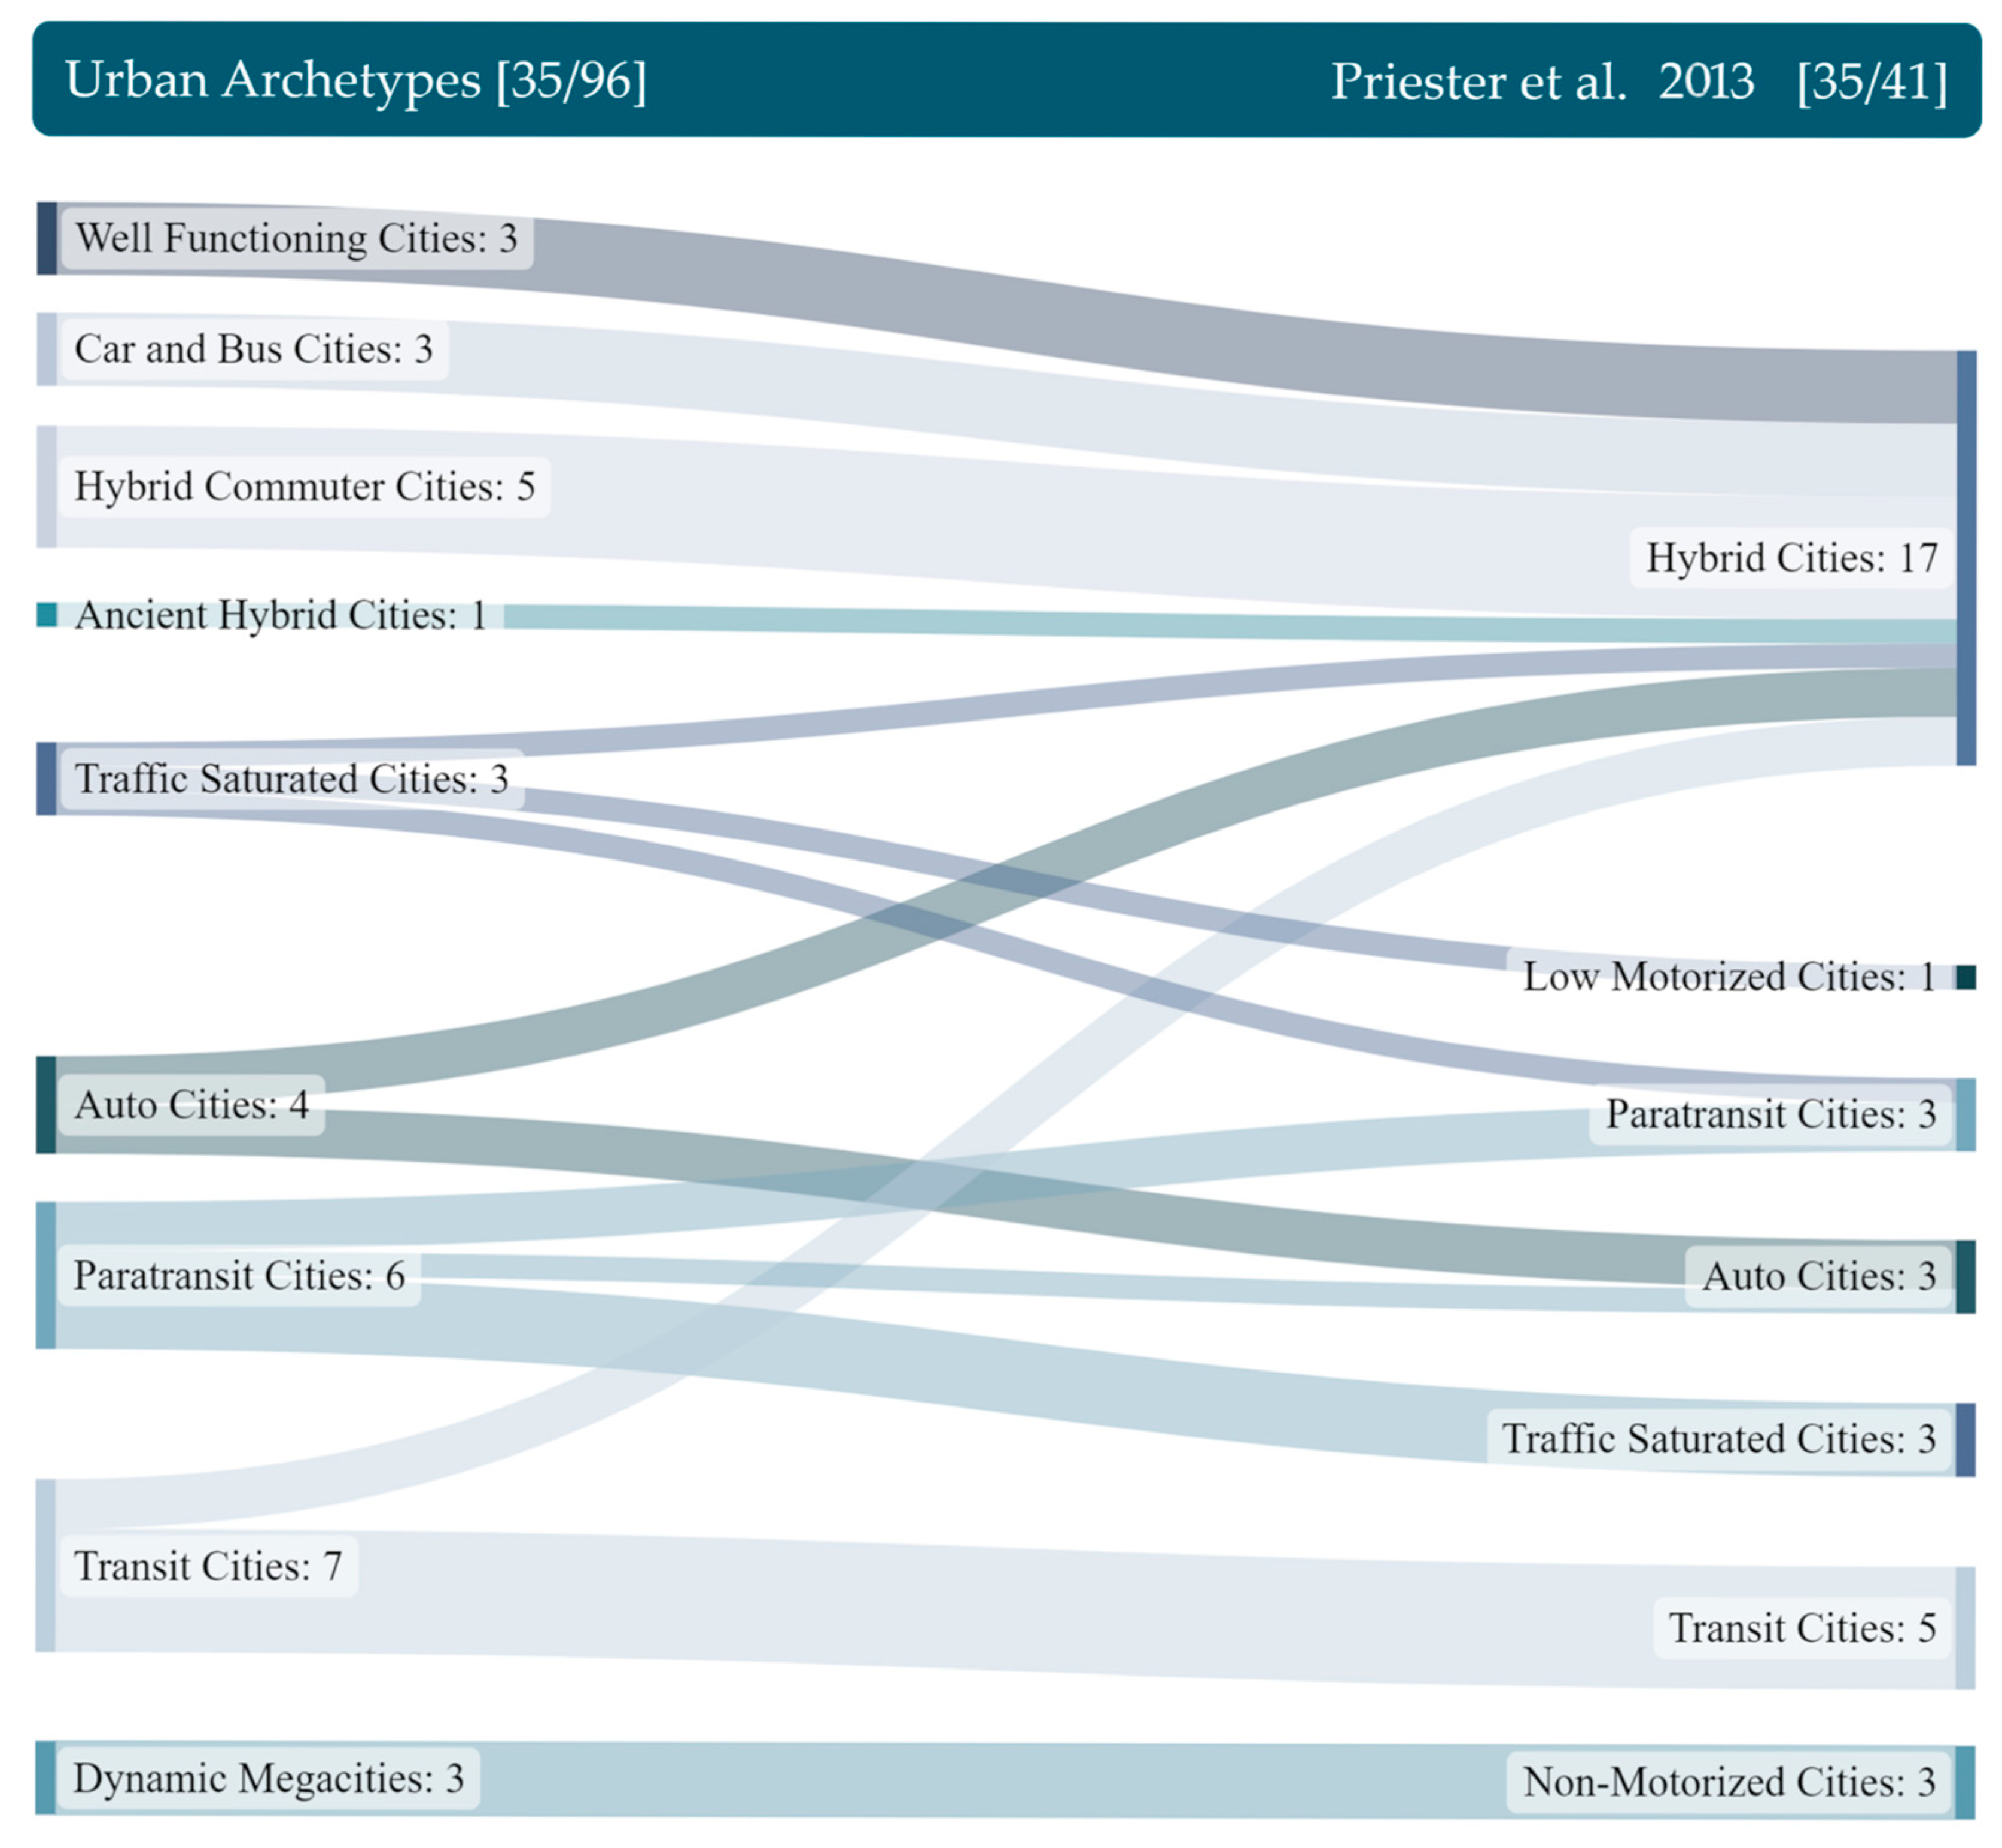
A content validation approach is implemented to ensure the cluster solution’s conformity with established city segmentations. This entails examining the intersections of the identified urban archetypes with the existing city segmentation proposed by Priester et al. [22]. The selected study is particularly suitable for a comparative analysis, as it shows considerable overlap in the selection of indicators and its main points of interest, emphasizing the role of motorized individual mobility in urban areas. An essential precondition for sampling is that the cities must be included in both the study by Priester et al. [22] and our study: this applies to a subsample of 35 cities. The segmentation proposed by Priester et al. [22] was compiled based on a sample of 41 cities. Figure 4 visualizes the breakdown of the two studies in a Sankey diagram. Here, transitions from one segmentation approach to the other are shown in proportion to quantity. The greater the match between two segments, the broader the quantity flows between the two groups.
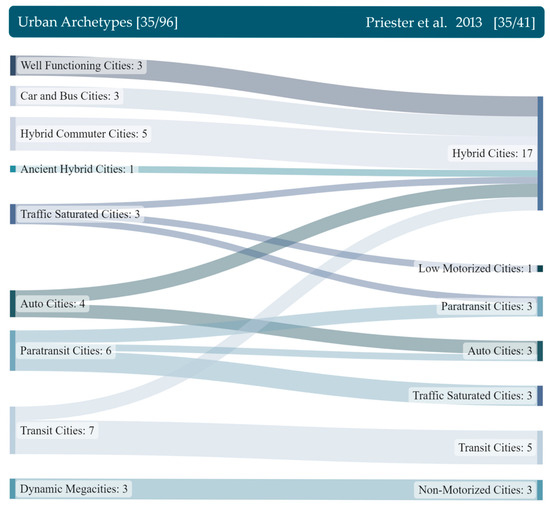
Figure 4.
Sankey diagram comparing the distribution of the urban archetypes across the city typologies from Priester et al. [22].
The Sankey diagram shows strongly overlapping cluster assignments of the two segmentation approaches. Particularly noteworthy is a distinct subdivision of the city typology “Hybrid Cities” from Priester et al. [22]. The cluster is divided into a total number of seven urban archetypes. Other urban archetypes, such as Dynamic Megacities and Traffic-Saturated Cities, are consistent with their respective counterparts in Priester et al. [22].
The more detailed subdivision of the large city typology Hybrid Cities can be considered a significant advantage of our urban archetypes’ methodology. This highlights that using all dimensions listed in Section 2 enables a more comprehensive consideration of cities. Overall, the comparison indicates a good consistency of the urban archetypes with the existing study of Priester et al. [22]. We identify similar clusters with similar compositions of cities, which demonstrates that the cities possess a certain stability in their development.
6. Discussion
6.1. Future Trajectories of Urban Archetypes
The classification of urban archetypes is a temporal snapshot, prompting inquiry into the evolution of cities with respect to their future car use. Regional differences are apparent; archetypes have distinct development trajectories and face various challenges. European cities are showing an increased willingness to transform through a multitude of mobility options, coupled with a deprioritization of the car. In line with their ambitious climate targets, European policymakers intend to pursue these targets at the urban level. European cities like Ancient Hybrid Cities and Well-Functioning Cities prioritize a livable city through road space allocation moving towards improved bicycle infrastructure and high-quality dwelling areas. Cities place less emphasis on examining the traffic-related impacts of measures when it serves the goal of a more livable city.
Due to their high population density and absolute number of people, Asian cities have fundamentally different needs. In order to attain livability and a more sustainable transport system, they need to focus on leveraging efficiency and stringent regulations. Predominantly Asian archetypes, such as Dynamic Megacities or Transit Cities, initially prioritize the efficiency of their transportation systems due to high demand. Smart city approaches are especially relevant here. Improvements in the cities’ livability are a subsequent result.
In contrast, North American archetypes like Auto Cities and Hybrid Commuter Cities primarily focus on managing road traffic, lacking sufficient mobility alternatives. Taken together, transformational activity in North American archetypes tends to be low.
The examination of potential development trajectories is particularly intriguing when it comes to car use. European cities, consisting of four different urban archetypes, show the greatest degree of uncertainty regarding their future car usage. Therefore, a comprehensive exploration of the European archetypes will be conducted below.
6.2. In-Depth Analysis of European Cities
For the final discussion of the urban archetypes, the Well-Functioning Cities, Ancient Hybrid Cities, Public Transit Cities, and Car and Bus Cities clusters represented in Europe will be used as examples to explain the extent to which the segmentation of cities can be used to create uniform strategies and mobility solutions. As an example, an analysis of the role of the private car in the respective clusters will be carried out. The extent to which the degree of car dependence of each cluster is related to its regulatory constraint on car use needs to be examined. Cities use a wide variety of regulatory measures to reduce urban car use (urban vehicle access restrictions, UVAR). Within the framework of the ReVeAL project (Regulating Vehicle Access for Improved Liveability) initiated by CIVITAS [56,69], the possible actions of cities are divided into five groups. A distinction is made between road user charges, environmental zones, zero-emission zones, emergency measures that allow cities to impose restrictions on car use under certain conditions, and other restrictions on traffic spaces [56]. To better understand the differences in car dependence within the selection of European cities, their respective principal component value is scaled relative to the distribution within the smaller sample group (n = 43).
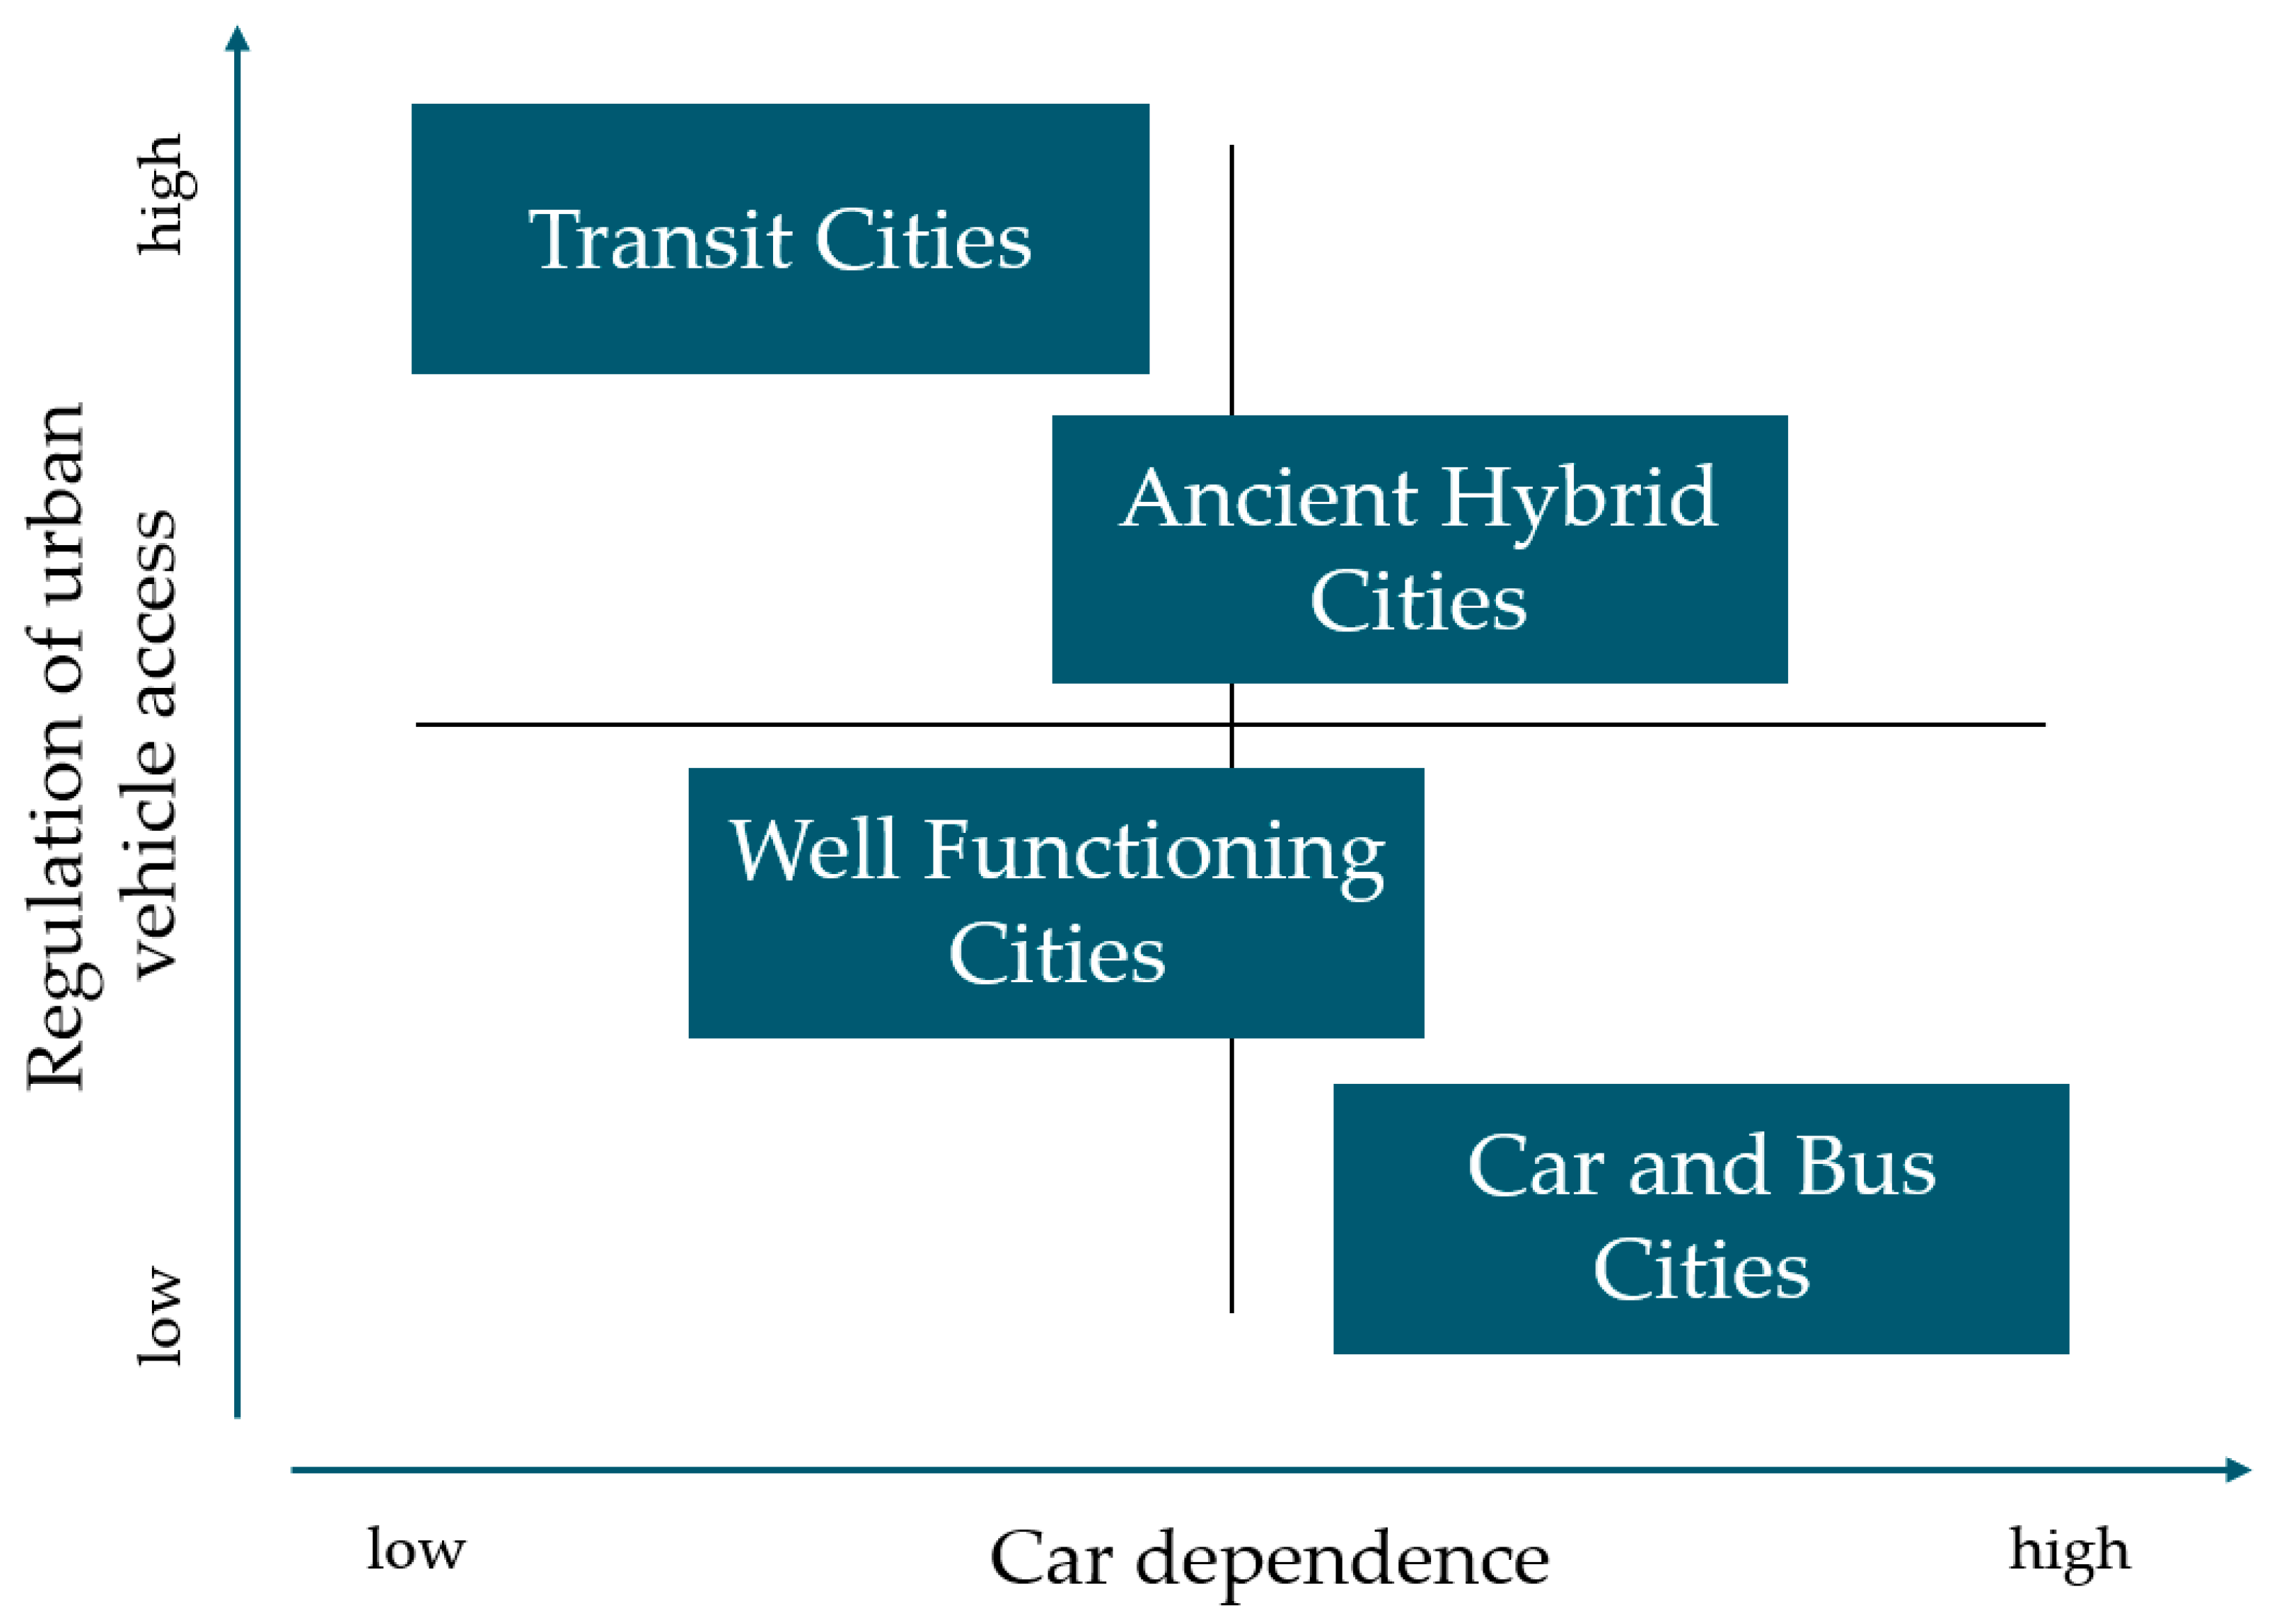
Figure 5 shows a qualitative ranking of archetypes according to their regulation of urban vehicle access and car dependence. A complete list of the measures employed by each city can be found in Table A1. The archetype Transit Cities with the lowest car dependence also shows the highest intensity of regulatory measures. In addition to the presence of road pricing, environmental and zero-emission zones are established measures to accelerate the transition towards an electric car fleet in London. Paris follows suit, announcing the introduction of initial zero-emission zones in 2030. Within Europe, Car and Bus cities form the counterpart of Transit Cities. The highest car dependence of the comparison archetypes is paired with the lowest regulation of urban car use at the same time. Individual cities use environmental zones in their urban core. However, except for the city of Dublin, these remain passable. Overall, we see an expected negative correlation between car dependence and restrictions. Strong alternatives to the car are necessary to obtain any room for maneuvering at all.

Figure 5.
Qualitative ranking of the car dependency and number of regulatory measures within the clusters represented in Europe.
7. Limitation of the Approach
The methodology applied and the discussion of the results presented facilitate a better understanding of urban archetypes around the world. Through our segmentation, we are able to identify strong differences between cities and their potential for increased livability and sustainable transport. Nevertheless, our findings should also be considered against the backdrop of their limitations. Firstly, in this study, we examined only 96 cities. The restriction in terms of the number of cities analyzed and their regional distribution results from the study’s broad database for segmentation. This database is undoubtedly an advantage in terms of the quality of the results. Nevertheless, the unavailability of data for a larger number of cities is a limitation. It is likely that we could find additional archetypes, for example, by including more cities in Africa. Secondly, we only captured cities at one point in time within our study. Our discussion shows that push and pull measures can change cities and their classification. Thirdly, we look at cities only as a whole, neglecting different archetypes of neighborhoods or municipalities within the cities. Moreover, due to limited data accessibility, we were restricted to analyzing cities at the administrative level, which poses a constraint on the comparability of the cities. Fourthly, with deterministic clustering methods, an object, e.g., a city, can only be assigned to exactly one cluster, even if it also fits into another cluster to a certain extent. This limitation must be taken into account when considering individual cities in the clusters. There are also differences within the clusters.
8. Conclusions
Enriching existing city segmentations, we segmented 96 globally distributed cities, based on a selection of 26 indicators, into nine urban archetypes. This indicates the extent to which cities differ regarding their mobility needs and challenges. This differentiation required a comprehensive understanding of the various aspects affecting urban mobility. Our findings address this first research question by stating the critical dimensions of urban mobility in order to identify urban archetypes of cities. The comprehensive literature review shows that five dimensions are relevant for achieving a holistic city segmentation. Due to the broad database of 96 cities, these dimensions could be considered within five principal components. A comparison with the study of Priester et al. [22] shows the strength of our approach, as a more differentiated representation of Hybrid Cities is possible. To answer the second research question, our findings also show what role the private car currently plays in different urban areas and how this may be subject to change in the future. Based on the results of the cluster analysis, we illustrated the influence of these differences in urban areas on the development of uniform strategies. A subsequent comparison of the archetypes within the European area also validated the usability of our segmentation in a smaller, regionally more limited setting. Urban transformation trajectories vary, and we see an expected negative correlation between car dependence and future regulatory measures to reduce car usage. Strong alternatives to the car are necessary to obtain any room for change at all.
Due to their broad database, the urban archetypes provide a well-suited base for further analyses of the implications of car traffic. The status quo is thereby mapped via the nine clusters. Based on the clusters, various analyses of car use, prosperity development, or urban emission development can be derived in this way. Similarly to the process described in Section 6.2, a holistic analysis of all urban archetypes and their respective restrictions of urban car usage can be conducted in further research.
The assessment of urban archetypes has unveiled geographical variations among North America, Asia, and Europe, which arise from multiple factors such as urban size, the presence of alternatives to the car, weather conditions favoring cycling, and, significantly, the level of maturity of the transportation network. Our study serves as a base for future scientific work focusing on cities and, at the same time, provides an important orientation for practitioners to initiate new urban projects for a more sustainable transport system.
We expect that a proportion of the cities considered in this study will continue to transform into smart, livable cities, while others will remain in their current status quo for now. This fact must be considered, as continuous monitoring of cities is necessary in order to identify this transformation. Future research consists of forecasting the development of cities and the transferability of measures. For this purpose, further cities must be assigned to urban archetypes via supervised clustering methods.
Author Contributions
Conceptualization, S.v.B., M.T., L.B. and H.S.; methodology, S.v.B. and M.T.; software, S.v.B. and M.T.; validation, S.v.B., M.T., L.B. and C.E.; formal analysis, S.v.B. and M.T.; investigation, S.v.B., M.T., L.B. and C.E.; resources, S.v.B. and M.T.; data curation, S.v.B. and M.T.; writing—original draft preparation, S.v.B., M.T., L.B., H.S. and C.E.; writing—review and editing, S.v.B., M.T., L.B., H.S., F.H., M.K. and C.E.; visualization, S.v.B. and M.T.; supervision, H.S., F.H., M.K. and C.E.; project administration, S.v.B., M.T. and L.B. All authors have read and agreed to the published version of the manuscript.
Funding
This research received no external funding.
Institutional Review Board Statement
Not applicable.
Informed Consent Statement
Not applicable.
Data Availability Statement
The data are not publicly available due to legal reasons.
Acknowledgments
We acknowledge support from the KIT-Publication Fund of the Karlsruhe Institute of Technology.
Conflicts of Interest
The authors declare no conflict of interest.
Appendix A
Table A1.
Distribution of the 96 cities across the urban archetypes.
Table A1.
Distribution of the 96 cities across the urban archetypes.
| Well-Functioning Cities | Ancient Hybrid Cities | Transit Cities | Auto Cities | Hybrid Commuter Cities |
|---|---|---|---|---|
| Amsterdam | Athens | Hong Kong | Columbus | Atlanta |
| Basel | Barcelona | London | Dubai | Boston |
| Berlin | Bologna | Osaka | Houston | Chicago |
| Cologne | Brussels | Paris | Los Angeles | Miami |
| Copenhagen | Budapest | Seoul | Phoenix | New York |
| Düsseldorf | Lisbon | Singapore | San Diego | San Francisco |
| Frankfurt | Lyon | Tokyo | Seattle | Washington |
| Hamburg | Madrid | Toronto | ||
| Helsinki | Marseille | Vancouver | ||
| Karlsruhe | Milan | |||
| Leipzig | Montpellier | |||
| Munich | Porto | |||
| Oslo | Rome | |||
| Rotterdam | Sevilla | |||
| Stockholm | Tallinn | |||
| Stuttgart | Torino | |||
| Vienna | Valencia | |||
| Zurich | Warsaw | |||
| Dynamic Megacities | Car and Bus Cities | Paratransit Cities | Traffic-Saturated Cities | |
| Beijing | Auckland | Bangalore | Bogota | |
| Chengdu | Belfast | Bangkok | Buenos Aires | |
| Guangzhou | Birmingham | Cape Town | Istanbul | |
| Shanghai | Brisbane | Chennai | Mexico City | |
| Shenzhen | Bristol | Delhi | Moscow | |
| Dublin | Hyderabad | Mumbai | ||
| Manchester | Jakarta | Rio de Janeiro | ||
| Melbourne | Johannesburg | Santiago | ||
| Montreal | Kuala Lumpur | Sao Paulo | ||
| Sydney | Riyadh | |||
| Tel Aviv | Shenyang | |||
| Wuhan | ||||
Appendix B
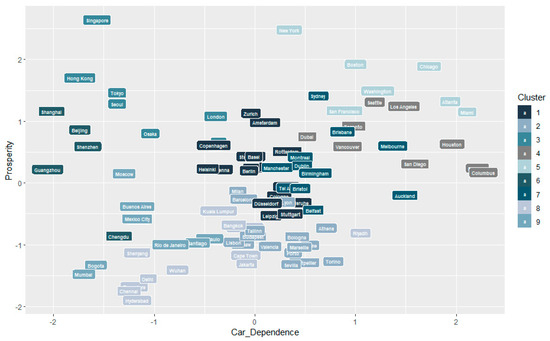
Figure A1.
Comparison of the individual cities and their respective clusters based on the principal components of car dependence and prosperity.
Figure A1.
Comparison of the individual cities and their respective clusters based on the principal components of car dependence and prosperity.
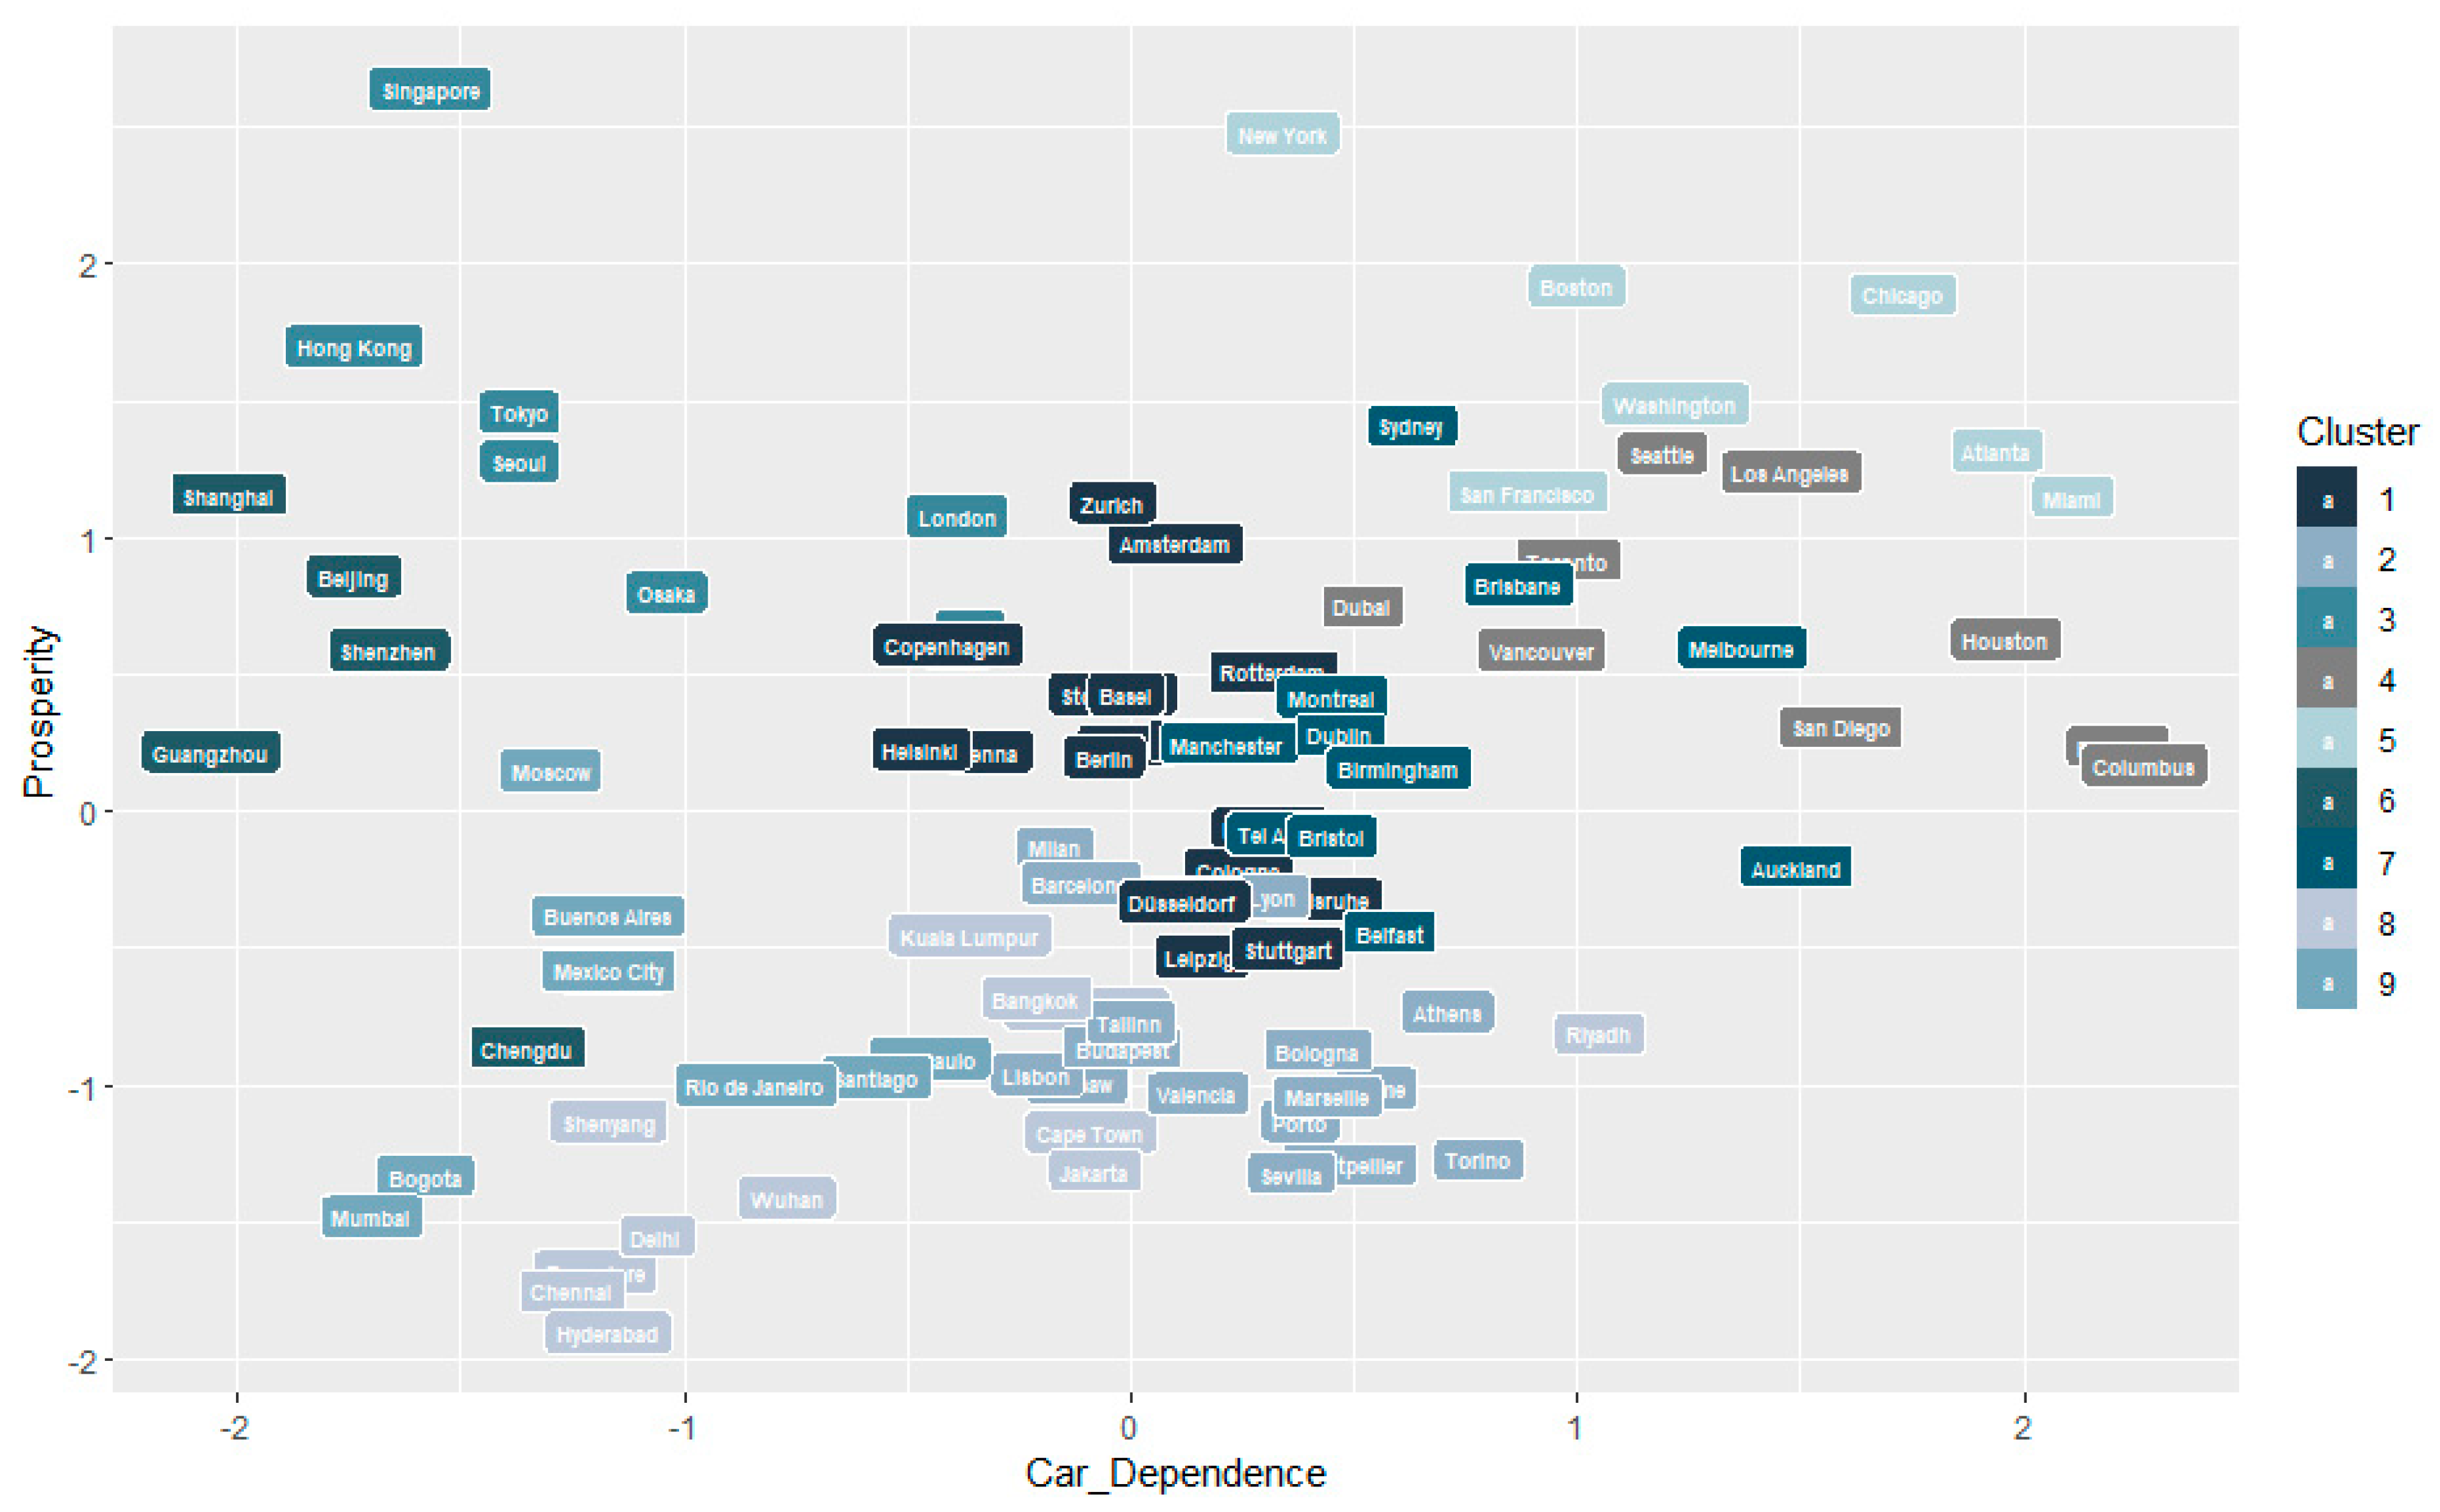

Figure A2.
Comparison of the individual cities and their respective clusters based on the principal components of car dependence and traffic maturity.
Figure A2.
Comparison of the individual cities and their respective clusters based on the principal components of car dependence and traffic maturity.
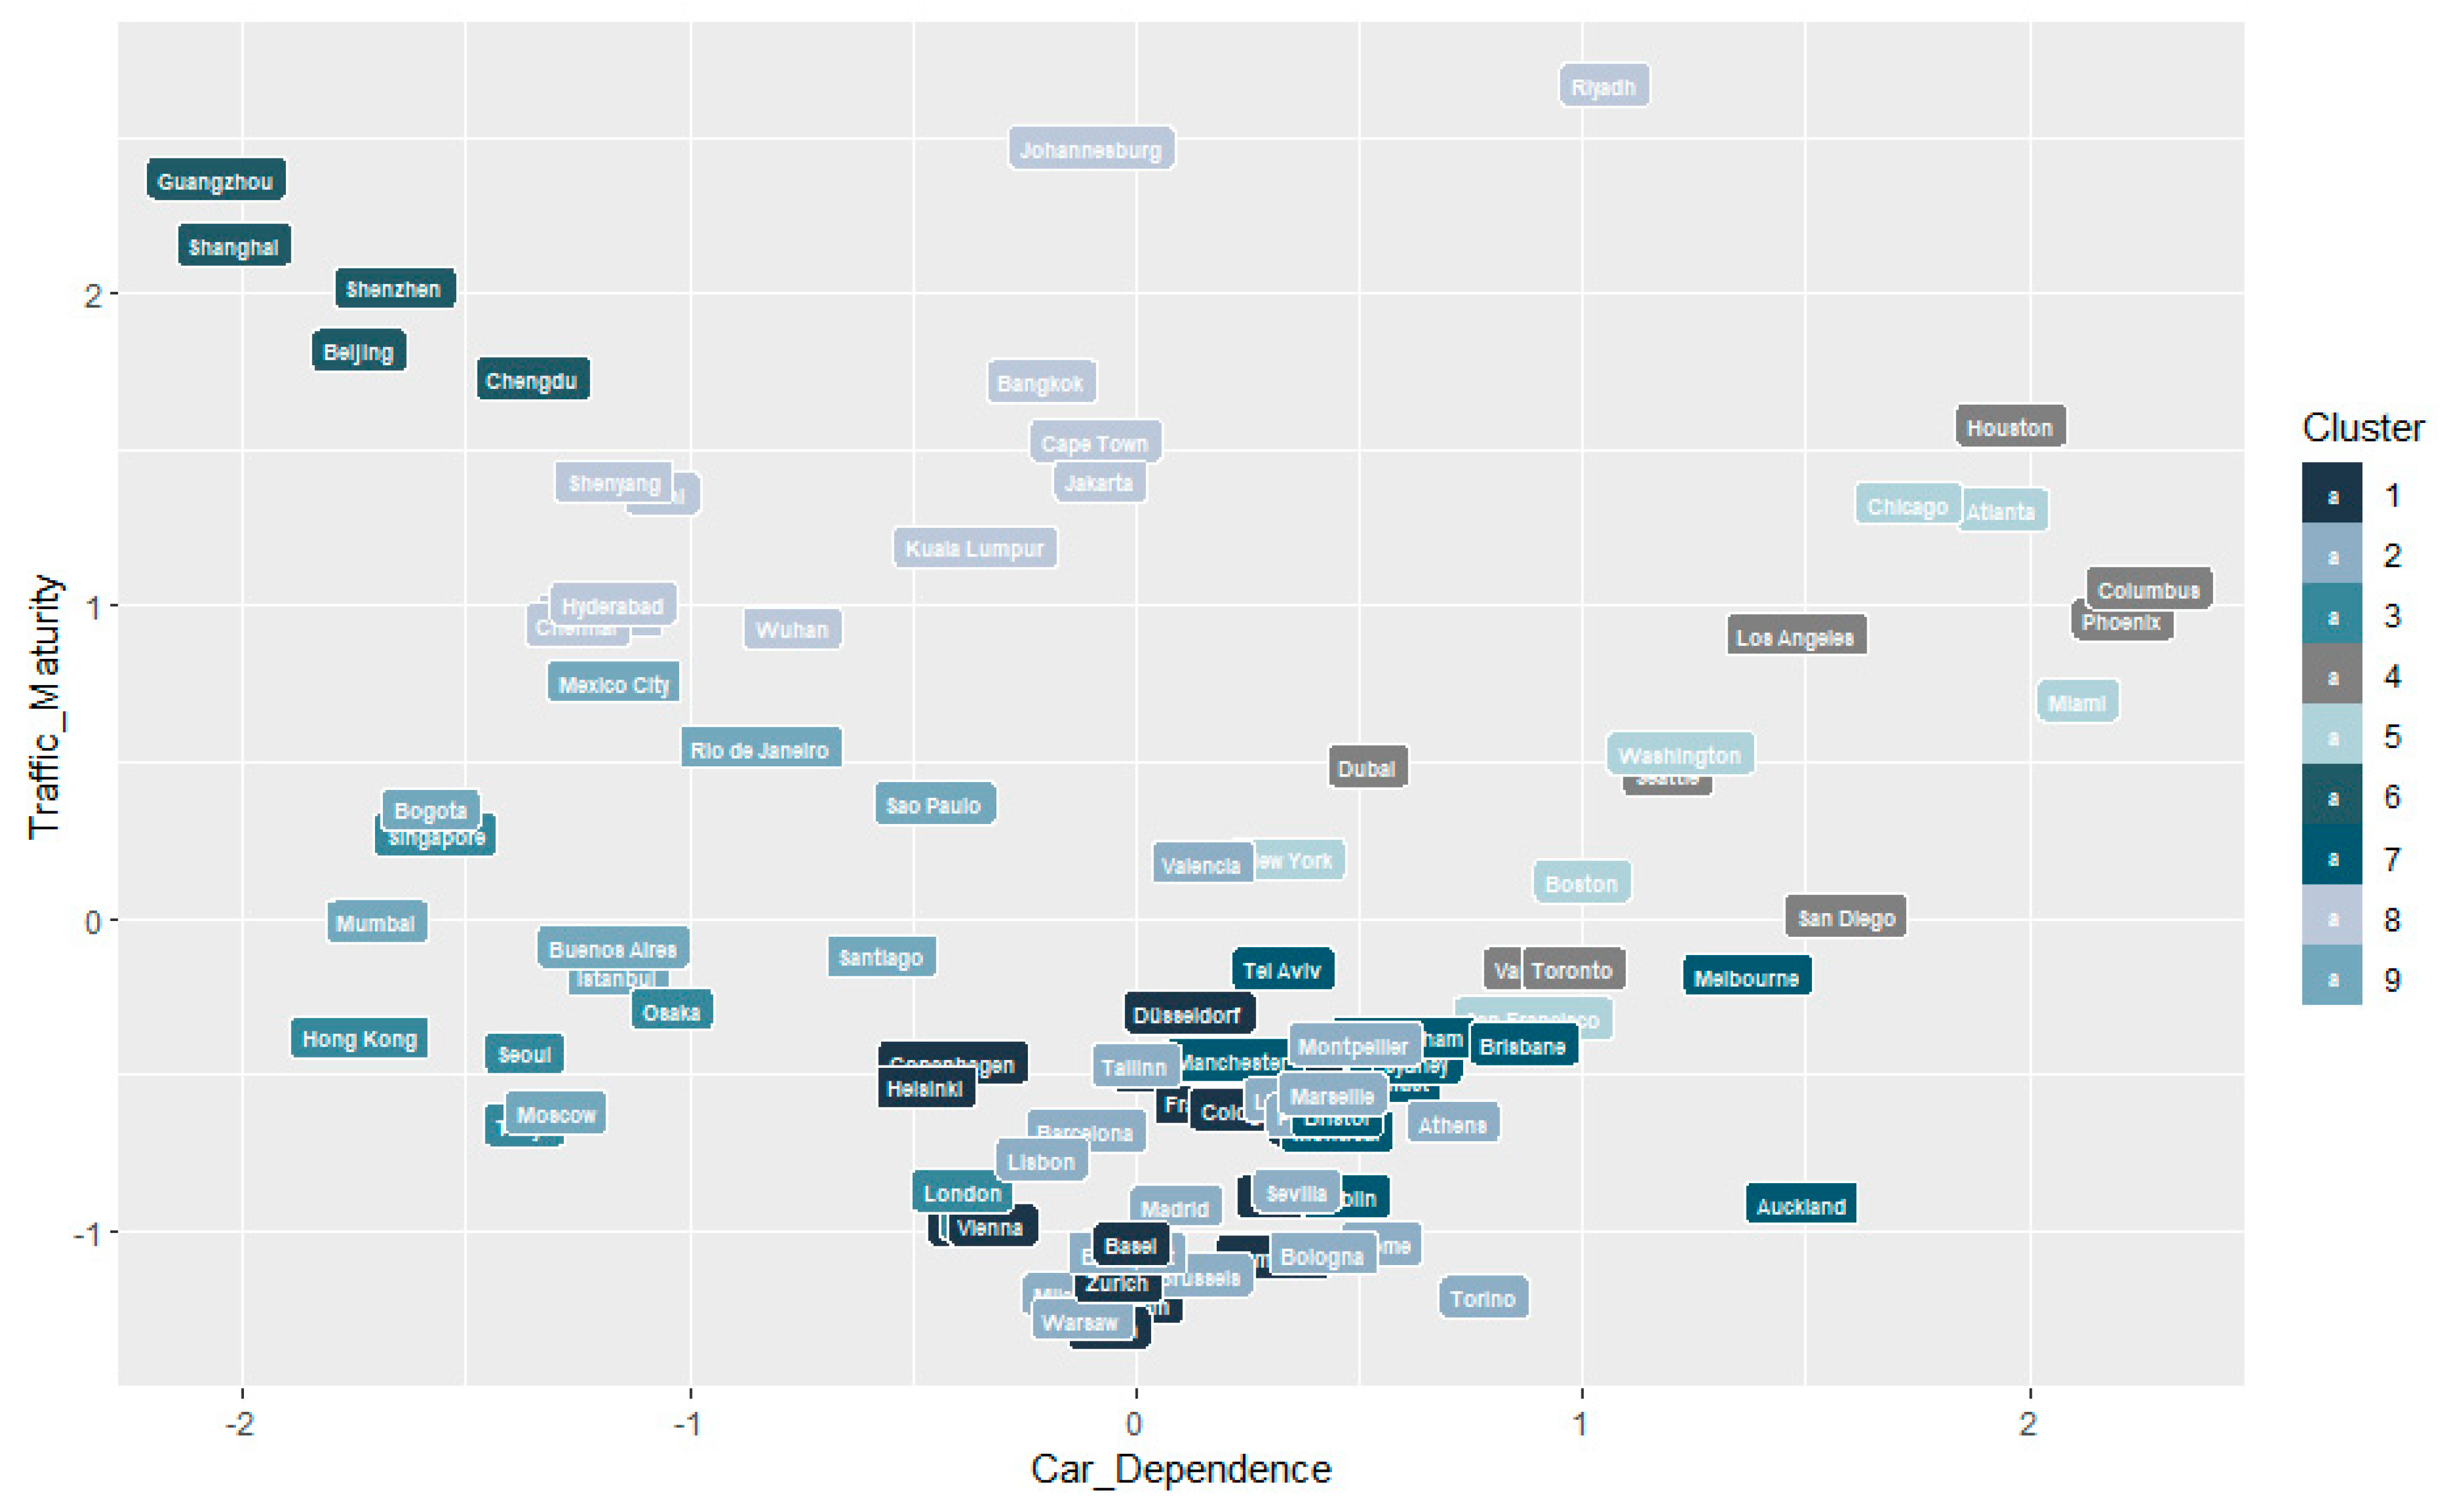

Figure A3.
Comparison of the individual cities and their respective clusters based on the principal components of car dependence and traffic saturation.
Figure A3.
Comparison of the individual cities and their respective clusters based on the principal components of car dependence and traffic saturation.
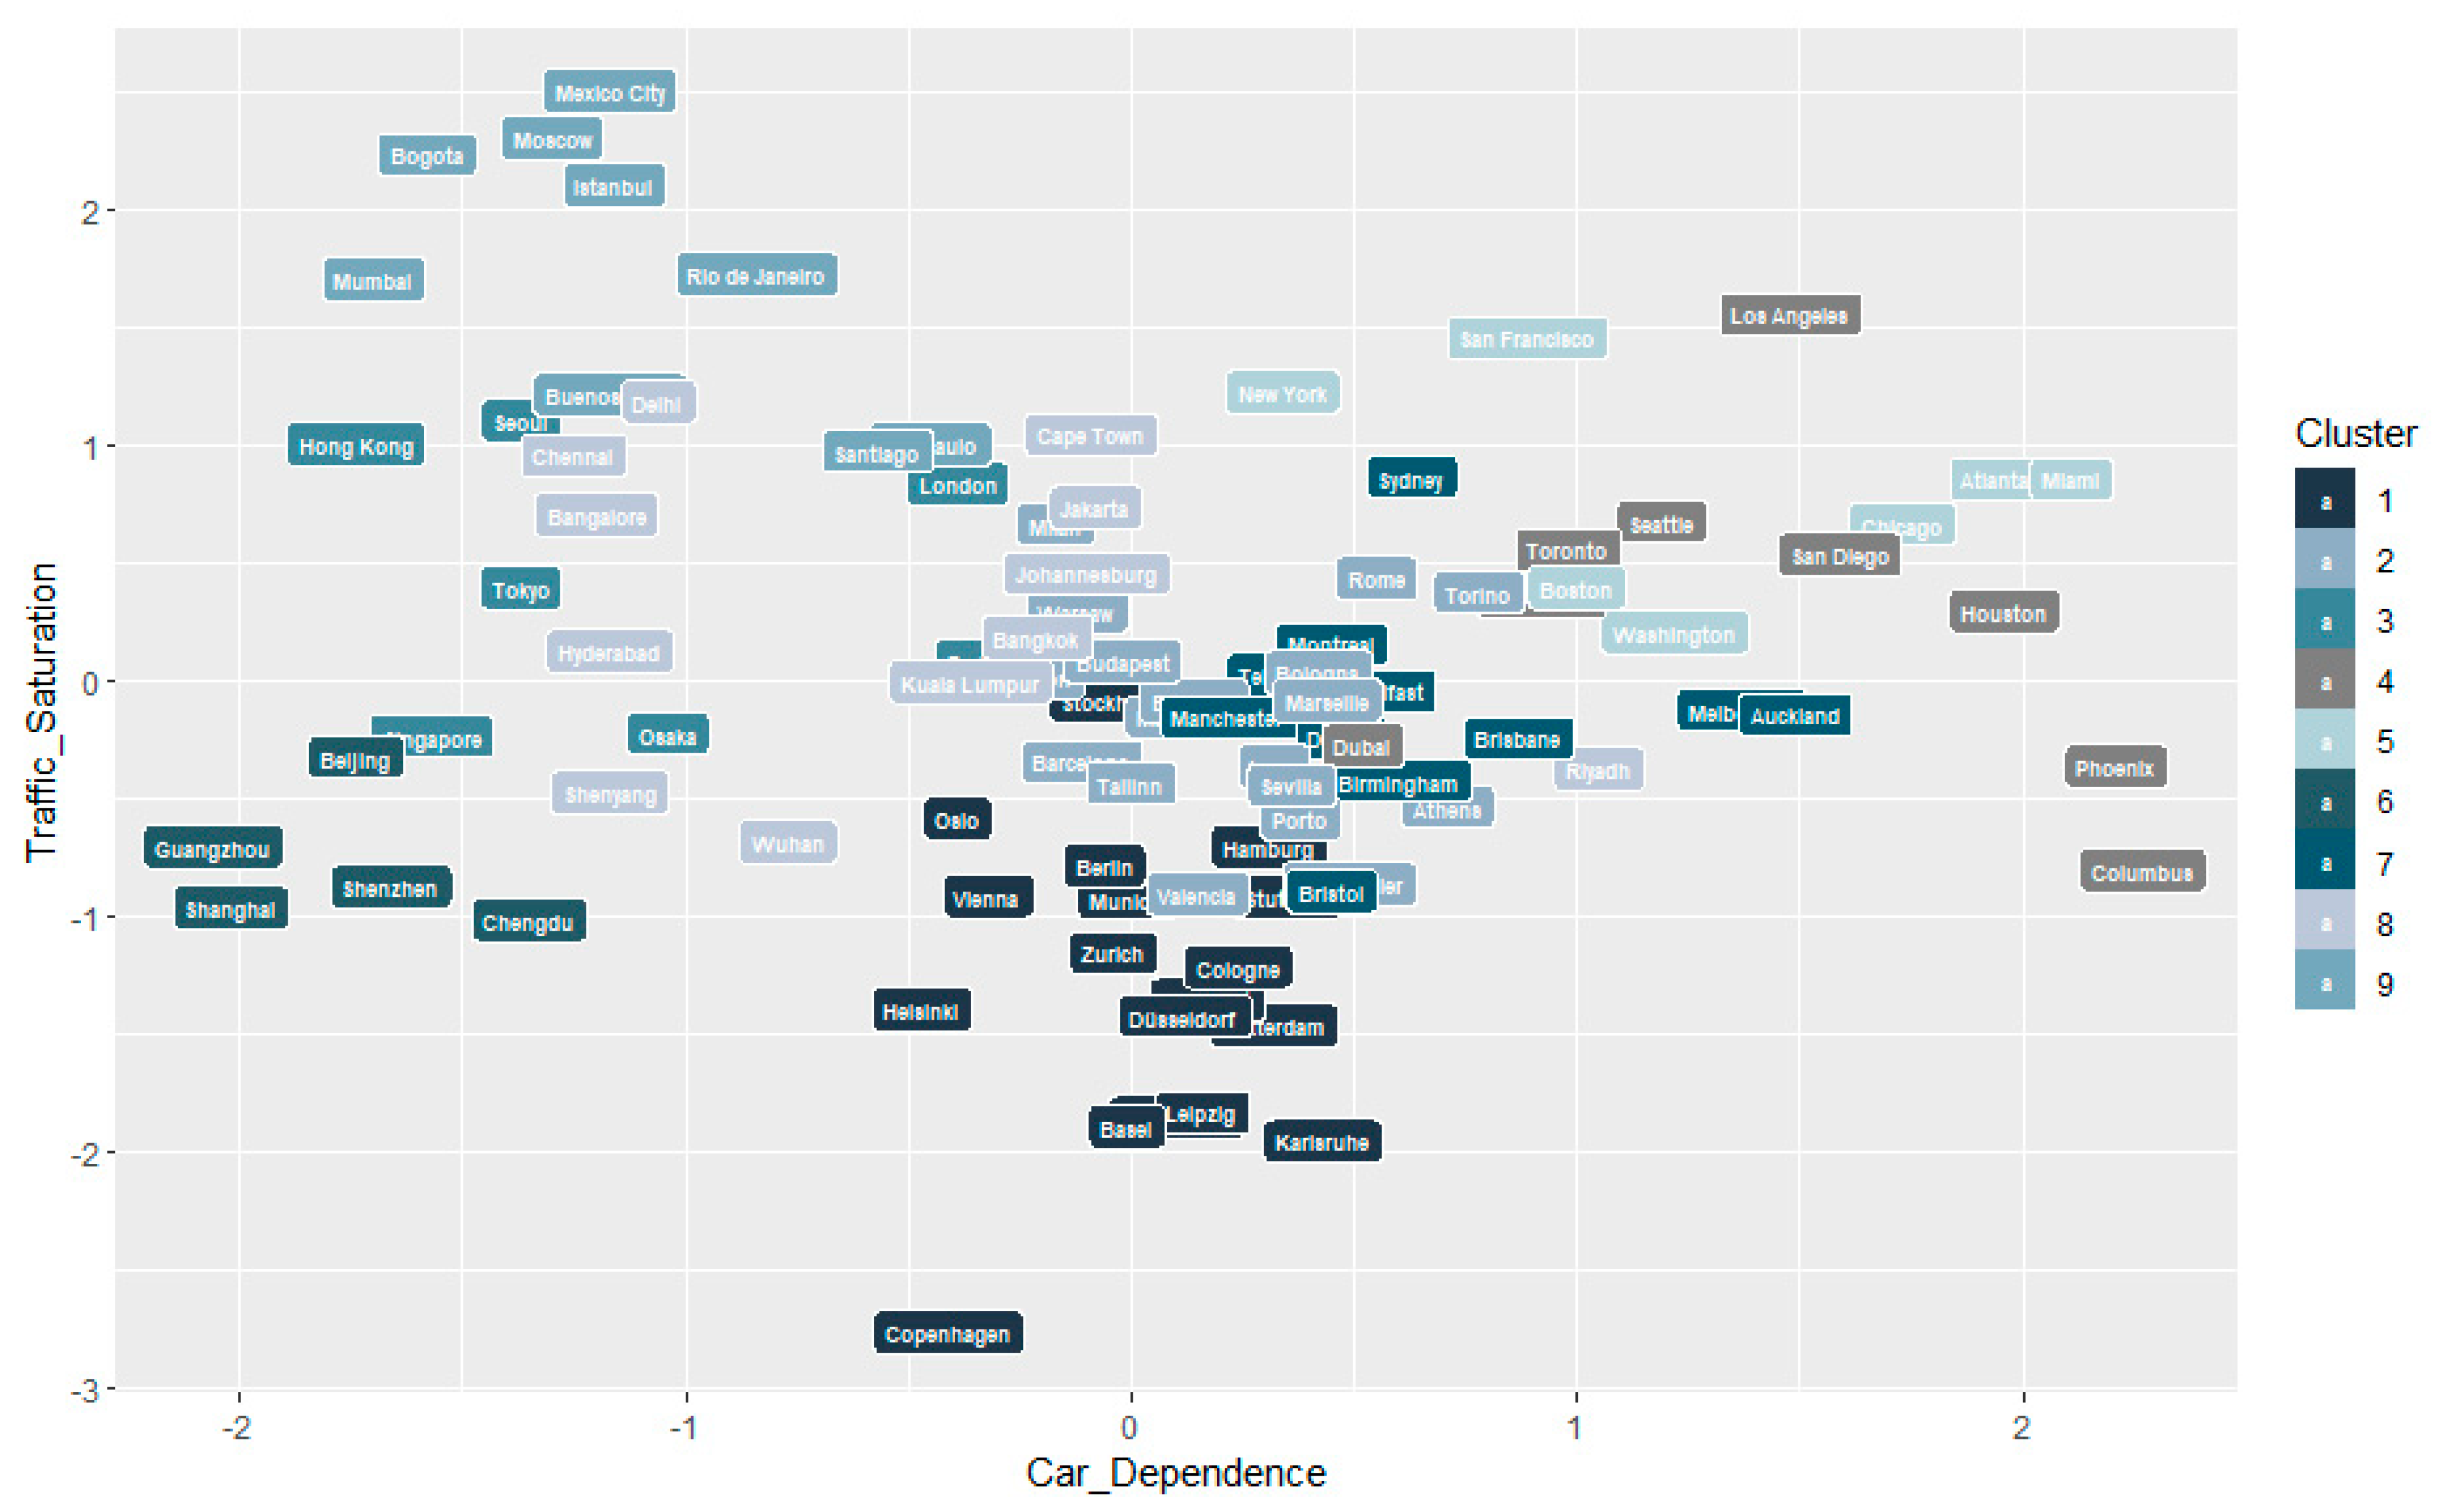

Figure A4.
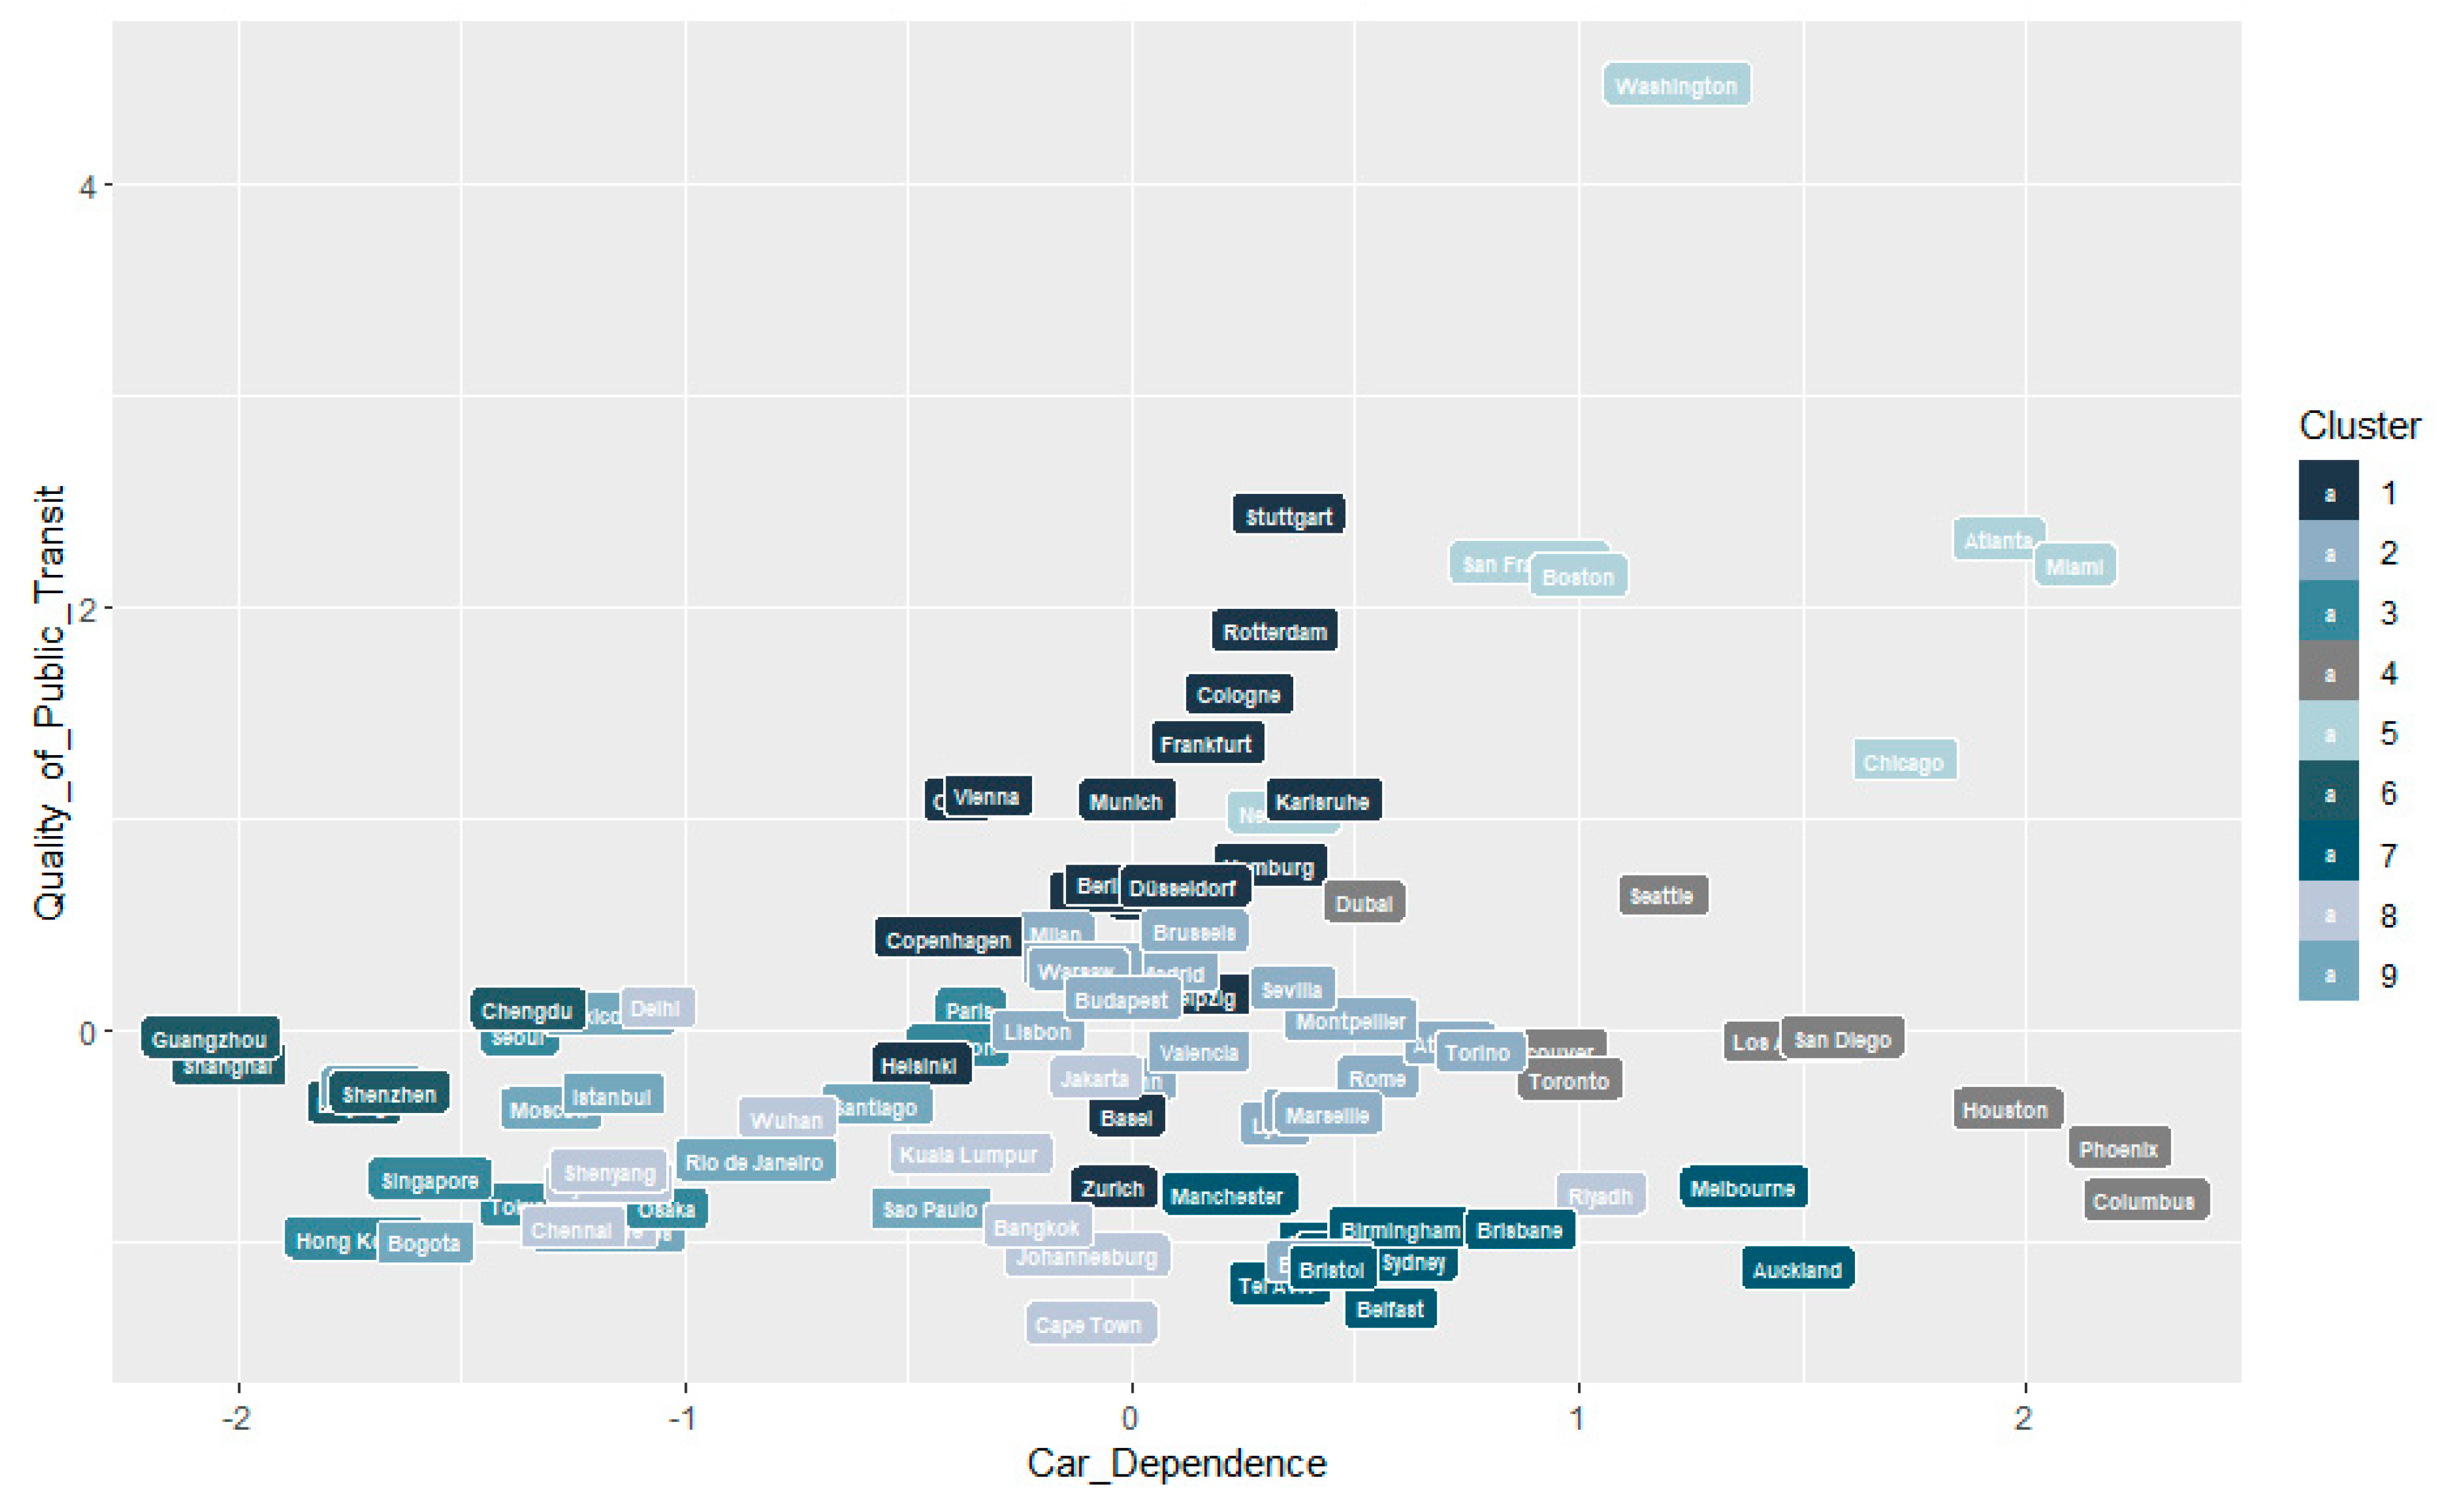
Comparison of the individual cities and their respective clusters based on the principal components of car dependence and quality of public transit.
Figure A4.
Comparison of the individual cities and their respective clusters based on the principal components of car dependence and quality of public transit.
Appendix C
Table A2.
Overview of the regulatory measures used within the European clusters to reduce urban traffic (UVAR); from Sadler Consultants [56].
Table A2.
Overview of the regulatory measures used within the European clusters to reduce urban traffic (UVAR); from Sadler Consultants [56].
| Overview of the Regulation of European Urban Archetypes for Vehicles < 3.5 t * | Road Pricing | Environmental Zones | Zero-Emissions Zones | Restricted Entry Zones | Emergency Measures | |
|---|---|---|---|---|---|---|
| Well-Functioning Cities | Amsterdam | x | (2025) | x | ||
| Basel | x | |||||
| Berlin | x | |||||
| Cologne | x | |||||
| Copenhagen | x | x | ||||
| Düsseldorf | x | |||||
| Frankfurt | x | |||||
| Hamburg | x | |||||
| Helsinki | ||||||
| Karlsruhe | x | |||||
| Leipzig | x | |||||
| Munich | x | |||||
| Oslo | x | x | x | x | ||
| Rotterdam | x | |||||
| Stockholm | x | x | x | |||
| Stuttgart | x | |||||
| Vienna | x | x | x | |||
| Zurich | ||||||
| Transit Cities | London | x | x | x | ||
| Paris | x | (2030) | x | x | ||
| Ancient Hybrid Cities | Athens | x | ||||
| Barcelona | x | x | x | |||
| Bologna | x | x | x | |||
| Brussels | x | x | x | x | ||
| Budapest | x | x | ||||
| Lisbon | x | x | ||||
| Lyon | x | x | ||||
| Madrid | x | x | x | |||
| Marseille | x | x | ||||
| Milan | x | x | x | x | ||
| Montpellier | x | |||||
| Porto | x | |||||
| Rome | x | x | x | |||
| Sevilla | x | x | x | |||
| Tallinn | ||||||
| Torino | x | x | x | |||
| Valencia | x | x | ||||
| Warsaw | ||||||
| Car and Bus Cities | Birmingham | x | ||||
| Bristol | x | |||||
| Dublin | x | |||||
| Belfast | ||||||
| Manchester | x | |||||
* Cross implies the existence of measures.
References
- United Nations. World Urbanization Prospects: The 2018 Revision; United Nations: New York, NY, USA, 2019; ISBN 978-92-1-148319-2. [Google Scholar]
- OECD Publishing. International Transport Forum ITF Transport Outlook 2021; OECD Publishing: Paris, France, 2021. [Google Scholar] [CrossRef]
- Harris, C. A Functional Classification of Cities in the United States. Geogr. Rev. 1943, 33, 86–99. [Google Scholar] [CrossRef]
- Nelson, H. A Service Classification of American Cities. Econ. Geogr. 1955, 31, 189–210. [Google Scholar] [CrossRef]
- Hart, J.F. Functions and Occupational Structures of Cities of the American South. Ann. Assoc. Am. Geogr. 1955, 45, 269–286. [Google Scholar] [CrossRef]
- Bruce, G.D.; Witt, R.E. Developing Empirically Derived City Typologies: An Application of Cluster Analysis. Sociol. Q. 1971, 12, 238–246. [Google Scholar] [CrossRef]
- Dalton, P.; Williams, S. Grouping Minnesota Cities: Using Cluster Analysis; Minnesota House Research Department: St. Paul, MN, USA, 2015; p. 58. Available online: https://www.house.mn.gov/hrd/pubs/groupmncity.pdf (accessed on 29 June 2023).
- Hill, E.; Brennan, J.; Wolman, H. What Is a Central City in the United States? Applying a Statistical Technique for Developing Taxonomies. Urban Stud. 1998, 35, 1935–1969. [Google Scholar] [CrossRef]
- Martin, M.; Carley, K.M.; Altman, N. 300 Cities—An Exploration in Characterizing US Cities 2008. Available online: https://papers.ssrn.com/sol3/papers.cfm?abstract_id=2726827 (accessed on 28 June 2023).
- Al Ani, M. Urban Types and Transformation of the City; Real Corp: Schwechat, Austria, 2012. [Google Scholar]
- Huang, J.; Lu, X.X.; Sellers, J. A Global Comparative Analysis of Urban Form: Applying Spatial Metrics and Remote Sensing. Landsc. Urban Plan. 2007, 82, 184–197. [Google Scholar] [CrossRef]
- Thomson, M. Great Cities and Their Traffic; Penguin: Harmondsworth, UK, 1978; ISBN 0-14-055127-1. [Google Scholar]
- Frenkel, A. Land-Use Patterns in the Classification of Cities: The Israeli Case. Environ. Plan. B Plan. Des. 2004, 31, 711–730. [Google Scholar] [CrossRef]
- Hook, W.; Replogle, M. Motorization and Non-Motorized Transport in Asia: Transport System Evolution in China, Japan and Indonesia. Land Use Policy 1996, 13, 69–84. [Google Scholar] [CrossRef]
- Feige, I.; Mischke, M.; Gropman, L. City Archetypes How Might Specific Needs of Cities Be Best Addressed in Considering Urban Mobility? 2020. Available online: https://population.un.org/wup/publications/Files/WUP2018-Report.pdf (accessed on 29 June 2023).
- Holz-Rau, C.; Heyer, R.; Schultewolter, M.; Aertker, J.; Wachter, I.; Klinger, T. Eine Verkehrstypologie deutscher Großstädte. Raumforschung und Raumordnung. Spat. Res. Plan. 2022, 80, 137–152. [Google Scholar] [CrossRef]
- Moody, J.; Wang, S.; Chun, J.; Ni, X.; Zhao, J. Transportation Policy Profiles of Chinese City Clusters: A Mixed Methods Approach. Transp. Res. Interdiscip. Perspect. 2019, 2, 100053. [Google Scholar] [CrossRef]
- Kenworthy, J.; Laube, F. The Millennium Cities Database for Sustainable Transport. Database 2001. Available online: https://trid.trb.org/view/708144 (accessed on 8 August 2023).
- Kenworthy, J. Sustainable Urban Transport: Developing Sustainability Rankings and Clusters Based on an International Comparison of Cities. In Handbook of Sustainability Research; Peter Lang Publishing: New York, NY, USA, 2005; ISBN 978-0-8204-7308-6. [Google Scholar]
- Karathodorou, N.; Graham, D.; Noland, R. Estimating the Effect of Urban Density on Fuel Demand. Energy Econ. 2010, 32, 86–92. [Google Scholar] [CrossRef]
- Joly, I.; Masson, S.; Petiot, R. The Determinants of Urban Public Transport: An International Comparison and Econometric Analysis; AET: London, UK, 2004; p. 25. [Google Scholar] [CrossRef]
- Priester, R.; Kenworthy, J.; Wulfhorst, G. The Diversity of Megacities Worldwide: Challenges for the Future of Mobility. In Megacity Mobility Culture: How Cities Move on in a Diverse World; Lecture Notes in Mobility; Springer: Berlin, Germany, 2013; pp. 23–54. ISBN 978-3-642-34735-1. [Google Scholar]
- Oke, J.; Aboutaleb, Y.; Akkinepally, A.; Azevedo, C.L.; Han, Y.; Zegras, C.; Ferreira, J.; Ben-Akiva, M. A Novel Global Urban Typology Framework for Sustainable Mobility Futures. Environ. Res. Lett. 2019, 14, 095006. [Google Scholar] [CrossRef]
- Klinger, T.; Kenworthy, J.; Lanzendorf, M. Dimensions of Urban Mobility Cultures—A Comparison of German Cities. J. Transp. Geogr. 2013, 31, 18–29. [Google Scholar] [CrossRef]
- Shell New Lenses on Future Cities: A New Lens Scenarios Supplement 2014. Available online: https://www.shell.com/energy-and-innovation/the-energy-future/scenarios/what-are-the-previous-shell-scenarios/new-lenses-on-future-cities/_jcr_content/root/main/section/text_407441365.multi.stream/1655892182865/4af0dbaee78537131e05449aaf5f63b3b953b52c/newlensesonfuturecities-june-2014.pdf (accessed on 28 June 2023).
- Acuto, M.; Davidson, K.; Mokhles, S. Reimagining Climate Networking between Cities: Clustering Cities Based on a Large Dataset of Mitigation Actions 2022. Available online: https://www.researchsquare.com/article/rs-1806235/v1 (accessed on 29 June 2023).
- Cantuarias-Villessuzanne, C.; Weigel, R.; Blain, J. Clustering of European Smart Cities to Understand the Cities’ Sustainability Strategies. Sustainability 2021, 13, 513. [Google Scholar] [CrossRef]
- Ismagilova, E.; Hughes, L.; Dwivedi, Y.; Raman, R. Smart Cities: Advances in Research—An Information Systems Perspective. Int. J. Inf. Manag. 2019, 47, 88–100. [Google Scholar] [CrossRef]
- Woetzel, J.; Lin, D.-Y.; Sridhar, M.; Yap, S.-E. Smart Cities in Southeast Asia; McKinsey Global Institute Discussion Paper; McKinsey & Company: New York, NY, USA, 2018; p. 44. Available online: https://www.mckinsey.com/capabilities/operations/our-insights/smart-cities-in-southeast-asia (accessed on 29 June 2023).
- Lang, N.; Herrmann, A.; Hagenmaier, M.; Richter, M.A. Can Self-Driving Cars Stop the Urban Mobility Meltdown? Boston Consulting Group: Boston, MA, USA, 2020. [Google Scholar]
- Rose, J.; Schellong, D.; Schaetzberger, C.; Hill, J. How E-Scooters Can Win a Place in Urban Transport; Boston Consulting Group: Boston, MA, USA, 2020; p. 10. Available online: https://web-assets.bcg.com/img-src/BCG-How-E-Scooters-Can-Win-a-Place-in-Urban-Transport-Jan-2020-rev_tcm9-237992.pdf (accessed on 29 June 2023).
- Shi, Z.; Silvennoinen, H.; Chadzynski, A.; Von Richthofen, A.; Kraft, M.; Cairns, S.; Herthogs, P. Defining Archetypes of Mixed-Use Developments Using Google Maps API Data. Environ. Plan. B Urban Anal. City Sci. 2022, 50, 1607–1623. [Google Scholar] [CrossRef]
- Kim, K. Identifying the Structure of Cities by Clustering Using a New Similarity Measure Based on Smart Card Data. IEEE Trans. Intell. Transp. Syst. 2020, 21, 2002–2011. [Google Scholar] [CrossRef]
- von Behren, S. Das Mobilitätsskelett—Ein Integrativer Ansatz zur Mehrdimensionalen Betrachtung von Urbaner Mobilität. Ph.D. Thesis, Karlsruher Institut für Technologie (KIT), Karlsruhe, Germany, 2021. [Google Scholar] [CrossRef]
- Magdolen, M.; von Behren, S.; Chlond, B.; Hunecke, M.; Vortisch, P. Combining Attitudes and Travel Behavior—A Comparison of Urban Mobility Types Identified in Shanghai, Berlin and San Francisco. In Proceedings of the TRB 98th Annual Meeting Compendium of Papers, Washington, DC, USA, 13–17 January 2019; p. 21. [Google Scholar]
- Murphy, K.P. Machine Learning: A Probabilistic Perspective; Adaptive Computation and Machine Learning Series; MIT Press: Cambridge, MA, USA, 2012; ISBN 978-0-262-01802-9. [Google Scholar]
- NUMO Micromobility Map. Available online: https://www.numo.global/new-mobility-atlas (accessed on 28 June 2023).
- UITP City Transit Data. Available online: https://citytransit.uitp.org/ (accessed on 28 June 2023).
- Dixon, S.; Bornstein, J.; Pankratz, D.M. The Deloitte City Mobility Index. Available online: https://www2.deloitte.com/us/en/insights/focus/future-of-mobility/deloitte-urban-mobility-index-for-cities.html (accessed on 28 June 2023).
- Eurostat Stock of Vehicles by Category and NUTS 2 Regions 2023. Available online: https://ec.europa.eu/eurostat/databrowser/view/tran_r_vehst/default/table?lang=en (accessed on 28 June 2023).
- Numbeo Cost of Living. Available online: https://www.numbeo.com (accessed on 28 June 2023).
- TomTom. TomTom Traffic Index Ranking 2022. Available online: https://www.tomtom.com/traffic-index/ranking/ (accessed on 28 June 2023).
- European Commission Global Human Settlement Layer- Urban Centre Database UCDB R2019A. Available online: https://ghsl.jrc.ec.europa.eu/ucdb2018visual.php (accessed on 28 June 2023).
- OpenStreetMap. Available online: https://www.openstreetmap.org/ (accessed on 28 June 2023).
- Boeing, G. Urban Spatial Order: Street Network Orientation, Configuration, and Entropy. Appl. Netw. Sci. 2019, 4, 1–19. [Google Scholar] [CrossRef]
- UN Habitat Urban Indicators Database 2021. Available online: https://data.unhabitat.org/datasets/GUO-UN-Habitat::11-2-1-percentage-access-to-public-transport/explore (accessed on 28 June 2023).
- Data-Driven EnviroLab the Urban Environment and Social Inclusion Index. Available online: https://datadrivenlab.org/urban (accessed on 28 June 2023).
- Skyscraper Source Media Database—SkyscraperPage.Com. Available online: https://skyscraperpage.com/cities/ (accessed on 28 June 2023).
- World Population Review World City Populations 2023. Available online: https://worldpopulationreview.com/world-cities (accessed on 28 June 2023).
- Moran, D.; Kanemoto, K.; Jiborn, M.; Wood, R.; Többen, J.; Seto, K. Carbon Footprints of 13 000 Cities. Environ. Res. Lett. 2018, 13, 064041. [Google Scholar] [CrossRef]
- The World Bank Gini Index 2022. Available online: https://data.worldbank.org (accessed on 28 June 2023).
- Neffke, F.; Li, Y.; White, A.; Leonard, B.; Tuzcu, N.; Kyle, S.; Barrios, D.; Morales-Arilla, J.R.; Hausmann, R. Metroverse|Harvard Growth Lab. Available online: https://metroverse.cid.harvard.edu/ (accessed on 28 June 2023).
- 2thinknow Innovation Cities Index. Available online: https://innovation-cities.com/city-data/ (accessed on 28 June 2023).
- Zhuge, C.; Wei, B.; Shao, C.; Shan, Y.; Dong, C. The Role of the License Plate Lottery Policy in the Adoption of Electric Vehicles: A Case Study of Beijing. Energy Policy 2020, 139, 111328. [Google Scholar] [CrossRef]
- Rohde, M. World Metro Database. Available online: http://mic-ro.com/metro/index.html (accessed on 28 June 2023).
- Sadler Consultants Urban Access Regulations in Europe. Available online: https://urbanaccessregulations.eu/ (accessed on 28 June 2023).
- Quacquarelli Symonds QS World University Rankings 2023. Available online: https://www.topuniversities.com/city-rankings/2023 (accessed on 28 June 2023).
- OECD. ITF Monitoring Progress in Urban Road Safety: 2022 Update; OECD: Paris, France, 2022; p. 42. [Google Scholar]
- Hofstede Insights Country Comparison Tool. Available online: https://www.hofstede-insights.com/country-comparison-tool (accessed on 28 June 2023).
- Backhaus, K.; Erichson, B.; Plinke, W.; Weiber, R. Multivariate Analysemethoden: Eine Anwendungsorientierte Einführung, 15th ed.; Springer: Berlin, Germany, 2018; ISBN 978-3-662-56655-8. [Google Scholar]
- Williams, B.; Onsman, A.; Brown, T. Exploratory Factor Analysis: A Five-Step Guide for Novices. JEPHC 2010, 8, 1–13. [Google Scholar] [CrossRef]
- Hair, J.; Black, W.; Babin, B.; Anderson, R. Multivariate Data Analysis. In Always Learning, 7th ed.; Pearson Education Limited: London, UK, 2013; ISBN 978-1-292-02190-4. [Google Scholar]
- Ketchen, D., Jr.; Shook, C. The Application of Cluster Analysis in Strategic Management Research: An Analysis and Critique. Strat. Mgmt. J. 1996, 17, 441–458. [Google Scholar] [CrossRef]
- Hunecke, M. Mobilitätsverhalten Verstehen Und Verändern: Psychologische Beiträge Zur Interdisziplinären Mobilitätsforschung; Springer: Wiesbaden, Germany, 2015; Volume 26, ISBN 3-658-08825-7. [Google Scholar]
- Reiffer, A.; Wörle, T.; Briem, L.; Soylu, T.; Kagerbauer, M.; Vortisch, P. Identifying Usage Profiles of Station-Based Car-Sharing Members Using Cluster Analyses. In Proceedings of the TRB 98th Annual Meeting Compendium of Papers, Washington, DC, USA, 13–17 January 2019; Transportation Research Board: Washington, DC, USA, 2019. [Google Scholar]
- Magdolen, M.; von Behren, S.; Burger, L.; Chlond, B. Mobility Styles and Car Ownership—Potentials for a Sustainable Urban Transport. Sustainability 2021, 13, 2968. [Google Scholar] [CrossRef]
- Rousseeuw, P. Silhouettes: A Graphical Aid to the Interpretation and Validation of Cluster Analysis. J. Comput. Appl. Math. 1987, 20, 53–65. [Google Scholar] [CrossRef]
- Syakur, M.A.; Khotimah, B.K.; Rohman, E.M.; Satoto, B.D. Integration K-Means Clustering Method and Elbow Method for Identification of the Best Customer Profile Cluster; IOP Publishing: Bristol, UK, 2018; Volume 336, p. 012017. [Google Scholar]
- CIVITAS. Introducing CIVITAS: Sustainable and Smart Mobility for All 2021. Available online: https://civitas.eu/sites/default/files/CIVITAS2030%20booklet.pdf (accessed on 8 August 2023).


Disclaimer/Publisher’s Note: The statements, opinions and data contained in all publications are solely those of the individual author(s) and contributor(s) and not of MDPI and/or the editor(s). MDPI and/or the editor(s) disclaim responsibility for any injury to people or property resulting from any ideas, methods, instructions or products referred to in the content. |
© 2023 by the authors. Licensee MDPI, Basel, Switzerland. This article is an open access article distributed under the terms and conditions of the Creative Commons Attribution (CC BY) license (https://creativecommons.org/licenses/by/4.0/).