Abstract
The aim of this study was to characterize the municipal solid waste (MSW) in Nablus city in Palestine, while focusing on the plastic waste fraction. The plastic fraction—an environmentally problematic waste stream—was further characterized into the different polymer types and formats with the aim of suggesting feasible recovery and recycling solutions. Locally generated studies lack data about the recyclable fractions in the MSW and a thorough characterization of the plastic waste stream, although there is global action to minimize and optimally treat this waste fraction. The composition analysis was conducted by collecting 60 samples from five districts with different characteristics (e.g., income, density, level of education, building formats). The fraction of bio- and organic waste is significant in the collected MSW in Nablus, representing about 68% of the total MSW. The recyclables (paper and cardboard, glass, metals and plastics) amount to 27.4% of the generated MSW in the city. The plastic fraction (10.1%) is mainly composed of low-density polyethylene (LDPE) films (39.8%), polyethylene terephthalate (PET) bottles (21.9%), high-density polyethylene (HDPE) rigids (19.0%), and polypropylene (PP) rigids (11.5%), all of which are technologically recyclable. The polymer types and container formats indicated that the collected plastics originate mostly from packaging. The outcomes of this research indicate the need to implement a separate collection system for the organic waste fraction, which could be used to produce compost for the agricultural activities in the region. By having such a system, the dry recyclables (including plastics) can be easily recovered with less degree of contamination for recycling, helping the local recyclers to access cleaner materials. Furthermore, the state of Palestine lacks strict regulations for the end-of-life treatment of the different waste fractions; therefore, having clear guidelines and incentive systems will result in the minimization of the generated waste as well as better achievement of recovery and recycling targets. In addition, expertise, funding, public awareness, facilities, equipment and other provisions are currently lacking or inappropriate. In future, these factors must be addressed to enhance sustainable solid waste management.
1. Introduction
Waste management is a complex system, entailing different elements (e.g., strategies, infrastructure, logistics, economics, etc.). The decision on which waste management system to implement has direct consequences for the environment, society and economy, elements that are interconnected and that must stay in balance [1].
Municipal solid waste is a product associated with various human activities, which mostly originates from households (55–80%) and commercial activities (10–30%) [2,3].
In the coming years, if people’s lifestyles do not change, which drive the mass production of solid waste, it is expected that its generation will steadily increase [4]. The main reason for the rapid increase in the rate of municipal solid waste generation and disposal in many cities around the world is modernization and urbanization. Thus, solid waste management has become a major concern in most cities, especially in developing countries [5,6]. Consequently, there is an increasing concern about the environmental impacts associated with solid waste management in addition to the increase in costs. For instance, greenhouse gas emissions due to waste disposal, landfilling and management have been recognized as a major contributor to global warming, a worldwide challenge that has to be tackled [7].
To plan an effective waste management system, accurate projections of the quantities and the composition of the municipal solid waste are required [8]. Reliable data about the solid waste are unfortunately lacking in many developing countries. Some data are also based on assumptions and not on scientific measurements [2,9]. To obtain real and representative data about the generated municipal solid waste, waste characterization is the first step [10,11,12]. Furthermore, the timely identification of variables that influence the generation of MSW will aid in the optimization of efficient waste management. In this sense, forecasting the generation of MSW as a function of the behavior and living conditions of people in a specific urban context should become possible [13].
In general, understanding the composition of the MSW in a country not only contributes to finding optimized solutions for waste reduction and management but also helps in proposing solutions such as cascade use or resource recovery and recycling, where waste is considered a valuable resource.
In developing countries, the percentage of plastics in municipal solid waste (MSW) streams is on the rise, particularly due to the absence of regulations that limit the application of single-use products and the lack of consumer awareness regarding this waste stream [14,15]. Nonetheless, applying solutions that are appropriate for developed countries is not always effective in low-income, rural or infrastructure-limited regions. Therefore, when addressing the challenge of unmanaged plastic waste, we must consider not only technical but also social, ecological, political, and economic dimensions specific to each locality to which they are introduced [16].
In the state of Palestine, solid waste management is facing many challenges at different levels, legal, organizational, technical, and cultural, in addition to the difficult political situation of limited Palestinian access to and control of lands and resources. About 65% of the MSW is disposed of in sanitary landfills, while the remaining is disposed of in predominantly illegal dumping sites. Despite the success in closing 52 illegal dumping sites, tens more still exist [17]. Furthermore, the unregulated disposal of waste and the poor recovery of materials at their end of life (EOL) result in loss of resources, loss of land, raised methane and CO2 emissions, ground water contamination, and fume emissions [18]. All of these factors can affect health and the environment. As per a press release by the Palestinian Central Bureau of Statistics and the Environment Quality Authority, plastic is one of the most important components of solid waste in Palestine, representing about 16.4% of the total solid waste in the West Bank and about 14.0% of the total solid waste in the Gaza Strip. Despite the tangible amounts of plastic waste, Palestine lacks entities that practice recycling based on their own capabilities, except for the treatments that are ongoing by private operators [19]. To our knowledge, there is not any literature available about the composition and the quality of the plastic waste in the state of Palestine, with the aim of considering feasible and environmentally friendly solutions.
This study was carried out with the aim of providing significant data to enhance the currently available waste management system, while focusing on the plastic waste fraction in the MSW. The objective was to gather up-to-date data about the generated waste at large and the plastic waste fraction specifically in order to propose strategies to implement an efficient circular economy in the state of Palestine. Defining the abundant polymer types and formats in the plastic waste fraction provides information about consumer behavior, the products most represented, and the possible stakeholders to be targeted when recycling is implemented. The defined solutions—based on the waste quality and characteristics—provide decision makers and the private sector with important foundations on which to plan strategies and business ideas. To achieve these objectives, waste-sorting campaigns were conducted on mixed-waste samples provided by the municipality of Nablus, which were obtained from five different districts with variable characteristics.
2. Materials and Methods
2.1. Study Area
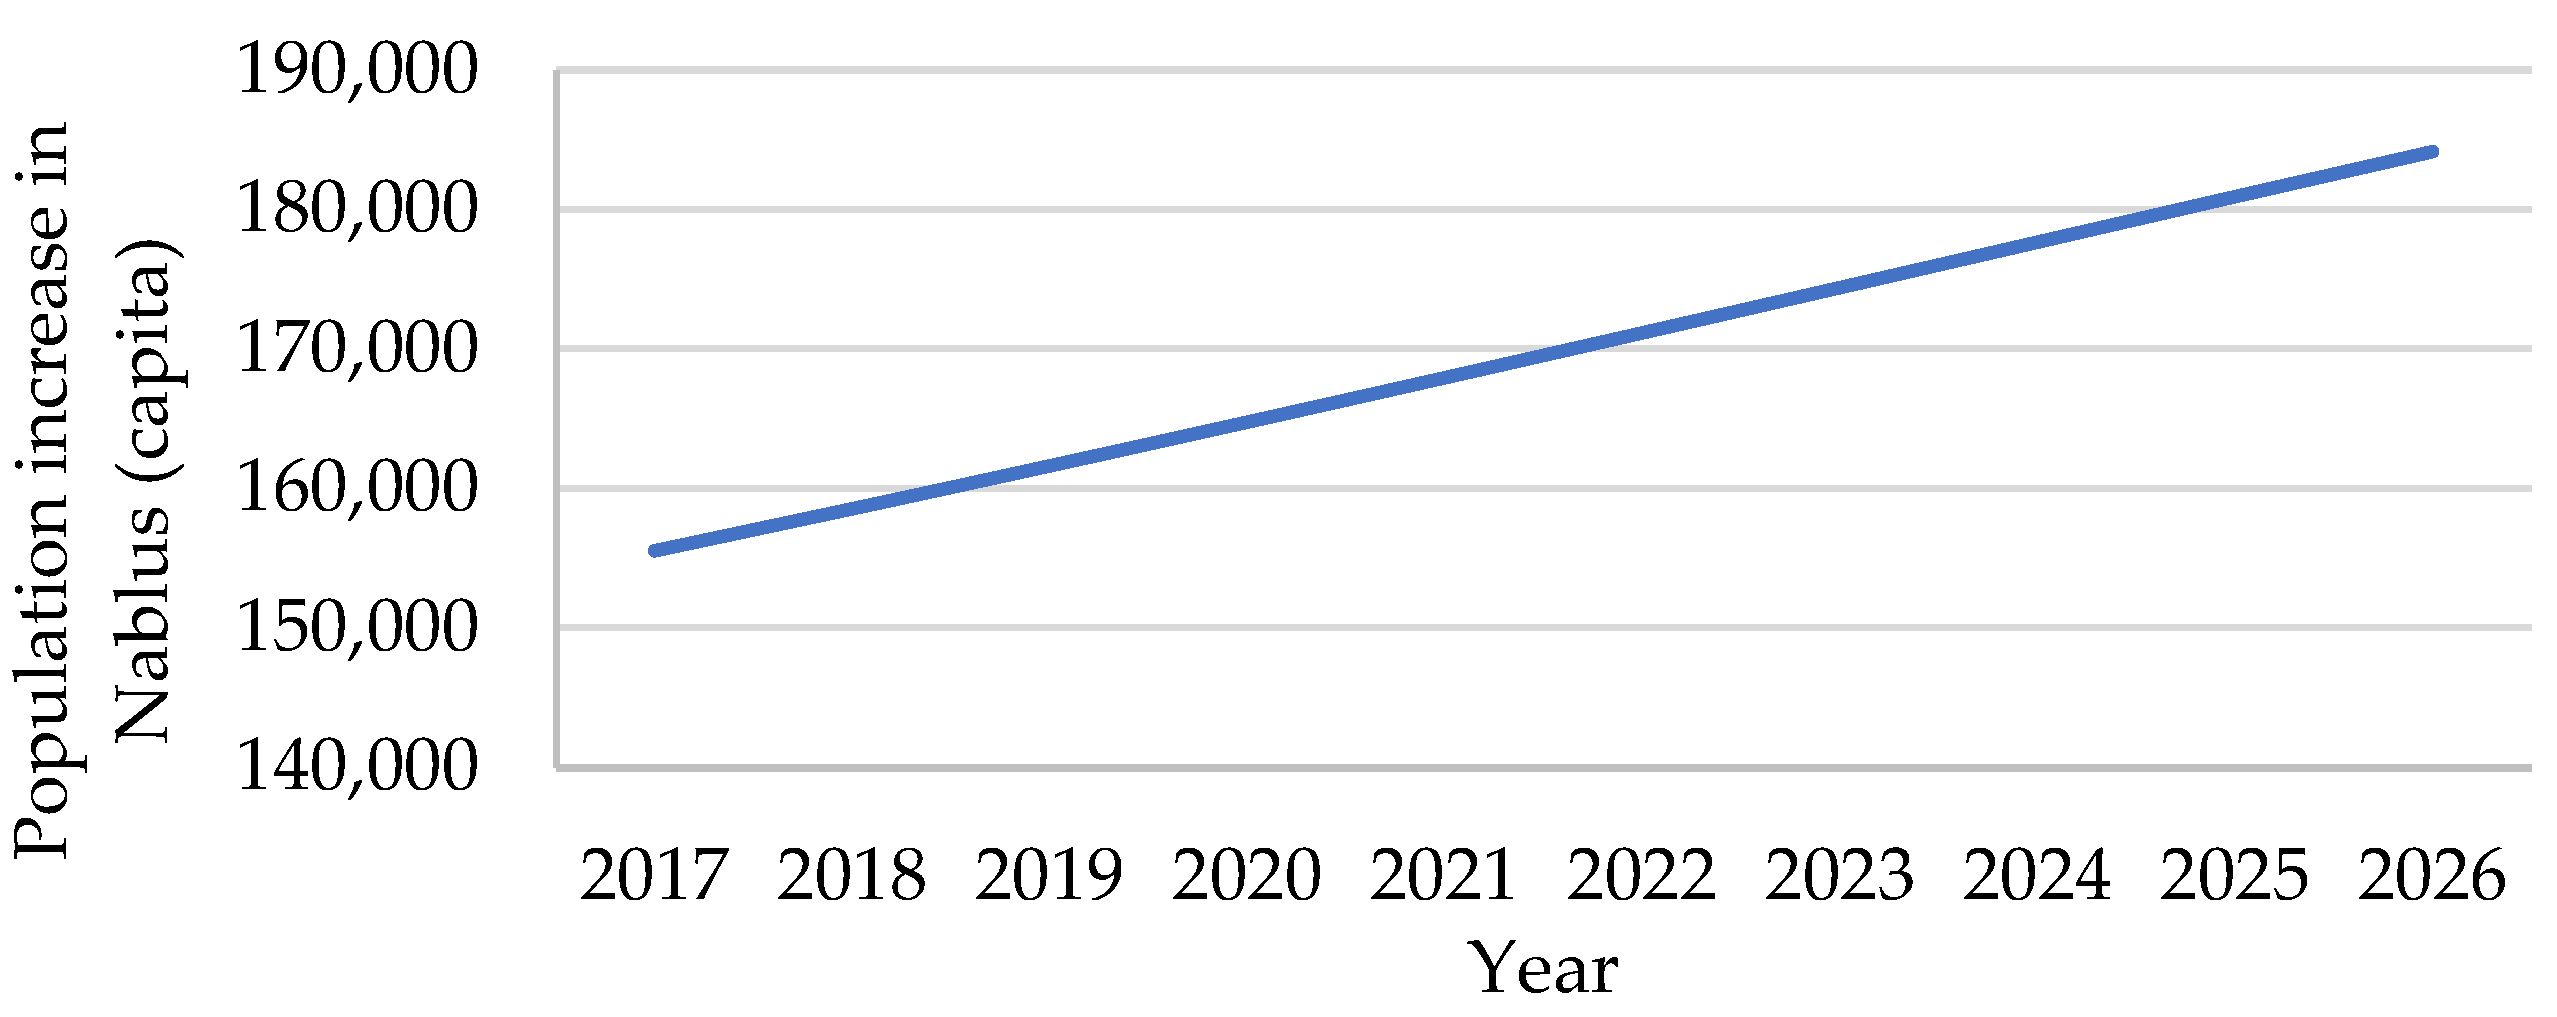
Nablus is a Palestinian city in the northern West Bank, approximately 49 km north of Jerusalem [20]. The population in Nablus city in 2023 is anticipated to be 174,387 as per data published in mid-2021 by the Palestinian Central Bureau of Statistics [21]. The estimated population increase over the years is presented in Figure 1. Nablus is the largest commercial and cultural center in the state of Palestine. The climate in the city is Mediterranean: hot dry in summer (temperature goes up to +30 °C) and cold and rainy in winter (with temperatures down to +3 °C) [22]. Nablus municipality has the largest solid waste management system in the state of Palestine. Part of its job is to collect the waste for the old city and the surrounding districts (within 70 km2). Meanwhile, the waste from the surrounding refugee camps is collected by the United Nations Relief and Works Agency (UNRWA). The waste is first delivered to a transfer station “Al-Sairafi Station”, located east and serving the city and the villages surrounding it. The final disposal site of the waste is Zahrat Al-finjan sanitary landfill in Jenin (27 km from Nablus).

Figure 1.
The yearly population in Nablus city estimated over the years 2017–2026.
In this study, the city of Nablus was partitioned into two primary regions: the western and the eastern sections. Within these regions, five districts were chosen as representative samples. Specifically, three of these districts are situated in the western region and two are located in the eastern region. Table 1 summarizes the characteristics of these five districts.

Table 1.
Main characteristics of the five selected districts in the city of Nablus.
2.2. Sampling and Characterization of the Municipal Waste
The composition of the municipal solid waste (MSW) in Nablus city was analyzed. The focus of the composition analysis was quantifying and analyzing the plastic waste generated, which is a challenging waste stream that is not yet exploited in the state of Palestine.
Defining the sampling criteria is a critical step in shaping the results of the characterization. Due to the heterogeneous nature of the solid waste stream, generalized field procedures—based on common sense and random sampling techniques—were implemented. From each of the selected districts (see Table 1), 12 samples were obtained (total of 60 sorting campaigns). The analysis was performed by categorizing the samples into eight primary groups (organic waste, paper and cardboard, plastic, glass, metals, textiles, fine fraction (<10 mm), and other waste fractions). The plastic waste fraction was separately analyzed and categorized into seven secondary groups—polyethylene terephthalate (PET—recycling code 1), high-density polyethylene (HDPE—recycling code 2), polyvinyl chloride (PVC—recycling code 3), low-density polyethylene (LDPE—recycling code 4), polypropylene (PP—recycling code 5), polystyrene (PS—recycling code 6), and others (recycling code 7).
The method from the World Health Organization (WHO) for sampling solid waste and analyzing the samples was followed [23]. For the analysis, a waste container of a capacity of 0.5 m3 was used. It was shaken three times without applying any additional force to avoid compacting the waste sample. The waste container was then emptied on a sorting table of dimensions 1.5 m x 3 m. The surface of the sorting table is composed of a mesh with a pore size of 10 mm x 10 mm, which was especially designed and fabricated to extract the fine fraction (<10 mm). The remaining sample on the surface of the table (>10 mm) was then manually sorted into the pre-defined fractions.
Fifteen sorting containers (dustbins) with different capacities ranging from 70 L to 20 L were used to sort the solid waste components into the above-defined primary and secondary categories. A scale was used to weigh the dustbins at the different sampling locations. The percentages of the different solid waste components were calculated in relation to the weight of the whole sample. Data analysis was conducted for both the primary and secondary categories of solid waste using the data analysis tool in Microsoft Excel 2021.
2.3. Monthly Municipal Waste Generation and Composition
To determine the quantity of solid waste in Nablus city (on a weight basis), monthly data were retrieved from the Nablus municipality for the years 2016–2022. The average composition of the MSW in Nablus obtained from the sorting campaigns conducted in this study was applied to find the average monthly composition of waste generated in the city. The corresponding population of Nablus municipality was obtained from Palestinian Central Bureau of Statistics data [15].
3. Results and Discussion
3.1. Composition of the MSW in Nablus City (Weight Basis)
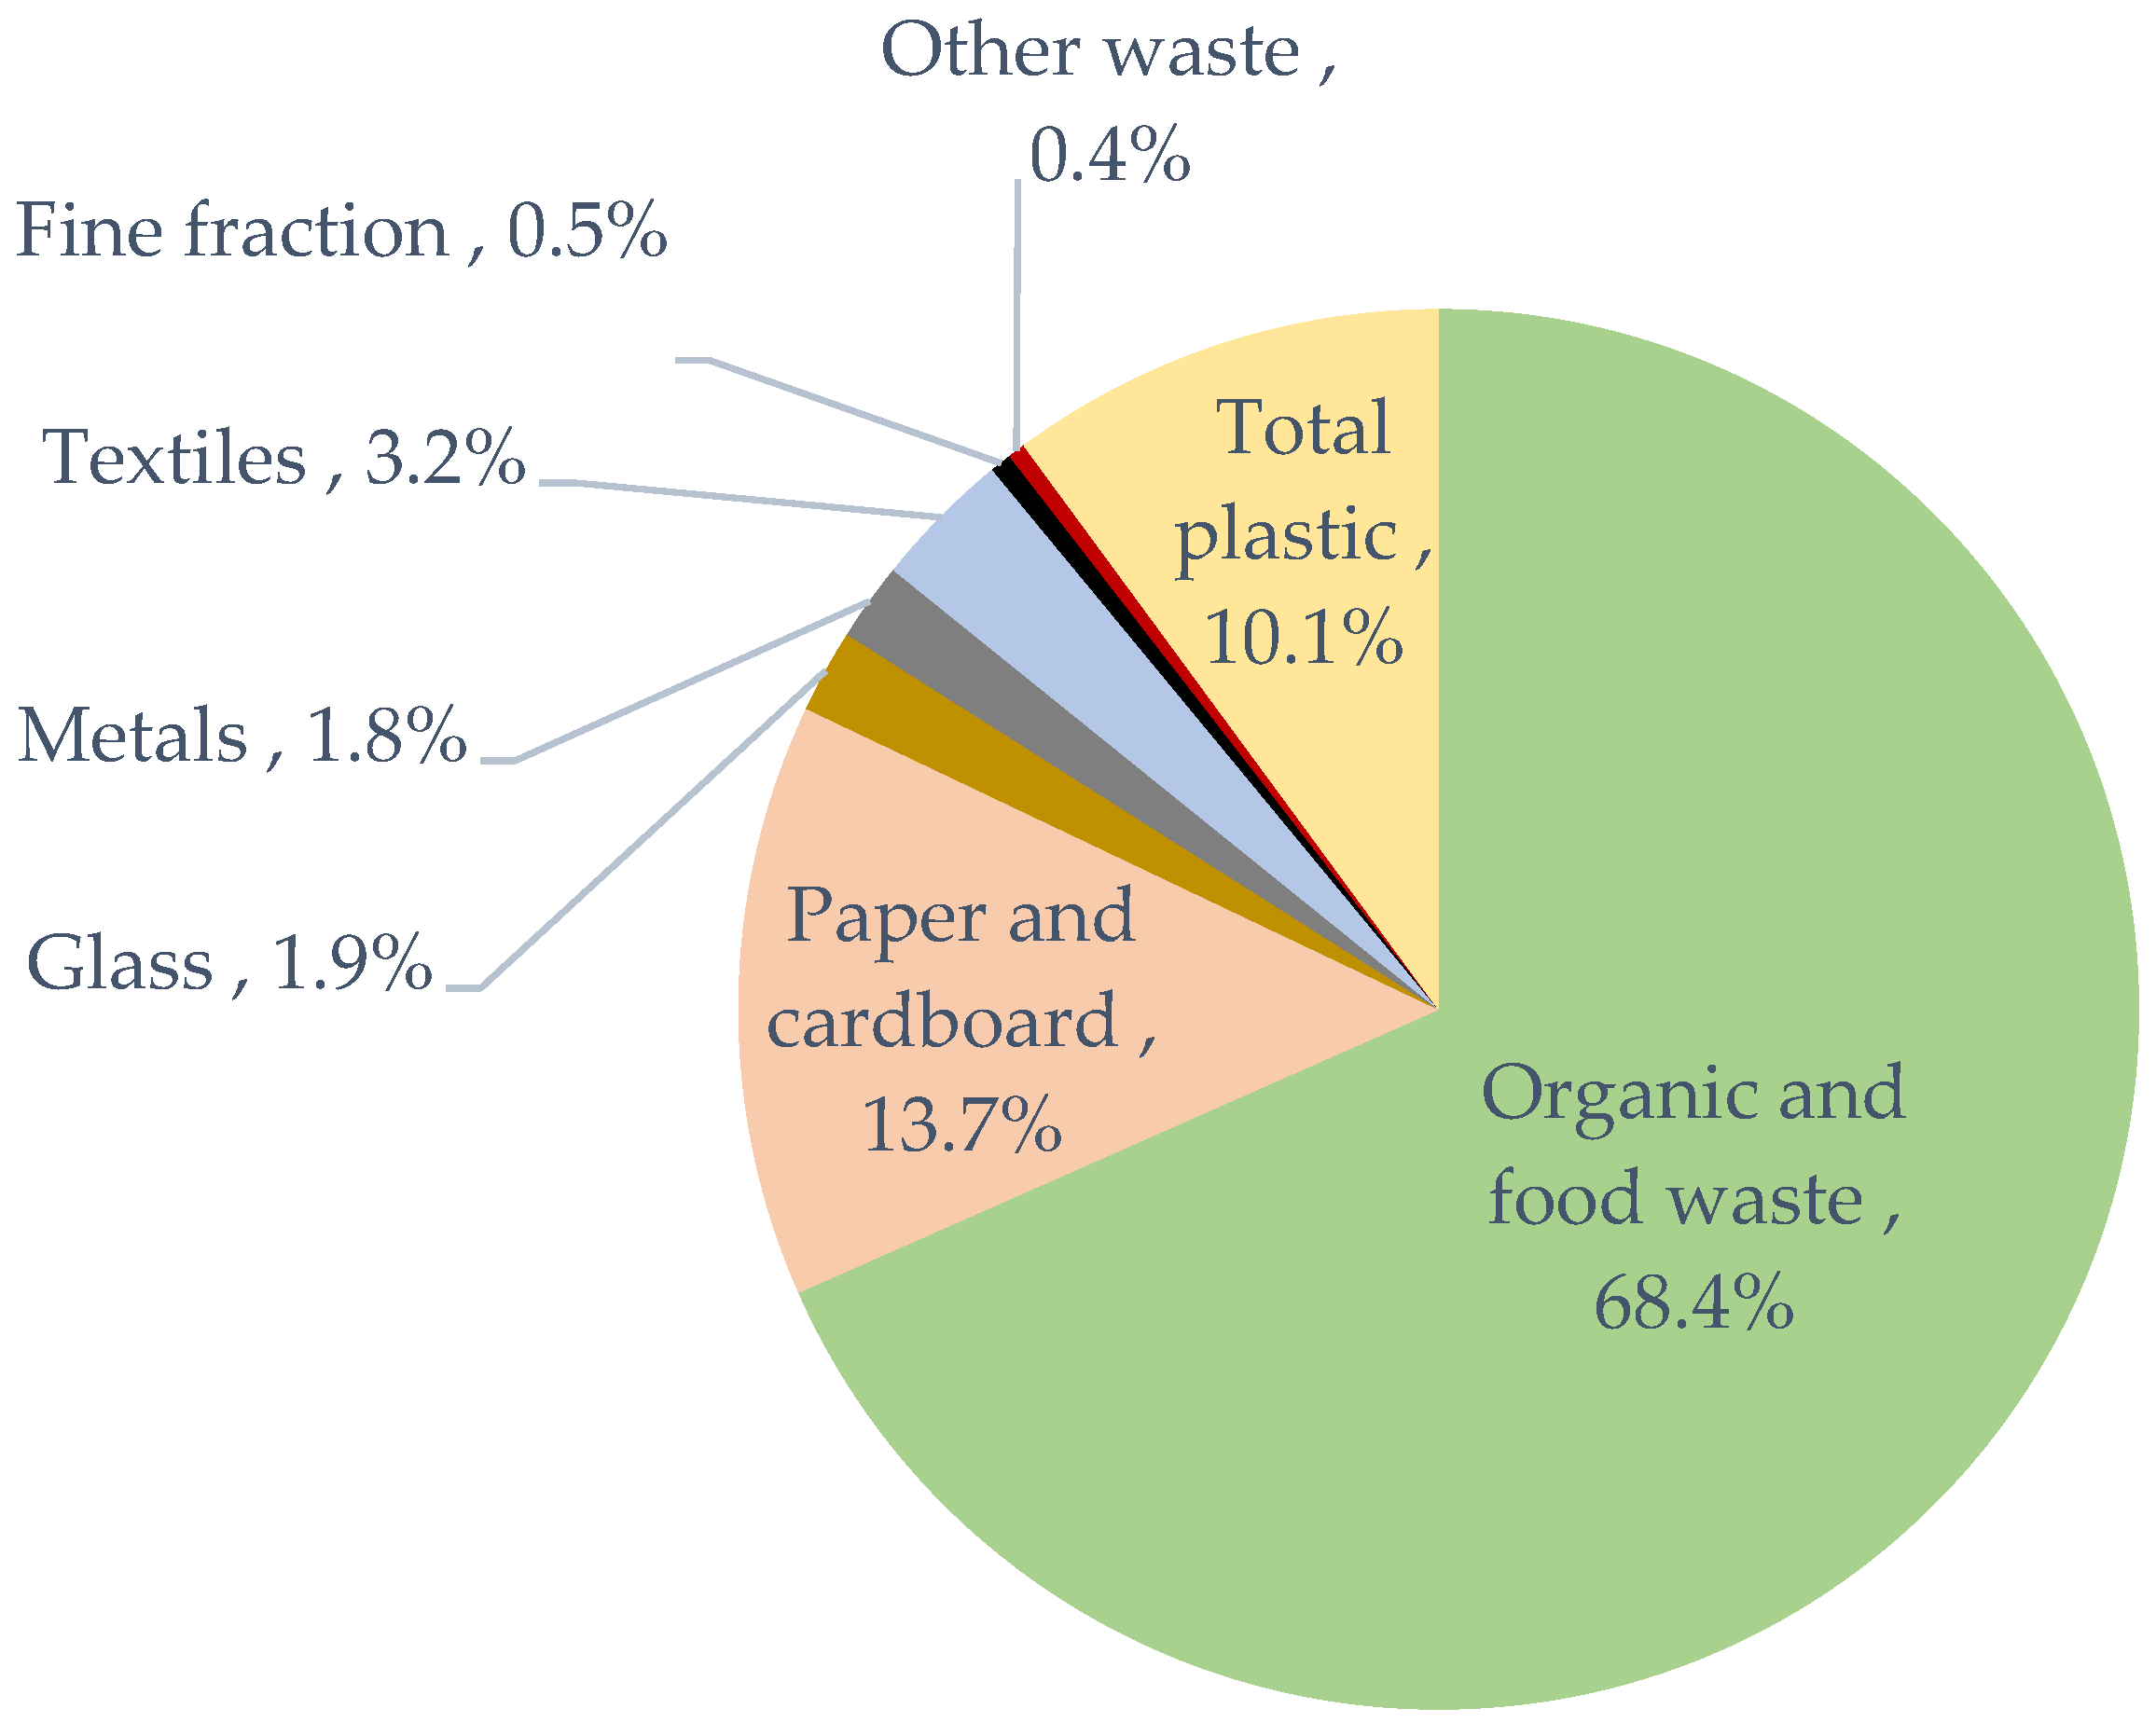
Figure 2 provides an overview of the composition of the municipal solid waste (MSW) in Nablus city, which represents the average percentage of the 60 analyzed samples. The fraction of bio- and organic waste is significant, representing about 68% of the total MSW. Generally, in developing countries, the organic waste signifies more than 50% of total waste composition, with a range that varies between 40% and 67% [5]. The second largest waste fraction in Nablus city was found to be the paper and cardboard fraction (13.6% of the total MSW), followed by plastics (10.1%), textiles (3.2%), glass (1.9%), metals (1.8%), fine fraction (0.5%), and other waste (0.3%). The recyclables (paper and cardboard, glass, metals, and plastics) amount to 27.4% of the generated MSW in Nablus city.
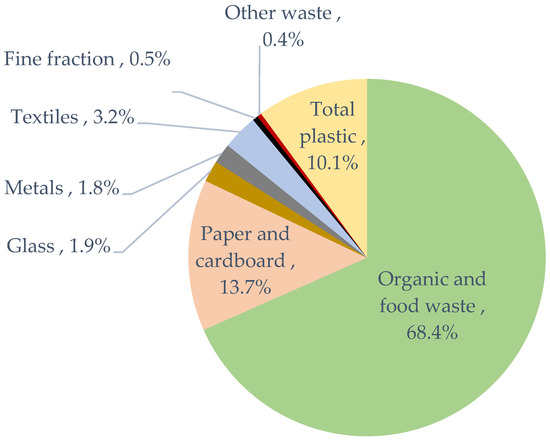
Figure 2.
Distribution of the primary MSW categories in Nablus city.
Although most of the waste in Palestine is recyclable, there are many obstacles to its recycling, such as the large distance between the source of recyclable waste and the recycling station, low value of recyclable material, uncertainty of recyclable material supply, and unreliable, unpredictable, or unstable markets for recyclables. Additionally, there are institutional constraints, such as ambiguity of roles/functions for institutions involved, lack of coordination among the relevant institutions, and the weak institutional capacity due to low priority given to the sector [24].
For the purposes of comparison of developing vs. developed countries, a composition of the MSW in Balakong city (Malaysia) and in Turku city (Finland) is documented in Table 2. The data emphasize that the MSW in developing countries is dominated by the organic fraction, with a lower portion of recyclables. The MSW composition in developing countries is constantly reported to be more than 40% of the total MSW [5,25]. Generally, there is a strong relationship between the amount and composition of the generated waste and the different consumption patterns of the population, which strongly depend on the economic situation. High-income countries produce comparatively less food and green waste (~32% of total MSW) and more dry recyclables (including metals, glass, plastics, cardboard, and paper), which account for 51% of the MSW stream. Low- and middle-income countries generate 57% and 53% organic waste, respectively, where an increased fraction of organic waste is associated with lower levels of economic development [26].
Table 2.
The percentage of components of SW in Balakong city (Malaysia) [27] and in Turku city (Finland) [28].
As indicated in Table 2, the plastic component is significantly higher in developed countries compared to developing countries (15.8% in Turku city in comparison to 10.3% in Balakong city). Our study shows a similar waste fraction distribution as was obtained in Balakong city [27], indicating the similarity of data in developing countries.
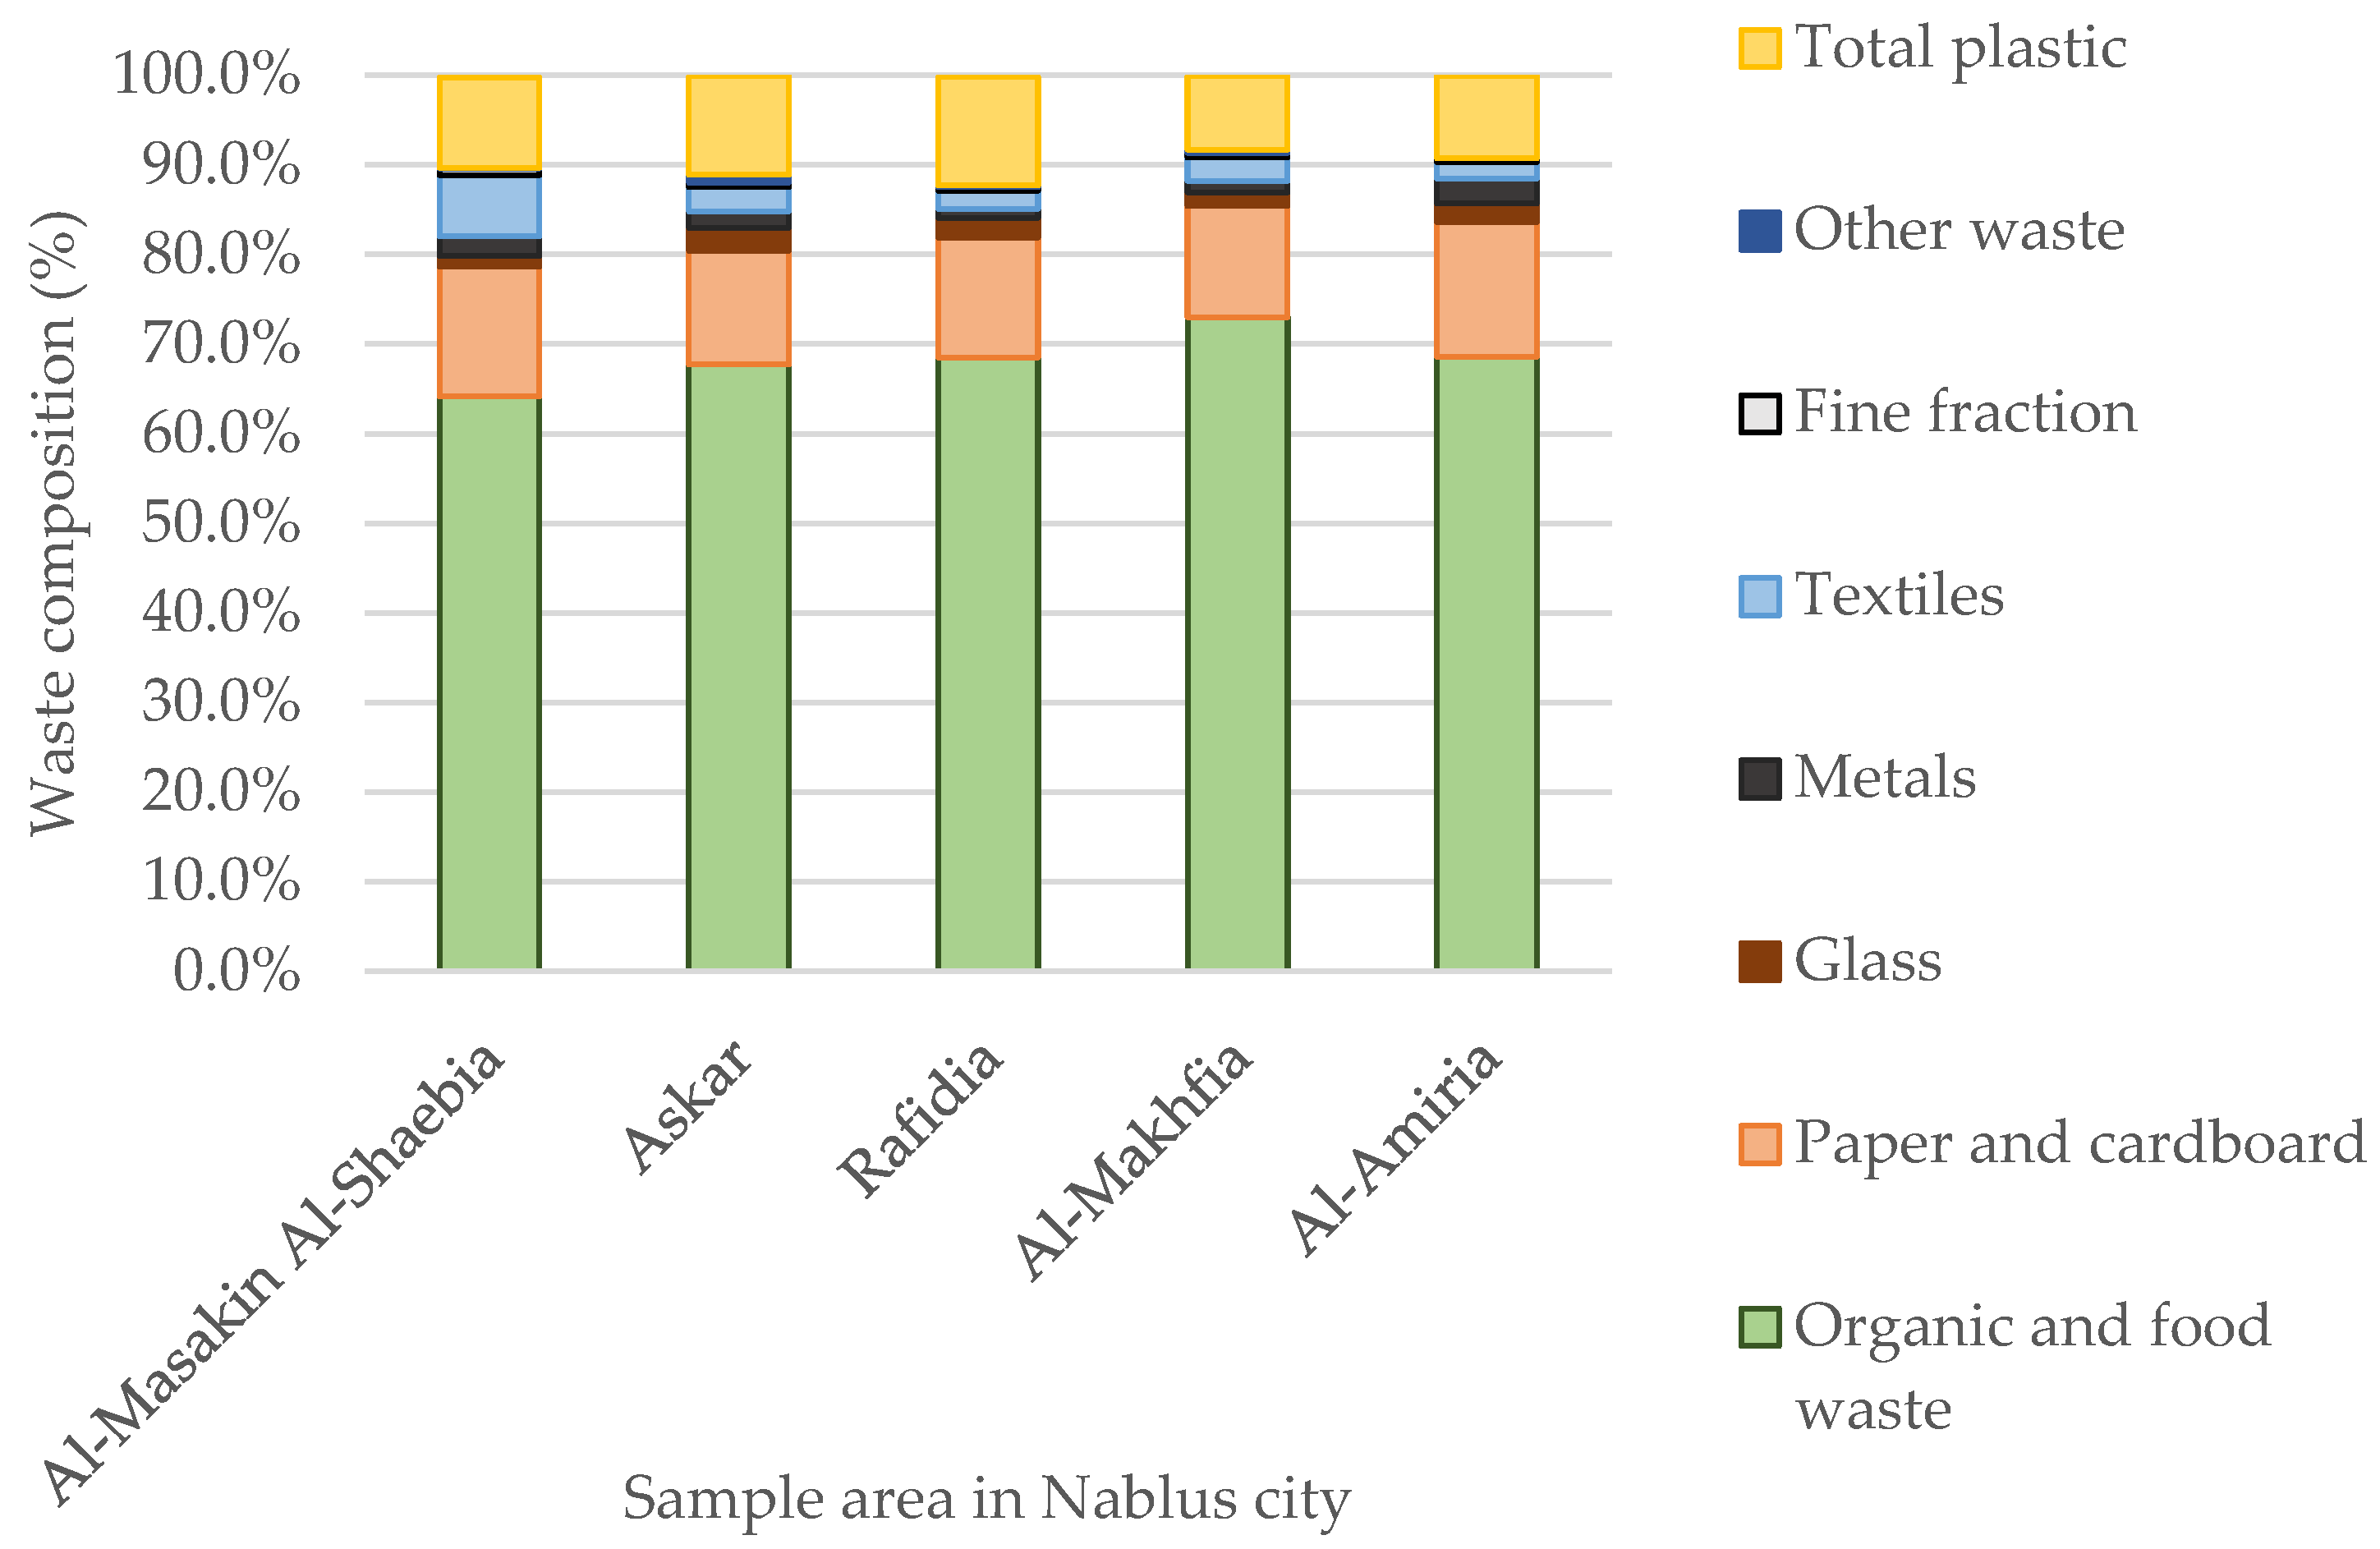
The composition of the MSW for each of the five districts in Nablus city is provided in Figure 3. The variation between the compositions in the different districts is shown to be minor. Al-Makhfia has the highest organic fraction in comparison to all other districts (73%). This could be explained by the fact that it is a densely populated district. Furthermore, Al-Makhfia has several restaurants and cafes serving the university students, which could be the reason for it producing a higher fraction of organic waste.

Figure 3.
The municipal solid waste composition (%) in five different districts in Nablus city.
3.2. Composition of the Plastic Waste Fraction in Nablus City
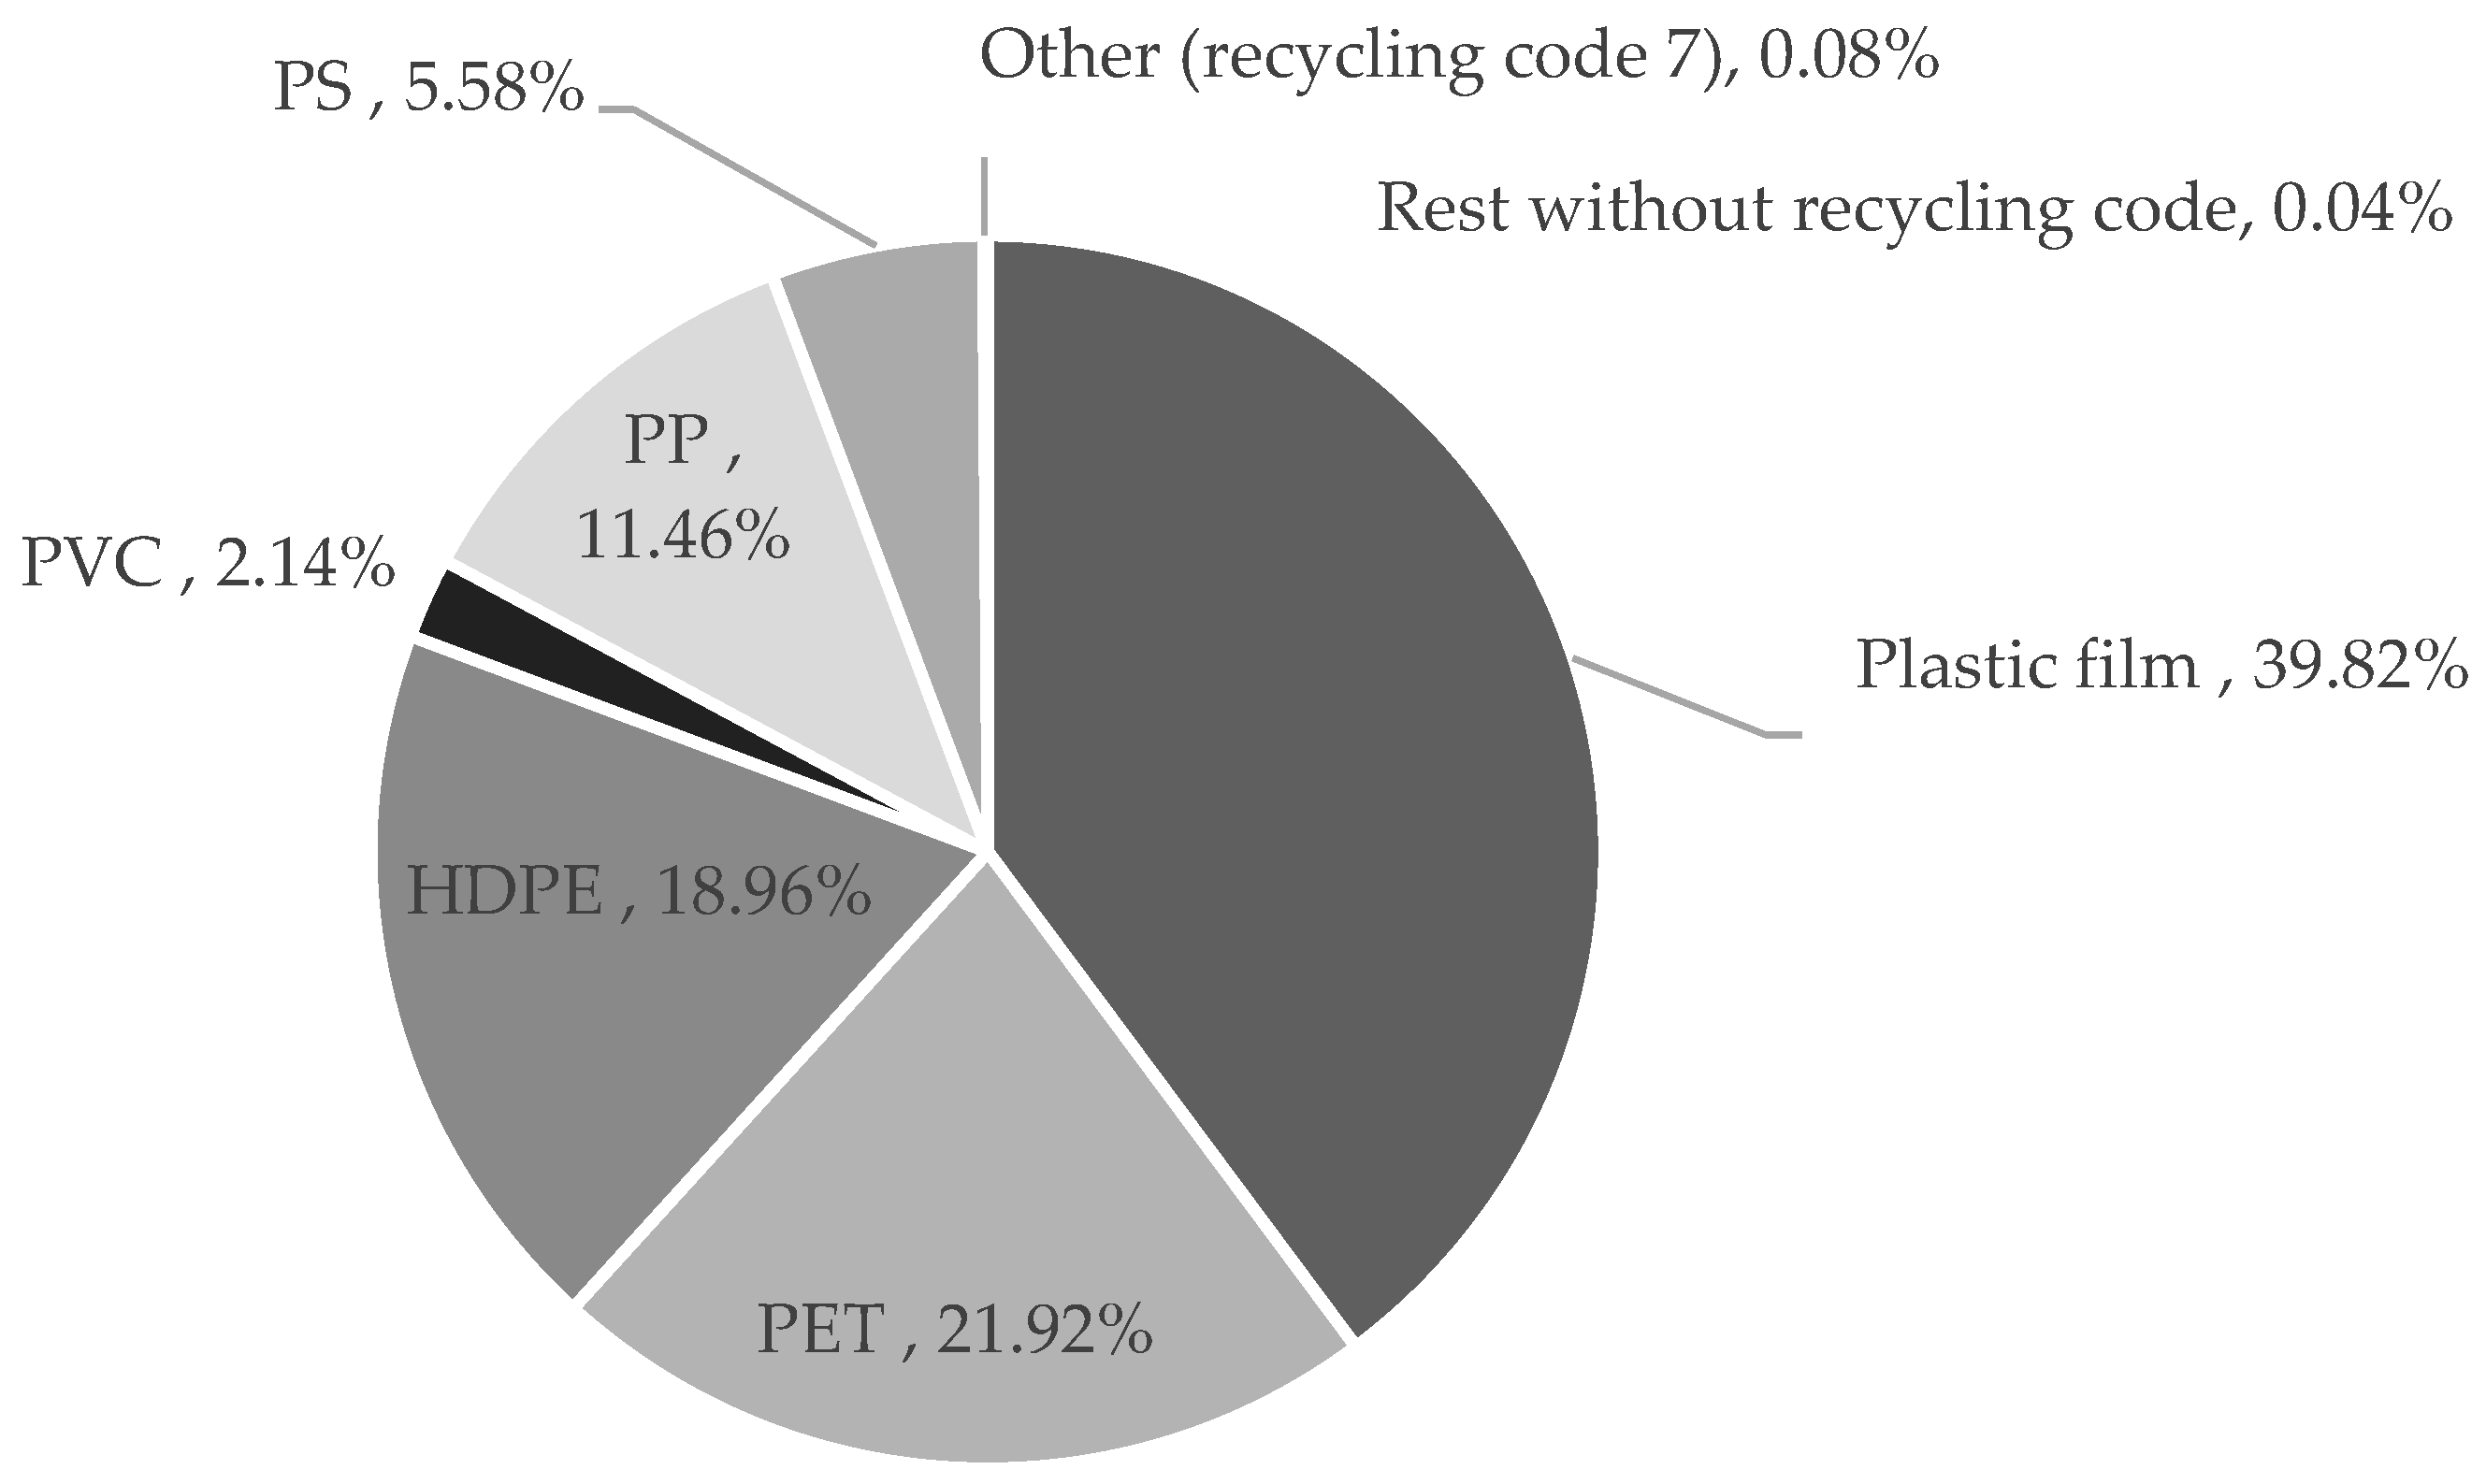
The highest percentage of the secondary categories of plastic waste in Nablus city was the LDPE in the form of films (39.8%). PET signified 21.9% of the total collected plastics, followed by HDPE (19.0%), PP (11.5%), and others (with a recycling code of 7) as shown in Figure 4. Data represent the average of the values of the five different districts in Nablus city.

Figure 4.
The average polymeric composition (%) of the plastic waste generated in Nablus city.
As indicated in Figure 3, the plastic fraction was the highest in Rafidia (12.1%) and the lowest in Al-Makhfia (8.2%), as a result of the lower commercial activities in Al-Makhfia. Furthermore, the polymeric composition of the plastic waste fraction varied from one district to another, as indicated in Figure 5.
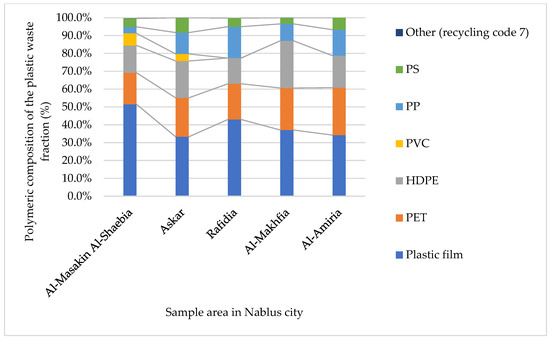
Figure 5.
The variation in the polymeric composition (%) of the plastic waste fraction in the five different districts in Nablus city.
Considering the polymers PET and HDPE (as they are technologically and economically the best recyclable polymers [14]), Al-Makhfia showed the highest generation of these two polymers (50% of the plastic waste fraction), followed by Al-Amiria (44% of the total plastic waste fraction). Al-Masakin Al-Shaebia showed the lowest generation of these two polymers (33%). The high compositions of PET and HDPE in Al-Makhfia and in Al-Amiria are due to their residential structures and the lower commercial activities, indicating higher consumption of household products (i.e. higher consumption of packaged products). Al-Masakin Al-Shaebia has a large commercial complex of restaurants and malls, in addition to the schools and the college of technology. Hence, the product consumption behavior is different, resulting in higher fractions of LDPE films (as shopping bags) and the presence of a PVC fraction, which could originate from the car repair shops in the area.
When analyzing the formats of the different polymeric products, PET was mainly found as PET water and juice bottles, while the HDPE was found in the form of detergents and shampoo packaging (rigid). Overall, most of the generated plastic waste originated from packaging material, except for the PVC fraction. There is a high dependency on PET disposable water bottles in the country. For example, in a study conducted by Abdah et al. (2020), it was found that 92.0% of Birzeit University students, Palestine, rely on bottled water as their main drinking water source [29].
3.3. Municipal Solid Waste and Plastic Waste Generation
The average monthly waste generation in Nablus was calculated using data from 2016 to 2022 obtained from the Nablus municipality (see Figure 6). Usually, the MSW is measured by weighing waste collection vehicles at the entrance to sanitary landfills before and after unloading. Data indicate that the highest amount of waste generation was 1.64 kg/capita/day in July, while the lowest amount was recorded in October to be 1.20 kg/capita/day. The average rate of waste production in Nablus city was calculated to be 1.40 kg/capita/day. The amount of solid waste varies clearly from day to day and from one season to another in the same city; in addition it varies between countries, as well as between neighboring regions and between different neighborhoods in the same city [26].
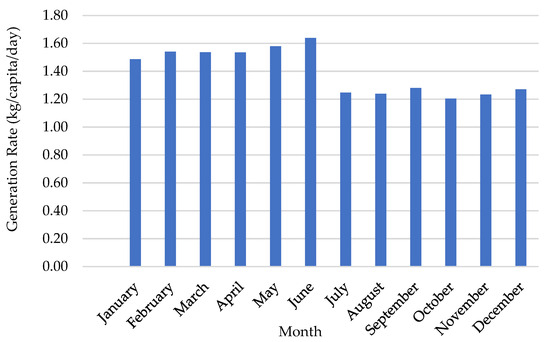
Figure 6.
Average monthly MSW generation rate in Nablus (kg/capita/day).
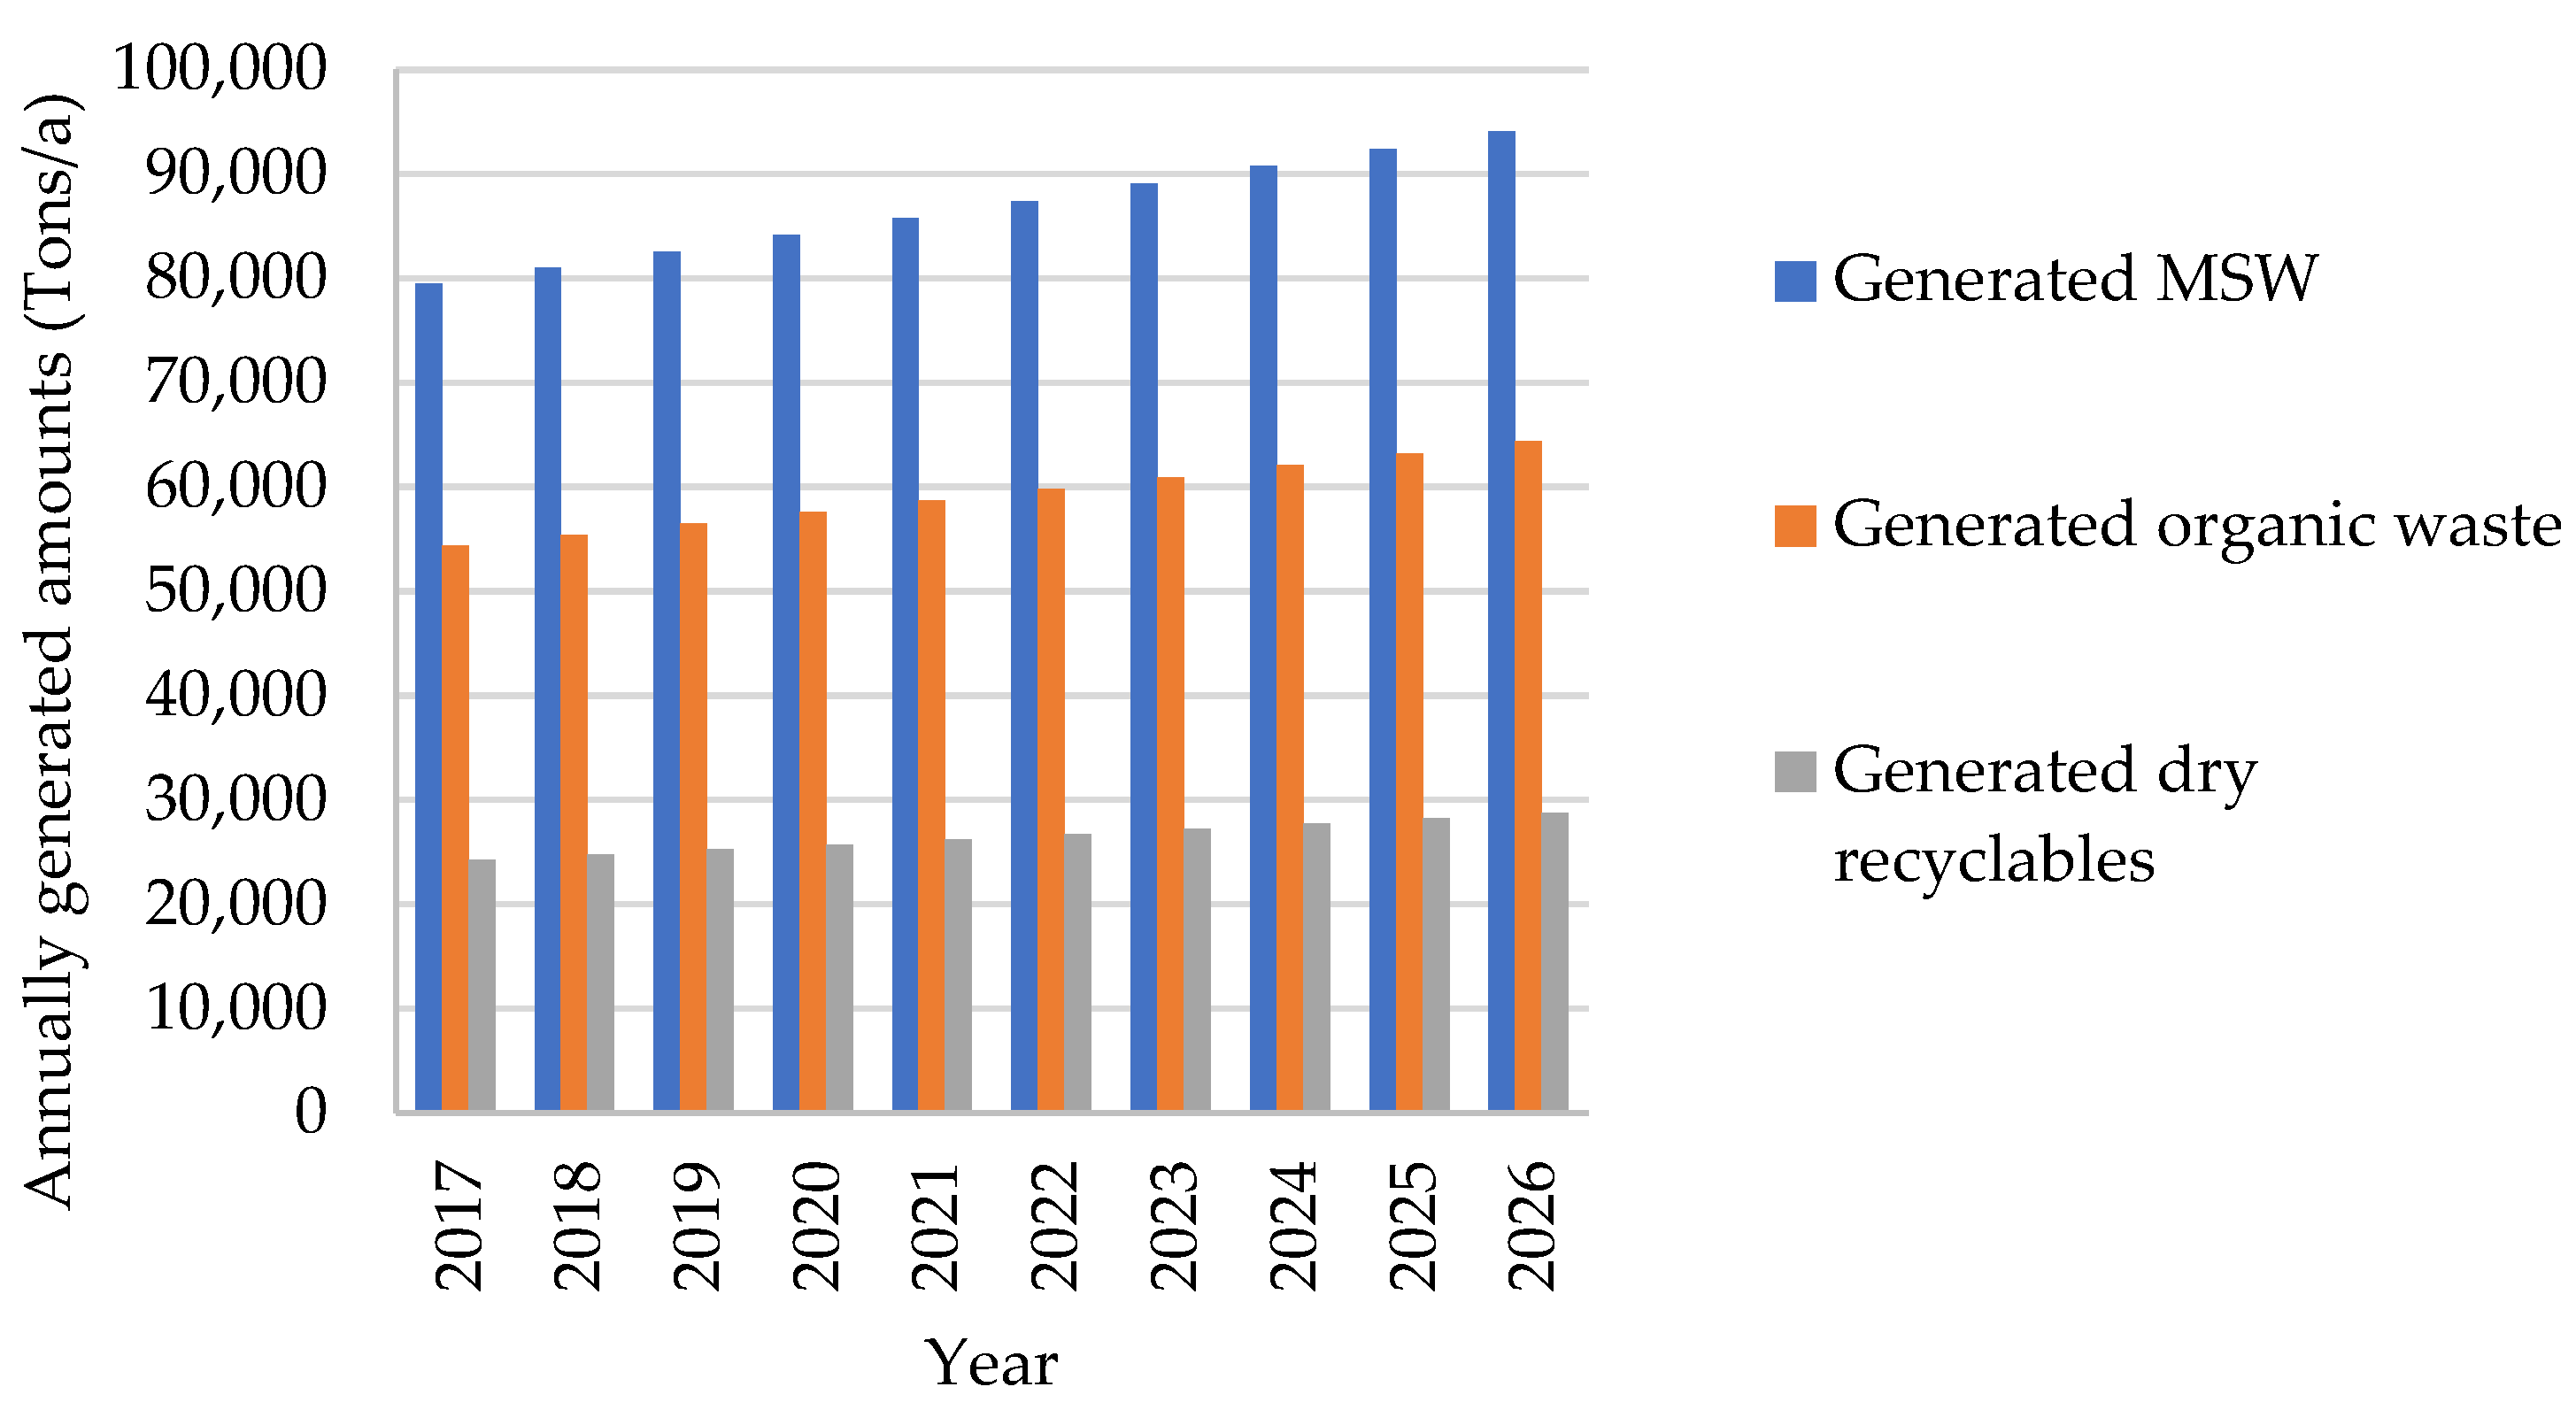
Using the average rate of waste production in Nablus (1.4 kg/capita/day) and the total population over the years 2017–2026 [15], the yearly generated MSW, organic waste, and recyclables could be calculated (see Figure 7). The potential of material recovery for recycling is indicated in Figure 7 (from a quantitative point of view), where the organic fraction can be used to produce energy and compost. On the other hand, the recyclables can be used for secondary material production to reduce the consumption of virgin raw materials.
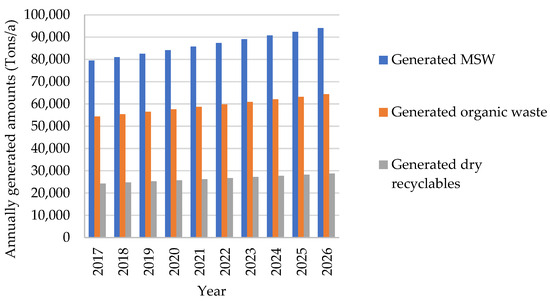
Figure 7.
The calculated annually generated MSW, organic waste and recyclables for years 2017–2026.
The average monthly MSW generation was used as the basis to calculate the average monthly MSW composition, using the waste composition in Figure 3. The monthly MSW composition (kg/capita/day) in Nablus is presented in Table 3.
Table 3.
The monthly generation rate of MSW components in Nablus (kg/capita/day).
The amounts of solid waste generated usually differ between urban and rural areas. In the state of Palestine, it is estimated that rural areas generate less waste (about 0.75 kg/capita/day) compared to urban areas like Ramallah or East Jerusalem, which produce about 1.0–2.0 kg/capita/day [30]. In urban centers, the quantities of solid waste generated are increasing, mainly due to the continuous increase in the population and the increase in the rate of waste generation per capita [26,31].
As per the calculated values, the generation of plastic waste varies between 0.122 kg/capita/day and 0.166 kg/capita/day, with a calculated daily average of 0.141 kg plastic waste generation per capita. A comparison with the average plastic waste generation rates in different countries is provided in Table 4, showing that Hong Kong and the USA are leading in the global plastic waste generation. This could be attributed to the massive usage of single-use plastics and the current lifestyle. In addition, these countries are industrial and their production styles potentially do not take into consideration minimizing the plastic waste volumes. As was estimated by the U.S. EPA, the MSW is comprised of 12.2% plastics (by mass), where plastics are the third-highest percentage of material (by mass) in MSW after paper and food waste [32]. Our study indicated a lower fraction of plastics (10.1%), yet similarly representing the third largest fraction of the MSW.
Table 4.
Plastic waste generation rate for various regions around the world.
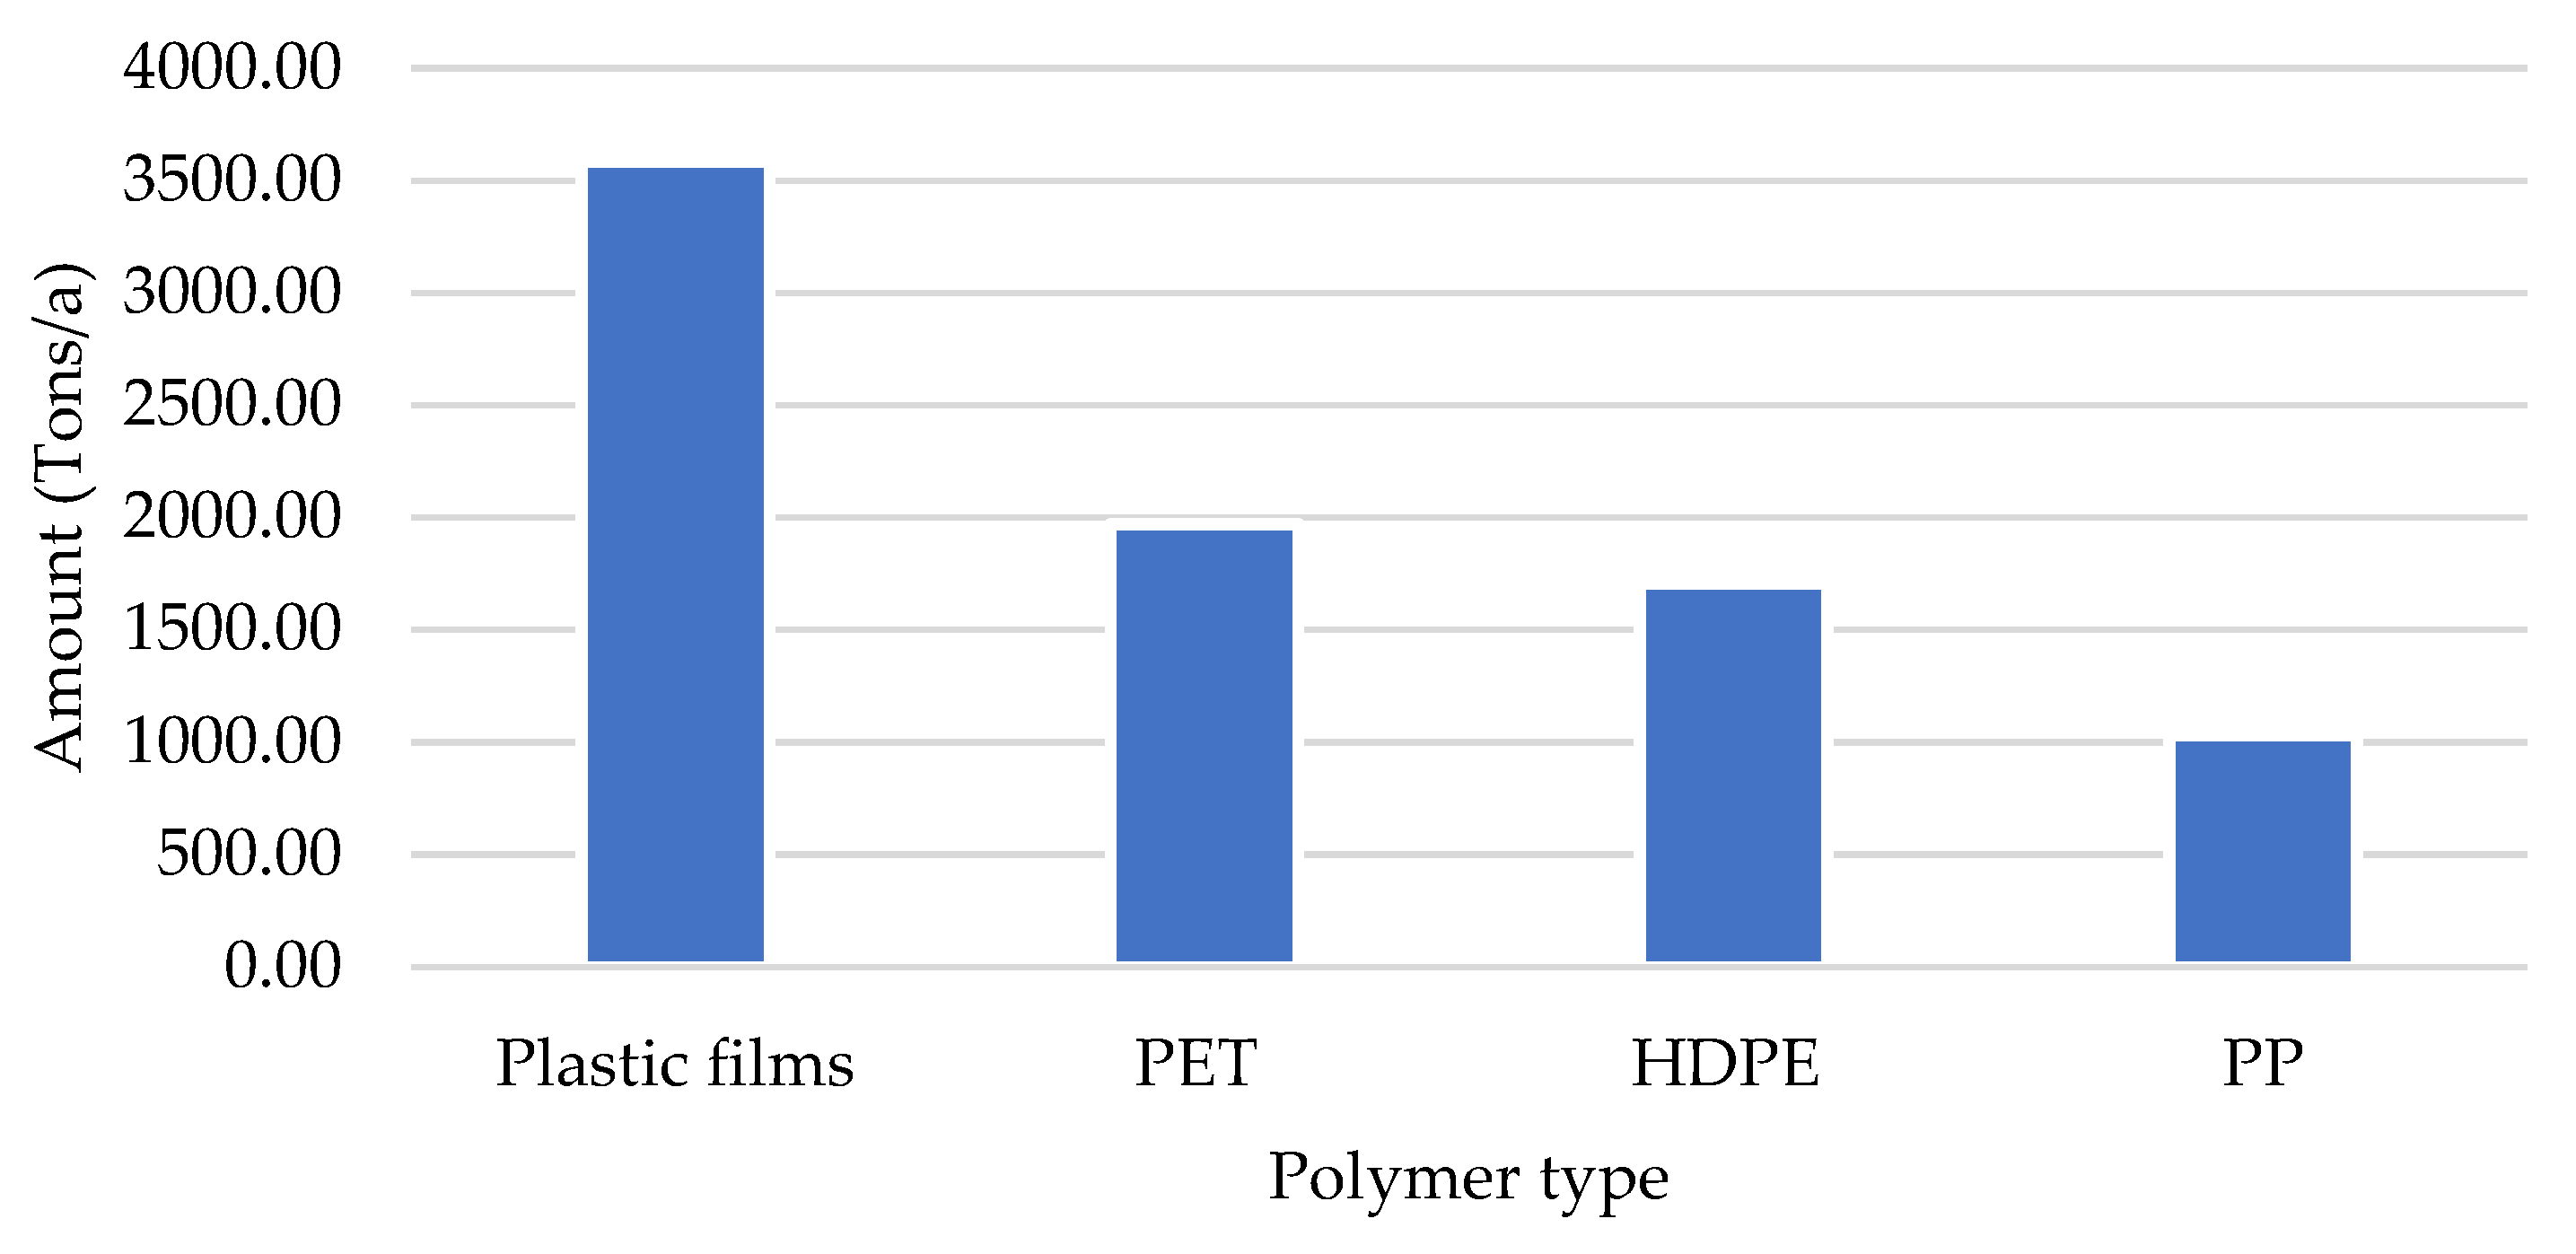
The characterization of the plastic waste fraction was used to calculate the amounts of different polymers that are generated in 2023 (see Figure 8). The aim was to check the recycling potential of this waste stream by focusing on the abundant polymer types as well as the recyclability of these plastics. Although plastic films represent the largest fraction of the collected plastics, films are often highly contaminated and complex for recycling [36]. On the other hand, the rigid containers of PET, HDPE and PP can be recycled using the state-of-the-art technologies [37,38,39]. As depicted in Figure 8, in 2023, there have been about 2000 tons PET, 1700 tons HDPE, and 1000 tons PP waste generated in Nablus city alone. If this is scaled up to include the surrounding big cities, even more significant amounts can be recovered for recycling. In Hebron (an industrial city in the state of Palestine that is 107 km away from Nablus), the recycling of post-industrial LDPE and HDPE waste is already practiced. Nonetheless, the recycling of post-consumer plastic waste is carried out only on a very small scale (by only one recycler in Hebron), where the material is retrieved from a nearby landfill and not directly from the collected waste (as per visits to local recyclers). At present, the post-consumer plastic waste stream is not yet exploited in a fashion of material recovery and recycling. From the models implemented in Germany, it seems PET bottle waste is a promising waste stream, which can return a high-quality material [40]. However, the waste collection system in the state of Palestine is primitive, not yet applying “separate collection at source” or return systems, resulting in highly contaminated fractions that are difficult to retrieve [14].
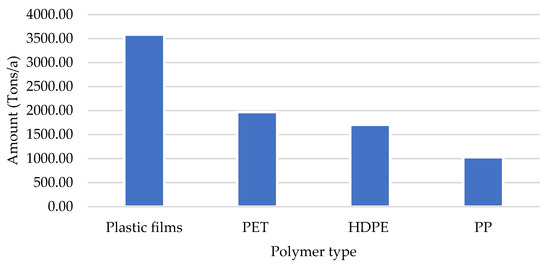
Figure 8.
The calculated generated plastic films, PET, HDPE, and PP waste in 2023.
4. A Case Study Assessing the Feasibility of MSW Recycling
The organic fraction represents the largest fraction in the collected MSW in Nablus (68%), followed by papers and cardboard (13.6%) and then plastics (10.1%). Given these data, we suggest separating the organic fraction at the source by implementing two different collection containers, one for organic waste and the other for solid recyclables. This will achieve two main aims:
- a.
- The recovery of the organic fraction, without contamination, to be used to produce high-value compost for agricultural activities in the country, which could help in replacing chemical fertilizers;
- b.
- Recovering paper and cardboard, plastics, metals, and glass in a state where they are easy to sort (automatically or manually) and recycle.
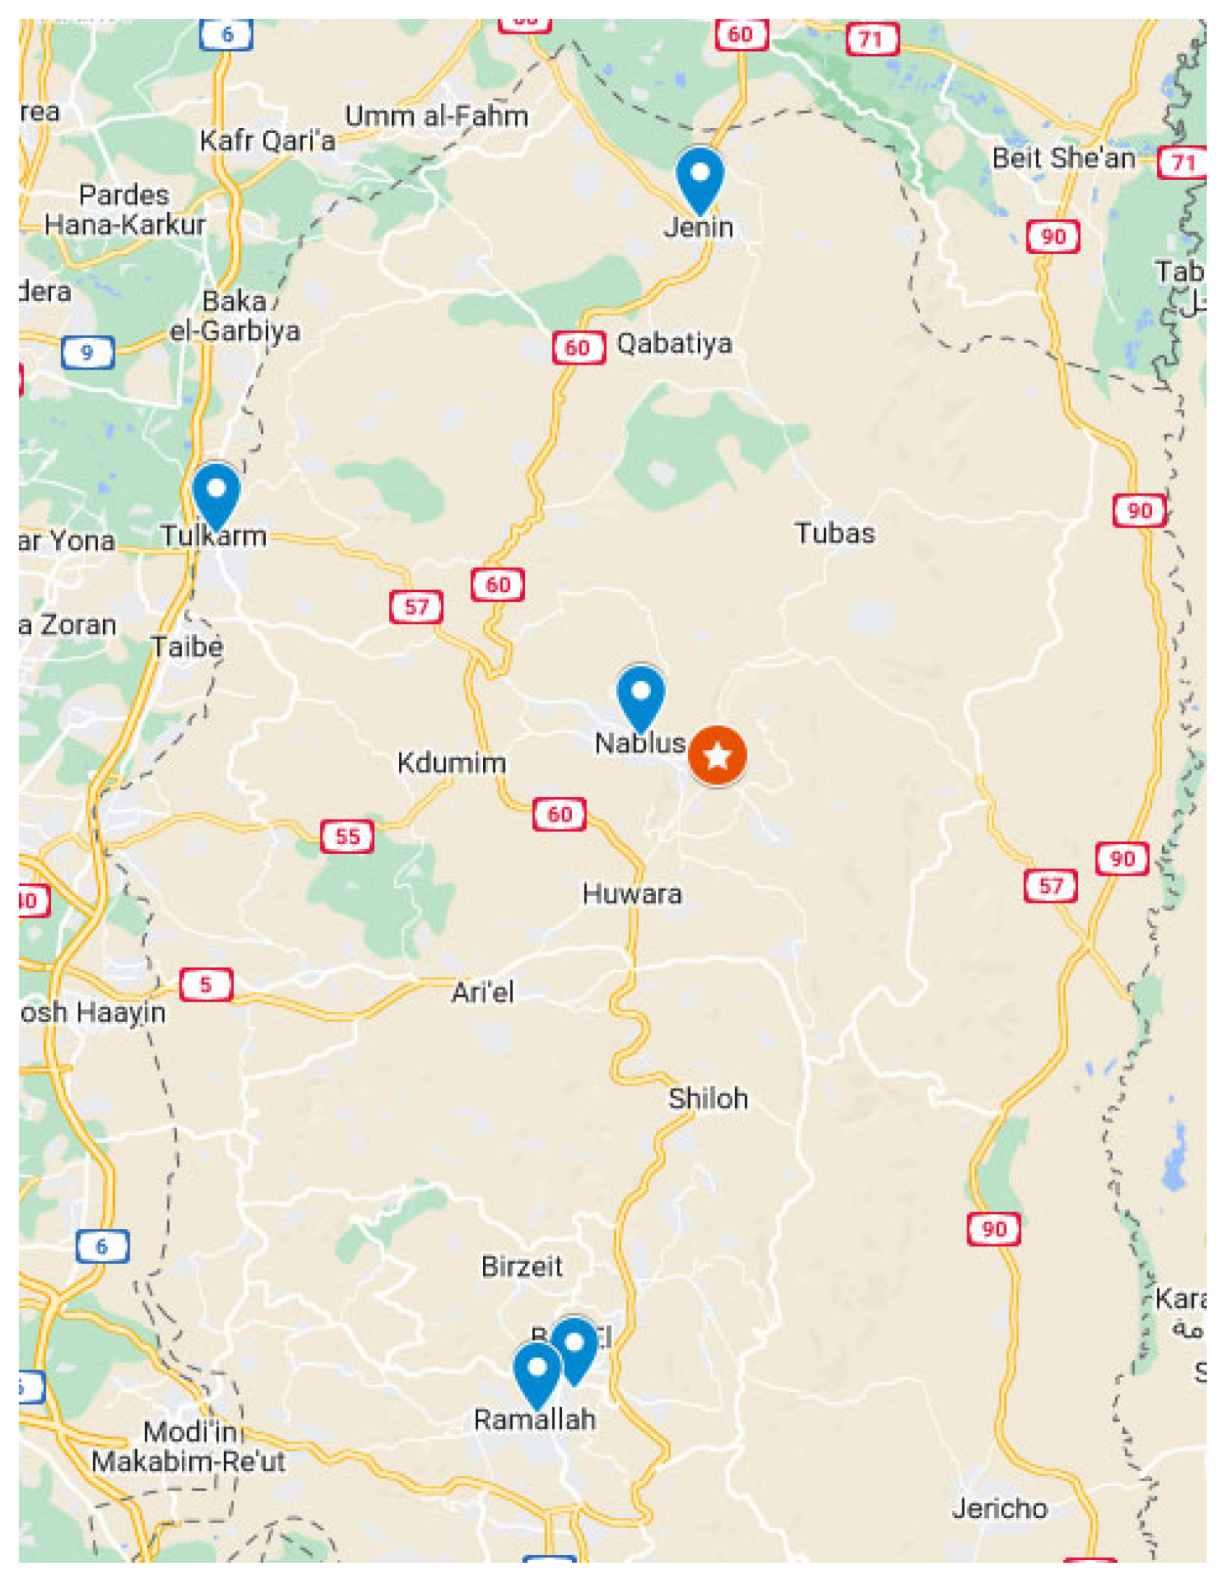
To propose a realistic plan for enhanced waste management, it was important to consider a region (represented with the biggest surrounding cities) and a point where the waste could be transferred to for end-of-life (EOL) treatment. The selected cities are located in the northern to middle part of the West Bank (Nablus, Ramallah, Al-Bireh, Jenin and Tulkarm), with distances to the collection point not exceeding 100 km (see Figure 9). The population was obtained for these specific cities and not for the surrounding towns, with the intention of having conservative data, to propose correct capacities for the treatment facilities. The population was retrieved from the Palestinian Central Bureau of Statistics for the year 2023 (see Table 5) [41]. The traveling distances were calculated between the location of the city center and the eastern side of Nablus, where an industrial zone exists.
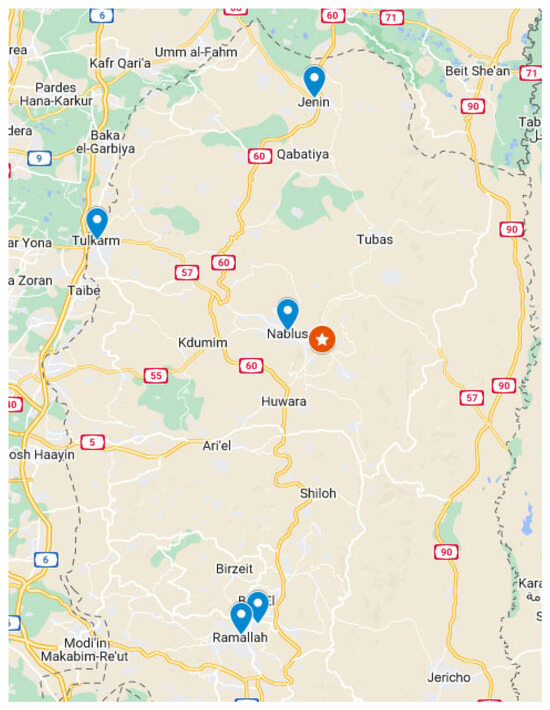
Figure 9.
The location of the main cities selected in the northern and middle region of the West Bank as a source to the separately collected waste for treatment.
Table 5.
Population sizes in the main cities in northern and mid region of the West Bank for the year 2023 and the distances to the industrial zone in Nablus.
As per the data, the total considered population is 397,091. As the average daily waste generation per capita is 1.399 kg (see Table 3), the yearly generated waste from these cities is calculated to be 202,768.6 tons, following Equation (1).
The yearly production of organic waste is calculated to be 138,693.7 tons (68% of the yearly generated MSW). Assuming that a correct collection of 50% of the organic fraction could be achieved, about 70,000 tons of organic waste could be sent for composting. As organic materials degrade during composting, both the mass and volume of the material would decrease due to the breakdown of structural organic components. In [42], reductions in mass during composting of windrows were calculated, with an average of 19.4%. Applying this factor, about 55,000 tons of compost could be produced.
The recyclables fraction in Nablus city was ascertained to be 27.4%. In this case study, 55,558 tons of recyclables are produced in 2023, among which 27,577 tons are paper and cardboard. The manufacturing of one ton of paper from recycled fiber is estimated to save approximately 17 trees, 3.3 cubic yards of landfill space, 360 gallons of water, 100 gallons of gasoline, 60 pounds of air pollutants, and 10,401 kW of electricity [43].
The dry recyclables (excluding paper and cardboard) have to be sent for material recovery facility to separate the polymers.
The plastic fraction was further characterized in this study to propose optimized solutions for its management. Recycling is the preferred option to treat plastic waste. However, when recycling is not the most sustainable option, energy recovery is the alternative [14]. There are no incineration plants to treat MSW in the state of Palestine. Hence, the plastic fraction is currently dumped or landfilled. If plastics are separately collected together with the dry recyclables, their sorting into the different polymer types would be possible and efficient. Based on the provided data, the total plastic waste generated from the target cities (mentioned in Table 5) will be about 20,480 tons, while the LDPE, PET, HDPE, and PP polymers will be produced in the amounts mentioned in Table 6. If losses of 40% during collection occur (assumption), then 60% of the generated plastic waste will be sent for polymer sorting. In the polymer sorting process, further losses will occur due to deficiencies with the state-of-the-art sorting technologies, as well as the complex designs of the materials [37,38,39,40]. In a study performed on the sorting efficiencies of the different polymers, the following sorting efficiencies were obtained: 72% for films, 84% for PET, 87% for HDPE, and 37% for PP [44]. Taking these values into consideration, the capacities of potential plastic waste recycling facilities can be estimated (~3500 tons for LDPE and ~2000 tons each for PET and HDPE).
Table 6.
Yearly generation of the different polymer types in tons from the case study cities.
The average recycling efficiencies of the LDPE films, PET bottles, and HDPE and PP rigid recycling processes were considered (values reported in Table 7 and based on a survey conducted reviewing various recycling facilities in Europe [44]). Generally, the sorting and recycling rates vary greatly because of the materials’ quality and the number, type, and sequence of technologies used.
Table 7.
Recycling rates for target polymers [44].
As was indicated by the plastic waste characterization conducted in this study, PET bottles and LDPE films are generated in significant amounts. Hence, from the proposed case study and applying the recovery rates and the average recycling rate, an annual production of 2500 tons of LDPE recyclates, 1800 tons of PET recyclates, and 1700 tons of HDPE recyclates could be achieved.
5. Conclusions
Through a detailed analysis of the MSW in Nablus city, this study has elucidated pathways to bolster the current waste management system and integrate the principles of a circular economy. The analysis was based on samples collected from five different districts, ensuring a comprehensive and representative sample.
The organic waste fraction ranged between 64.2% and 73.0% of the MSW (by mass), indicating a significant fraction. The second largest fraction is paper and cardboard (ranging between 12.4% and 15.0%), followed by plastics (ranging between 8.2% and 12.1%). To have a waste management system that is able to minimize landfilled waste and recover resources, the recyclable waste should be efficiently sorted further. The organic waste fraction can be recycled through material recovery and converted into compost used as organic fertilizer. Meanwhile, inorganic waste can be utilized through material recovery and recycling (in a circular economy). Hence, we propose sorting the organic waste at the source by implementing a separate collection container for the organic waste fraction.
Furthermore, the plastic waste fraction was a focus of this study, which was further characterized into the different polymer types and formats. According to the results, the most dominant polymeric types and formats are LDPE films, PET bottles, HDPE rigid, and PP rigid, collectively representing 92.2% of the plastic waste fraction. Hence, we suggest sorting and recycling these fractions.
Based on the outcomes of the waste characterization, a case study was developed to calculate the capacities needed to treat the potentially recyclable waste. As per the proposed model, where conservative collection and sorting efficiencies were considered, about 55,000 tons of compost, 2500 tons of LDPE recyclates, 1800 tons of PET recyclates, and 1700 tons of HDPE recyclates could be produced, where significant amounts are generated within transportable distances.
Additionally, further fractions (paper, cardboard, metals, and glass) could be targeted for recycling. Nonetheless, these fractions were not a focus of this study.
In essence, promoting solid waste recycling is more than just an environmental necessity; it also holds economic, social, and health implications. While this study provides a roadmap for Palestine, its insights, methodologies, and recommendations are poised to benefit regions globally, especially those in the initial stages of establishing or refining their waste management frameworks.
Author Contributions
Methodology, I.A.A.-K. and A.A.; Validation, A.A.; Formal analysis, S.Y.A.A.; Investigation, I.A.A.-K. and A.A.D.; Resources, J.G.; Writing—original draft, J.G., A.A.D. and S.Y.A.A.; Writing—review & editing, I.A.A.-K., K.K. and A.A.; Supervision, I.A.A.-K., K.K. and A.A.; Funding acquisition, A.A. All authors have read and agreed to the published version of the manuscript.
Funding
This research was funded by the UN Environment Programme (UNEP), the Secretariat of the Basel Convention (SBC), agreement number BRS-SSFA-2145.
Data Availability Statement
The generated data were part of the project Plastic Waste Separation in Palestinian Territories (PlaSePal), conducted in the timeframe 2022–2023 and funded by the UNEP. The generated data are provided in reports submitted to the funding entity, yet not openly published. This publication is a representation of the generated data.
Acknowledgments
The authors acknowledge the generous funding from the UNEP, which allowed for the activities of this project. Additionally, the authors would like to thank the Nablus municipality for allowing a separate collection system to be piloted in Nablus city.
Conflicts of Interest
The authors declare no conflict of interest. The funders had no role in the design of the study; in the collection, analyses, or interpretation of data; in the writing of the manuscript; or in the decision to publish the results.
References
- Torkayesh, A.E.; Rajaeifar, M.A.; Rostom, M.; Malmir, B.; Yazdani, M.; Suh, S.; Heidrich, O. Integrating life cycle assessment and multi criteria decision making for sustainable waste management: Key issues and recommendations for future studies. Renew. Sustain. Energy Rev. 2022, 168, 112819. [Google Scholar] [CrossRef]
- Miezah, K.; Obiri-Danso, K.; Kádár, Z.; Fei-Baffoe, B.; Mensah, M.Y. Municipal solid waste characterization and quantification as a measure towards effective waste management in Ghana. Waste Manag. 2015, 46, 15–27. [Google Scholar] [CrossRef] [PubMed]
- Okot-Okumu, J. Solid waste management in African cities–East Africa. Waste Manag. Integr. Vis. 2012, 1–20. [Google Scholar]
- Awasthi, M.K.; Zhao, J.; Soundari, P.G.; Kumar, S.; Chen, H.; Awasthi, S.K.; Duan, Y.; Liu, T.; Pandey, A.; Zhang, Z. Sustainable management of solid waste. In Sustainable Resource Recovery and Zero Waste Approaches; Elsevier: Amsterdam, The Netherlands, 2019; pp. 79–99. [Google Scholar]
- Khan, I.; Chowdhury, S.; Techato, K. Waste to energy in developing countries—A rapid review: Opportunities, challenges, and policies in selected countries of sub-saharan Africa and south asia towards sustainability. Sustainability 2022, 14, 3740. [Google Scholar] [CrossRef]
- Batista, M.; Caiado, R.G.G.; Quelhas, O.L.G.; Lima, G.B.A.; Leal Filho, W.; Yparraguirre, I.T.R. A framework for sustainable and integrated municipal solid waste management: Barriers and critical factors to developing countries. J. Clean. Prod. 2021, 312, 127516. [Google Scholar] [CrossRef]
- Gentil, E.; Clavreul, J.; Christensen, T.H. Global warming factor of municipal solid waste management in Europe. Waste Manag. Res. 2009, 27, 850–860. [Google Scholar] [CrossRef]
- Shapiro-Bengtsen, S.; Andersen, F.M.; Münster, M.; Zou, L. Municipal solid waste available to the Chinese energy sector–Provincial projections to 2050. Waste Manag. 2020, 112, 52–65. [Google Scholar] [CrossRef]
- Annepu, R.K. Sustainable solid waste management in India. Columbia Univ. N. Y. 2012, 2, 1–89. [Google Scholar]
- Hussain, C.M.; Paulraj, M.S.; Nuzhat, S. Source Reduction and Waste Minimization; Elsevier: Amsterdam, The Netherlands, 2021; ISBN 012824321X. [Google Scholar]
- Mbue, I.N.; Bitondo, D.; Azibo, B.R. Municipal solid waste generation, composition, and management in the Douala municipality, Cameroon. J. Environ. Waste Manag. 2015, 2, 91–101. [Google Scholar]
- Sharma, B.; Vaish, B.; Monika; Singh, U.K.; Singh, P.; Singh, R.P. Recycling of Organic Wastes in Agriculture: An Environmental Perspective. Int. J. Environ. Res. 2019, 13, 409–429. [Google Scholar] [CrossRef]
- Izquierdo-Horna, L.; Kahhat, R.; Vázquez-Rowe, I. Reviewing the influence of sociocultural, environmental and economic variables to forecast municipal solid waste (MSW) generation. Sustain. Prod. Consum. 2022, 33, 809–819. [Google Scholar] [CrossRef]
- Alassali, A.; Picuno, C.; Chong, Z.K.; Guo, J.; Maletz, R.; Kuchta, K. Towards higher quality of recycled plastics: Limitations from the material’s perspective. Sustainability 2021, 13, 13266. [Google Scholar] [CrossRef]
- Horodytska, O.; Cabanes, A.; Fullana, A. Plastic waste management: Current status and weaknesses. In Plastics in the Aquatic Environment-Part I: Current Status and Challenges; Springer: Berlin/Heidelberg, Germany, 2019; pp. 289–306. [Google Scholar]
- Browning, S.; Beymer-Farris, B.; Seay, J.R. Addressing the challenges associated with plastic waste disposal and management in developing countries. Curr. Opin. Chem. Eng. 2021, 32, 100682. [Google Scholar] [CrossRef]
- Atallah, N. Palestine: Solid Waste Management under Occupation; The Heinrich-B€ oll-Stiftung in a nutshell: Berlin, Germany, 2020. [Google Scholar]
- Al-Khateeb, A.J.; Al-Sari, M.I.; Al-Khatib, I.A.; Anayah, F. Factors affecting the sustainability of solid waste management system—The case of Palestine. Environ. Monit. Assess. 2017, 189, 1–12. [Google Scholar] [CrossRef] [PubMed]
- Press Release by Palestinian Central Bureau of Statistics (PCBS) and Environment Quality Authority on World Environment Day under the theme ‘Beat Plastic Pollution’. Available online: https://www.pcbs.gov.ps/portals/_pcbs/PressRelease/Press_En_WldEnvDay2023E.pdf (accessed on 20 September 2023).
- Country Coordinate. GPS Coordinate of Nablus, Palestine: Retrieved on 21st of August 2023. 2023. Available online: https://www.countrycoordinate.com/city-nablus-palestine/ (accessed on 21 August 2023).
- Palestinian Central Bureau of Statistics. Projected Mid-Year Population for Nablus Governorate by Locality 2017–2026. Available online: https://pcbs.gov.ps/statisticsIndicatorsTables.aspx?lang=en&table_id=698 (accessed on 26 August 2023).
- Verma, A.; Alok, K.; Singh, N.B. Application of multi linear model for forecasting municipal solid waste generation in Lucknow City: A case study. Curr. World Environ. 2019, 14, 421. [Google Scholar] [CrossRef]
- Al-Khatib, I.A.; Monou, M.; Zahra, A.S.F.A.; Shaheen, H.Q.; Kassinos, D. Solid waste characterization, quantification and management practices in developing countries. A case study: Nablus district–Palestine. J. Environ. Manag. 2010, 91, 1131–1138. [Google Scholar] [CrossRef]
- The World Bank. Comprehensive Assessment with Integrated Roadmap for Sustainable Solid Waste Management for West Bank and Gaza, Palestine; The World Bank: Washington, DC, USA, 2023. [Google Scholar]
- Mohee, R.; Mauthoor, S.; Bundhoo, Z.M.A.; Somaroo, G.; Soobhany, N.; Gunasee, S. Current status of solid waste management in small island developing states: A review. Waste Manag. 2015, 43, 539–549. [Google Scholar] [CrossRef]
- Kaza, S.; Yao, L.; Bhada-Tata, P.; van Woerden, F. What a Waste 2.0: A Global Snapshot of Solid Waste Management to 2050; World Bank Publications: Washington, DC, USA, 2018; ISBN 1464813477. [Google Scholar]
- Samah, M.A.A.; Manaf, L.A.; Ahsan, A.; Sulaiman, W.N.A.; Agamuthu, P.; D’Silva, J.L. Household Solid Waste Composition in Balakong City, Malaysia: Trend and Management. Pol. J. Environ. Stud. 2013, 22, 1807–1816. [Google Scholar]
- Liikanen, M.; Sahimaa, O.; Hupponen, M.; Havukainen, J.; Sorvari, J.; Horttanainen, M. Updating and testing of a Finnish method for mixed municipal solid waste composition studies. Waste Manag. 2016, 52, 25–33. [Google Scholar] [CrossRef]
- Abdah, B.; Al-Khatib, I.A.; Khader, A.I. Birzeit University students’ perception of bottled water available in the west bank market. J. Environ. Public Health 2020, 2020, 5986340. [Google Scholar] [CrossRef]
- GIZ-SWEEPNET. Country Report on the Solid Waste Management in Occupied Palestinian Territories. 2014. Available online: https://www.ommar.ps/wp-content/uploads/2020/05/Country-report-on-the-solid-waste-management.pdf (accessed on 8 June 2022).
- Voukkali, I.; Papamichael, I.; Loizia, P.; Zorpas, A.A. Urbanization and solid waste production: Prospects and challenges. Environ. Sci. Pollut. Res. 2023, 1–12. [Google Scholar] [CrossRef] [PubMed]
- National Academies of Sciences. Reckoning with the US Role in Global Ocean Plastic Waste; The National Academies Press: Washington, DC, USA, 2022; ISBN 0309458854. [Google Scholar] [CrossRef]
- Kumar, A.; Samadder, S.R.; Kumar, N.; Singh, C. Estimation of the generation rate of different types of plastic wastes and possible revenue recovery from informal recycling. Waste Manag. 2018, 79, 781–790. [Google Scholar] [CrossRef] [PubMed]
- Ritchie, H.; Roser, M. Plastic Pollution. Our World Data. 2018. Available online: https://ourworldindata.org/plastic-pollution (accessed on 11 September 2023).
- Eurostat. Generation of Plastic Packaging Waste per Capita. (online Data Code: CEI_PC050). Available online: https://ec.europa.eu/eurostat/databrowser/view/cei_pc050/default/table?lang=en (accessed on 23 August 2023).
- Guo, J.; Luo, C.; Wittkowski, C.; Fehr, I.; Chong, Z.; Kitzberger, M.; Alassali, A.; Zhao, X.; Leineweber, R.; Feng, Y. Screening the Impact of Surfactants and Reaction Conditions on the De-Inkability of Different Printing Ink Systems for Plastic Packaging. Polymers 2023, 15, 2220. [Google Scholar] [CrossRef]
- De Mello Soares, C.T.; Ek, M.; Östmark, E.; Gällstedt, M.; Karlsson, S. Recycling of multi-material multilayer plastic packaging: Current trends and future scenarios. Resour. Conserv. Recycl. 2022, 176, 105905. [Google Scholar] [CrossRef]
- Roosen, M.; Mys, N.; Kleinhans, K.; Lase, I.S.; Huysveld, S.; Brouwer, M.; van Velzen, E.U.T.; Van Geem, K.M.; Dewulf, J.; Ragaert, K.; et al. Expanding the collection portfolio of plastic packaging: Impact on quantity and quality of sorted plastic waste fractions. Resour. Conserv. Recycl. 2022, 178, 106025. [Google Scholar] [CrossRef]
- Cimpan, C.; Bjelle, E.L.; Strømman, A.H. Plastic packaging flows in Europe: A hybrid input-output approach. J. Ind. Ecol. 2021, 25, 1572–1587. [Google Scholar] [CrossRef]
- Picuno, C. Post-Consumer Plastic Packaging Sector and Its Path for Sustainable Development in Germany. Doctoral Thesis, Technische Universität Hamburg, Hamburg, Germany, 2021. [Google Scholar]
- Palestinian Central Bureau of Statistics. Annual Statistics. Available online: https://www.pcbs.gov.ps/site/803/default.aspx (accessed on 14 September 2023).
- Breitenbeck, G.A.; Schellinger, D. Calculating the reduction in material mass and volume during composting. Compost. Sci. Util. 2004, 12, 365–371. [Google Scholar] [CrossRef]
- Rahman, M.O.; Hussain, A.; Basri, H. A critical review on waste paper sorting techniques. Int. J. Environ. Sci. Technol. 2014, 11, 551–564. [Google Scholar] [CrossRef]
- Antonopoulos, I.; Faraca, G.; Tonini, D. Recycling of post-consumer plastic packaging waste in the EU: Recovery rates, material flows, and barriers. Waste Manag. 2021, 126, 694–705. [Google Scholar] [CrossRef]


Disclaimer/Publisher’s Note: The statements, opinions and data contained in all publications are solely those of the individual author(s) and contributor(s) and not of MDPI and/or the editor(s). MDPI and/or the editor(s) disclaim responsibility for any injury to people or property resulting from any ideas, methods, instructions or products referred to in the content. |
© 2023 by the authors. Licensee MDPI, Basel, Switzerland. This article is an open access article distributed under the terms and conditions of the Creative Commons Attribution (CC BY) license (https://creativecommons.org/licenses/by/4.0/).