
Reliability Estimation of the Compressive Concrete Strength Based on Non-Destructive Tests


Abstract
:1. Introduction
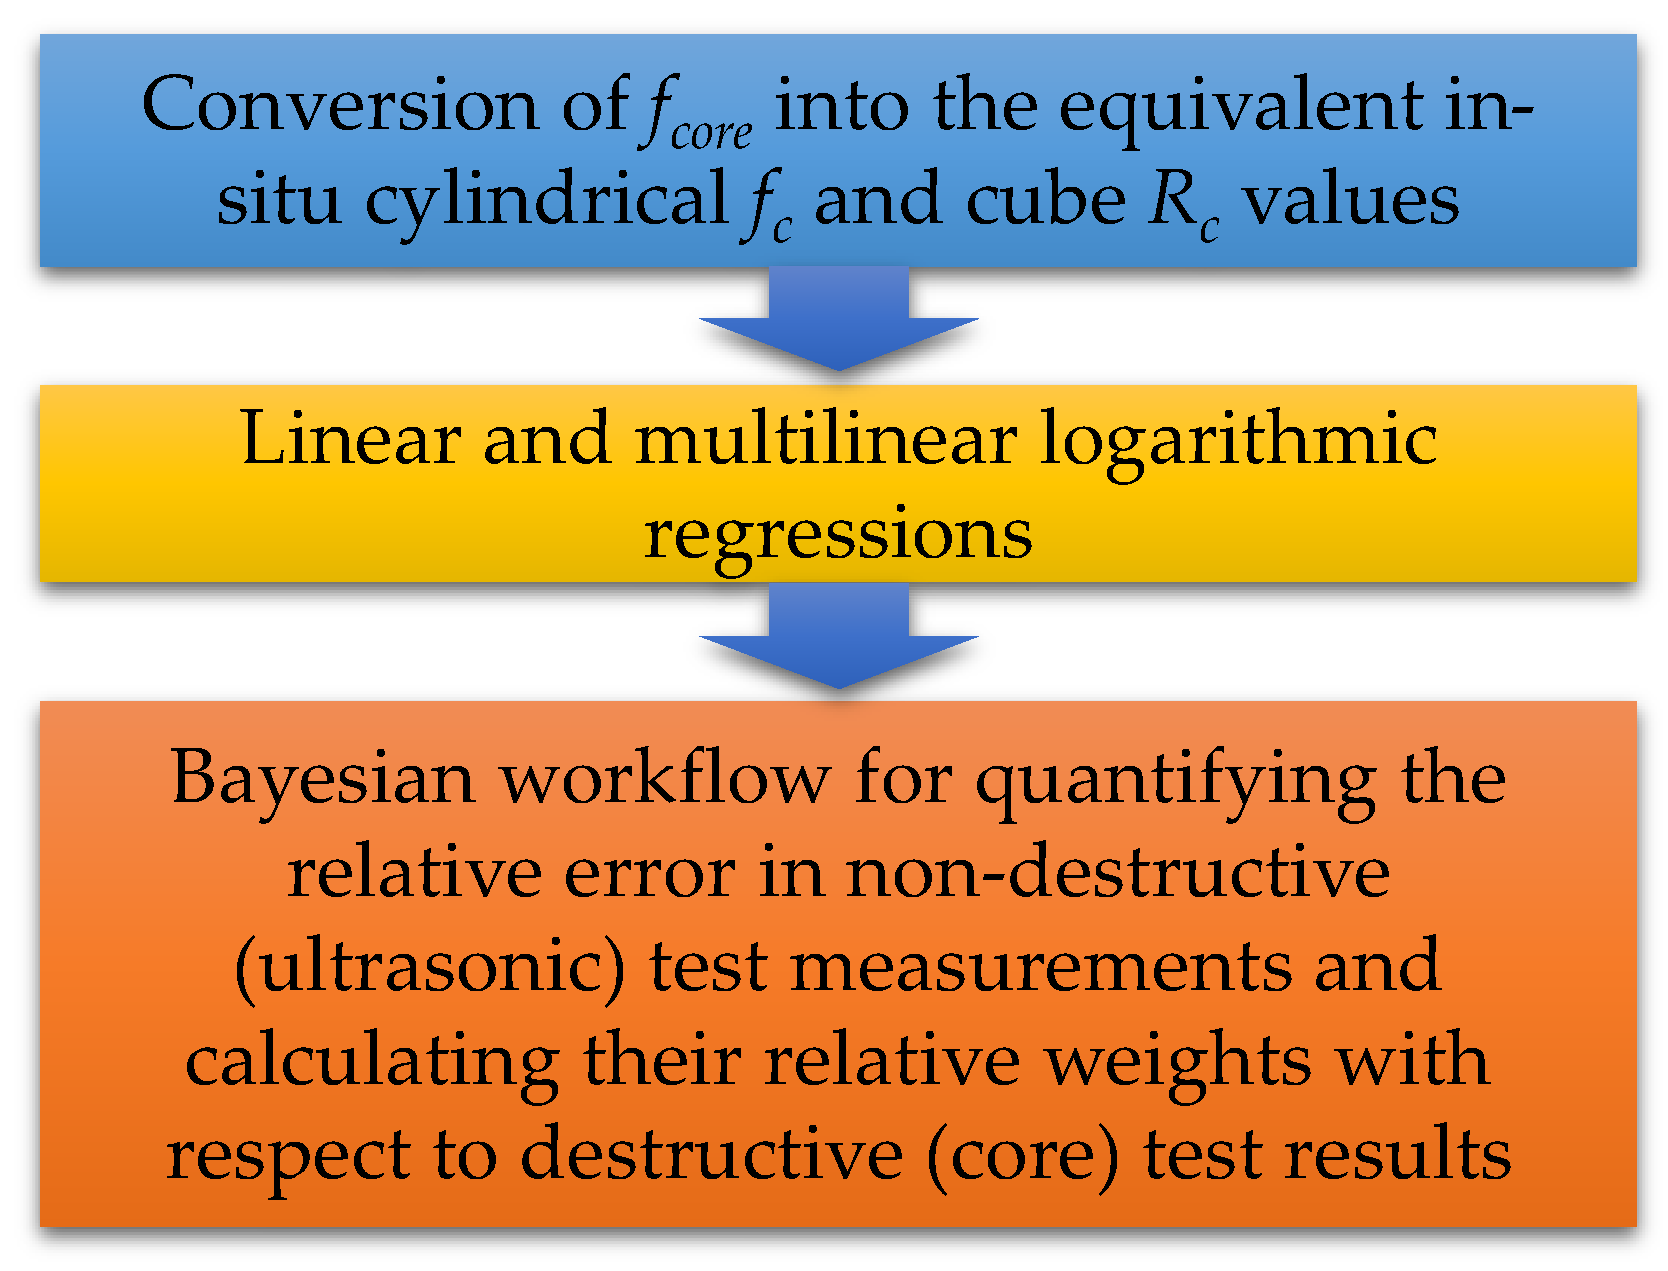
2. Methodology
2.1. Conversion of fcore into the Equivalent In Situ Cylindrical fc and Cube Rc Values
- CH/D is the correction for height/diameter ratio H/D of the specimen; CH/D = 2/(1.50 + D/H).
- Cdia is the correction for the diameter of the core; Cdia = [1.06, 1.00, 0.98] for D = [50, 100, 150] mm, respectively. Linear interpolation can be used for the diameters included between the indicated intervals; thus, the general linear equation can be Cdia = 1 + 0.0012 × (100 − D) when D ≤ 100 mm and Cdia = 1 − 0.0004 × (D − 100) when D > 100 mm.
- Ca is the correction for the presence of reinforcing bars; Ca = 1.0 for the absence of bars, and varying between 1.03 for small-diameter bars (10) and 1.13 for large-diameter bars (20).
- Cd is the correction for damage due to drilling; Cd = 1.20 for fcore < 20 MPa, and 1.10 for fcore ≥ 20 MPa.
2.2. Probabilistic Logarithmic Linear and Multilinear Regressions
2.3. Bayesian Workflow for Quantifying the Relative Error in Non-Destructive Test Measurements and Calculating Their Relative Weights with Respect to Destructive Test Results
2.3.1. The Conditional Probability Model for Predicting Rultr Given the Core Strength Rc
2.3.2. Characterizing the Uncertainty in the Concrete Strength Considering Both Destructive and Non-Destructive Test Results
2.3.3. Estimating the Relative Weights Associated with Each Ultrasonic Non-Destructive Test Data
3. Application
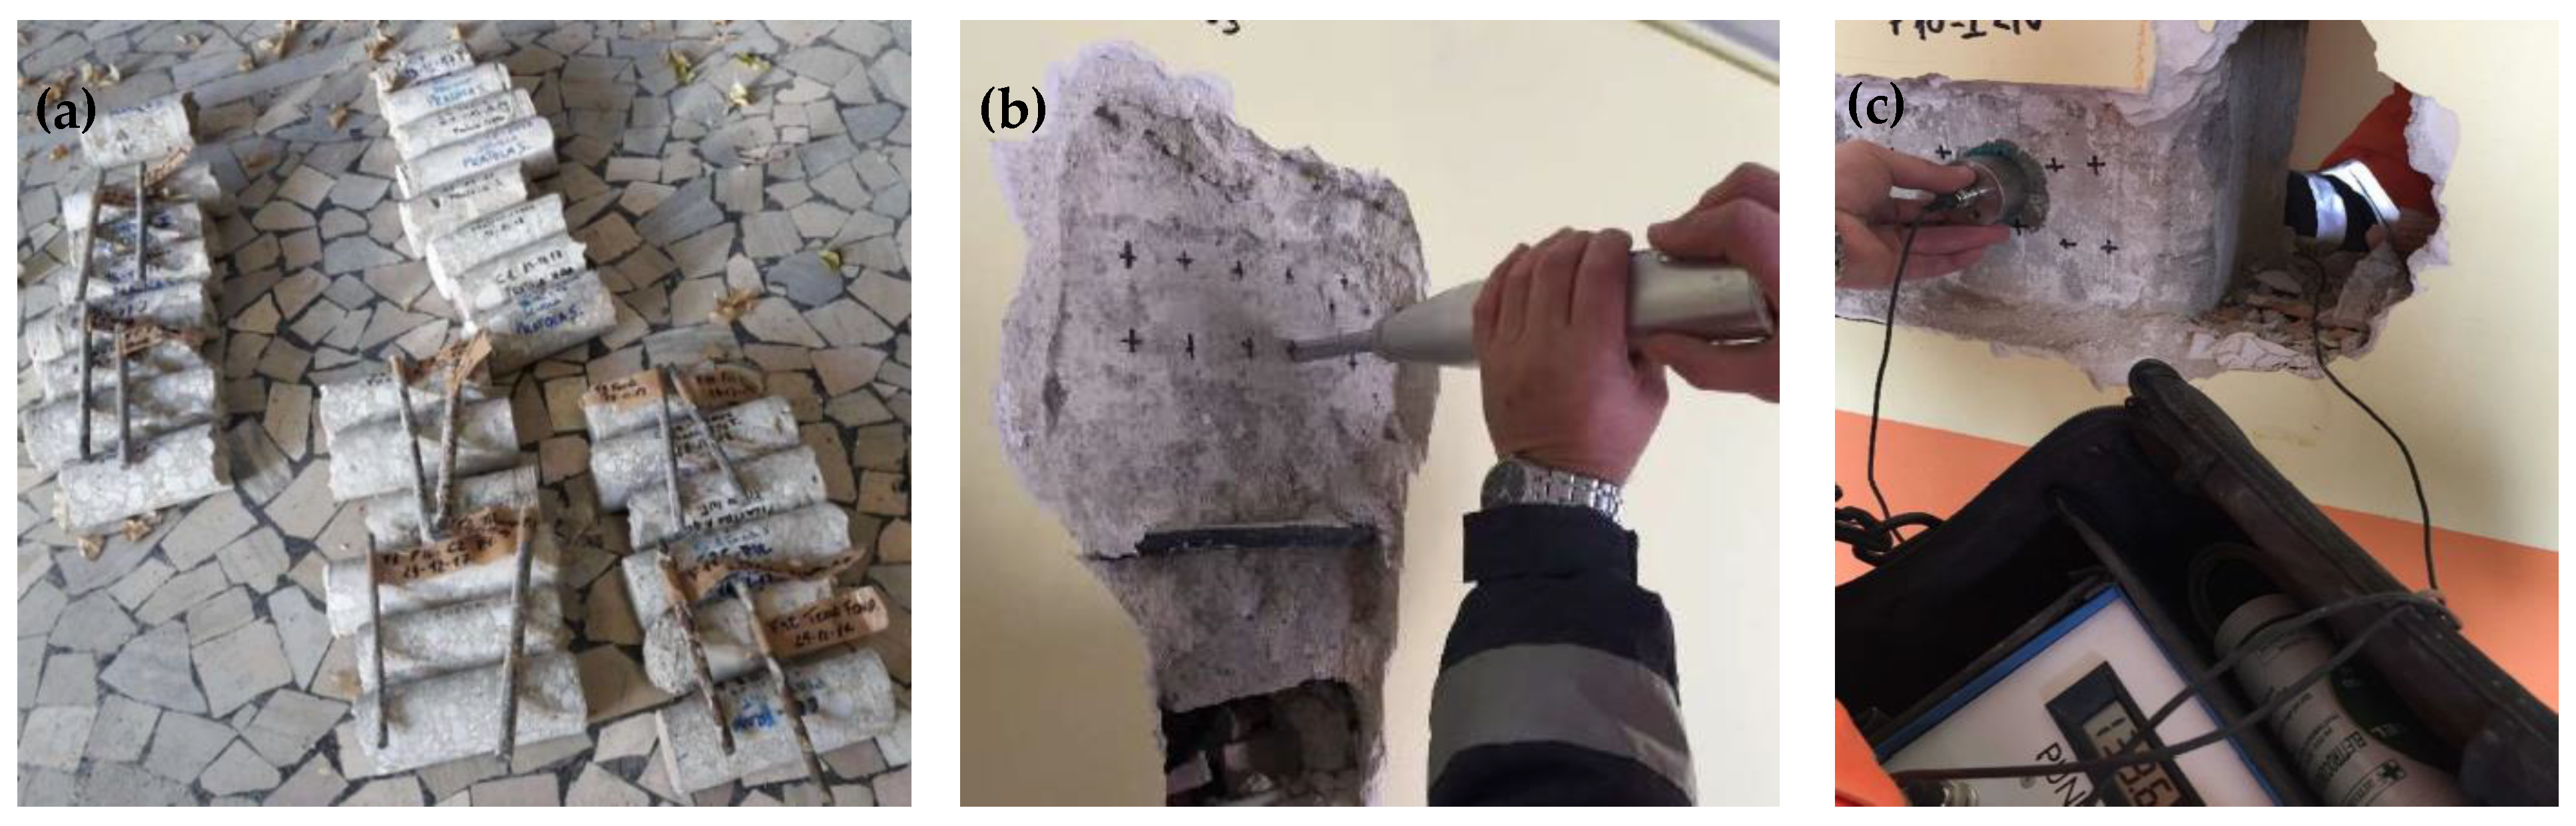
3.1. Brief Overview of the In Situ Tests
3.1.1. Destructive Tests
- The diameter of the extracted carrots should be at least three times greater than the maximum diameter of the aggregates.
- Carrots intended for resistance assessment should not contain reinforcing steel bars.
- Carrots with defects should be evaluated carefully and separately.
- The height/diameter ratio (slenderness) of the specimens should, if possible, be equal to one or two.
- Before breaking, the core samples should be aired out for at least 24 h.
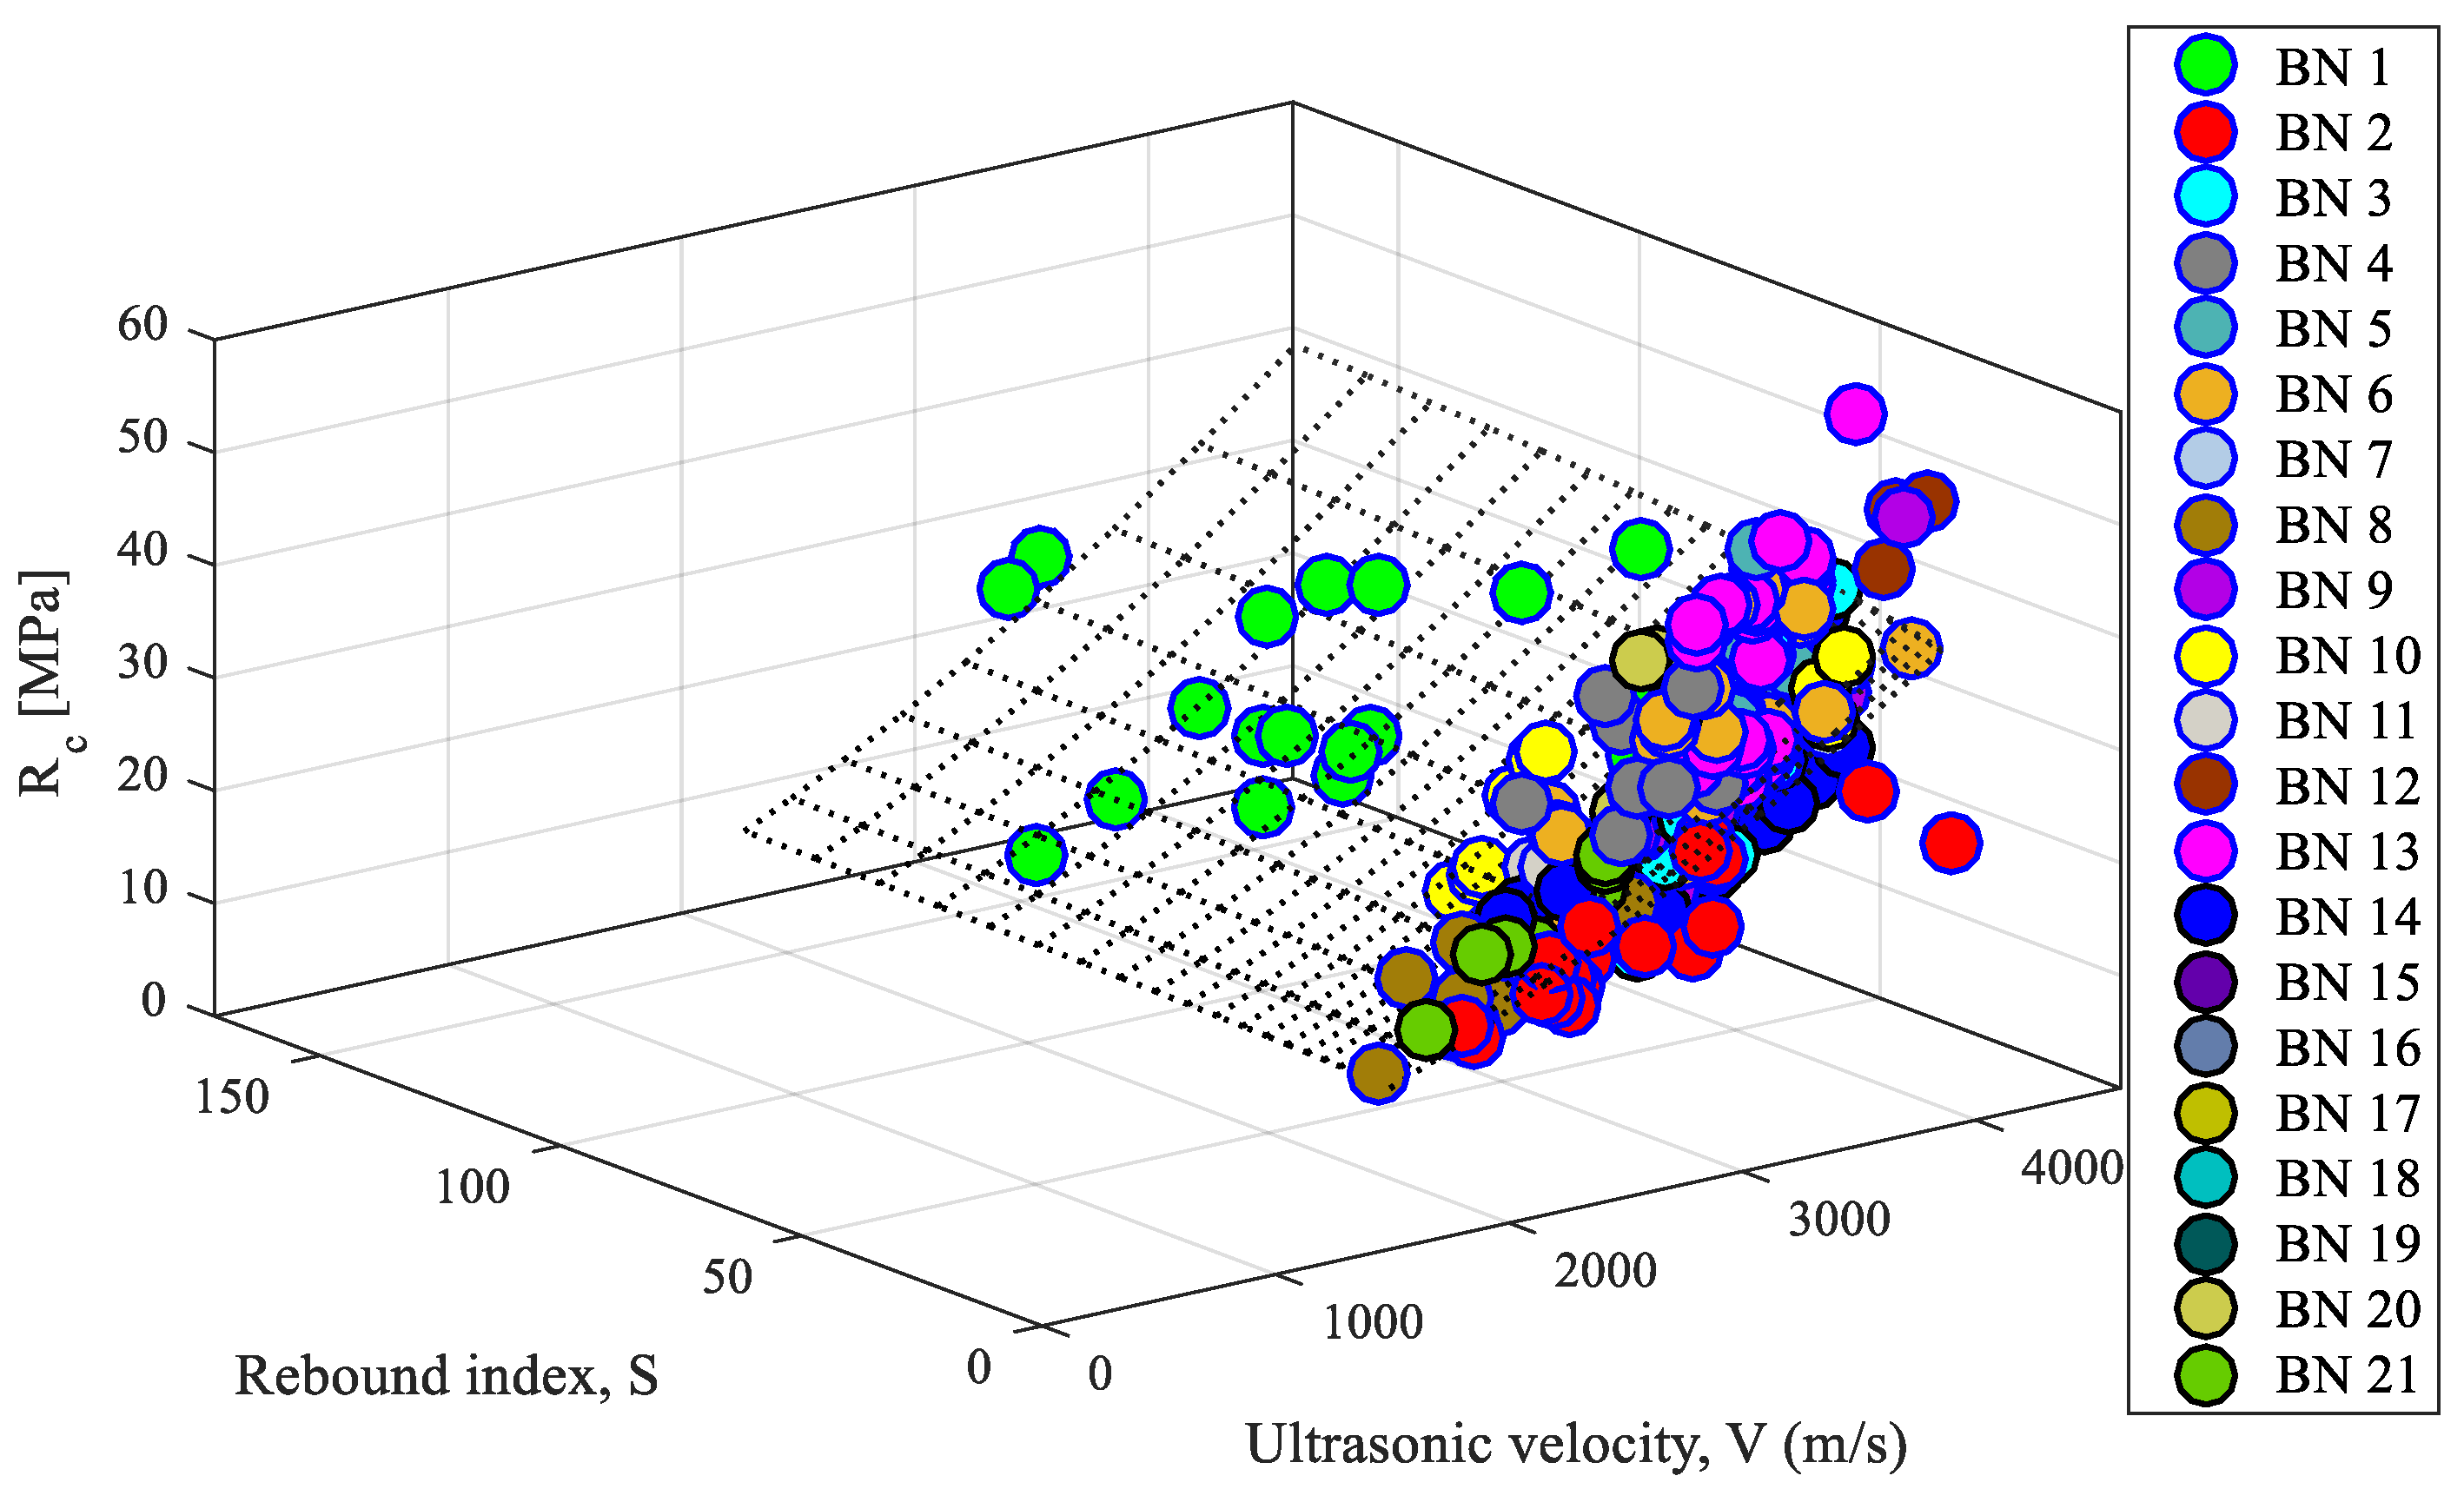
3.1.2. Non-Destructive Tests
- For concrete of poor quality: V < 3000 m/s;
- For medium-quality concrete: 3000 m/s ≤ V ≤ 4000 m/s;
- For concrete of good quality: V > 4000 m/s.
3.2. The Database
- ⮚
- For all the 221 data points, concrete strength from destructive core tests, ultrasonic velocity V and rebound number S from non-destructive tests are available. For each test, they are measured on the same structural member.
- ⮚
- For BN 8, CP and type of structural member is not available.
- ⮚
- For BNs 7, 12 and 20, CPs are not available.
- ⮚
- BN 18 and 19 belong to the same building but refer to two different periods (in particular, the lower floors have been built in 60s, while the last floor has been built in 80s as superelevation).
- ⮚
- The number of the tests corresponding to the same building is always less than or equal to 30. For each BN, the average and the standard deviation values of the test data are shown in the last two columns.
- ⮚
- A significant part of the data is collected based on personal communications with different professional engineers. The data associated with three buildings, BNs 3, 8 and 21, are obtained based on the tests available in the literature.
3.3. Results and Comparisons
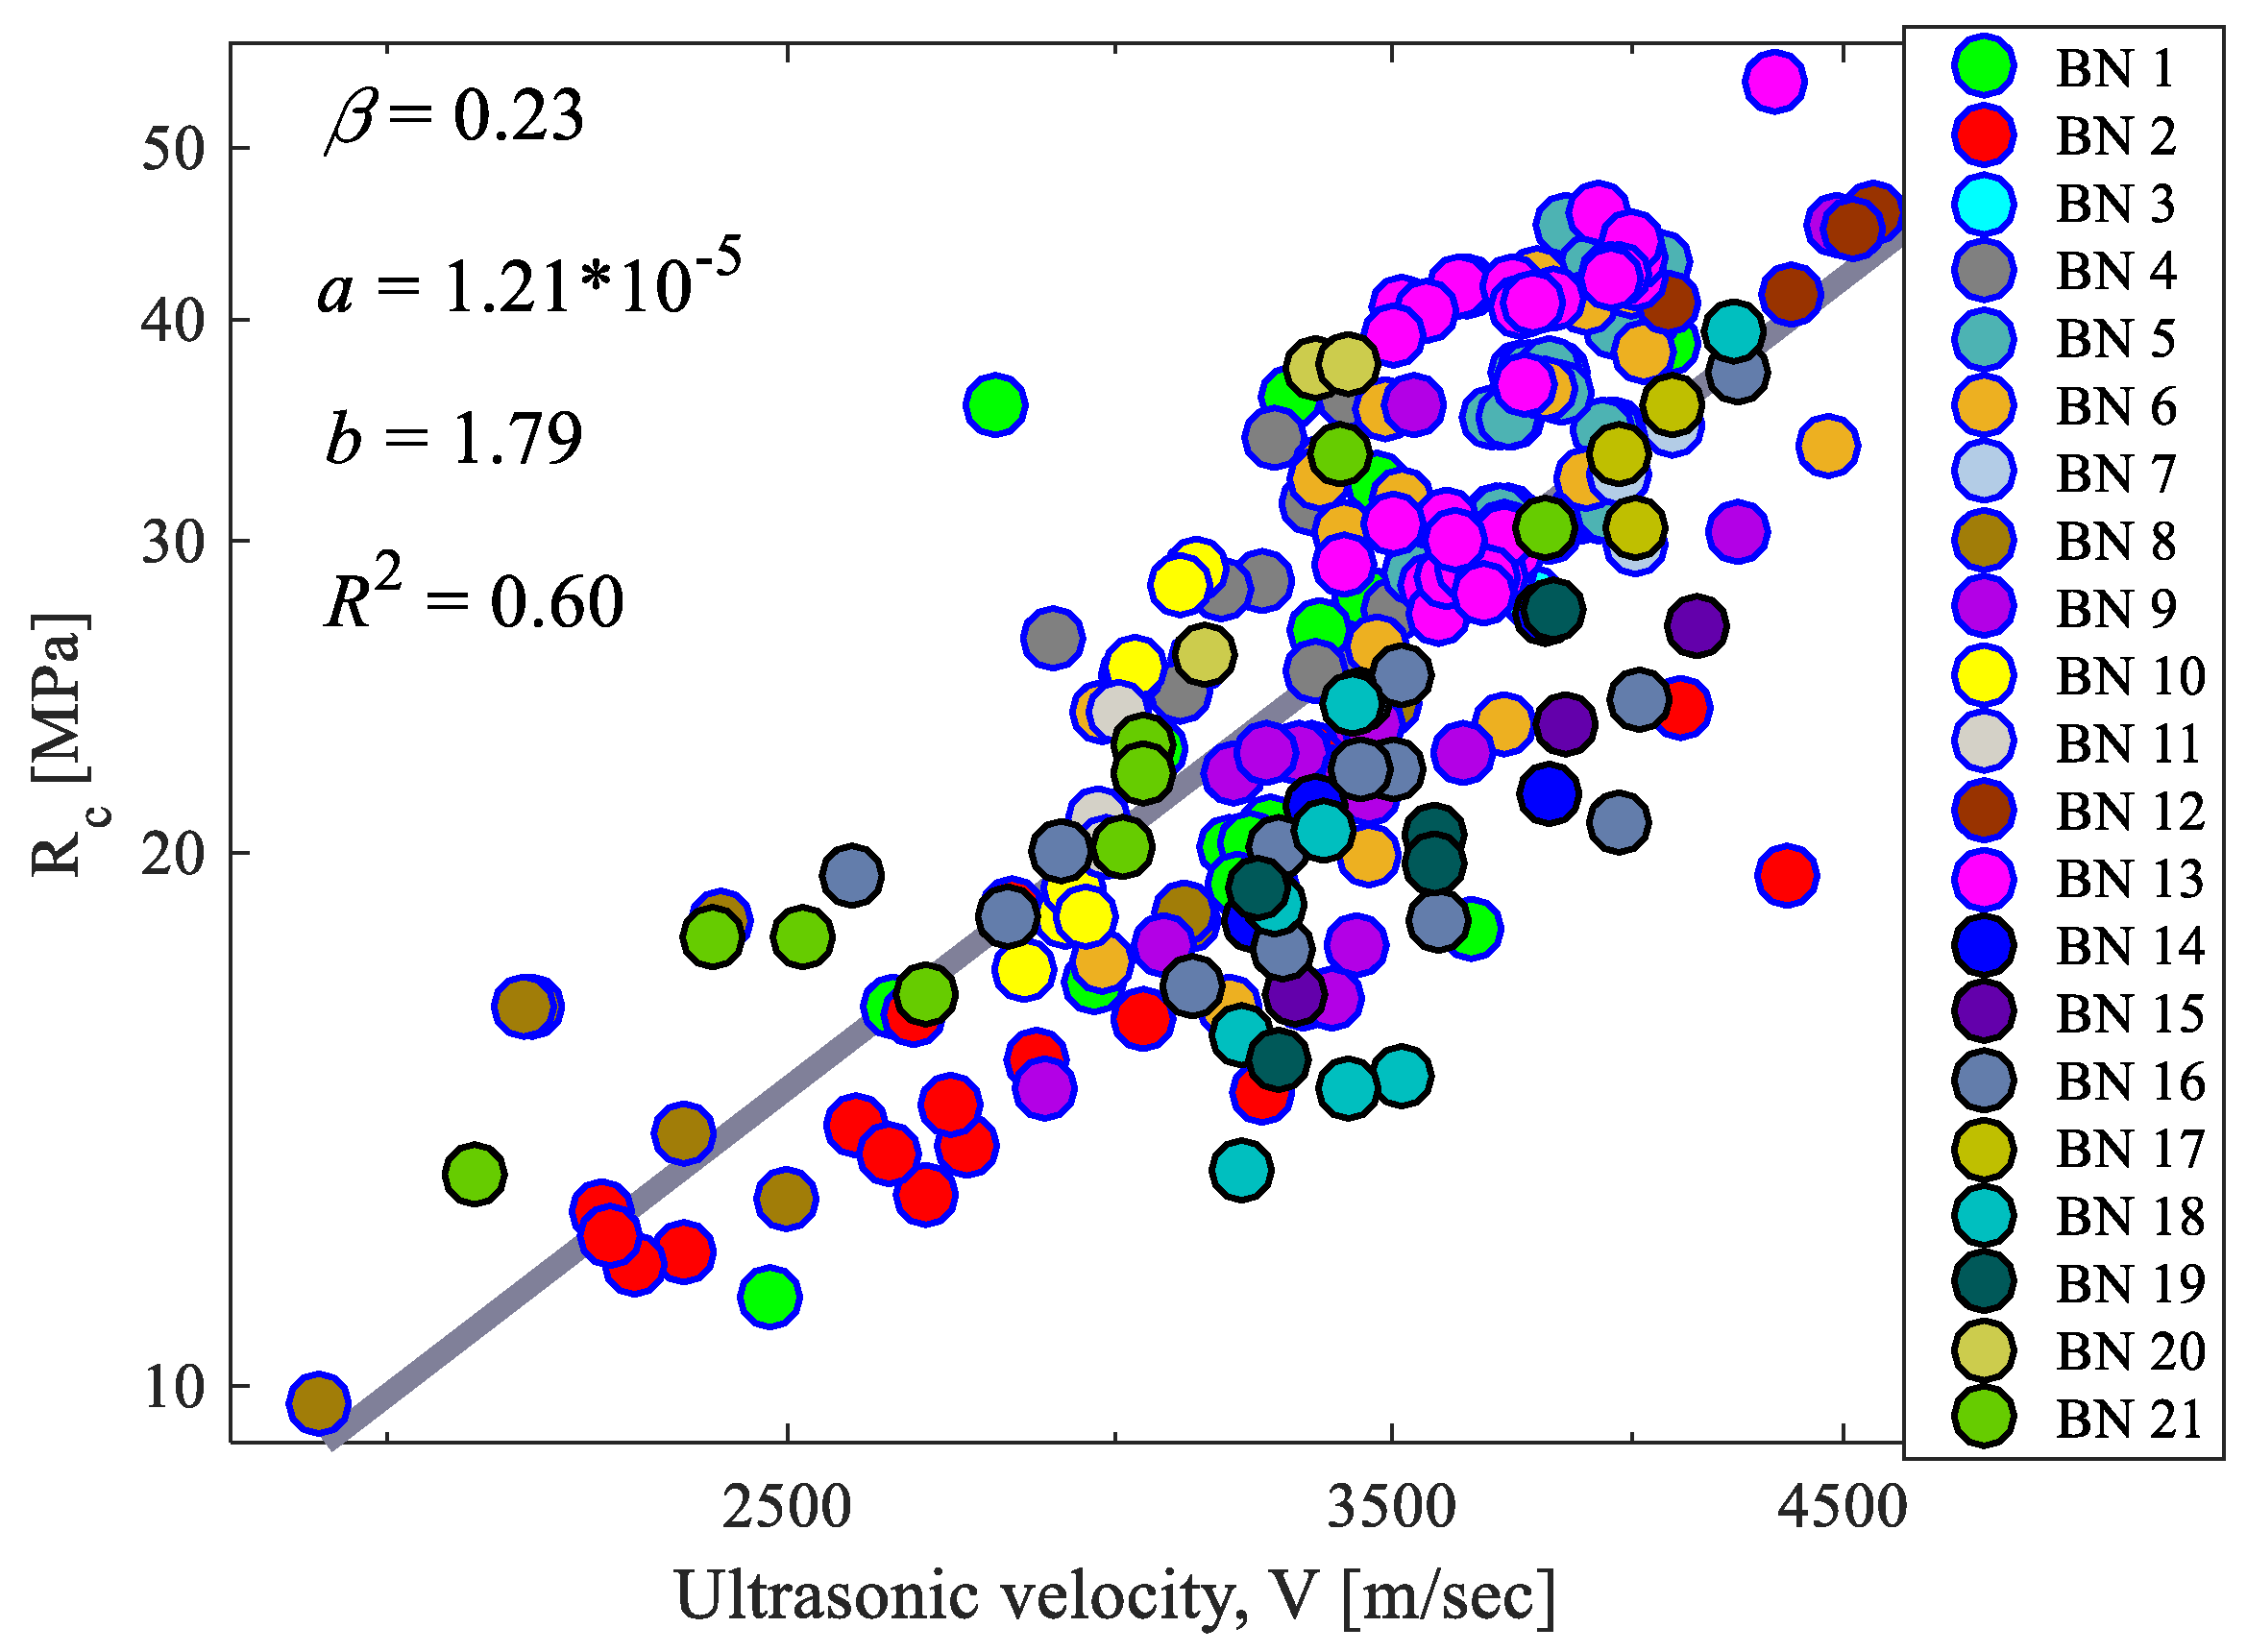
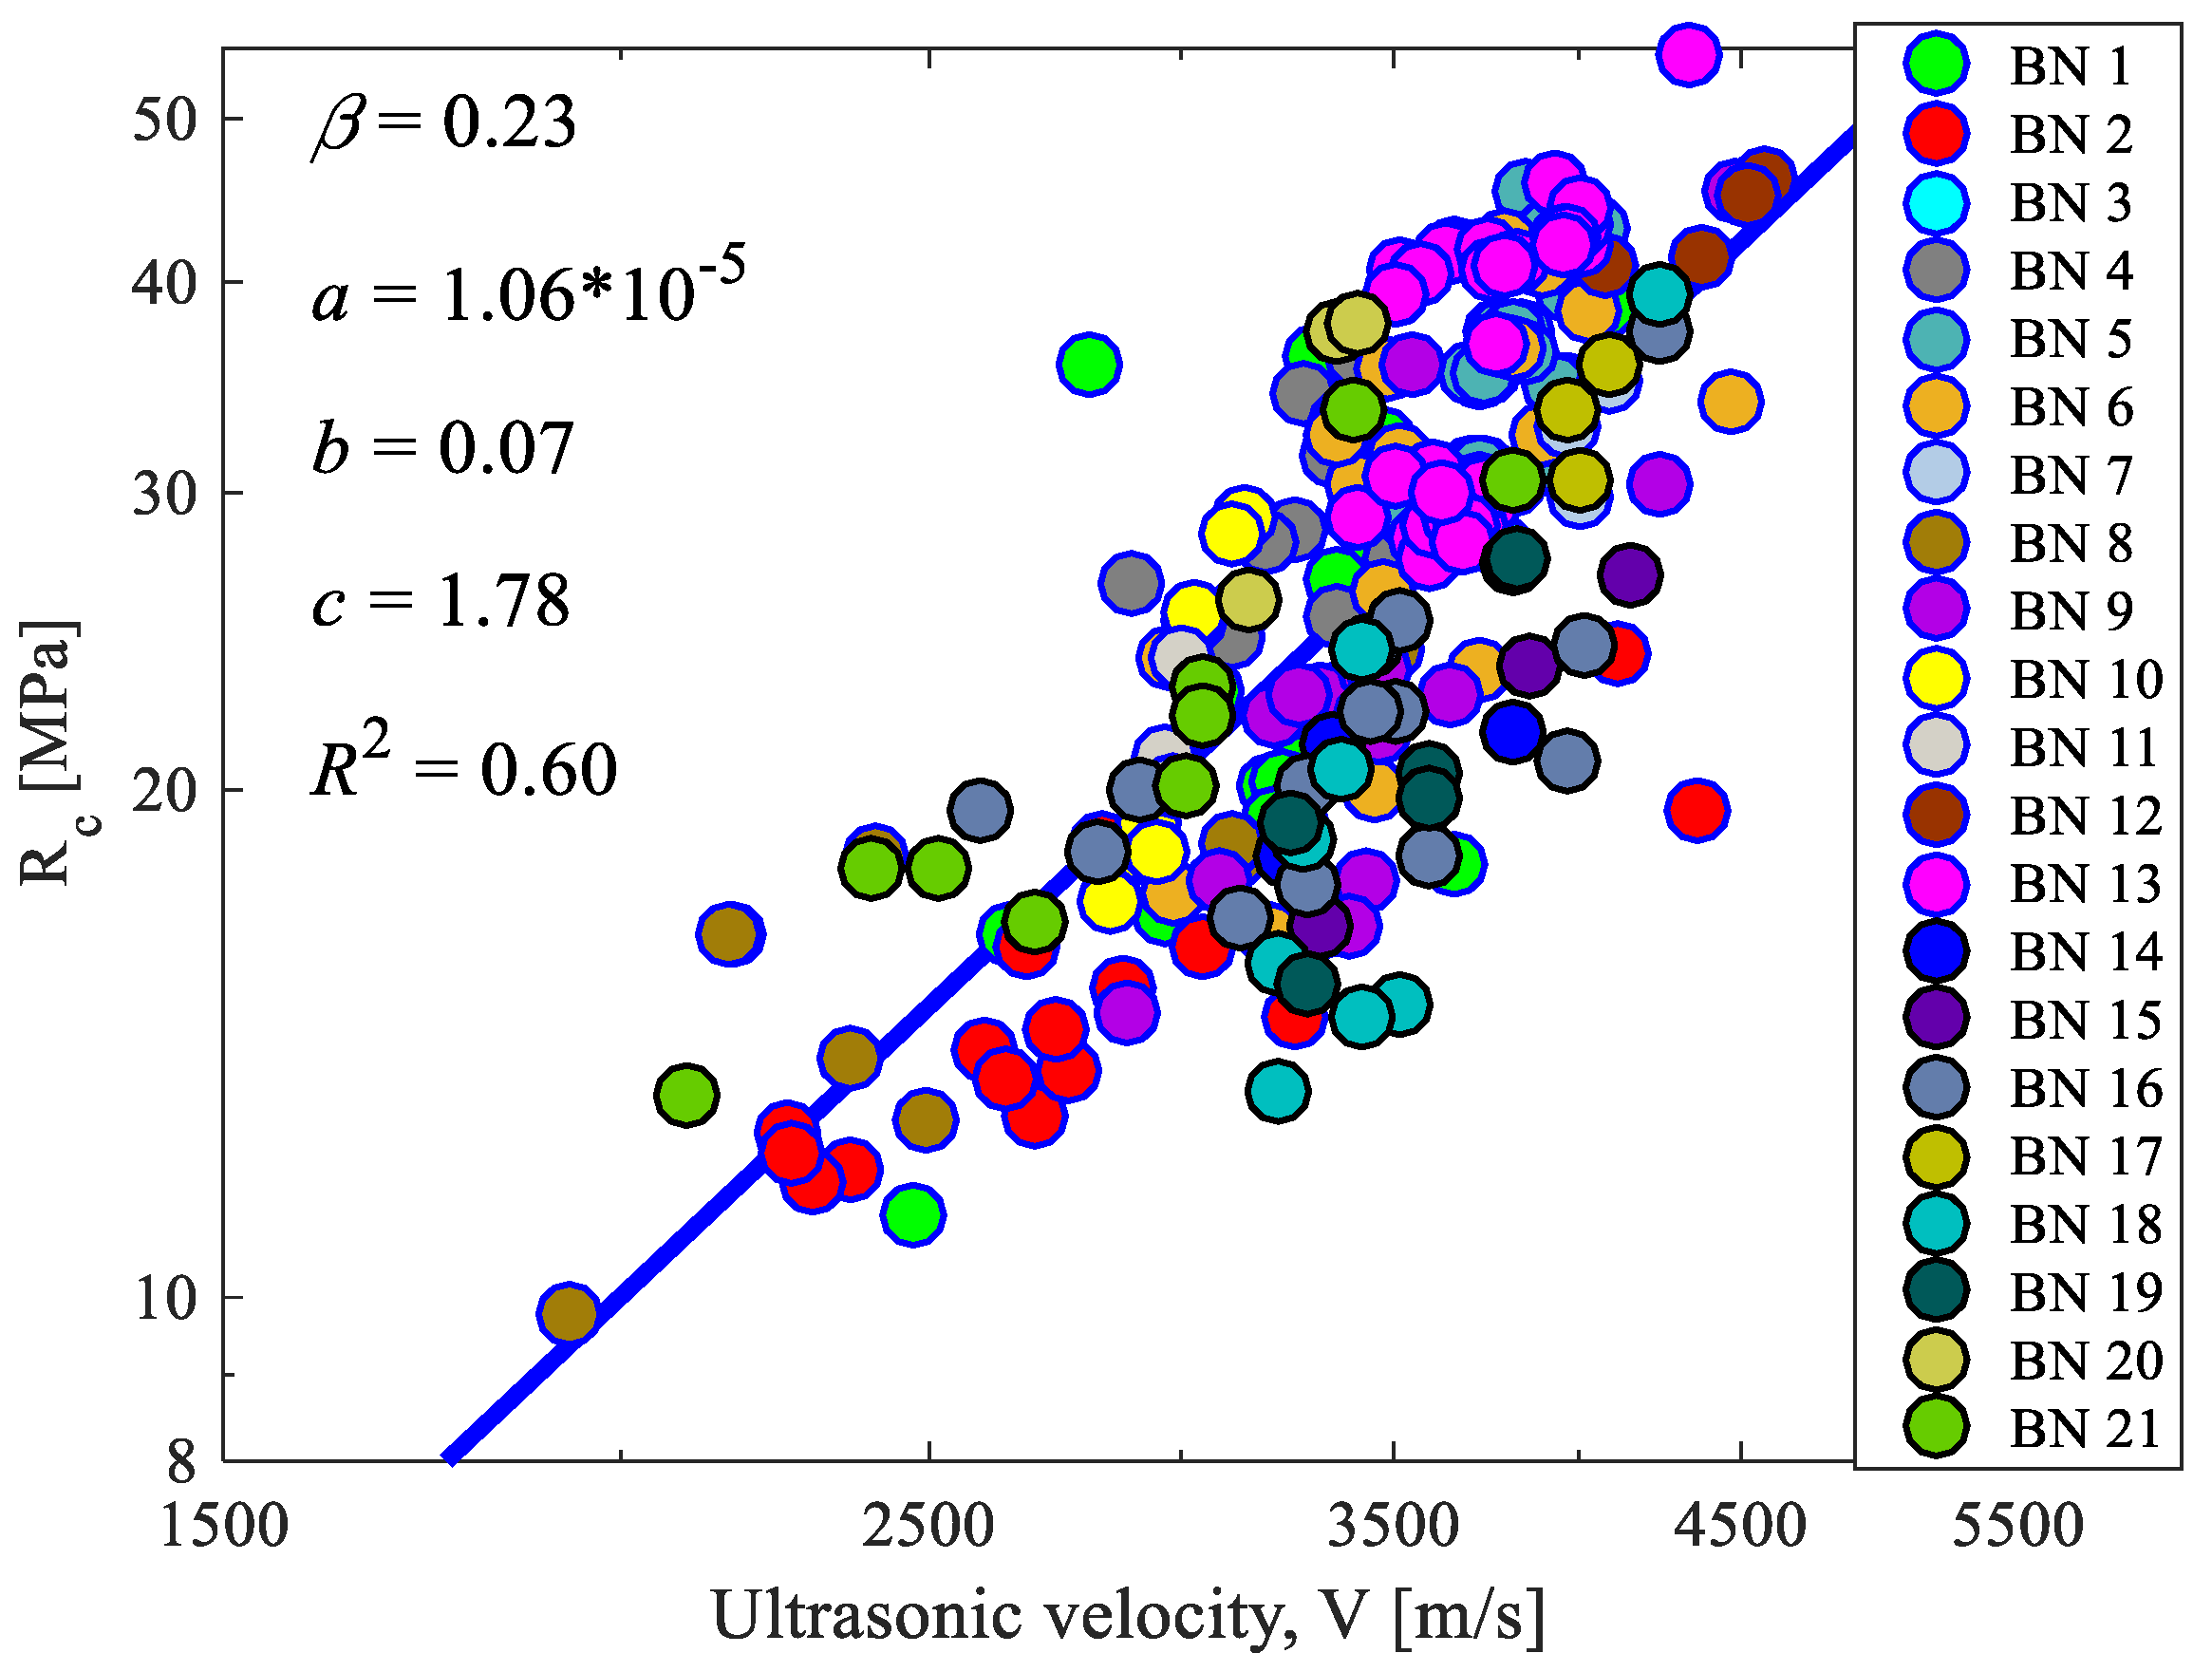
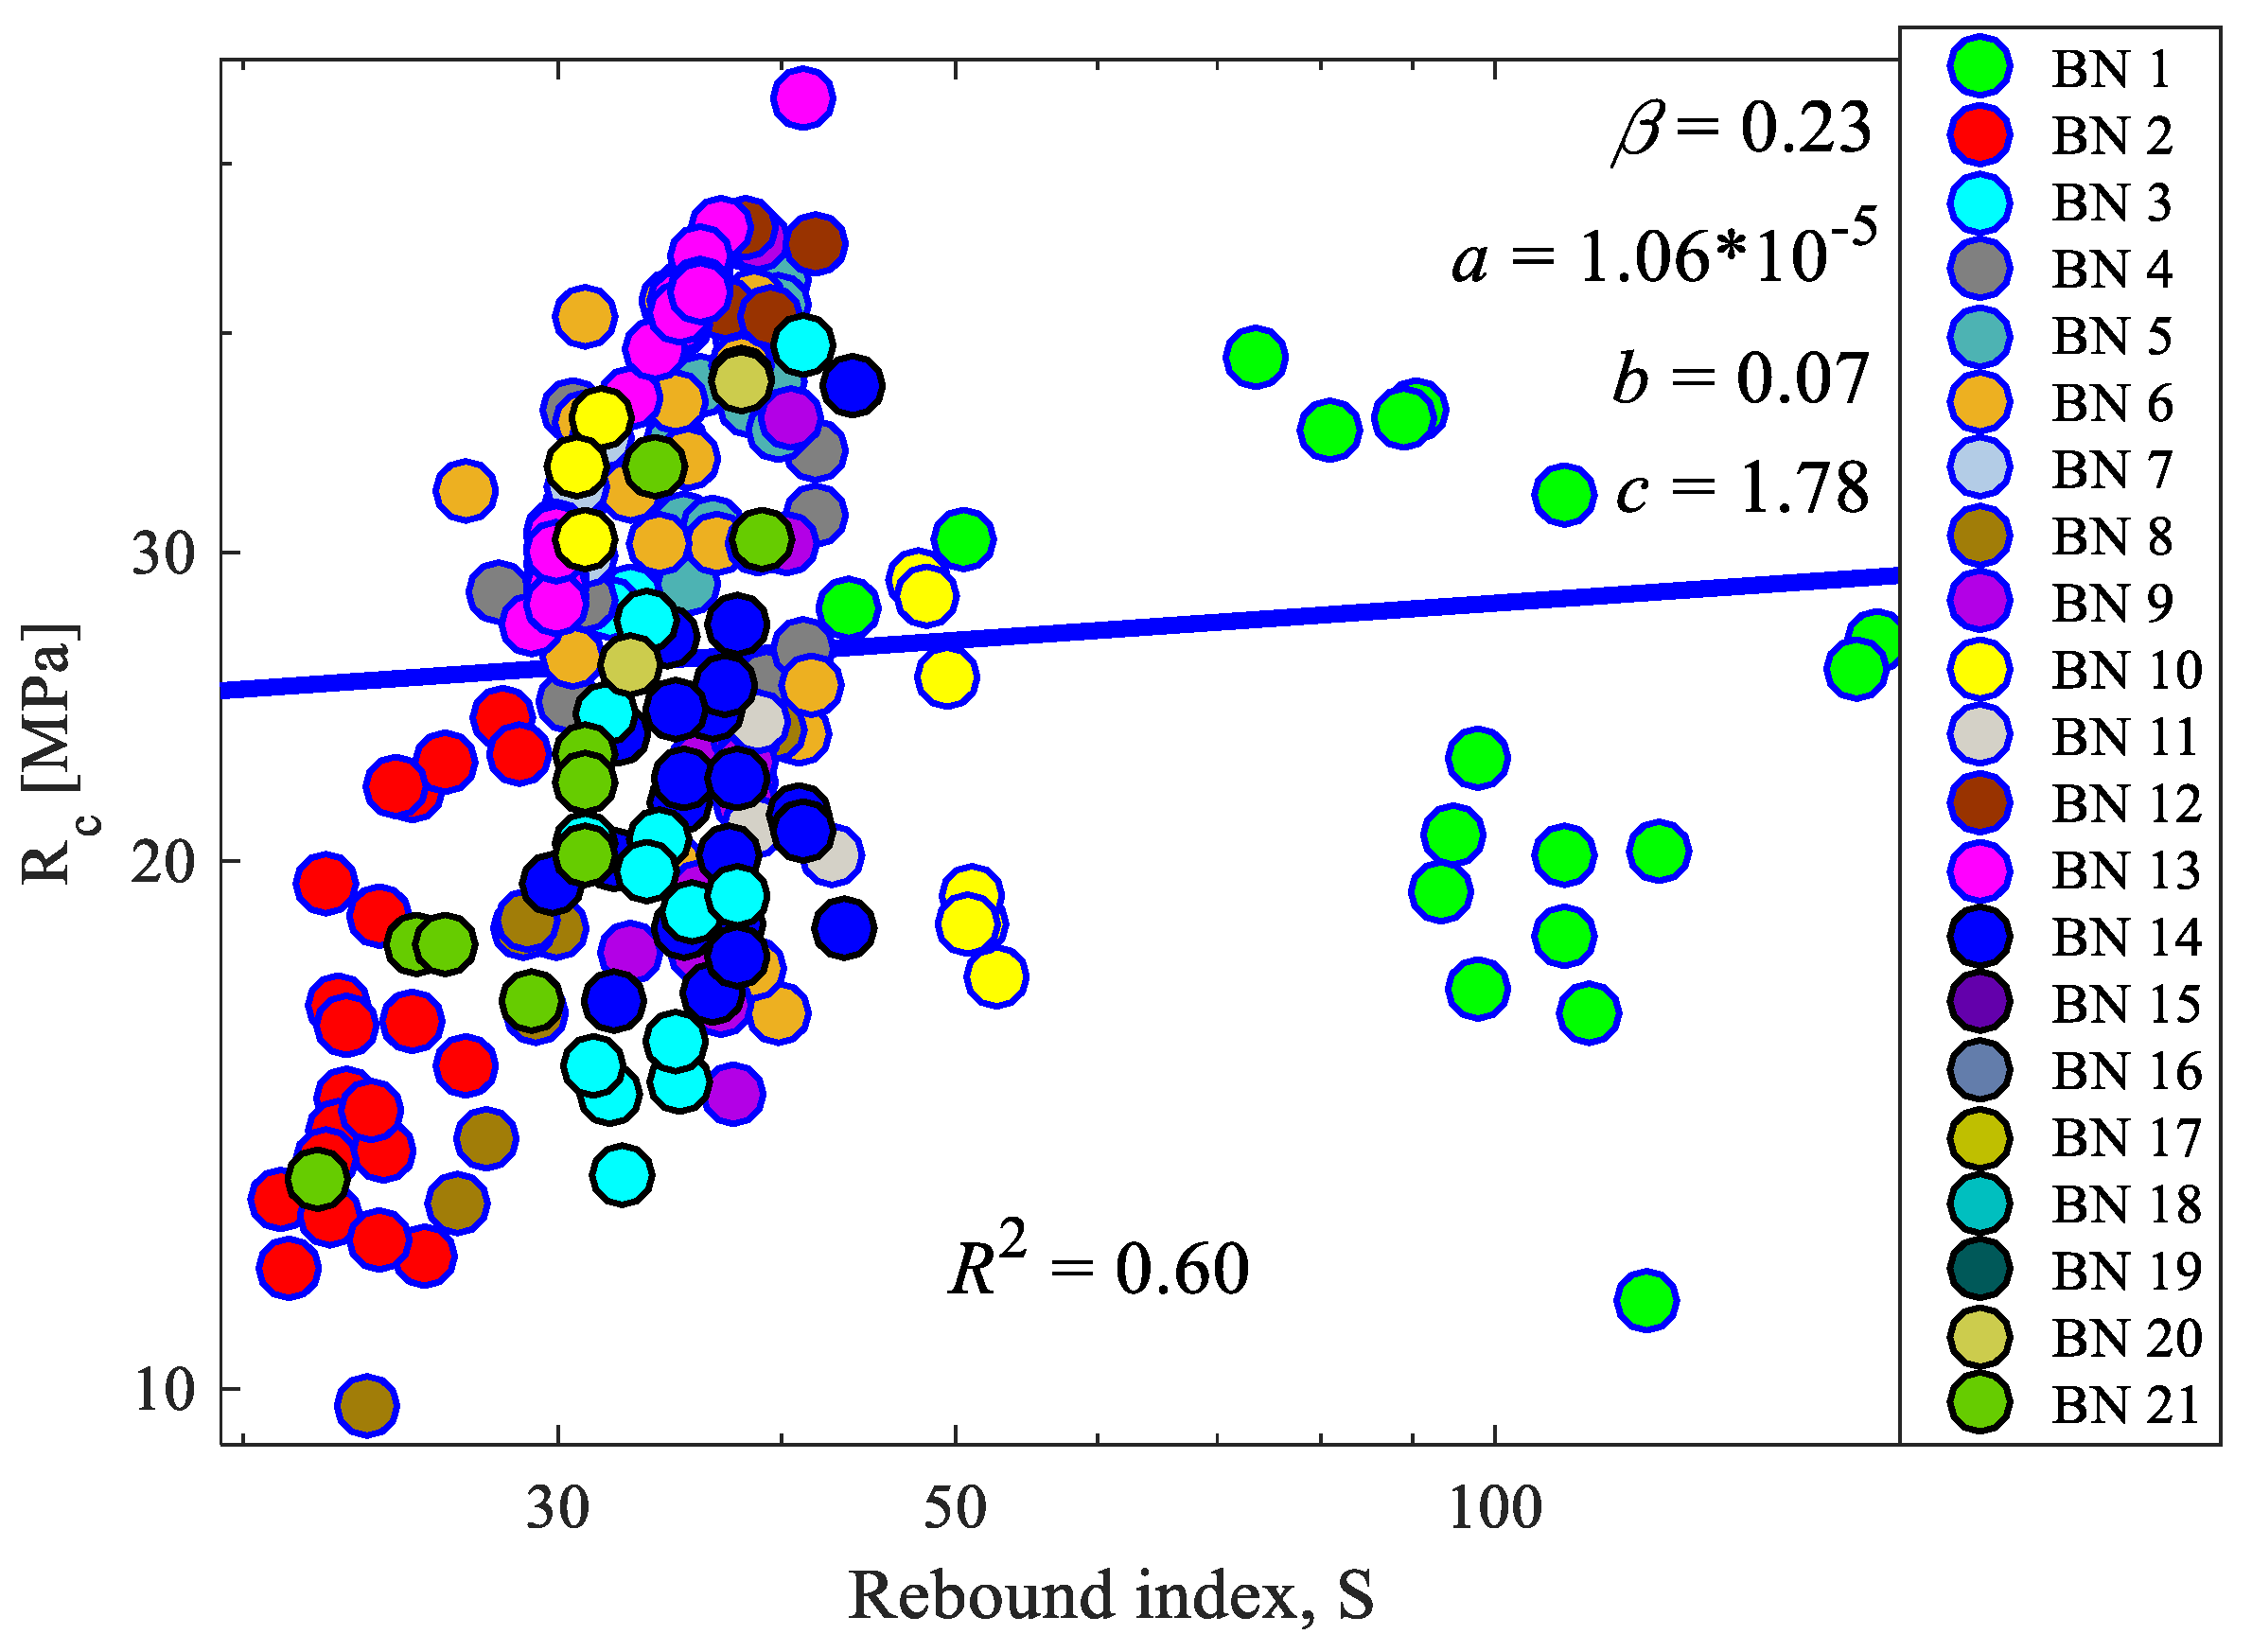
3.3.1. Regression Predictive Equations
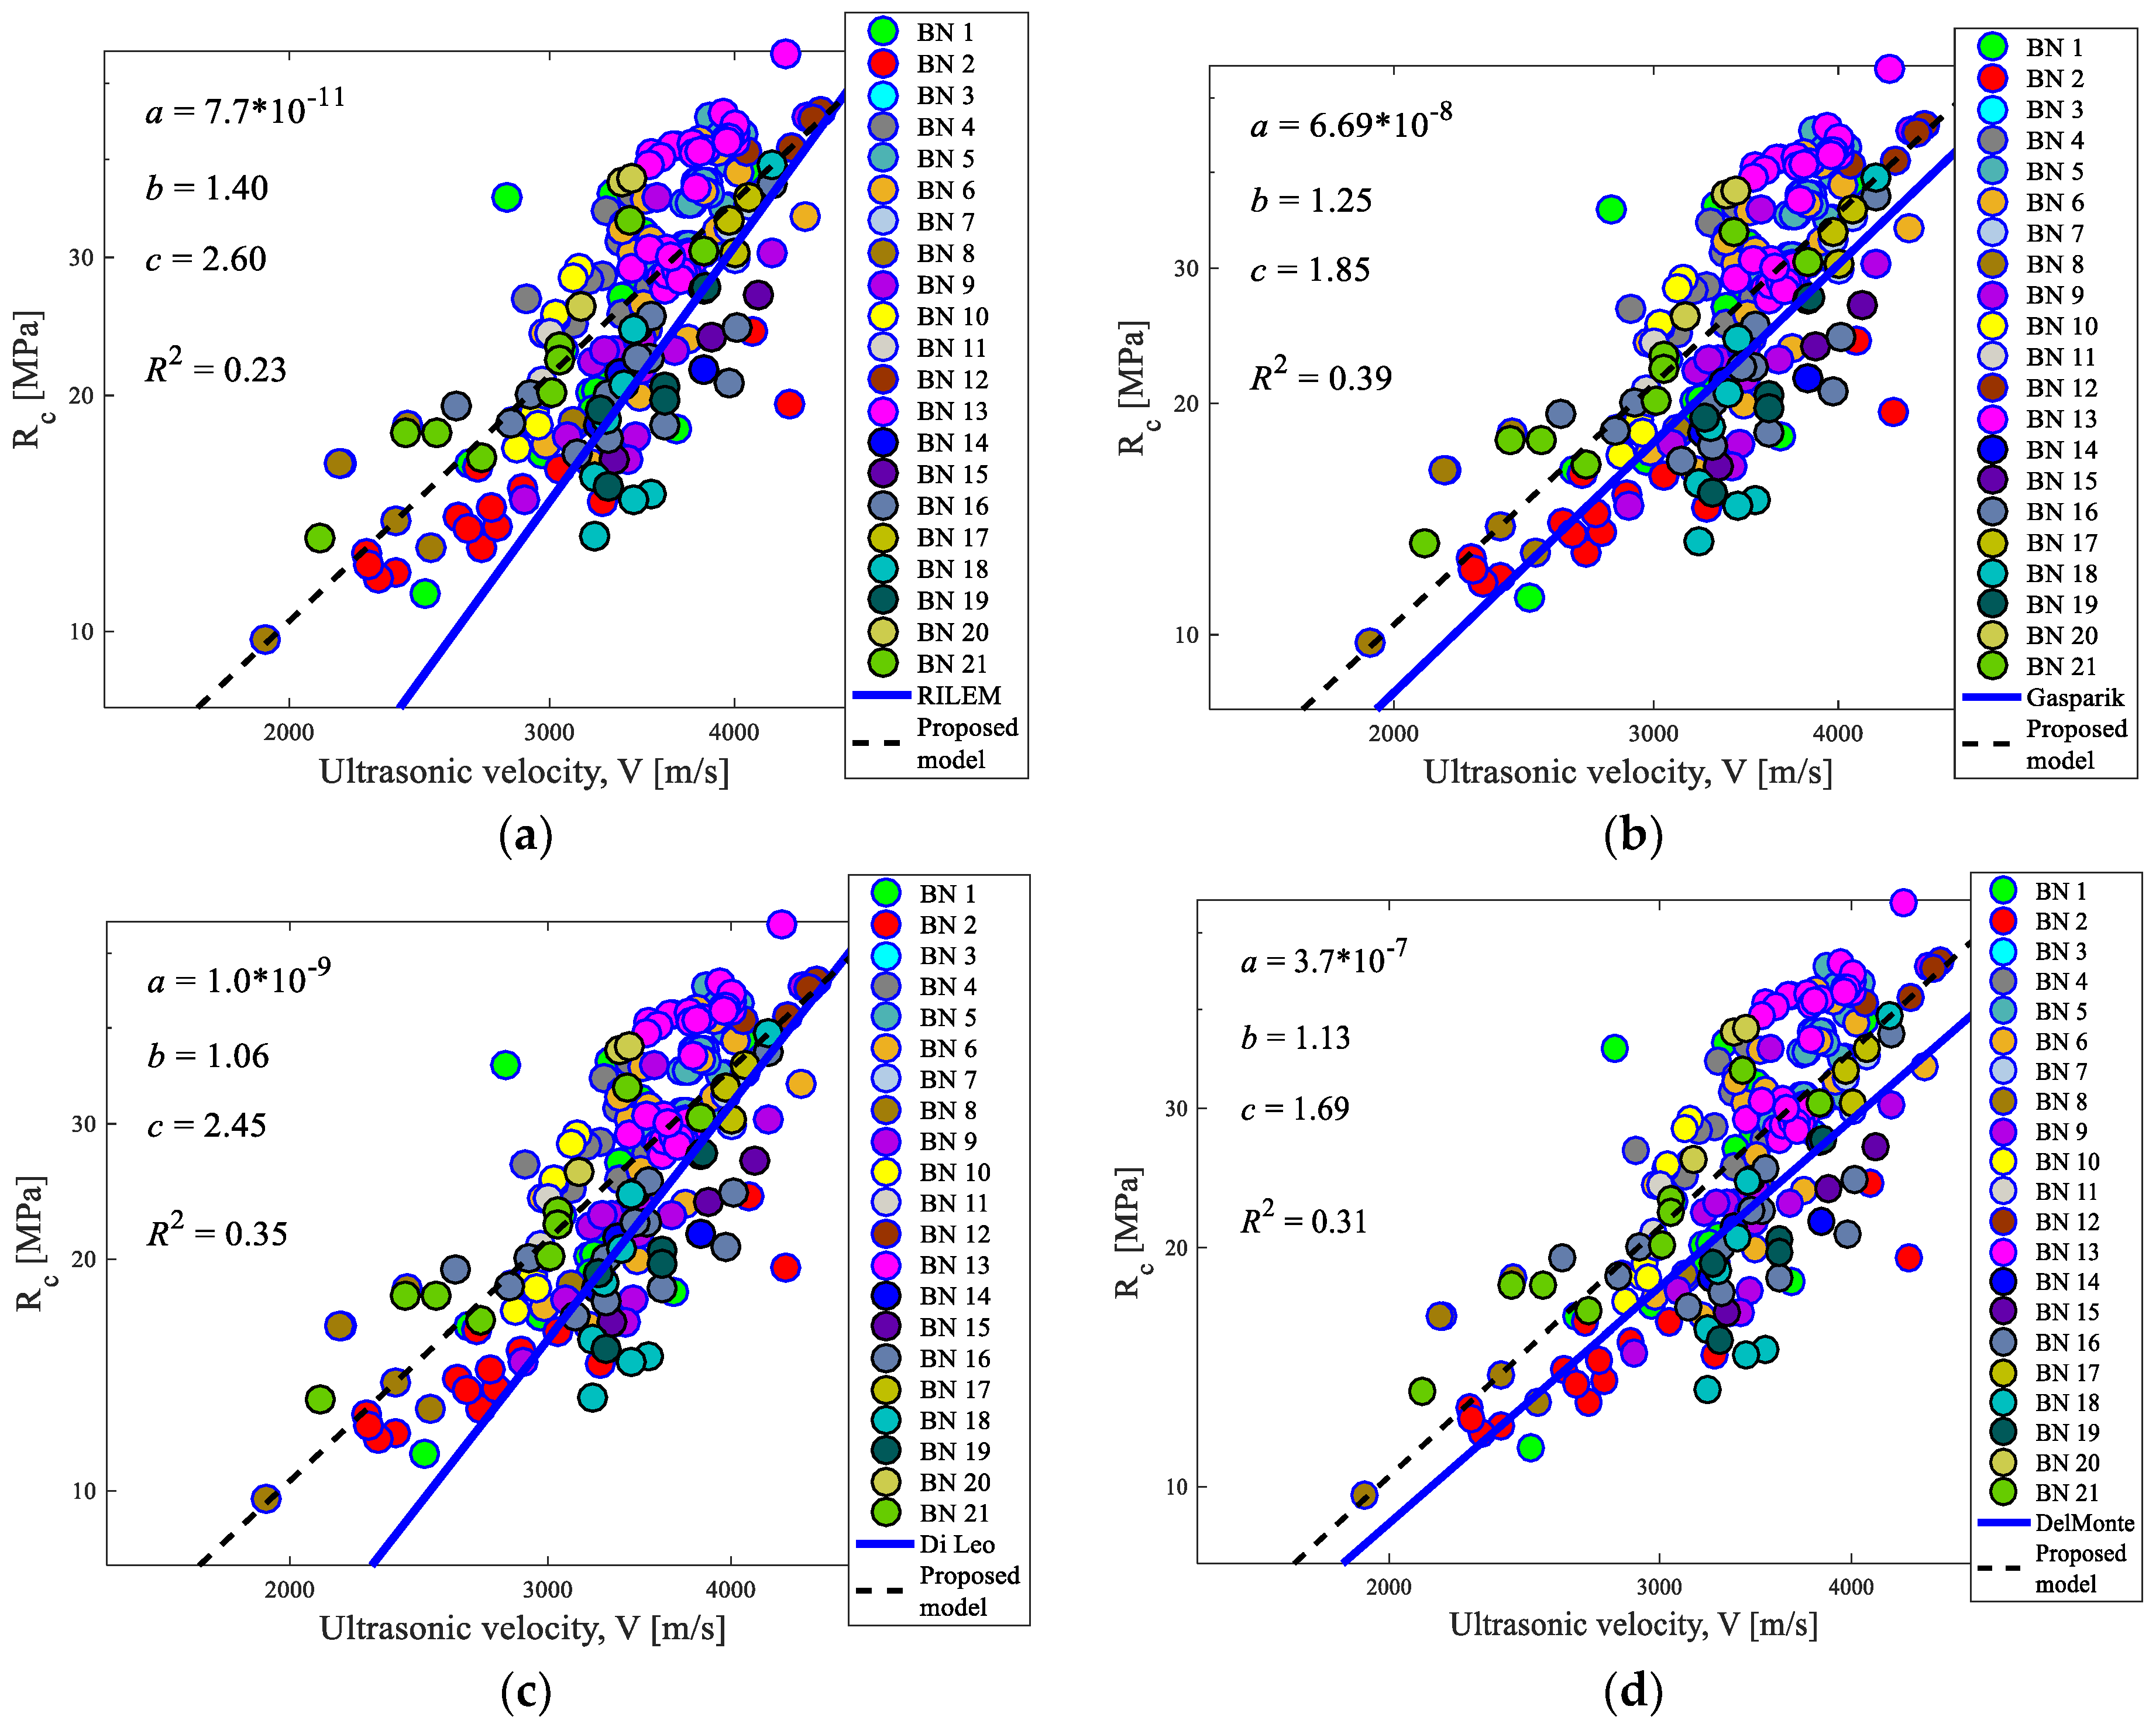
3.3.2. Comparison with Literature
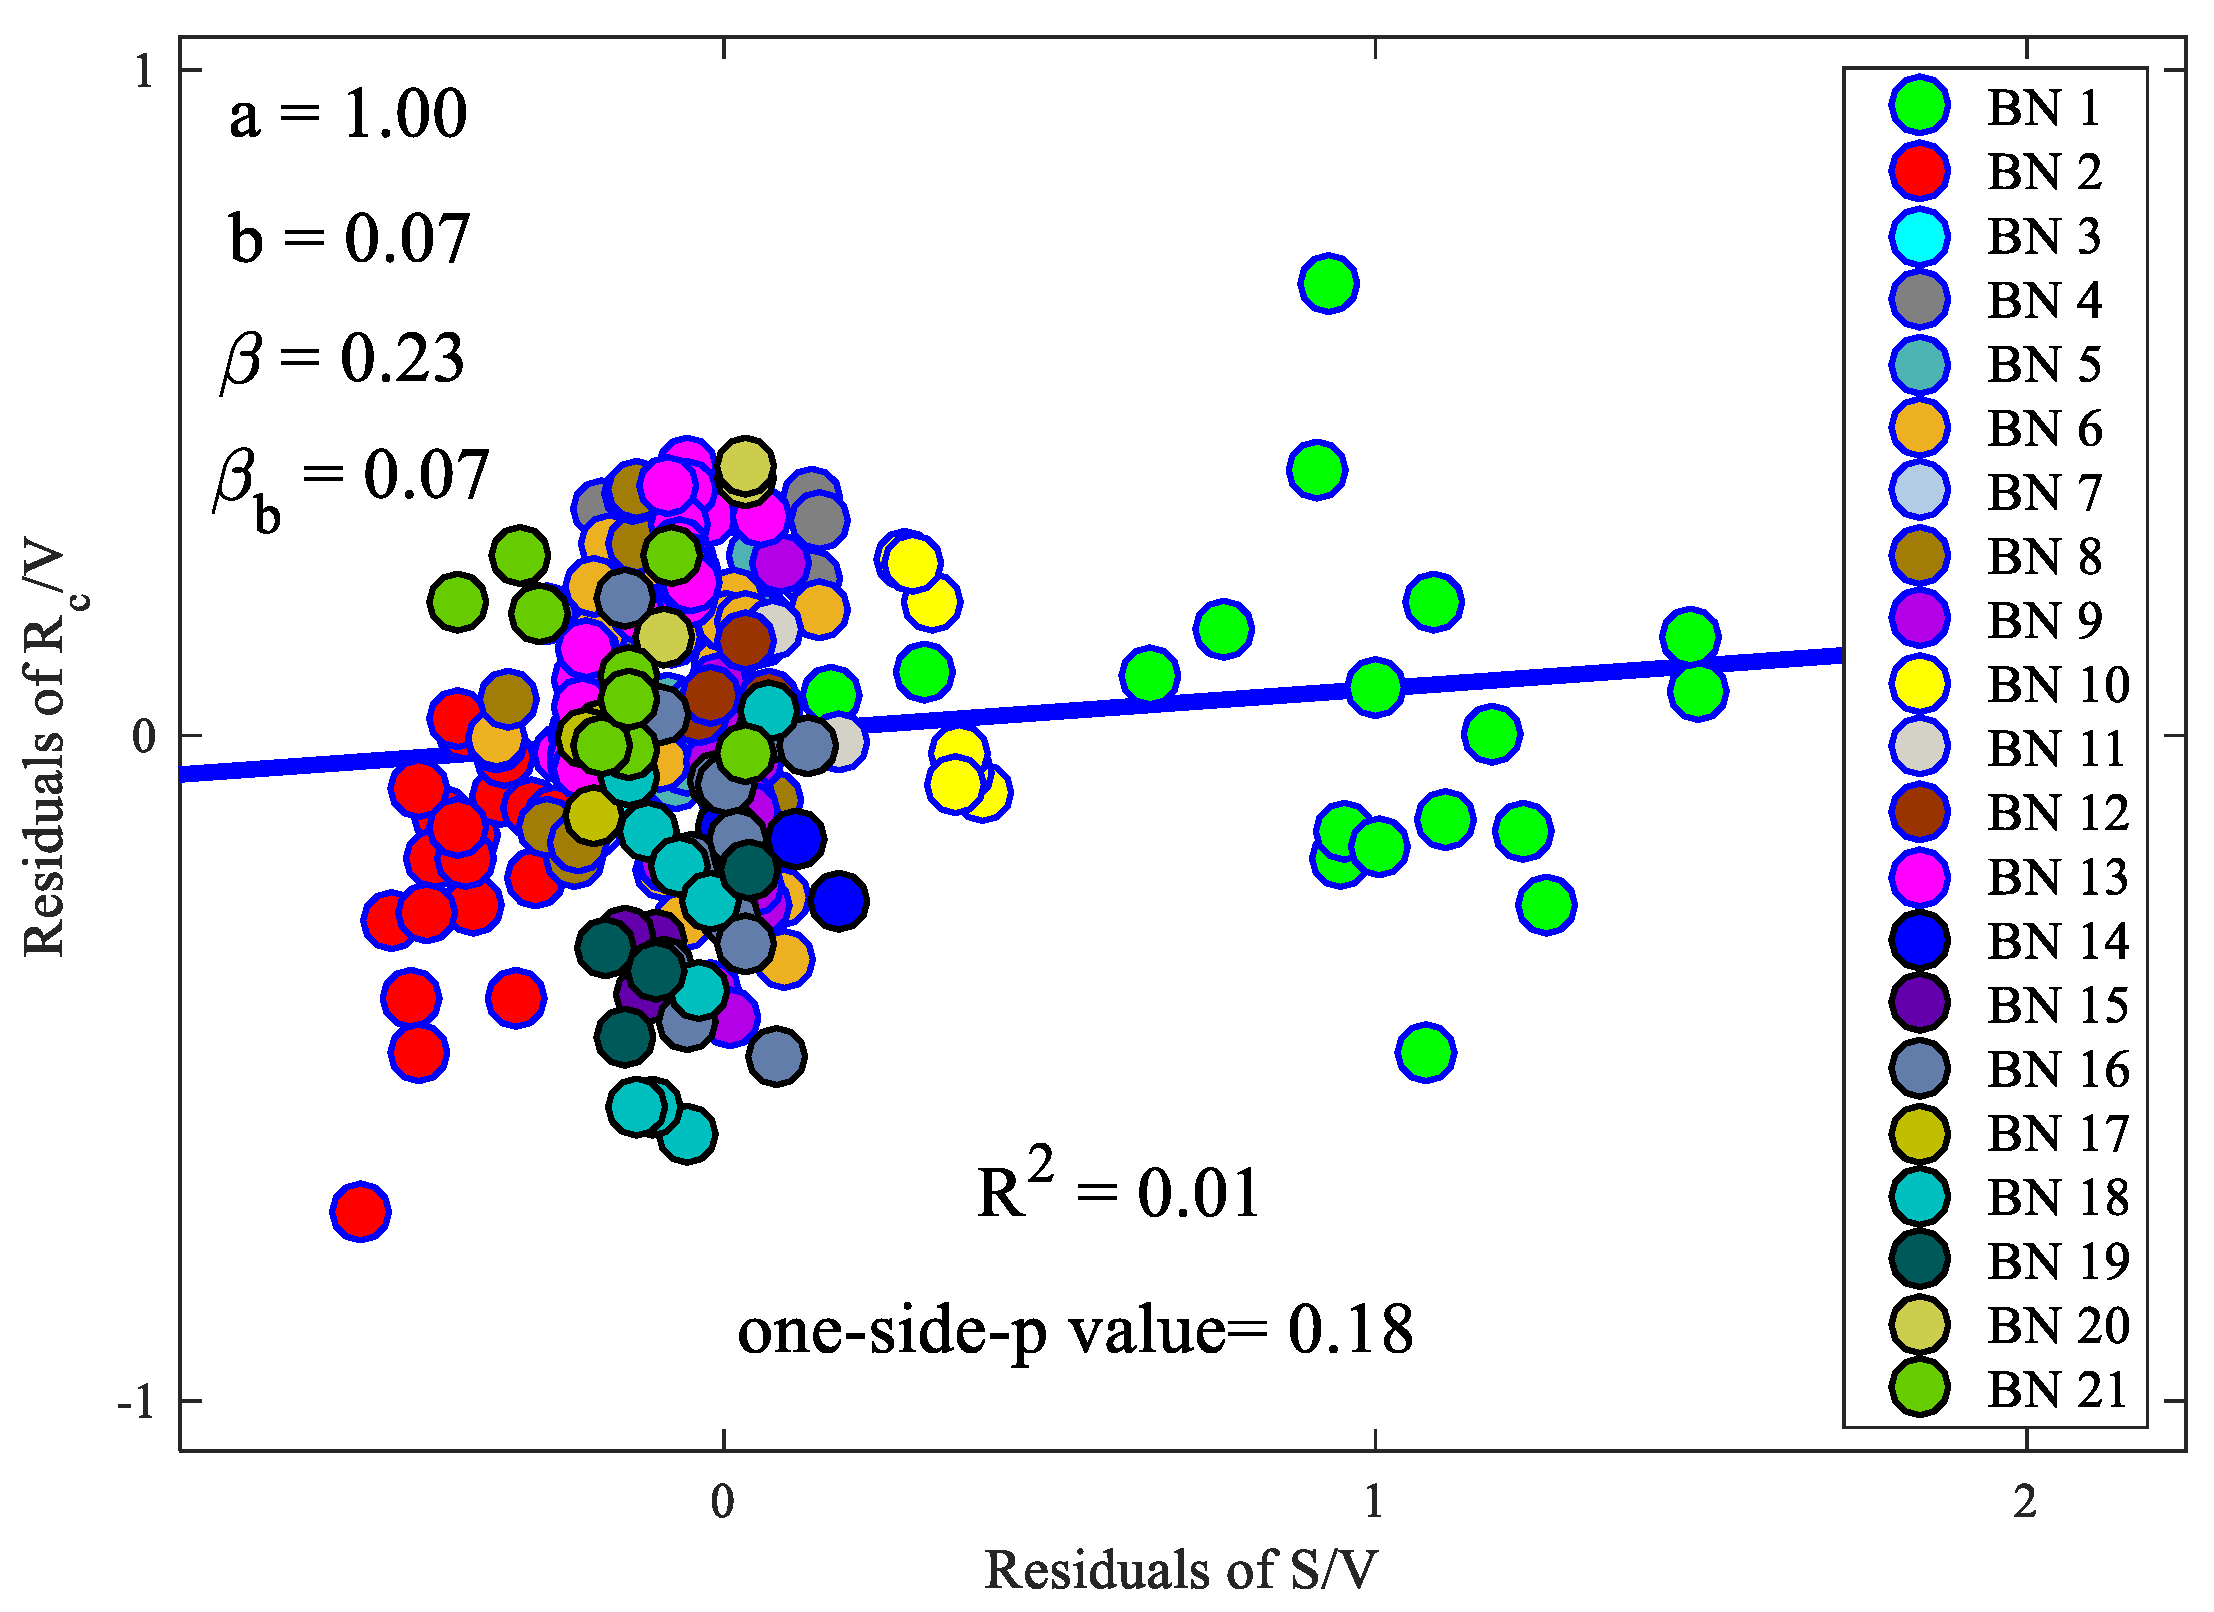
3.3.3. Significance Test for the Rebound Index S in the Regression
3.3.4. The Uncertainty Characterization of Concrete Strength Based on Both Destructive and Non-Destructive Tests
3.3.5. Non-Destructive Data Relative Weights for the Concrete Compressive Strength Estimation
4. Conclusions
- The logarithmic linear regression model (lnV-lnRc) can be adopted instead of the logarithmic multilinear model (lnV-lnS-lnRc) without significant loss of accuracy. This is also confirmed from the significance test of the rebound index S in the regression.
- It is good to have an own regression for each specific building among destructive and non-destructive tests. However, it can be noted that the proposed multilinear regression model has a good fit with respect to the considered data that allows its usage for similar data.
- The relative weights of non-destructive tests for calculating concrete compressive strength are derived based on the proposed probabilistic workflow. The mean of the weights is very close to the relative weight recommended in the NTC 2018 Commentary, which assigns a value of 1/3 to non-destructive tests.
Author Contributions
Funding
Data Availability Statement
Conflicts of Interest
References
- UNI EN 12504-2; Prove sul Calcestruzzo Nelle Strutture—Prove non Distruttive—Determinazione Indice Sclerometrico. UNI: Milan, Italy, 2001.
- UNI EN 12504-4; Testing Concrete—Part 4: Determination of Ultrasonic Pulse Velocity. UNI: Milan, Italy, 2004.
- Bungey, J.H.; Grantham, M.G. Testing of Concrete in Structures; CRC Press: Boca Raton, FL, USA, 2014. [Google Scholar]
- UNI EN 12504-1; Removal from Concrete in Structures—Carrots—Removal, Examination and Compression Test. UNI: Milan, Italy, 2002.
- NTC. D. M. Infrastrutture Trasporti 17 Gennaio 2018, Norme Tecniche per le Costruzioni, G.U. 20 febbraio 2018 n. 42—Suppl. Ord., Rome, Italy. 2018. Available online: https://www.studiopetrillo.com/ntc2018.html (accessed on 5 August 2023).
- Facaoaru, I. Romanian Achievements in Nondestructive Strength Testing of Concrete. In In Situ/Nondestructive Testing of Concrete; ACI Publication: Farmington Hills, MI, USA, 1984; Volume 82, pp. 35–56. [Google Scholar]
- Bartlett, F.M.; MacGregor, J.G. Statistical Analysis of the Compressive Strength of concrete in Structures. ACI Mater. J. 1996, 93, 158–168. [Google Scholar]
- Bartlett, F.M. Precision of in-place concrete strengths predicted using core strength correction factors obtained by weighted regression analysis. Struct. Saf. 1997, 19, 397–410. [Google Scholar] [CrossRef]
- Di Leo, A.; Pascale, G. Prove non distruttive sulle costruzioni in c.a. Il G. Delle Prove Non Distruttive 1994, 4. [Google Scholar]
- Del Monte, E.; Lavacchini, G.; Vignoli, A. Modelli per la previsione della resistenza a compressione del calcestruzzo in opera. Ing. Sismica 2004, 3, 30–40. [Google Scholar]
- Masi, A. La stima della resistenza del calcestruzzo in situ mediante prove distruttive e non distruttive. Il G. Delle Prove Non Distruttive 2005, 1. [Google Scholar]
- Masi, A.; Vona, M. La stima della resistenza del calcestruzzo in-situ: Impostazione delle indagini ed elaborazione dei risultati. In Progettazione Sismica; IUSS Press: Las Cruces, NM, USA, 2009; Volume 1, ISSN 1973-7432. (In Italian) [Google Scholar]
- RILEM. NDT 4 Recommendations for in situ concrete strength determination by combined non-destructive methods. In Compendium of RILEN Technical Recommendations; E&FN Spon: London, UK, 1993. [Google Scholar]
- Gasparik, I. Prove Non Distruttive nell’Edilizia. In Quaderno Didattico AIPND; Associazione Italiana Prove Non Distruttive: Brescia, Italy, 1992. [Google Scholar]
- Qasrawi, H.Y. Concrete strength by combined nondestructive methods simply and reliably predicted. Cem. Concr. Res. 2000, 30, 739–746. [Google Scholar] [CrossRef]
- Breysse, D.; Klysz, G.; Dérobert, X.; Sirieix, C.; Lataste, J.F. How to combine several non-destructive techniques for a better assessment of concrete structures. Cem. Concr. Res. 2008, 38, 783–793. [Google Scholar] [CrossRef]
- Breysse, D. Nondestructive evaluation of concrete strength: An historical review and a new perspective by combining NDT methods. Constr. Build. Mater. 2012, 33, 139–163. [Google Scholar] [CrossRef]
- Breysse, D.; Martínez-Fernández, J.L. Assessing concrete strength with rebound hammer: Review of key issues and ideas for more reliable conclusions. Mater. Struct. 2014, 47, 1589–1604. [Google Scholar] [CrossRef]
- Monti, G.; Alessandri, S. Application of Bayesian techniques to material strength evaluation and calibration of confidence factors. In Proceedings of the Reluis Research Project Final Workshop, Naples, Italy, 5–6 July 2009. [Google Scholar]
- Giannini, R.; Sguerri, L.; Paolacci, F.; Alessandri, S. Assessment of concrete strength combining direct and NDT measures via Bayesian inference. Eng. Struct. 2014, 64, 68–77. [Google Scholar] [CrossRef]
- Trtnik, G.; Kavčič, F.; Turk, G. Prediction of concrete strength using ultrasonic pulse velocity and artificial neural networks. Ultrasonics 2009, 49, 53–60. [Google Scholar] [CrossRef] [PubMed]
- Pereira, N.; Romão, X. Assessment of the concrete strength in existing buildings using a finite population approach. Constr. Build. Mater. 2016, 110, 106–116. [Google Scholar] [CrossRef]
- Vasanelli, E.; Colangiuli, D.; Calia, A.; Luprano, V.A. Estimating in situ concrete strength combining direct and indirect measures via cross validation procedure. Constr. Build. Mater. 2017, 151, 916–924. [Google Scholar] [CrossRef]
- Jalayer, F.; Ebrahimian, H. Seismic reliability assessment and the nonergodicity in the modelling parameter uncertainties. Earthq. Eng. Struct. Dyn. 2020, 49, 434–457. [Google Scholar] [CrossRef]
- Ebrahimian, H.; Jalayer, F.; Asprone, D.; Lombardi, A.M.; Marzocchi, W.; Prota, A.; Manfredi, G. An outlook into time-dependent aftershock vulnerability assessment. In Proceedings of the 4th ECCOMAS Thematic Conference on Computational Methods in Structural Dynamics and Earthquake Engineering (COMPDYN2013), Kos Island, Greece, 12–14 June 2013; Papadrakakis, M., Papadopoulos, V., Plevris, V., Eds.; National Technical University of Athens: Athens, Greece, 2014. [Google Scholar]
- Miano, A.; Sezen, H.; Jalayer, F.; Prota, A. Performance based comparison of different retrofit methods for reinforced concrete structures. In Proceedings of the 6th ECCOMAS Thematic Conference on Computational Methods in Structural Dynamics and Earthquake Engineering (COMPDYN), Rhodes, Greece, 15–17 June 2017. [Google Scholar]
- Miano, A.; Jalayer, F.; Prota, A. Considering Structural Modeling Uncertainties using Bayesian Cloud Analysis. In Proceedings of the 6th ECCOMAS Thematic Conference on Computational Methods in Structural Dynamics and Earthquake Engineering (COMPDYN), Rhodes, Greece, 15–17 June 2017. [Google Scholar]
- Jalayer, F.; Ebrahimian, H.; Miano, A. Intensity-based demand and capacity factor design: A visual format for safety checking. Earthq. Spectra 2020, 36, 1952–1975. [Google Scholar] [CrossRef]
- Jalayer, F.; Ebrahimian, H.; Miano, A. Record-to-record variability and code-compatible seismic safety-checking with limited number of records. Bull. Earthq. Eng. 2021, 19, 6361–6396. [Google Scholar] [CrossRef]
- Ebrahimian, H.; Jalayer, F. Selection of seismic intensity measures for prescribed limit states using alternative nonlinear dynamic analysis methods. Earthq. Eng. Struct. Dyn. 2021, 50, 1235–1250. [Google Scholar] [CrossRef]
- Commentary of NTC 2018. Supplemento ordinario alla Gazzetta Ufficiale, n. 35 del 11 Febbraio 2019. Ministero delle Infrastrutture e dei Trasporti, Circolare 21 Gennaio 2019 “Istruzioni per applicare dell’ «Aggiornamento delle Norme tecniche per le costruzioni»., Rome, Italy. Available online: https://www.gazzettaufficiale.it/eli/id/2019/02/11/19A00855/sg (accessed on 5 August 2023).
- CSLP Guidelines, 2017. Linee Guida per la Valutazione delle Caratteristiche del Calcestruzzo in Opera, 2017, Consiglio Superiore dei LL.PP n. 80/2016, 30 marzo 2017, Rome, Italy. Available online: https://cslp.mit.gov.it/normative-tecniche (accessed on 5 August 2023).
- UNI EN 13791; Assessment of In-Situ Compressive Strength in Structures and Precast Concrete Components. UNI: Milan, Italy, 2007.
- Dolce, M.; Masi, A.; Ferrini, M. Estimation of the actual in-place concrete strength in assessing existing RC structures. In Proceedings of the Second International FIB Congress, Naples, Italy, 5–8 June 2006. [Google Scholar]
- Reluis-DPC Guidelines. Linee Guida per Modalità di Indagine Sulle Strutture e sui Terreni per i Progetti di Riparazione, Miglioramento e Ricostruzione di Edifici Inagibili, DPC-Reluis; Doppiavoce Editore: Napoli, Italy, 2012. [Google Scholar]
- Collepardi, M. Il Nuovo Calcestruzzo. Quarta edizione. 2006. Available online: https://www.cias-italia.it/uploads/18.pdf (accessed on 5 August 2023).
- Faella, C.; Guadagnuolo, M.; Donadio, A.; Ferri, L. Calibrazione sperimentale del metodo SonReb per costruzioni della Provincia di Caserta degli anni’60–’80. In Proceedings of the 14th ANIDIS Conference (Convegno Nazionale L’Ingegneria Sismica in Italia), Bari, Italy, 18–22 September 2011. [Google Scholar]
- ACI 214.4R-03; Guide for Obtaining Cores and Interpreting Compressive Strength Results. American Concrete Institute (ACI): Detroit, MI, USA, 2003.
- Miano, A.; Jalayer, F.; Ebrahimian, H.; Prota, A. Cloud to IDA: Efficient fragility assessment with limited scaling. Earthq. Eng. Struct. Dyn. 2018, 47, 1124–1147. [Google Scholar] [CrossRef]
- Miano, A.; Cademartori, M.; Fiorillo, A.; Figundio, A.; Di Ludovico, M.; Prota, A. Remarks on the experimental behaviour of curved surface sliders of the new Polcevera Bridge in Genoa. Struct. Infrastruct. Eng. 2023, 1–15. [Google Scholar] [CrossRef]
- UNI EN 12390-1; Testing Hardened Concrete—Part 1: Shape, Dimensions and Other Requirements for Specimens and Moulds. UNI: Milan, Italy, 2012.
- UNI EN 12390-2; Testing Hardened Concrete—Part 2: Making and Curing Specimens for Strength Tests. UNI: Milan, Italy, 2019.
- UNI EN 12390-3; Testing Hardened Concrete—Part 3: Compressive Strength of Test Specimens. UNI: Milan, Italy, 2019.
- Masi, A.; Vona, M. Prove distruttive e non distruttive su materiali ed elementi strutturali di edifici esistenti in cemento armato. In Conferenza Nazionale sulle PnD, Monitoraggio e Diagnostica. Proceedings of the 12° Congresso Nazionale dell’AiPnD, Biennale PnD-MD, Milano, Italy, 11–13 October 2007; AiPnD: Brescia, Italy, 2007. [Google Scholar]
- Brognoli, M. Prove e Controlli non Distruttivi per la Verifica Degli Edifici Esistenti Secondo la Normativa Sismica e le Norme Tecniche per le Costruzioni, Brescia 15 Giugno 2007. Available online: https://www.comune.bagnolomella.bs.it/zf/index.php/trasparenza/index/visualizza-documento-generico/categoria/179/page/6/documento/775 (accessed on 5 August 2023).
- Ghersi, A. Corso di Aggiornamento: Progettazione Strutturale e Norme Tecniche per le Costruzioni, Verifica Sismica di Edifici Esistenti in c.a., Indagini Sulle Strutture in c.a. Imola, 16–18 Maggio 2013. Available online: http://www.dica.unict.it/users/aghersi/Persone/CurrGhersi.pdf (accessed on 5 August 2023).
- Rice, J.A. Mathematical Statistics and Data Analysis, 2nd ed.; Duxbury Press: London, UK, 1995. [Google Scholar]
- Verderame, G.M.; Stella, A.; Cosenza, E. Le proprietà meccaniche dei calcestruzzi impiegati nelle strutture in ca realizzate negli anni’60. In Proceedings of the X Congresso Nazionale L’ingegneria Sismica in Italia, Potenza-Matera, Italy, 9–13 September 2001. [Google Scholar]


| BN * | CP * | Total Number of Tests | Tests on Beams | Tests on Columns | Tests on Walls | Average Rc | Standard Deviation Rc |
|---|---|---|---|---|---|---|---|
| 1 | 60s–70s | 18 | 8 | 10 | 0 | 20.96 | 6.70 |
| 2 | 60s–70s | 21 | 11 | 10 | 0 | 13.73 | 3.41 |
| 3 [44] | 70s | 3 | 3 | 0 | 0 | 19.78 | 1.91 |
| 4 | 70s | 9 | 4 | 5 | 0 | 24.24 | 3.31 |
| 5 | 80s–90s | 26 | 0 | 5 | 21 | 29.41 | 3.88 |
| 6 | 70s–80s | 21 | 19 | 2 | 0 | 25.86 | 6.61 |
| 7 | - | 3 | 3 | 0 | 0 | 27.00 | 2.11 |
| 8 [45] | - | 10 | - | - | - | 14.30 | 3.75 |
| 9 | 80s | 17 | 0 | 0 | 17 | 19.98 | 6.33 |
| 10 | 60s–70s | 7 | 5 | 1 | 1 | 18.47 | 4.26 |
| 11 | 30s–40s | 3 | 1 | 2 | 0 | 17.98 | 1.71 |
| 12 | - | 4 | 1 | 3 | 0 | 35.95 | 2.17 |
| 13 | 90s | 30 | 3 | 21 | 6 | 30.43 | 6.03 |
| 14 | 30s–40s | 4 | 2 | 2 | 0 | 18.36 | 3.12 |
| 15 | 30s–40s | 3 | 1 | 2 | 0 | 18.56 | 4.34 |
| 16 | 30s–40s | 14 | 6 | 8 | 0 | 18.22 | 4.28 |
| 17 | 80s | 3 | 0 | 3 | 0 | 27.60 | 2.21 |
| 18 | 60s | 9 | 9 | 0 | 0 | 17.42 | 6.93 |
| 19 | 80s | 4 | 4 | 0 | 0 | 15.50 | 1.92 |
| 20 | - | 3 | 0 | 3 | 0 | 28.00 | 5.63 |
| 21 [46] | 80s | 9 | 9 | 0 | 0 | 17.99 | 5.48 |
Disclaimer/Publisher’s Note: The statements, opinions and data contained in all publications are solely those of the individual author(s) and contributor(s) and not of MDPI and/or the editor(s). MDPI and/or the editor(s) disclaim responsibility for any injury to people or property resulting from any ideas, methods, instructions or products referred to in the content. |
© 2023 by the authors. Licensee MDPI, Basel, Switzerland. This article is an open access article distributed under the terms and conditions of the Creative Commons Attribution (CC BY) license (https://creativecommons.org/licenses/by/4.0/).
Share and Cite
Miano, A.; Ebrahimian, H.; Jalayer, F.; Prota, A. Reliability Estimation of the Compressive Concrete Strength Based on Non-Destructive Tests. Sustainability 2023, 15, 14644. https://doi.org/10.3390/su151914644
Miano A, Ebrahimian H, Jalayer F, Prota A. Reliability Estimation of the Compressive Concrete Strength Based on Non-Destructive Tests. Sustainability. 2023; 15(19):14644. https://doi.org/10.3390/su151914644
Chicago/Turabian StyleMiano, Andrea, Hossein Ebrahimian, Fatemeh Jalayer, and Andrea Prota. 2023. "Reliability Estimation of the Compressive Concrete Strength Based on Non-Destructive Tests" Sustainability 15, no. 19: 14644. https://doi.org/10.3390/su151914644
APA StyleMiano, A., Ebrahimian, H., Jalayer, F., & Prota, A. (2023). Reliability Estimation of the Compressive Concrete Strength Based on Non-Destructive Tests. Sustainability, 15(19), 14644. https://doi.org/10.3390/su151914644