Abstract
The development of industrial parks plays an important role in the economic development of developed and developing countries, but it has recently been affected by globalization and the rise of environmental protection awareness, as 2050 net-zero carbon emissions are being pursued by the world’s major economies. To make their development more sustainable, this study evaluates the operational management performance of industrial parks in Taiwan from the perspective of ESG, to inform future industrial development strategies and policy research. First, 61 industrial parks managed by the Taiwanese Ministry of Economic Affairs (MOEA) were selected and underwent a fuzzy Delphi expert questionnaire to screen the ESG-oriented performance indicators; performance was evaluated through the data envelopment analysis (DEA) undesirable outputs model and the window analysis method. The results indicate that the New Taipei Industrial Park performed best in terms of ESG, followed by the Feng-Shan and Anping industrial parks, with the worst performance from the Mei-Lun, Yun-Lin Island, and Hu-Pin industrial parks. Regarding factors affecting the performance of operation management, a Mann–Whitney U test showed that the northern industrial parks performed significantly better than those in the eastern region, those in the municipalities significantly outperformed the nonmunicipalities, and the industrial parks with more clustered industries and those in areas with convenient transportation performed substantially better. Finally, this study summarizes the important issues facing Taiwan’s industrial parks, and it makes policy recommendations, including promoting ESG sustainable development objectives in their operation and management, as well as increasing the investment of government resources and the clustering of industries and transportation.
1. Introduction
Industrial development tends to use industrial clusters to enhance a country’s overall economy, and the development of industrial parks can promote industrial clustering. Therefore, the development of industrial parks plays an important role in the economic development of both developed and developing countries. Taking the Taiwanese region as an example, the current planned industrial land area is about 48,000 hectares, accounting for approximately 1.35% of the total land area in the country [1]. According to the statistics of the General Accounting Office of the Executive Yuan of the Taiwanese government, the value of manufacturing industries created by industrial parks accounts for 49% of the country’s total output value, and the value of production and gross domestic product (GDP) created accounts for more than 30% in Taiwan. This indicates that the value derived from industrial parks makes a high contribution to economic development.
However, in recent years, because of globalization and the rising awareness of environmental conservation, the development of industrial parks has been affected to a certain extent, which in turn influences national economic structure and development. Thus, the performance of the parks’ operation and management is gradually gaining attention in order to achieve a balance among economic, environmental, and social aspects and move toward sustainable development. In 2015 the United Nations proposed the Sustainable Development Goals (SDGs), which consist of 17 targets and 169 subindicators, covering ending poverty; eradicating hunger; promoting gender equality; providing clean water, affordable green energy, and responsible consumption and production; and taking climate action. The targets span economic, social, and environmental aspects, with the aim of leading the world to sustainability by 2030 [2].
In order to achieve the SDGs, the pursuit of net-zero carbon emissions has become the unanimous goal of the world’s major economies in recent years; this also reflects the determination of countries to actively declare a fight against climate change. In response to the global net-zero trend and the pressure for carbon reduction in the supply chain, the need for industrial transformation is urgent. Most countries have set net-zero emission targets to echo the global trend, and the EU has even proposed the Carbon Border Adjustment Mechanism (CBAM). This requires payment for CBAM certificates for imported products according to their carbon content, in order to accelerate the process of carbon emission reduction in various countries. Therefore, countries around the world have proposed net-zero transformation policies; for example, the United Kingdom regards net-zero transformation as a “green industrial revolution”, and Japan has formulated a “2050 carbon neutral green growth strategy”. In line with the SDGs and the international trend of sustainable industrial development, in March 2022, the Taiwanese government officially announced “Taiwan’s Pathway to Net-Zero Emissions in 2050”, which provides the four action strategies of “energy transition”, “industrial transition”, “life transition”, and “social transition”, as well as the two foundations of “technology R&D” and “climate legislation”. These are complemented by “12 key strategies” to formulate action plans for the key areas of expected growth in energy, industry, and life transition policies, to achieve the goal of net-zero transition [3].
On the whole, achieving net-zero emissions by 2050 is already a mainstream trend in international economic, environmental, and social development. Although current technology is not yet able to achieve this target, the EU has set a breakthrough plan to reach the milestone by 2030. Therefore, the goal of 2050 net-zero emissions has driven the development of the industrial sector throughout the world. However, the future direction of promoting sustainable industrial development, and how to progressively implement it and align with the SDGs and 2050 net-zero emission targets, will become an important issue.
Given the impact of SDGs, the ESG (environmental, social, governance) characteristics of companies provide the means and process for attaining these goals. The UN Global Compact first introduced the concept of ESG in 2004; subsequently, a series of international initiatives, such as the signing of the Paris Climate Accord at the Climate Summit and the establishment of the Sustainability Accounting Standards Board (SASB), has gradually raised the profile of ESG and highlighted the importance of ESG performance for achieving long-term corporate performance and value.
ESG is an international benchmark for evaluating business performance. Its purpose is to assess the sustainability risk of a company, by examining its ability to manage risk and respond to climate change, heatwaves, rising seas, epidemics, social unrest, climate regulations, and other conditions [4]. Therefore, ESG measurement is one of the effective ways to implement SDGs, and different implementation methods and standards will be derived according to the attributes and needs of different industries, rather than being applied in a single package. ESG also represents a kind of corporate social responsibility (CSR). In addition to the basic aim of a company to improve its revenue and output, the sustainable development of society and the environment should also be reflected in a company’s CSR score. Therefore, in recent years, global investors have been using ESG scores as an important indicator for the corporate evaluation of investments [5].
Under the abovementioned international trend, Taiwan’s industrial parks will also move toward sustainable development at the request of the government. However, it is impossible to promote sustainable and environmental protection policies in industrial parks because both governments and companies have limited funds to invest in environmental protection. If the policy of sustainability and environmental protection is implemented, the industrial park manufacturers can hardly cooperate with it, or only a few of them can achieve it, in which case the policy will definitely be a failure. Therefore, when the Taiwanese government implements the 2050 net-zero policy and expands the ESG performance assessment for manufacturers, it is necessary to understand the measurement of ESG indicators and the operational performance of Taiwan’s industrial parks under the ESG framework and to conduct a comprehensive discussion on the ESG performance of Taiwan’s industrial parks, which is also the focus of this research. In other words, this study aims to understand how to evaluate the performance of industrial parks when promoting ESG and net-zero policies, so that government agencies or policymakers have sufficient information before making decisions.
In this study, we try to take the essential meaning of ESG and redefine and establish the performance evaluation indicators applicable to industrial parks under this original framework. We then evaluate the operational management performance of industrial parks, compare the differences in their performance, and further examine the relevant influential factors. Therefore, this study serves not only as an important reference indicator for companies to evaluate their investments but also as a solid foundation for promoting the future trend toward 2050 net-zero emissions.
In order to achieve the above purpose, this study focuses mainly on the ESG tri-directional approach. It establishes a set of performance indicators for industrial park operation and management through the fuzzy Delphi method (FDM) and evaluates the operation and management performance of each industrial park through data envelopment analysis (DEA). Finally, on the basis of the evaluation results, the Mann–Whitney U test (MWU) is used to determine whether there are significant differences in the important factors affecting the industrial parks’ operation and management performance, which will serve as a reference for future industrial development strategies and policy formulation (Figure 1).
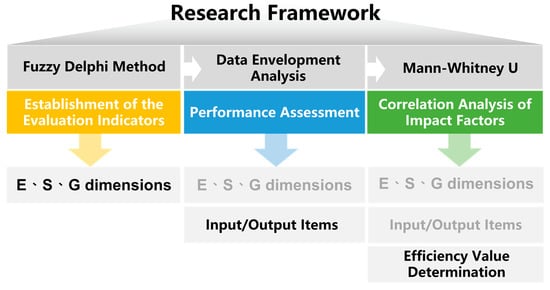
Figure 1.
Schematic Diagram of Research Framework.
In this study, given the characteristics of the DEA method, the sample of industrial parks for the empirical research must be homogeneous, have multiple comparison units, have the same objectives and perform similar work, operate under the same market conditions, and have the same input and output items that affect the performance of the decision-making units [6]. The scope of industrial parks in this study does not include science parks, agricultural and biotechnology parks, and industrial parks developed by local governments or private parties in Taiwan, but rather only the 61 industrial parks under the jurisdiction of the Taiwanese Ministry of Economic Affairs (MOEA) (Figure 2).
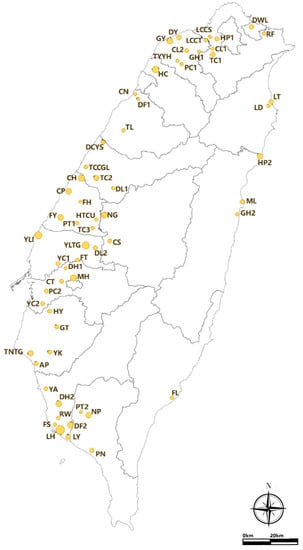
Figure 2.
Distribution of Taiwan’s Industrial Parks.
2. Theoretical Background
2.1. ESG Rating Systems
2.1.1. Original Definition and Meaning of ESG
In recent years, climate change has affected the human living environment, and the rise of human rights and labor awareness has led to ESG’s being widely emphasized in all walks of life; it has gradually become a key basis for judging the competitiveness of enterprises and countries. This study compiles the current international definitions and meaning of ESG as follows (Table 1).

Table 1.
The Meaning and Scope of ESG.
2.1.2. ESG Rating Systems Worldwide
ESG sustainability indicators are not globally applicable and must be adjusted to suit the different types of companies and company lines being evaluated. In order to more accurately present ESG measurement results, many organizations have developed their own scoring systems to measure companies’ ESG, such as Bloomberg, MSCI ESG, S&P SAM, Sustainalytics, ISS ESG, and Rep Risk. These organizations not only have different scoring methods but also vary in their weightings depending on industry attributes, country geography, and location.
For example, MSCI ESG has 10 themes and 37 key indicators under the three major ESG dimensions. Thus, dimension E includes climate change, natural resources, pollution and waste products, the external cost of environmental priorities, and others. Dimension S includes human resources, product responsibility, stakeholder veto, and social opportunities (e.g., communication channels, financing channels). Finally, dimension G contains corporate governance (e.g., board of directors, salaries) and corporate behavior (e.g., business ethics, anticompetitive measures).
2.1.3. ESG Rating Systems in the Taiwan Region
According to the Taiwan Stock Exchange’s sustainability report [7] for its listed companies, ESG is oriented toward seven themes, comprising greenhouse gas emissions, energy management, water resources, and waste products in the E dimension; human resource development in the S dimension; and board of directors and investor communication in the G dimension. Furthermore, the Taiwan Corporate Sustainability Report [8] contains 17 themes and key indicators. In the E dimension, the report includes greenhouse gas emissions, energy use, water resources, air pollutant reporting, general air pollutants, waste product management, toxic chemical reporting, and environmental violations. The S dimension contains employee composition, employee salaries, labor violations, and occupational health and safety. Lastly, the G dimension covers capital amount, operating conditions, whether to produce corporate responsibility reports, tax transparency, and ISO certification.
Comparing the differences between the MSCI ESG and ESG rating systems in the Taiwan region, we know that there are more common thematic items for the E section and fewer common thematic items for the S and G sections. This phenomenon reflects that the ESG evaluation items may differ according to the database construction, national conditions, and different attributes of the subject matter.
Previous studies on the relationship between operational performance and ESG investments found that the higher the transparency of ESG information disclosure and the value of corporate output, the better the operational performance, indicating a highly significant positive correlation between ESG and operational performance [9,10]. Moreover, corporate governance has the strongest relationship with operational performance, followed by social and environmental governance [9].
According to the abovementioned research, ESG measurement indicators and scoring methods vary from country to country, and different evaluation systems are developed according to the national conditions, corporate attributes, and development policies of each country. Therefore, this study will build on the definition of ESG for the operation and management performance of Taiwan’s industrial parks by adding regional characteristics and industrial development attributes.
2.1.4. The ESG Dimensions Defined in this Study
This study will define the ESG indicators that apply to the scope of this study from the perspective of government governance, as follows:
- E dimension: environmental protection, energy saving and carbon reduction, energy transition, green energy etc.; the performance in each industrial park.
- S dimension:
- Internal factors—corporate social responsibility, development (input) costs, employees’ rights and interests, operating conditions, etc. and the performance of each industrial park in terms of social responsibility within the park (enterprise).
- External factors—government input funding, overall business revenue (value of output), and the performance of each industrial park in terms of social responsibility to external social and economic entities.
- G dimension: government policies or measures are used to guide the direction and status of factory operation in the park, including factory area, factory operation and management, factory capital amount, technology research and development, etc., to reflect the performance and effectiveness of government governance in the park.
2.2. Research on the Performance Assessment of Industrial Parks
In order to study industrial parks’ operational and management performance, this study reviews relevant studies on performance assessment. The literature shows that the most commonly applied method for industrial park performance assessment is DEA, which measures the efficiency of regions, spaces, or organizations. This includes the decision-making unit of counties and cities [11], the evaluation of industrial parks by counties and cities [6,12,13,14], the use of industrial parks as the target [15,16], etc. In recent years, some scholars have used eco-efficiency as the performance evaluation index for industrial parks [17,18] and for exploring the energy efficiency of regional industries [19,20]. In addition, there are also studies on the undesirable outputs model [6,13,14,17,19]. The relevant empirical studies are compiled in Table 2.
Table 2.
Research on Performance Assessment of Industrial Parks.
The DEA method can handle multiple input and output items simultaneously and has the property of units invariance [21,22,23]. The inputs and outputs set by DEA in the abovementioned studies are different, as are the representative efficiency values obtained. However, factory shutdowns, unused land, and water/air pollution are unavoidable and undesirable outputs of industrial park operation and management, and even more resources are needed to deal with them. Therefore, when assessing the efficiency of industrial park operation and management, it is necessary to consider not only the intended outputs but also the undesirable outputs [24,25,26]. Hence, the DEA has been used in public policy and practice to introduce undesirable outputs as an output item, instead of considering only the intended output. In this study, we employ the undesirable output model proposed by Tone and Tsutsui [27] to assess the industrial parks’ operational and management performance.
3. Model Establishment and Methodology
In this study, three research methods were selected to explore the operational management performance of Taiwan’s industrial parks under various dimensions of ESG. These comprised the first step of establishing evaluation indicators by FDM, the second step of assessing operational management performance by DEA, and then using DEA window analysis to further improve the accuracy of the data and conduct cross-year comparisons. In the third step, the MWU test identified any significant differences in the relevant factors affecting the operational and management performance of industrial parks. In this section, we explain how the research model was constructed and the three research methods.
3.1. Model Establishment
This study uses the three ESG dimensions as the overall research framework, and the three main research components are combined with their corresponding research methods to constitute this research design model. As shown in Figure 3, the first level contains the research components: the first step is establishing operational management evaluation indicators, the second step is assessing the operation management performance of each industrial park, and the third step is improving the operation management performance of the park. The second level consists of the corresponding research methods: the first method is applying the FDM, the second method is applying the DEA and window analysis methods, and the third method is applying the MWU test. These two levels are focused on the ESG dimensions, in terms of both research components and the corresponding research methods. The design model of this study is shown in Figure 4, which connects the various ESG dimensions throughout the overall research framework and combines the two levels of research components and research methods.
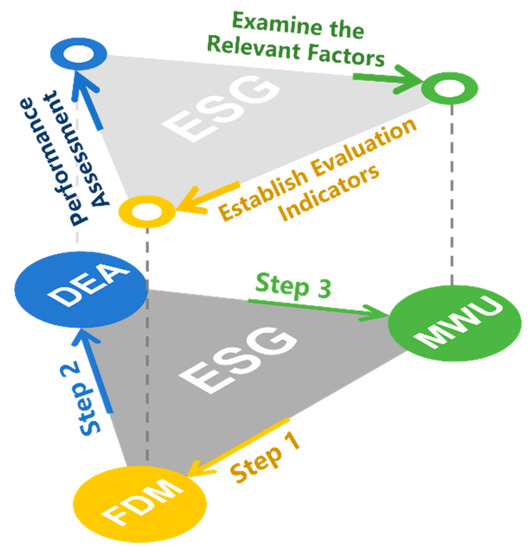
Figure 3.
Schematic Diagram of Research Concept Hierarchy.
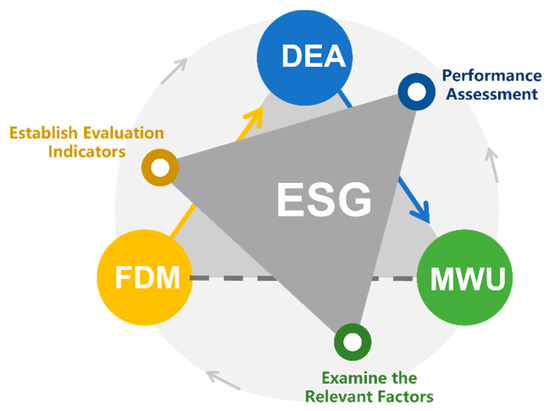
Figure 4.
Schematic Diagram of the Research Design.
3.2. FDM: Establishing Operation Management Performance Evaluation Indicators
FDM is a method for conducting factor screening. Murray et al. [28] proposed combining the traditional Delphi method with fuzzy theory, to correct the former’s shortcomings by using the concept of cumulative number assignment and fuzzy points to integrate expert opinions into fuzzy numbers and, through professional judgment, to determine a possible interval for each question in the questionnaire to solve the fuzzy problem of expert consensus [29,30]. FDM is an integrated quantitative and qualitative research method that saves survey time and allows the semantic structure of the predictions to be clearly expressed; it can be applied to find the expert consensus value in the case of uncertainty, complexity, or controversial arguments [31,32,33,34].
The performance evaluation indicators of industrial park operation and management involve a wide range of factors, including the external environment, the social or political system, the internal operation and management of enterprises or factories, and the corporate system, all of which require a high degree of professional judgment and professional advice from experts and scholars. Therefore, we used FDM expert questionnaires to establish operational management performance evaluation indicators. The ESG evaluation indicators of this study were selected through a literature review and a preliminary screening of the items applicable to this study, and then the three dimensions of E, S, and G were used to differentiate and define each indicator item. Moreover, the ESG indicators were then screened by using an expert questionnaire.
In addition, given that this study applies the DEA, which can evaluate the efficiency of multiple inputs and outputs at the same time, the mathematical algorithm model has already dealt with the parameter weights of each factor. There was no need to set the weights of each factor in advance, and the weight values were not affected by human subjective factors; hence, the evaluation process was fairer and more objective [22]. Therefore, in this study, after the FDM was used to establish the evaluation indicators, the weighting of each factor was not handled by other methods, such as AHP.
3.3. DEA and Window Analysis: Assessing the Industrial Parks’ Operation and Management Performance
DEA is a method that uses data to perform an envelope analysis. A mathematical quantitative linear planning model is used to generate a set of optimal weights that can be objectively applied and combined with multiple inputs and outputs to form a composite indicator that measures the efficiency of an individual company’s resource use. In addition, the method has unit invariance, which means that even if the units of each input and output item are different, the efficiency can be evaluated by using the same units of measurement for each decision-making unit (DMU).
In addition to the BCC model proposed by Banker, Charnes, and Cooper [35] and the CCR model of Charnes, Cooper, and Rohdes [36], DEA has several extended or improved assessment models. Undesirable outputs comprise an evaluation model used to measure negative output items. The traditional DEA model posits that the lower the input and the higher the output, the higher the efficiency will be. However, when discussing the environmental, social, and governance aspects, there will be contradictions, such as carbon dioxide emissions, sewage discharge, or waste treatment, which are undesirable outputs of the production process. In order to obtain a more realistic assessment of the efficiency value, this study fully evaluated the DEA’s undesirable output model as the research method, on the basis of the following three dimensions: environmental protection, social responsibility (internal/external), and government governance; furthermore, the distinction between input, output, and undesirable output was used to examine each industrial park’s operation and management performance.
The DEA window analysis assessment method was developed by Klopp [37] to examine the U.S. Army’s recruitment research program. It can also be used to compare the relative efficiency of evaluating units within and between periods, in order to observe the trend and stability of the evaluated units’ efficiency values. This study further examined the efficiency values of industrial park operation and management performance through DEA window analysis, and it compared the efficiency across periods in order to understand the stability and changes of the units over time and to improve the accuracy of the data collected.
3.4. MWU Test: Impact Factor Determination
The MWU test is a ranking of the efficiency values of two groups of DMUs, which is used to examine whether there are significant differences between them. In general, to assess whether the means of two parent groups are the same, a two-samples t-test is used. However, in the DEA model, because the distribution of the sample is unknown and the sample size is small, it may violate an assumption of the t-test. Therefore, we can use the MWU nonparametric test, which was proposed by Mann and Whitney in 1947 [38], to examine whether the medians of the two groups are the same. The point is to identify any significant difference in the ranking of the efficiency values of two groups of DMUs, using an approximate normal distribution to determine this. This study used the MWU test to rank the DMUs according to the efficiency values of the DEA and to determine whether there are significant differences in the factors affecting the industrial parks’ operation and management performance, which will serve as references for future development strategies.
4. Establishment of the Evaluation Indicators
The theoretical background review showed that ESG assessment indicators are not universally applicable. Thus, in this study, we established applicable ESG assessment indicators according to the attributes of the research scope.
4.1. Evaluation Indicator Screening
According to the 2020 Industrial and Commercial Business Operation Introduction by the MOEA of the Taiwanese government [39], the operation management profile of the factories in this study showed a slight upward trend from 2017 to 2020. In the past 2–3 years, in response to the COVID-19 pandemic, we further compared the increase and decrease from 2019 to 2020, among which six items showed negative growth (total annual operating revenue, total annual operating expenses, total investment in fixed assets, average number of employees, average revenue, and revenue per employee), while all other operation management indicators showed positive growth, the highest category being technology transactions.
According to the survey report, the measurement indicators of factory operation and management efficiency in the industrial parks are generally based on the number of factories in operation, the number of employees, operating revenue and expenses, the output value, the total investment in fixed assets, employees’ salaries, research and development funds, technology transactions/purchases, and regional development. In order to understand the operational management efficiency of each park, the data of these items are collected and analyzed to obtain the operational management performance values. Therefore, this study focused on the operation and management performance of industrial parks and used the above items as the basis for establishing indicators.
The scope of this study covers both the operational management efficiency and the performance assessment of the industrial parks, and the meaning of ESG performance is the main theme of this study. Therefore, this study established the evaluation indicators in a way that combines the former three areas (Figure 5) as the basis for the initial screening of the assessment indicators. The ESG meaning items include greenhouse gas emissions, energy consumption and management, air pollution, sewage treatment, and waste production treatment for the environmental protection dimension; labor relations, customer welfare, employee salaries and benefits for the social responsibility dimension; and capital amount, operating conditions, and technology energy for the government governance dimension. In addition, there are no environmental protection dimension items in the operation management efficiency item. The social responsibility dimension includes the number of employees, output value, fixed assets, employee salaries, and regional development, and the government governance dimension includes the number of factories in operation, operating revenue and expenses, research and development, technology transactions, and technology purchases and sales. Moreover, for the environmental protection dimension, the industrial park performance assessment items include water resources, sewage treatment, mineral resources, energy, water consumption/electricity, gas and diesel sales, greenhouse gas emissions, suspended particulate matter, and volume of garbage clearance. The social responsibility dimension includes employment, industrial land area, output value, fixed assets, total salary, total manufacturing production, land price, development costs, and unused land, and the government governance dimension includes factory area, total factory capital, the number of factories, factory revenue, net factory sales, actual foreign capital utilization, and patent applications. In this study, we combined the items in these three categories and used them as indicators for the initial screening of this study.
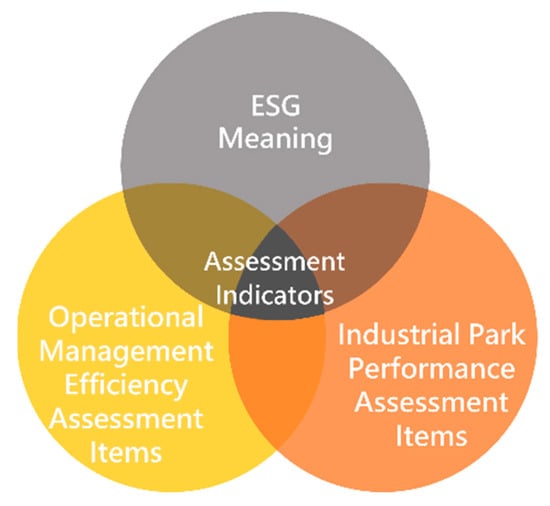
Figure 5.
Conceptual Diagram of the Assessment Metric Screening Approach.
The assessment items listed in the preceding paragraphs were compiled from the literature of previous studies, but not all of them were applicable to the assessment objectives for Taiwan’s industrial parks. In order to establish a set of assessment indicators that matched the national conditions and attributes of industrial parks in Taiwan and to avoid limitations of the subsequent data collection, we first browsed the databases of industrial parks in Taiwan and adjusted the assessment indicators as follows (Table 3), taking into account the development attributes of each industrial park (developed for a long time, mainly manufacturing industries, etc.) and using them as the ESG assessment indicators proposed by the study.
Table 3.
Performance Assessment Indicators for Industrial Park Operation and Management in Taiwan.
4.2. FDM Expert Questionnaire Design and Results Analysis
This study aimed to establish a set of credible and objective indicators for assessing the performance of industrial park operation and management by conducting an FDM expert questionnaire. Given the wide range of expertise and fields involved in this topic, nine experts and scholars from industry, government, academia, and research fields were invited to be interviewed. From different perspectives and backgrounds, the indicators of the industrial park operation and management performance assessment were objectively evaluated and selected on the basis of the participants’ professional skills and rich experience. The questionnaire items were rated on a scale of 0 to 10, higher scores representing higher levels of importance, and each assessment item was given three ratings, including the most appropriate value, the minimum acceptable level, and the maximum acceptable level, according to the expertise of each expert.
A total of nine questionnaires were distributed in June 2022, and all responses were valid. This study collated the most likely importance values assigned to the indicators by the interviewed experts, and it used the generalized model of mean proposed by Klir and Folger [40] to calculate the geometric mean as the consensus of the expert group’s decision. The minimum threshold value of 8 (The threshold value is generally determined by the subjective judgment of the researcher, but it should not be too high or too low in order to obtain an appropriate, meaningful, and sufficient number of assessment indicators; most of the known research literature has used 7 or 8 as the threshold value [41]) was further defined in this study: if the geometric mean of the indicator exceeded 8, this showed that the experts confirmed the indicator’s importance, so the indicator was retained; otherwise, it was excluded. The results of the questionnaire (Table 4) show that 15 indicators were retained and 11 indicators were excluded. For the E dimension, the five reserved indicators were renewable energy purchases, greenhouse gas emissions, electricity consumption, water consumption, and sewage line. For the S dimension, six indicators were reserved, comprising industrial park area, unused land, the number of factory employees, the number of factories announced to be discontinued, government input funding, and output value. For the G dimension, the four indicators were the total factory area, the total factory capital amount, the number of factories, and the total number of patent applications by factories.
Table 4.
Screening Results of Performance Assessment Indicators for Industrial Park Operation and Management.
5. Empirical Results and Analysis
5.1. Data Collection and Definition
The data to be collected for the DEA nonintended output model can be divided into two types: intended output items and unintended output items. In order to make the analysis results fit the theme, this study considers the three-dimensional indicators of ESG screened in the previous section and summarizes each assessment item as follows.
For the E dimension, electricity consumption, water consumption, the length of sewage lines, and renewable energy purchases are the input items, and greenhouse gas emissions is the undesirable output item. For the S dimension, the area of industrial park and government input funding are the input items; output value and the number of factory employees are the output items; and unused land in an industrial park and the number of factories announced to be discontinued are the undesirable output items. For the G dimension, total factory area and total factory capital amount are the input items, and the number of factories and the number of patent applications by factories are the output items.
First, the data were collected over a 5-year period from 2017 to 2021 and were sourced mainly from the Industrial Development Bureau of the MOEA of Taiwan, National Statistical Annual Reports of Taiwan (R.O.C), Industrial Park Profiles [42], and the Government Open Database. Second, the sources were supplemented by platform systems, including the Economic Geographic Information System, the Taiwan Industrial Land Supply and Service Information Network, the Industrial Park Manufacturer Information Platform, and the Industrial Data Space System, which were used to compare and correct the data. The followings are the definitions and sources of the various input and output items (Table 5).
Table 5.
Definition of ESG-Dimension Input and Output Items.
5.2. DEA Result
This study used the DEA-Solver software and DEA undesirable output model to evaluate the performance of each industrial park under ESG from 2017 to 2021. The following is an analysis of the overall performance of each industrial park under the three ESG dimensions.
5.2.1. Industrial Parks’ Operation Management Performance in the E Dimension
In the assessment results of operation and management efficiency for environmental protection (Table 6), the industrial parks of TL, CP, FY, NG, CS, and LT score the highest, with an average efficiency value of 1 from 2017 to 2021, which shows that these six industrial parks have better operation and management performance than the other industrial zones. For the rest of the industrial parks, the average efficiency value is greater than 0.5 and is ranked from highest to lowest, including the three industrial parks in AP, TC2, and TCCGL.
Table 6.
Operation Management Efficiency of the Industrial Park in the E Dimension.
Overall, in the E dimension, the efficiency values of operation management in industrial parks show that the central region in Taiwan has the best operational performance, followed by the eastern region, while the northern and southern regions are not as efficient. After reviewing the input and output items, we considered that the possible reasons for this are that the central region has much higher renewable energy purchases in the output items, and lower electricity and water consumption, than the northern and southern regions. Furthermore, the southern region has much higher greenhouse gas emissions in the undesirable output items than the other regions, and the northern and southern regions have much higher electricity and water consumption than the central and eastern regions. The eastern region has lower greenhouse gas emissions and lower energy input costs and therefore has better performance than the northern and southern regions.
5.2.2. Industrial Parks’ Operation Management Performance in the S Dimension
In the assessment results of operation and management efficiency for social responsibility (Table 7), the GH1 Industrial Park has the highest average efficiency value, of 1, from 2017 to 2021, which shows that the operation and management performance of this industrial park is better than other parks. For the rest of the parks, the average efficiency value is greater than 0.5: in descending ranking, the HP1 Industrial Park and the TC1 Industrial Park.
Table 7.
Operation Management Efficiency of the Industrial Park in the S Dimension.
Overall, in the S dimension, the efficiency values of industrial parks show that the northern region has the best operational performance, followed by the southern and central regions, while the eastern region has a negative efficiency value in terms of social responsibility. After reviewing the input and output items, we considered that the possible reasons are that the output value of the output items is much higher in the northern region than in the other regions, and the number of factories announced to be discontinued in the undesirable output items is lower than in the other regions. Furthermore, in the southern region, the output value of the output items and the number of factory employees are slightly higher than in the central region. In the eastern region, the output value of the output items and the number of factory employees are lower, and the proportion of unused land in the parks is larger, so the performance is lower than in the other regions.
5.2.3. Industrial Parks’ Operation Management Performance in the G Dimension
In the assessment results of the operation and management efficiency for government governance (Table 8), the HP1 and FS industrial parks have the highest average efficiency value, of 1, from 2017 to 2021, which shows that these two industrial parks have better operation and management performance than other parks. For the rest of the parks, the average efficiency value of the HTCU Industrial Park is greater than 0.5.
Table 8.
Operation Management Efficiency of the Industrial Park in the G Dimension.
Overall, in the G dimension, the efficiency values of operational management in industrial parks show that the northern region has the best performance, followed by the central and southern regions, while the eastern region has a low efficiency value in government governance. After reviewing the input and output items, we considered that the possible reasons are that the number of factories and the number of patent applications (output items) in the northern region are much higher than those in other regions, while there are more patent applications (output item) in the central region than in the south and fewer factories and patent applications (output items) in the eastern than in other regions; thus, the performance is low.
5.3. Window Analysis of Performance Assessment Results
By using the above analysis results, this study further examines the operational management efficiency of each industrial park through window analysis. The results show that in the E dimension, the industrial parks of RF, GY, CL1, and TYYH have better relative performance in the northern region, with an average efficiency of 0.344, 0.140, 0.119, and 0.116, respectively. The central region has better performance in the industrial parks of NG, CP, FY, and TC2, with efficiency averages of 0.989, 0.973, 0.931, and 0.829, respectively. The southern region has better performance in the industrial parks of AP, FS, PT2, and PC2, with efficiency averages of 0.878, 0.581, 0.179, and 0.165, respectively. The eastern region has better performance in the industrial parks of LT, GH2, and FL, with efficiency averages of 0.690, 0.150, and 0.119, respectively. Overall, the central region performs the best, followed by the southern and northern regions, while the eastern region has a low efficiency performance.
In the S dimension, in the northern region, the industrial parks of GH1, HP1, and TC1 have better performance, with efficiency averages of 0.883, 0.831, and 0.777, respectively. In the central region, the industrial parks of FH, TC2, and DL1 have better performance, with efficiency averages of 0.323, 0.164, and 0.146, respectively. In the southern region, the industrial parks of RW, YA, YC2, and CT have better performance, with efficiency averages of 0.282, 0.234, 0.215, and 0.2, respectively. In the eastern region, the industrial parks of FL, LD, and HP2 have better performance, with efficiency averages of 0.119, 0.029, and 0.027, respectively. Overall, the northern region performs the best, followed by the southern and central regions, while the eastern region has a low efficiency performance.
In the G dimension, in the northern region, the better-performing industrial parks are HP1, TC1, and GH1, with efficiency averages of 0.97, 0.211, and 0.176, respectively. The central region has better performance in the industrial parks of HTCU, TL, DL1, and TC2, with an average efficiency of 0.867, 0.323, 0.305, and 0.107, respectively. In the southern region, the industrial parks of FS, AP, and RW have better performance, with efficiency averages of 0.882, 0.449, and 0.145, respectively. In the eastern region, the industrial parks of FL, GH2, and LT have better performance, with efficiency averages of 0.074, 0.048, and 0.019, respectively. Overall, the northern region performs the best, followed by the central and southern regions, while the eastern region has a low efficiency performance.
According to the above results, the average efficiency values and ranking of operation management in the ESG dimension through the window analysis are summarized in Table 9. In terms of ESG performance, the HP1 Industrial Park in the northern region has the best overall performance, followed by the FS Industrial Park and the AP Industrial Park in the southern region, and the NG Industrial Park and the TC2 Industrial Park in the central region are ranked fourth and fifth, respectively. In addition, the worst overall ESG performance in terms of operational management performance was in the ML Industrial Park in the eastern region, followed by the YL1 Industrial Park in the central region and the HP2 Industrial Park in the eastern region.
Table 9.
Window Analysis of Performance Assessment Results in the ESG Dimension.
5.4. Correlation Analysis of Impact Factors
In this study, the MWU test was used to further analyze the factors that affect the performance of industrial park operation and management. According to Weber’s industrial location theory, in addition to the internal factors (labor force, production materials, etc.), the main external factors affecting industrial parks include regional factors, transportation, and industrial clustering [43]. In this study, it is assumed that the industrial park location is the key factor affecting the performance of operation management. Therefore, we examine whether there is a significant difference in operation management performance with respect to regional factors, administrative zoning, industrial clustering (major industries account for more than 60%), development level (residential and industrial development rate reaches 80%), transportation (500 m from public transportation stations, certain distance from railways, highways, and ports), and other factors.
5.4.1. Efficiency-Value Determination: Regional Factor
In this study, the 22 cities and counties in Taiwan were grouped into four regions: north, central, south, and east; the counties and industrial parks covered are listed in the Appendix A. According to the Mann–Whitney U test (Table 10), the p-values of the test results between regions are under α = 0.1; the northern region performed significantly better than the eastern region, but there were no significant differences between the other regions. The results also show no significant difference in the efficiency values of the industrial parks depending on their region. The performance of the northern industrial parks is significantly better than that of the eastern ones (p-value is 0.062), which also reflects that the northern part of Taiwan is the main region of industrial development, and most of the key industrial companies are operating in those parks. By contrast, the industrial development in the eastern parks is far inferior, resulting in a larger gap between the performances of these regions’ parks.
Table 10.
Regional Factor-Efficiency-Value Determination (p-Value).
5.4.2. Efficiency-Value Determination: Administrative Zoning
According to the Local Government Act of the Taiwan government, areas with a population of 1.25 million or more and with special needs in terms of political, economic, cultural, and metropolitan development are designated as municipalities, and therefore, they receive a higher level of financial resources. In this study, the industrial parks in five municipalities, including New Taipei City, Taoyuan City, Taichung City, Tainan City, and Kaohsiung City, are classified as municipal industrial parks; these amount to 28. Otherwise, the industrial parks in 11 counties, including Keelung City, Hsinchu County, Miaoli County, Changhua County, Nantou County, Yunlin County, Chiayi County, Pingtung County, Yilan County, Hualien County, and Taitung County, are classified as county industrial parks; these amount to 33.
The results of the MWU test (Table 11) show that the p-value is 0.041 (under α = 0.1), which indicates a significant difference between the two industrial park types. The average grade of industrial parks in municipalities is 25.96, which is much lower than that of 35.27 in county industrial parks; this also indicates that the operation and management performance of the municipalities industrial parks is significantly better. However, it also suggests that the government needs to invest more resources to help the county industrial parks to improve their operation and management performance.
Table 11.
Administrative Zoning-Efficiency-Value Determination Result.
5.4.3. Efficiency-Value Determination: Industrial Clustering
In order to examine whether industrial clustering is a factor that affects industrial parks’ operation and management performance, we classified the parks according to the proportion of industrial categories; the benchmark of the industrial clustering effect is whether major industries account for more than 60% of the total industry categories. As a result, only seven industrial parks fulfilled this criterion. According to the results of the MWU test (Table 12), the p-value is 0.046 (under α = 0.1), which shows a significant difference between parks with and without industrial clustering. As shown in Table 12, the average grade of industrial parks with industrial clustering is 18.43, which is much lower than the average grade of industrial parks without industrial clustering, which is 32.62. The results show that industrial clustering is one of the most important factors in improving industrial parks’ operation and management performance.
Table 12.
Industrial Clustering-Efficiency-Value Determination Result.
5.4.4. Efficiency-Value Determination: Development Level
- Residential and commercial development level
We mapped and measured the 61 industrial parks to determine whether the sites’ residential and commercial development level had reached 80% or more. The data were obtained from the municipality or county (city) spatial plans that were approved by the Ministry of Information (MOI) of the Taiwanese government, and they are complemented by the national geographic information system that was built by the Taiwanese government’s Construction and Planning Agency Ministry of the Interior (CPAMI). The results show that 26 industrial parks achieved 80% or more. According to the results of the MWU test (Table 13), the p-value is 0.466 (more than α = 0.1), which shows that there is no significant difference between the two levels of development.
Table 13.
Residential and Commercial Development-Level Efficiency-Value Determination Result.
The results of the study show that whether the industrial park is in a prosperous residential area is not the main factor affecting the operation management performance. Although the policy requires the industrial parks to be in places with greater residential development, it is expected that the industries and the residents will develop together. However, from the perspective of the industrial parks’ development, it does not necessarily mean that their operational performance will be better if they are near areas with prosperous residential development or better urban development.
- 2.
- Industrial development level
We mapped and measured the 61 industrial parks to determine whether their industrial development level had reached 80% or more. The data were obtained from the municipality or county (city) spatial plans that were approved by MOI of the Taiwanese government, and they were complemented with the national geographic information system that was built by the Taiwanese government’s CPAMI. The results show that 20 industrial parks achieved 80% or more. According to the MWU test (Table 14), the p-value is 0.055 (under α = 0.1), which indicates a significant difference between the two.
Table 14.
Industrial Development-Level Efficiency-Value Determination Result.
As shown in Table 14, industrial parks in areas with less than 80% industrial development have an average grade of 24.75, which is much lower than the average of 34.05 for those with industrial development of 80% or more. The results show that the industrial parks with a development rate of at least 80% in the surrounding areas have significantly better operational management performance. In other words, the parks perform better if they are closer to areas with higher industrial development; this effect may be influenced by the surrounding industrial chains and industrial clusters.
5.4.5. Efficiency-Value Determination: Transportation
- Public transportation stations within 500 m
We mapped and measured the 61 industrial parks to determine those within and beyond 500 m of public transportation stations. The data were obtained from the municipality or county (city) spatial plans that were approved by MOI of the Taiwanese government, complemented with the national geographic information system that was built by the Taiwanese government’s CPAMI. The results show that only three industrial parks are within 500 m of public transportation stations, while the rest are outside this radius. According to the results of the MWU test (Table 15), the p-value is 0.376 (more than α = 0.1), which shows no significant difference between the two groups.
Table 15.
Public Transportation Stations’ 500 m Efficiency-Value Determination Result.
This study further finds that most of the industrial parks are in nonurban planning areas, whereas most of the public transportation stations are in urban planning areas. The results show that the surrounding conditions of public transportation stations are not an important factor affecting the operational management performance of industrial parks. However, the policy requires that future industrial parks be within 500 m of a public transportation station; currently, only three industrial parks meet the requirement, and it will be even more difficult to achieve this in the future.
- 2.
- Certain distance from railways, highways, and ports
We mapped and measured the 61 industrial parks to determine whether they are within a certain distance from railways, highways (5 km), and ports (10 km). The data were obtained from the municipality or county (city) spatial plans that were approved by the MOI of the Taiwanese government, complemented with the national geographic information system that was built by the Taiwanese government’s CPAMI. The results show that 37 industrial parks are near railways, highways, and ports. According to the MWU test (Table 16), the p-value is 0.053 (under α = 0.1), which indicates a significant difference between the two groups.
Table 16.
Certain Distance from Railway, Highway, and Port Efficiency-Value Determination Result.
Table 16 shows that operation and management performance is significantly better for industrial parks near railways, highways, and ports—which is probably due to factors such as cargo delivery and the supply chain.
6. Discussion and Conclusions
The current economic and investment environment in Taiwan is harsh, and companies often report that it is difficult to obtain suitable industrial land owing to high land prices in metropolitan areas, the poor location of industrial land provided by the government, and the failure of land-use controls to adjust in a timely manner to meet industrial needs. These factors affect investment, employment, and economic growth. This study takes the ESG-based approach to assess the performance of industrial park operation and management and summarizes the important issues faced by the industrial parks in Taiwan.
6.1. Discussion
The results of this study indicate that the industrial parks with excellent output value performance, such as HP1, CL2, GH1, TC2, CP, YL1, TNTG, and LH, may not be consistent in ESG performance. It is evident that the operation and management of the parks with high output values may not fully incorporate the environmental protection or social responsibility dimensions. The current important sustainable development policies in Taiwan, including Taiwan 2050 Net-Zero Emissions, SDGs, and the ESG indicators used by companies to assess their investments, reflect the global trend to promote sustainable development. In response to national development policies, environmental, social, and governance sustainability is an essential part of sustainable management. Therefore, this study suggests that the government should appropriately include sustainable development indicators in the strategy for the development, operation, and management of industrial parks and that enterprises should start to gradually encourage the industrial parks to implement ESG sustainable development indicators; this will lead Taiwanese industry to promote the overall sustainable development of the environment.
According to the results of this study, the northern region is the main area of industrial development in Taiwan, and most of the key industrial companies are operating here; by contrast, industrial development in the eastern region is much lower, resulting in a large difference in these regions’ performance levels. Furthermore, the ESG performance of the parks in the municipalities is better than that of those in the counties. The results also show that the location and transportation advantages of the northern region contribute to the efficiency of industrial development and that the government inputs more resources into the parks in the municipalities than into those in the counties, according to the classification of municipal financial resources; hence, this is also an important factor affecting the parks’ development efficiency. Therefore, this study recommends that the government input more resources into parks outside the northern region and the parks in county areas, in order to help the industry develop in a balanced way in Taiwan.
The results of this study indicate that the clustering of industries in industrial parks is related to better operation management. The closer parks are to areas with a higher level of industrial development, the better their operation and management performance, thanks to the industrial linkage and industrial clustering factors. However, given the current land policy in Taiwan, the only relevant regulations and orders apply to land-use planning, and the guidance for the overall “industrial” development policy of the country is relatively insufficient. Therefore, this study recommends that in the future, strategic guidance should be introduced through the promotion of cross-regional metropolitan area plans, the strengthening of departmental spatial development strategies and plans, and the formulation of a comprehensive planning approach for industrial land. In addition, the results of the study also show that public transportation stations are not the key factor affecting the operation and management performance of the parks. However, if parks are within a certain distance from railways, highways, and ports, their operation and management performance is significantly better. This means that public transportation is mainly for the use of people, while railways, highways, and ports facilitate convenience factors such as cargo delivery and the supply chain. Therefore, this study recommends that the government take into consideration in the future the convenience of transportation and industrial clustering factors when selecting the location of industrial parks in order to improve their operation and management efficiency.
The results of this study showed that the rate of residential and commercial development is not the key factor affecting the parks’ operation and management performance. However, from the perspective of industrial park development, it does not seem that the surrounding parks’ operation and management performance is better in areas with prosperous residential and commercial development or a higher degree of urban development. Therefore, this study recommends that in the future, in selecting the location of industrial parks, the level of residential and commercial development should not be the main factor in judging the suitability of the location, but rather, the strategic guidance of industrial development as a whole should be the main consideration. However, the current land policy in Taiwan applies the aforementioned regulation, and it is suggested that the relevant policies be reviewed.
In order to promote smart parks, the MOEA of the Taiwanese government has built many information service platforms, including the Economic Geographic Information System, the Taiwan Industrial Land Supply and Service Information Network, the Industrial Park Manufacturer Information Platform, and the Industrial Data Space System. The information from each platform is supplied under the authority and responsibility of different departments, and the information statistics are relatively diverse. In the era of technological innovation, the promotion of smart parks cannot be delayed, and the establishment of various databases is required to provide a technological and intelligent management method through data calculation. The MOEA of the Taiwanese government currently provides a wide range of information service platform systems, and some of the data are publicly available. However, in the data collection process, this study found that some platforms’ information is inconsistent, and there is a need for information integration. Given that ESG assessment requires a large amount of data, and in response to the demand of promoting smart parks, this study recommends that in the future, information platforms be integrated and that a database should be built with a single-windowed platform system to facilitate the collection and application of relevant research.
In summary, this study aims to evaluate the performance of industrial park operation and management from the perspective of government governance. However, if the performance evaluation is conducted from the perspective of enterprise governance, there may be different results and findings. Therefore, the recommendations of a follow-up study can further grasp the actual situation of implementation from the perspective of factory governance and then understand the future promotion of the industrial park under the ESG trend from both the supply side and the demand side.
6.2. Conclusions
At present, the Taiwanese government has not established an effective performance assessment mechanism for the operation and management of industrial parks. Thus, the establishment of a performance assessment mechanism can clarify the actual problems in operation and management; this will provide a supportive production environment for industry and improve the surrounding industries and overall economic development. First, this study used an FDM expert questionnaire to screen the performance indicators of industrial parks’ operation and management, to serve as a basis for performance assessment. Second, the DEA undesirable output model was used to identify the operation and management efficiency of each industrial park under ESG and to understand the advantages and disadvantages of their respective performance levels. Finally, through the MWU test, we reviewed and discussed the existing policies in order to provide a reference for future industrial development policy considerations. On the basis of the results of this study, the following five conclusions are proposed.
- The establishment of performance assessment indicators for industrial park operation and management
In this study, we used the FDM expert questionnaire to select indicators for assessing the operational performance of each industrial park; we summarized the three major dimensions of ESG and identified 26 indicators. As a result of the questionnaire analysis, 15 indicators were retained and 11 were excluded because their geometric mean was less than 8. In the E dimension, the five reserved indicators were renewable energy purchases, greenhouse gas emissions, electricity consumption, water consumption, and sewage line. In the S dimension, the six reserved indicators were industrial park area, unused land in the park, the number of factory employees, the number of factories announced to be discontinued, government input funding, and output value. In the G dimension, the four reserved indicators were total factory area in the industrial park, the total capital amount from factories in the industrial park, the number of factories in the industrial park, and the total number of patent applications by factories in the industrial park.
- 2.
- Input/output items of the DEA undesirable output model
In this study, each input and output item was selected from the ESG perspective by using the results of the previous indicator screening. In the E dimension, the input items were electricity consumption and water consumption, the output items were the length of sewage lines and renewable energy purchases, and the undesirable output item was greenhouse gas emissions. In the S dimension, the input items were the area of the industrial park and government input funding, the output items were output value and the number of factory employees, and the undesirable output items were unused land in the industrial park and the number of factories announced to be discontinued. In the G dimension, the input items were factory area in the industrial park and factory capital amount in the industrial park, and the output items were the number of factories in the industrial park and the number of patent applications in the industrial park.
- 3.
- Assessment results of industrial parks’ operation and management performance
The E dimension: industrial parks in the central region have the best performance in operation management, followed by the eastern region, while the northern and southern regions have lower efficiency values for environmental protection. According to an examination of the input and output items, the possible reasons are that the central region has much higher renewable energy purchase credits than other regions in the output items and lower electricity and water consumption than the northern and southern regions; the southern region has much higher greenhouse gas emissions than other regions (unintended output items); and the northern and southern regions have much higher electricity and water consumption than the central and eastern regions. The eastern region has lower greenhouse gas emissions and lower energy input costs, and it therefore has better performance than the northern and southern regions.
The S dimension: industrial parks in the northern region have the best performance, followed by the southern and central regions, while the efficiency value of the eastern region in the S dimension is not satisfactory. According to an examination of the input and output items, the possible reasons are that the output value in the output items is much higher in the northern region than in the other regions, and the number of factories discontinued (an undesirable output item) is lower than in other regions. In the southern region, the output value and number of factory employees (output items) are slightly higher than those in the central region. In the eastern region, the output value and number of factory employees (output items) are lower, and the amount of unused land in the parks is larger, meaning that the performance is lower than in other regions.
The G dimension: industrial parks in the northern region have the best performance, followed by the central and southern regions, while the eastern region has a low efficiency value in the G dimension. According to an examination of the input and output items, the possible reasons are that the number of factories and number of patent applications of the output items in the northern region are much higher than those in other regions. The number of patent applications in the central region is higher than that in the southern region. In the eastern region, there are fewer factories and patent applications than in the other regions, and therefore, the performance is low.
- 4.
- Window analysis to assess industrial parks’ operation and management efficiency
According to the assessment results of ESG, the average efficiency value and ranking of the window analysis indicated that the HP1 Industrial Park in the northern region had the best overall performance in terms of ESG, followed by FS and AP in the southern region, with the NG and TC2 industrial parks in the central region ranked fourth and fifth, respectively. In addition, the worst overall ESG performance was in the ML industrial park in the eastern region, followed by YL1 in the central region and HP2 in the eastern region.
- 5.
- Examination results of factors affecting industrial parks’ operation and management efficiency
The results of the MWU test show that the northern region parks are in a major industrial development area in Taiwan, and their operation and management performance is significantly better than that of the eastern region parks. The municipal parks significantly outperform the county parks, indicating that the government should increase resources to assist the latter. The clustering of major industries in the parks results in significantly better performance, which indicates that this is one of the important factors affecting the parks’ operation and management. Parks nearer to higher industrial development areas are affected by industrial linkages and clusters, and their operation and management performance is better. Moreover, for parks located in areas with convenient transportation, such as railways, highways, and ports, their operation and management performance is better thanks to convenience factors such as cargo delivery and the supply chain. In addition, there is no significant difference resulting from the level of residential and commercial development and the surrounding area of public transportation stations for pedestrian flow, which means that these two factors do not directly affect the industrial parks’ operation and management efficiency.
Funding
This research received no external funding.
Institutional Review Board Statement
Not applicable.
Informed Consent Statement
Not applicable.
Data Availability Statement
The data presented in this study are available on request from the corresponding author. The data are not publicly available, owing to privacy concerns.
Conflicts of Interest
The author declares no conflict of interest.
Appendix A
The following are the results of the ESG-based operation and management performance assessment of Taiwan’s industrial parks and the comparison table of northern, central, southern, and eastern regions and codes.
Table A1.
Operation Management Efficiency of the Industrial park in ESG Dimension.
Table A1.
Operation Management Efficiency of the Industrial park in ESG Dimension.
| Region | Cities/Counties | Industrial Park | Code | E | S | G | Mean | Rank |
|---|---|---|---|---|---|---|---|---|
| Northern Region | Keelung City | Dawulun Industrial Park | DWL | 0.006 | 0.172 | 0.102 | 0.093 | 29 |
| New Taipei City | Chulin Industrial Park | CL1 | 0.119 | 0.243 | 0.141 | 0.168 | 17 | |
| New Taipei Industrial Park | HP1 | 0.082 | 0.831 | 0.970 | 0.628 | 1 | ||
| Tucheng Industrial Park | TC1 | 0.076 | 0.777 | 0.211 | 0.355 | 7 | ||
| Ruifang Industrial Park | RF | 0.344 | 0.129 | 0.132 | 0.202 | 16 | ||
| Lincou Specific District (2) | LCCS | 0.061 | 0.107 | 0.129 | 0.099 | 26 | ||
| Taoyuan City | Pingchen Industrial Park | PC1 | 0.007 | 0.149 | 0.079 | 0.078 | 35 | |
| Chungli Industrial Park | CL2 | 0.018 | 0.170 | 0.062 | 0.083 | 32 | ||
| Taoyuan Youth Industrial Park | TYYH | 0.116 | 0.094 | 0.160 | 0.123 | 21 | ||
| Dayuan Industrial Park | DY | 0.011 | 0.150 | 0.011 | 0.057 | 44 | ||
| Lincou Specific District (3) | LCCT | 0.013 | 0.085 | 0.059 | 0.052 | 48 | ||
| Guishan Industrial Park | GH1 | 0.012 | 0.883 | 0.176 | 0.357 | 6 | ||
| Guanyin Industrial Park | GY | 0.140 | 0.081 | 0.016 | 0.079 | 34 | ||
| Hsinchu County | Hsinchu Industrial Park | HC | 0.045 | 0.022 | 0.055 | 0.041 | 55 | |
| Miaoli County | Chunan Industrial Park | CN | 0.141 | 0.066 | 0.017 | 0.075 | 37 | |
| Doufen Industrial Park | DF1 | 0.185 | 0.079 | 0.027 | 0.097 | 27 | ||
| Toulou Industrial Park | TL | 0.517 | 0.064 | 0.323 | 0.301 | 11 | ||
| Central Region | Taichung City | Taichung Industrial Park | TC2 | 0.829 | 0.164 | 0.107 | 0.367 | 5 |
| Dali Industrial Park | DL1 | 0.283 | 0.146 | 0.305 | 0.245 | 13 | ||
| Dachia Youth Industrial Park | DCYS | 0.024 | 0.075 | 0.069 | 0.056 | 45 | ||
| Taichung Harbor Related Industrial Park | TCCGL | 0.509 | 0.097 | 0.045 | 0.217 | 15 | ||
| Changhua County | Changpin Industrial Park | CP | 0.973 | 0.009 | 0.014 | 0.332 | 10 | |
| Tanchung Industrial Park | TC3 | 0.002 | 0.134 | 0.065 | 0.067 | 41 | ||
| Fuhsing Industrial Park | FH | 0.022 | 0.323 | 0.056 | 0.134 | 19 | ||
| Chanhsing Industrial Park | CH | 0.257 | 0.063 | 0.040 | 0.120 | 22 | ||
| Fongyuen Industrial Park | FY | 0.931 | 0.093 | 0.009 | 0.344 | 8 | ||
| Shetou Industrial Park | HTCU | 0.041 | 0.104 | 0.867 | 0.337 | 9 | ||
| Pitou Industrial Park | PT1 | 0.028 | 0.089 | 0.092 | 0.070 | 39 | ||
| Nantou County | Nangang Industrial Park | NG | 0.989 | 0.084 | 0.095 | 0.389 | 4 | |
| Chushan Industrial Park | CS | 0.650 | 0.085 | 0.047 | 0.261 | 12 | ||
| Yunlin County | Douliu Industrial Park | DL2 | 0.113 | 0.061 | 0.034 | 0.069 | 40 | |
| Yunlin Science and Technology Industrial Park | YLTG | 0.055 | 0.046 | 0.007 | 0.036 | 56 | ||
| Fengtien Industrial Park | FT | 0.044 | 0.046 | 0.043 | 0.044 | 52 | ||
| Yunlin Island Industrial Park | YLI | 0.005 | 0.034 | 0.000 | 0.013 | 60 | ||
| Yaunchang Industrial Park | YC1 | 0.005 | 0.109 | 0.037 | 0.050 | 50 | ||
| Southern Region | Chiayi County | Chiatai Industrial Park | CT | 0.140 | 0.200 | 0.053 | 0.131 | 20 |
| Puchi Industrial Park | PC2 | 0.165 | 0.100 | 0.017 | 0.094 | 28 | ||
| Minhsiong Industrial Park | MH | 0.143 | 0.058 | 0.031 | 0.077 | 36 | ||
| Douchiao Industrial Park | DH1 | 0.075 | 0.060 | 0.026 | 0.054 | 47 | ||
| Yichu Industrial Park | YC2 | 0.001 | 0.215 | 0.027 | 0.081 | 33 | ||
| Tainan City | Anping Industrial Park | AP | 0.878 | 0.101 | 0.449 | 0.476 | 3 | |
| Tainan Science and Technology Industrial Park | TNTG | 0.113 | 0.157 | 0.055 | 0.108 | 24 | ||
| Yongkang Industrial Park | YK | 0.098 | 0.140 | 0.099 | 0.112 | 23 | ||
| Guantian Industrial Park | GT | 0.012 | 0.080 | 0.036 | 0.043 | 54 | ||
| Hsinying Industrial Park | HY | 0.015 | 0.102 | 0.032 | 0.050 | 51 | ||
| Kaohsiung City | Kaohsiung Linhai Industrial Park | LH | 0.015 | 0.088 | 0.050 | 0.051 | 49 | |
| Fengshan Industrial Park | FS | 0.581 | 0.060 | 0.882 | 0.508 | 2 | ||
| DaFa Industrial Park | DF2 | 0.002 | 0.134 | 0.038 | 0.058 | 43 | ||
| Rainwu Industrial Park | RW | 0.004 | 0.282 | 0.145 | 0.144 | 18 | ||
| Dahsia Industrial Park | DH2 | 0.000 | 0.126 | 0.041 | 0.056 | 46 | ||
| Yongan Industrial Park | YA | 0.014 | 0.234 | 0.021 | 0.090 | 31 | ||
| Linyuan Industrial Park | LY | 0.000 | 0.130 | 0.002 | 0.044 | 53 | ||
| Pingtung County | Pingtung Industrial Park | PT2 | 0.179 | 0.084 | 0.011 | 0.091 | 30 | |
| Neipu Industrial Park | NP | 0.025 | 0.085 | 0.089 | 0.066 | 42 | ||
| Pingnan Industrial Park | PN | 0.015 | 0.047 | 0.006 | 0.023 | 58 | ||
| Eastern Region | Yilan County | Longde Industrial Park | LD | 0.030 | 0.029 | 0.017 | 0.025 | 57 |
| Litsu Industrial Park | LT | 0.690 | 0.026 | 0.019 | 0.245 | 14 | ||
| Hualien County | Meilun Industrial Park | ML | 0.007 | 0.018 | 0.012 | 0.012 | 61 | |
| Guanghua Industrial Park | GH2 | 0.150 | 0.023 | 0.048 | 0.074 | 38 | ||
| Hupin Industrial Park | HP2 | 0.028 | 0.027 | 0.008 | 0.021 | 59 | ||
| Taitung County | Fengle Industrial Park | FL | 0.119 | 0.119 | 0.074 | 0.104 | 25 |
Note: Green highlighting indicates that the efficiency value of the industrial park is high; blue highlighting indicates that the efficiency value of the industrial park is low.
References
- Ministry of Economic Affairs. Industrial Land Policy White Paper. 2019. Available online: https://www.moea.gov.tw/mns/populace/news/wHandNews_File.ashx?file_id=69723 (accessed on 26 July 2022).
- UN. Transformimg Our World: The 2030 Agenda for Sustainable Development. 2015. Available online: http://www.un.org/ga/search/view_doc.asp?symbol=A/RES/70/1&Lang=E (accessed on 11 July 2022).
- National Development Council. Taiwan’s Pathway to Net-Zero Emissions in 2050. 2022. Available online: https://www.ndc.gov.tw/Content_List.aspx?n=FD76ECBAE77D9811&upn=5CE3D7B70507FB38 (accessed on 15 June 2022).
- Wang, J.J. Is Taiwan ready for the ESG Army? Economic Outlook No. 203; China Institute of Economic Research: Beijing, China, 2022. [Google Scholar]
- Li, S.L. Discuss ESG and Energy regulations- Focused on the Battery Re-Purpose of the E-Scooter. Master’s Thesis, Soochow University School of Law, Taipei City, Taiwan, 2022. [Google Scholar]
- Wu, J.Y. Performance Evaluation of Industrial Land Development and Its Strategic Implications: Applied Data Envelope Analysis. Master’s Thesis, Department of Civil Engineering, College of Engineering, National Taiwan University, Taipei City, Taiwan, 2020. [Google Scholar]
- Taiwan Stock Exchange Sustainability Report. 2021. Available online: https://www.twse.com.tw/staticFiles/csr/download/2021_zh.pdf (accessed on 15 June 2022).
- TSE MOPS. Taiwan Sustainability Report. 2021. Available online: https://mops.twse.com.tw/mops/web/t100sb11 (accessed on 15 June 2022).
- Jun, X.; Wataru, N.; Michiyuki, Y.; Hidemichi, F.; Shunsuke, M. Do environmental, social, and governance activities improve corporate financial performance? Bus. Strategy Environ. 2018, 28, 286–300. [Google Scholar]
- Marcel, C.M.; Werner, K.; John, S. Exploring environmental, social, and governance disclosure effects on the S&P 500 financial performance. Bus. Strategy Environ. 2019, 28, 1083–1095. [Google Scholar]
- Li, Z.Y. Applied Economy-Eco-Efficiency Analysis of the Development of Taiwan’s Counties and Cities. Master’s Thesis, Institute of Land Administration, National Chengchi University , Taipei City, Taiwan, 2011. [Google Scholar]
- Ben, T.M. Interaction analysis among industrial parks, innovation input, and urban production efficiency. Asian Soc. Sci. 2011, 7, 56. [Google Scholar] [CrossRef]
- Bian, Y.; Liang, N.; Xu, H. Efficiency evaluation of Chinese regional industrial systems with undesirable factors using a two-stage slacks-based measure approach. J. Clean. Prod. 2015, 87, 348–356. [Google Scholar] [CrossRef]
- Kai, H.; Nan, Z.; Wu, J.; Chuanjin, Z. Efficiency Evaluation of Chinese Provincial Industrial System Based on Network DEA Method. Sustainability 2022, 14, 5264. [Google Scholar]
- Liu, W.; Tian, J.; Li, X.; Liu, T.; Chen, L. Environmental performance of integrated eco-industrial parks based on data envelopment analysis. Ecol. Econ. 2012, 7, 125–128. [Google Scholar]
- Şakire, N.; Zeynep, Ö. Evaluation of Efficiency Measurement of Selected Technoparks with Data Envelopment Analysis (DEA). Ege Acad. Rev. 2021, 22, 155–168. [Google Scholar]
- Zhang, B.; Bi, J.; Fan, Z.; Yuan, Z.; Ge, J. Eco-Efficiency analysis of industrial system in China: A data envelopment analysis approach. Ecol. Econ. 2008, 68, 306–316. [Google Scholar] [CrossRef]
- Liao, W.B. Research on Eco-Efficiency of Industrial Parks in Taiwan. Master’s Thesis, Department of Geoscience, National Chengchi University, Taipei City, Taiwan, 2015. [Google Scholar]
- Gao, Z.X.; Chen, X.M.; Luo, G.D. Carbon dioxide emission reduction costs in Taiwan’s industrial sector: Application of environmental directionality distance function. Taiwan J. Appl. Econ. 2014, 95, 147–189. [Google Scholar]
- Zhang, L.; Zhao, L.; Zha, Y. Efficiency evaluation of Chinese regional industrial systems using a dynamic two-stage DEA approach. Socio-Econ. Plan. Sci. 2021, 77, 101031. [Google Scholar] [CrossRef]
- Lewin, A.Y.; Minton, J.W. Determining Organizational Effectiveness: Another Look, and an Agenda for Research. Manag. Sci. 1986, 32, 514–538. [Google Scholar] [CrossRef]
- Golany, B.; Roll, Y. An Application Procedure for DEA. OMEGA 1989, 17, 237–250. [Google Scholar] [CrossRef]
- Huang, X.N. Research on the use of data envelope analysis method and its application in the efficiency evaluation of non-profit organizations. Ph.D. Dissertation, Institute of Management Science, National Chiao Tung University, Hsinchu, Taiwan, 1993. [Google Scholar]
- Färe, R.; Grosskopf, S.; Lovell, C.K.; Pasurka, C. Multilateral productivity comparisons when some outputs are undesirable: A nonparametric approach. Rev. Econ. Stat. 1989, 71, 90–98. [Google Scholar] [CrossRef]
- Chang, C.C. The nonparametric risk-adjusted efficiency measurement: An application to Taiwan’s major rural financial intermediaries. Am. J. Agric. Econ. 1999, 81, 902–913. [Google Scholar] [CrossRef]
- Seiford, L.M.; Zhu, J. Modeling undesirable factors in efficiency evaluation. Eur. J. Oper. Res. 2002, 142, 16–20. [Google Scholar] [CrossRef]
- Tone, K.; Tsutsui, M. Applying an efficiency measure of desirable and undesirable outputs in DEA to US electric utilities. J. CENTRUM Cathedra Bus. Econ. Res. J. 2011, 4, 236–249. [Google Scholar] [CrossRef]
- Murray, T.J.; Pipino, L.L.; Van Gigch, J.P. A pilot study of fuzzy set modification of Delphi. Hum. Syst. Manag. 1985, 5, 76–80. [Google Scholar] [CrossRef]
- Chen, Z.H. Research on the competitiveness and core capability indicators of Asia-Pacific ports. J. Transp. 2001, 13, 1–25. [Google Scholar]
- Zheng, C.B. Fuzzy Assessment Model of Maturity of Software Organizations to Improve Personnel Capabilities. Master’s Thesis, Institute of Information Management, National Taiwan University of Science and Technology, Taipei City, Taiwan, 2001. [Google Scholar]
- Ishikawa, A.; Amagasa, M.; Shiga, T.; Tomizawa, G.; Tatusta, R.; Mieno, H. The max-min delphi method and fuzzy delphi method via fuzzy integration. Sets Syst. 1993, 55, 241–253. [Google Scholar] [CrossRef]
- Xu, C. Fuzzy Defi Hierarchical Analysis. J. Fuzzy Syst. 1998, 4, 59–72. [Google Scholar]
- Lo, C.W.; Chiu, L.C. A Study on the Establishment for Green Transport Recreation Route Planning Indicators by applying Fuzzy Delphi Method and Analytic Network Process. J. Taiwan Land Res. 2015, 18, 81–108. [Google Scholar] [CrossRef]
- Ye, Z.L. Establishment of Evaluation Indicators for Children’s Playfield Facilities in Neighborhood Parks. Master’s Thesis, Chaoyang University of Science and Technology, Taichung, Taiwan, 2022. [Google Scholar]
- Banker, R.D.; Charnes, A.; Cooper, W.W. Some models for estimating technical and scale inefficiencies in data envelopment analysis. Manag. Sci. 1984, 30, 1078–1092. [Google Scholar] [CrossRef]
- Charnes, A.; Cooper, W.W.; Rhodes, E. Measuring the efficiency of decision making units. Eur. J. Oper. Res. 1978, 2, 429–444. [Google Scholar] [CrossRef]
- Klopp, P. The analysis of the efficiency of production system with multiple input and output. Ph.D. Dissertation, University of Illnois, Chicago, IL, USA, 1985. [Google Scholar]
- Mann, H.B.; Whitney, D.R. On a test of whether one of two random variables is stochastically larger than the other. Ann. Math. Stat. 1947, 18, 50–60. [Google Scholar] [CrossRef]
- Statistics Department of the Ministry of Economic Affairs, Industrial and Commercial Business Operation Introduction. 2020. Available online: https://www.moea.gov.tw/Mns/dos_e/content/ContentLink.aspx?menu_id=9524&sub_menu_id=21022 (accessed on 20 September 2022).
- Klir, G.J.; Tina, A. Folger, Fuzzy Sets, Uncertainty, and Information; Prentice Hall Press: Englewood Cliffs, NJ, USA, 1988. [Google Scholar]
- Ko, Y.Z. Feasibility Assessment of Policy Planning for Land-Use Disaster Risk Reduction Tools: Application of the Fuzzy Delphi Hierarchical Method. J. Adm. Policy 2008, 47, 57–90. [Google Scholar]
- Industrial Bureau of the Ministry of Economic Affairs. Industrial Park Profiles. 2021. Available online: https://idbpark.moeaidb.gov.tw/Content/Files/Report/Files/110%E5%B9%B4%E5%B7%A5%E6%A5%AD%E5%8D%80%E5%B9%B4%E5%A0%B1.pdf (accessed on 8 July 2022).
- Fearon, D. Alfred Weber: Theory of the Location of Industries; Ŕ Center for Spatially Integrated Social Science: Philadelphia, PA, USA, 2006. [Google Scholar]


Disclaimer/Publisher’s Note: The statements, opinions and data contained in all publications are solely those of the individual author(s) and contributor(s) and not of MDPI and/or the editor(s). MDPI and/or the editor(s) disclaim responsibility for any injury to people or property resulting from any ideas, methods, instructions or products referred to in the content. |
© 2023 by the author. Licensee MDPI, Basel, Switzerland. This article is an open access article distributed under the terms and conditions of the Creative Commons Attribution (CC BY) license (https://creativecommons.org/licenses/by/4.0/).