Abstract
International science and technology (S&T) cooperation is one of the important ways to ensure the continuous development of a national innovation system. “One Belt One Road” advocates the concepts of common business, common construction, and sharing, and new countries and regions are constantly added. However, different countries/regions have different natural and socio-economic characteristics, so the main controlling factors affecting their international S&T cooperation may not be the same. Therefore, this paper uses a combination of multi-source data and multiple methods to collectively construct an assessment model of the driving effect of international S&T cooperation in Xinjiang. The evaluation results of the entropy-weighted TOPSIS model show that the contributions of S&T level, city nature, and S&T investment to international S&T cooperation in Xinjiang are 22.9%, 22.3%, and 20.4%, respectively. Singapore, Germany, and Russia are the top three countries in terms of the effectiveness of international S&T cooperation with Xinjiang. The results of the STIRPAT model show that the total number of R&D personnel and the number of R&D personnel per 1000 workers are the main factors affecting the driving effect of international S&T cooperation. The former can be regarded as the stabilizer of international S&T cooperation. This paper’s findings can provide theoretical support for the efficient integration of diverse advantageous resources among cooperating subjects.
1. Introduction
Since the “One Belt One Road” initiative has been implemented, it has been promoting the development of economic globalization, scientific and technological internationalization, and innovation multipolarity in the countries/regions along the route with significant economic and social benefits [1,2,3]. As an important issue in the construction of “One Belt One Road,” science and technology (S&T) cooperation and innovation aim to rapidly improve the risk management ability of China and the countries/regions along the route to manage major scientific and livelihood issues, and it is also a technical guarantee to promote the implementation of major projects of “One Belt One Road” [4,5,6]. Currently, the global strength of S&T innovation is quietly changing; the world innovation pattern and map are constantly reshaping, and the international competition among countries is increasingly expressed as the competition of S&T strength and ability to innovate [7,8,9]. Accelerating the opening up of S&T innovation to the outside world and deeply integrating into the global innovation network are not only inevitable requirements for accelerating the development of S&T innovation, but also an inevitable choice for the internationalization of S&T in economic globalization and an important way for China to actively participate in the governance of global S&T [10,11,12]. International S&T cooperation aims to efficiently integrate the diverse and advantageous resources among the cooperating subjects and strives to rapidly improve the S&T and economic level among the cooperating subjects with the optimal type of resource combination [13,14,15]. Since the Belt and Road Initiative was proposed in 2013, the Chinese government has been committed to international S&T cooperation with countries along the route at the macro level to seek a vision of common development with the cooperating countries/regions [16,17]. The choice of cooperation model will affect the efficiency and success of cooperation in international S&T cooperation to some extent [18,19,20]. In addition, the path of “Belt and Road” cooperation spans several continents, and the scientific, economic, and natural environments of different countries vary significantly [21,22]. Therefore, the choice of cooperation model and the combination of resources in international S&T cooperation are crucial for the development of regional economies and science and technology [23,24].
In the late 1970s, Beaver et al. [25] first comprehensively and systematically explained the theory of scientific cooperation and used scientific co-authorship to demonstrate the closeness of international scientific cooperation, and since then, the scientific metric method based on international co-authorship has been widely used in research on international scientific cooperation [26,27]. Wang et al. [28] using a bibliometric analysis to study the co-authored papers with international authors in China during the past 40 years and found that the papers on scientific and technological cooperation between China and countries along the Belt and Road showed a trend of rapid growth and a wide range of cooperation areas, but the overall discourse in high-quality co-authored papers was still inadequate. Zhang et al. [29] used the gravitational model to explore the current situation of scientific cooperation between China and countries/regions along the “Belt and Road” and its influencing factors and found that geographical proximity and partnership are the key factors that affect the breadth and depth of international scientific cooperation. Li et al. [30] used international S&T cooperation patents as a data source and social network analysis to assess the evolution of China’s role and status in international S&T cooperation networks. They found that the centrality of Chinese international co-authored papers is increasing yearly, and its role and availability of resources are also increasing. Guerrero Bote et al. [31] reported that co-authored literature from 37 different countries/regions around the world found that international cooperation increases the impact of scientific production in a country and that the USA and EU countries are the centers of a network of scientific cooperation between these countries. Bonilla et al. [32] explored the benefits of international S&T cooperation from different actors’ perspectives based on student mobility and international cooperation in Korea and Guatemala to assess the potential risks and benefits associated with international student mobility. Kotsemir et al. [33] identified the most promising areas of international S&T cooperation in Russia based on literature analysis and expert survey methods. Park [34] explored the evolution of international S&T cooperation institutions and their characteristics in Korea during different cooperation periods (technical assistance, technology transfer, mutual cooperation, expanded cooperation, and highly complex cooperation periods), finding that the dynamics of institutional changes in international S&T cooperation originated from the international and domestic macro environment. This suggests that many studies report the benefits of international S&T cooperation, its policies, and its trends. Overall, the breadth and depth of international S&T cooperation have become important indicators of regional exchanges, economic and trade cooperation, and the level of S&T among different countries and regions [35,36]. However, current research on international S&T cooperation is primarily focused on qualitative and relatively quantitative levels, while there are few systematic and holistic quantitative studies [37].
Strong international partnerships are key to the effective establishment of national innovation systems [33]. However, there are many natural and socio-economic differences among countries and regions, and the main controlling factors affecting their international S&T cooperation may vary greatly. Zhang et al. [38] constructed a portrait index system for “One Belt One Road” cooperation countries based on two dimensions: the investment environment and public opinion trends, which can help promote “One Belt One Road” cooperation projects. Wang et al. [39] developed a regression model of the relationship between scientific cooperation and knowledge production in 63 countries and regions along the Belt and Road based on the number of co-authors, literature, and their potential impact indicators and found that scientific cooperation and knowledge production are mutually reinforcing and show certain cumulative effects. Montobbio and Sterzi [40] used a gravity model to measure the knowledge output of S&T cooperation among 11 emerging economies and seven developed countries and found that knowledge production can promote scientific cooperation by increasing the number of specialized disciplines, economic development, and political stability. In general, scholars have made a lot of innovative attempts to assess the drivers and effects of international S&T cooperation and have achieved many valuable research results, but the main controlling factors affecting international S&T cooperation in different countries and regions at different development stages are not the same. Therefore, a scientific and accurate assessment of the drivers and their effects of international S&T cooperation is a hot issue that needs to be solved nowadays. Therefore, this study introduced both the entropy-TOPSIS and STIRPAT models based on the applicability of the model and the previous research results to weigh the impact factors of international S&T cooperation and assess their driving effects, respectively; the entropy method highlights the utility value of the entropy value of each impact factor, avoids the introduction of artificial factors, and more scientifically assigns index weights [41,42,43]. Therefore, the entropy weight method was introduced to improve the TOPSIS model to further enhance the accuracy of the driving factors of international S&T cooperation. In addition, to determine the impact factors of international scientific and technological cooperation, a nonlinear model (STIRPAT) that manages multiple independent variables was introduced simultaneously and enabled the coefficients of the respective variables to be used as parameters to operate the model to perform operations during the operation, while the variables could be appropriately decomposed and extended to improve the fit of the model, which ultimately helped to enhance the assessment of the effectiveness of international S&T cooperation that drives the accuracy of results [44,45].
Xinjiang is located in the hinterland of Asia and Europe and is the golden corridor and bridgehead for China to connect the east with the mainland and the west with Europe, as well as the core area of the “One Belt One Road” development [35,46]. In the context of the development of the “Belt and Road” cooperation, the importance and urgency of planning international S&T cooperation in Xinjiang with a global perspective is self-evident [47,48]. What is the theoretical support behind the different modes of cooperation between Xinjiang and the different countries/regions along the “Belt and Road” and the significant differences in their effects? What is the driving mechanism of international S&T cooperation? What are the driving factors? In summary, this study selected countries or regions along the “Belt and Road” that cooperate with Xinjiang to conduct international S&T as the research object, referred to the relevant literature on the driving factors of international S&T cooperation, and combined the characteristics of international S&T cooperation in Xinjiang with the availability, representativeness, authority, and scientific nature of data. It adopted the entropy-TOPSIS and STIRPAT models to evaluate the influencing factors and their driving effects of international S&T cooperation in Xinjiang. The objectives of this paper are: (1) to systematically construct an assessment model of the driving effects of international S&T cooperation in Xinjiang from multiple dimensions; (2) to quantitatively analyze the multiple factors influencing international S&T cooperation using the entropy-TOPSIS model and determine their main driving forces; and (3) to quantitatively analyze the impact of changes in each influencing factor on international S&T cooperation based on the simulation results of the STIRPAT model. The results of this study will help deepen the understanding of international S&T cooperation in Xinjiang and provide an important reference for the subsequent “One Belt One Road” countries and regions to quickly integrate their own advantageous resources into international S&T cooperation.
2. Materials and Methods
Based on the relevant studies on the drivers of international S&T cooperation; the characteristics of international S&T cooperation in Xinjiang; and the availability, representativeness, and scientific nature of data [49,50,51], in this study, 30 evaluation indicators in six dimensions (S&T input, educational conditions, economic environment, S&T level, trade level and city nature) were downloaded and compiled from the official websites of UNESCO and The World Bank. The data of five indicators in the S&T input dimension were obtained from the UNESCO Institute for Statistics (http://uis.unesco.org/en/topic/research-and-development, accessed on 1 August 2022), and the data of the remaining 25 indicators were obtained from the World Bank (https://data.worldbank.org, accessed on 3 August 2022). The panel data of the impact factors from 51 countries, which spanned from 2013 to 2018, were finally collated and obtained. The details of their different driving dimensions and detailed indicator parameters are shown in Table 1.

Table 1.
Factors that influence international science and technology cooperation in Xinjiang.
2.1. Entropy-TOPSIS Model
The entropy-weight-TOPSIS model was used to determine the weight coefficients of the impact factors of international S&T cooperation in Xinjiang [52,53,54]. The technique for order preference by similarity to an ideal solution (TOPSIS) is a multi-objective decision making method to rank a finite number of evaluation objects with respect to their proximity to the ideal target space. It functions by first constructing two solutions, the optimal and the inferior, for all evaluation objects, and then continuously approaches the optimal solution while moving away from the inferior solution, and thus, is a multi-objective decision-making method [55,56]. However, the traditional TOPSIS method gives the same weight coefficients to the evaluation indicators among the evaluation objects, which does not objectively and truly reflect the contribution of different indicators among the evaluation subjects; this reduces the accuracy of the evaluation results to some extent [57,58]. The “entropy weighting method” serves as an objective method to measure the complexity of data, and it can focus on the differences in local data in which “difference-driven” is the basic working principle of the method [59,60]. The following two aspects underscore the advantages and characteristics of the entropy weighting method: (1) The utility value of each indicator information entropy value is highlighted based on the specific data of the sample, which avoids the introduction of artificial factors. This makes the assignment of indicator weights more scientific; and (2) The process of assigning indicator weights is transparent and reproducible. Therefore, this study introduced the “entropy method” to improve the TOPSIS method to further improve the accuracy of the driving factors of international S&T cooperation in Xinjiang. The calculation steps and implementation path of the entropy-weighted TOPSIS model are as follows [61,62,63]:
(1) Construction of the original matrix of the driving factors. It is assumed that the number of countries with which Xinjiang has signed the “Belt and Road” cooperation agreement is c, and the driving factor is f. The attribute value of the jth driving factor corresponding to the ith country is xij. Therefore, the matrix of the driving factors of science and technology cooperation is constructed as follows:
(2) Normalization of the original matrix X = ()c×f for international S&T cooperation is as follows:
(3) Calculation of the weight coefficient () of the jth driver for the ith country in the study period as a percentage of this indicator:
(4) Calculation of the entropy value () of the jth driving element when = 0. .
(5) Calculation of the coefficient of variation () for the jth indicator.
(6) Calculate the entropy weight of the jth indicator.
On the basis of choosing the entropy assignment method as the method for the analysis of each driver assignment, the entropy TOPSIS model was further constructed jointly with the TOPSIS method, and its primary calculation formula was as follows [64,65].
(7) The weighted decision evaluation matrix is calculated as follows:
The positive and negative ideal solutions of the driving factors of international S&T cooperation are the reference criteria to determine the final weight coefficients, and the maximal value of and the minimum value of are calculated for the jth driving indicator. The matrix of the positive ideal solution is then expressed as , and the matrix of negative ideal solutions is represented as .
(9) The Euclidean distance between each country and the positive and negative ideals are calculated as follows:
Where the distances from different countries to the optimal ideal solution are as follows:
The distances from different countries to the worst ideal solution are as follows:
(10) The relative proximity of each country to the ideal solution (composite score index) is calculated as follows:
where the and values in Equation (11) represent the distance (Euclidean distance) between the evaluation object and the optimal and inferior solutions in turn. A larger value for the research object indicates a farther distance between the evaluation object and the optimal solution. A larger value indicates that the value has a greater distance from the inferior solution. If the values of and satisfy both the smaller value of and the larger value of , it is the best solution of the research object [66,67].
2.2. STIRPAT Model Construction
The STIRPAT model is a nonlinear model that simultaneously manages multiple independent variables; this enables the coefficients of the respective variables to be used as parameters for the model operation, and the variables can be decomposed and expanded appropriately [68,69,70]. In this study, we quantified the influence of multiple driving factors on international S&T cooperation in Xinjiang in the context of “One Belt One Road” based on the operating principle of the STIRPAT model. The primary steps of model construction are as follows: (1) the selection of driving factors; (2) the extension and parameter testing of the STIRPAT model; and (3) final construction of the model of relationship between the driving factors of international S&T cooperation in Xinjiang in the context of “One Belt, One Road” as follows [71,72]:
D4 = KA1a1 A2a2 A4a3 A5 a4 B4 a5 C1 a6 C3a7D5a8 F3a9 F4a10 G1a11 G2a12 G5a13 Ɛ
Given the different magnitudes of the drivers and the magnitude of differences in data sizes, the heteroskedasticity of each driver datum is significant. Therefore, the natural logarithm was used to take the natural logarithm of the left and right sides of Equation (12) to perform the homotropy of the original driver data, so that the relative errors of the 13 drivers shown above have homoscedastic variability, which helps to improve the accuracy of the model evaluation. The equation after taking the natural logarithm for both the left and right sides of Equation (12) is as follows:
where A1 is the weight of R&D expenditure to GDP; A2 is the total research expenditure; A4 is the total number of R&D personnel; A5 is the number of R&D personnel per 1000 workforce; B4 is the weight of government education expenditure to total government expenditure; C1 is the gross domestic product (GDP); C3 is the total savings; D5 is the weight of medium and high technology value added to manufacturing value added; F3 is the exports of goods and services; F4 is the exports of information and communication technology (ICT) services; G1 is the urban land area; G2 is the total urban population; G5 is the urban population density; and Ɛ is the stochastic term of the model. a1, a2, a3, a4, a5, a6, a7, a8, a9, a10, a11, a12, a13 are elasticity coefficients, indicating when A1, A2, A4, A5, B4, C1, C3, D5, F3, F4, G1, G2, and G5 cause a1%, a2%, a3%, a4%, a5%, a6%, a7%, a8%, a9%, a10%, a11%, a12%, and a13% changes in D4 for each 1% change, respectively [73,74].
lnD4 = a1lnA1 + a2lnA2 + a3lnA4 + a4lnA5 + a5lnB4 + a6lnC1 + a7lnC3 + a8lnD5 + a9lnF3 + a10lnF4 + a11lnG1 + a12lnG2 +a13lnG5 + ln Ɛ
3. Results
3.1. Analysis of the International Science and Technology Influencing Factors in Xinjiang Based on the Entropy Power-TOPSIS Model
3.1.1. Determination of the Index Weights
The weight coefficients of the six dimensions of S&T cooperation between Xinjiang and countries along the “One Belt One Road” from 2013 to 2018 were calculated and analyzed using Equations (1)–(6), and the interannual trend in the weight coefficients was plotted using Origin software (OriginLab, Northampton, MA, USA) (Figure 1). The relationship between the mean weights of the drivers of science and technology cooperation between Xinjiang and the countries along the “Belt and Road” is as follows: D3 (0.084) > C3 (0.082) > G5 (0.078) > D1 (0.076) > A2 (0.075) > A4 (0.073) > G1 (0.070) > G2 (0.066) > D4 (0.056) > C1 (0.055) > F4 (0.046) > F3 (0.040) > C4 (0.035) > A3 (0.026) > C2 (0.020) > A5 (0.015) ≥ A1 (0.015) > B4 (0.014) > F1 (0.013) > B3 (0.010) >D5 (0.008) ≥ B2 (0.008) > G4 (0.007) > F2 (0.006) ≥ D2 (0.006) > F5 (0.005) ≥ B5 (0.005) > B1 (0.004) > G3 (0.003) ≥ C5 (0.003). Overall, there was a large total variation in the weighting coefficients of the different drivers during the study period (their coefficients of variation of drivers ranged from 0.883 to 0.906, showing extremely high variability), but the interannual variation in the weighting coefficients of the same driver was not significant [75,76]. In terms of the interannual variation characteristics of each driver, except for foreign direct investment (C4), economic growth rate (C5), net terms-of-trade index (F5), and government education expenditure as a percentage of total government expenditure (B2), the interannual variation characteristics of other drivers showed a small trend. This indicated that there is generally low interannual variation in the weight coefficients of the drivers between Xinjiang and the countries along the Belt and Road.
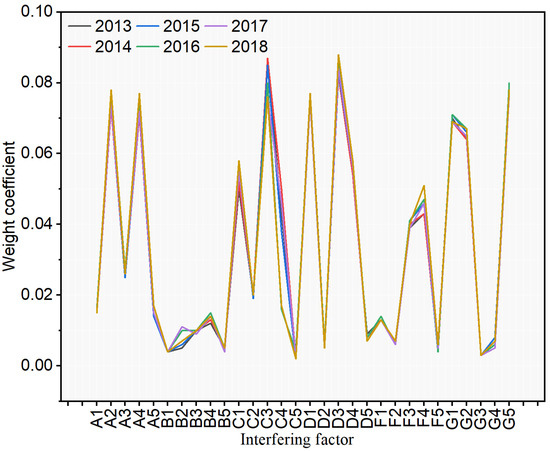
Figure 1.
Time series diagram of the weight coefficients of each driving factor of international science and technology cooperation in Xinjiang from 2013 to 2018.
3.1.2. Weighting Coefficient of the Driving Factors in Different Dimensions
Figure 2 shows the chord diagram of international S&T cooperation between Xinjiang and countries along the “Belt and Road” in different driving dimensions and the weight coefficients of their influencing factors. In Figure 2, the same color was chosen for the same driver category, and the size of the driver weight coefficient positively correlated with the thickness of the line segment, i.e., a larger driver weight coefficient resulted in a thicker line segment. In terms of each driver dimension, total research funding (A2), total government expenditure on education as a percentage of government expenditure (B4), total savings (C3), number of patent applications (D3), ICT service exports (F4), and urban population density (G5), in that order, are the drivers with the highest weight coefficients among S&T investment, educational conditions, economic environment, S&T, trade conditions, and urban nature. Overall, the magnitude of the contribution of science and technology level, city nature, S&T input, economic environment, trade level, and educational conditions to international science and technology cooperation in Xinjiang was 22.9%, 22.3%, 20.4%, 19.4%, 11%, and 4%, respectively. This indicates that international S&T cooperation is primarily influenced by the S&T resources limited to the cooperation region and its current urbanization status [77,78,79].
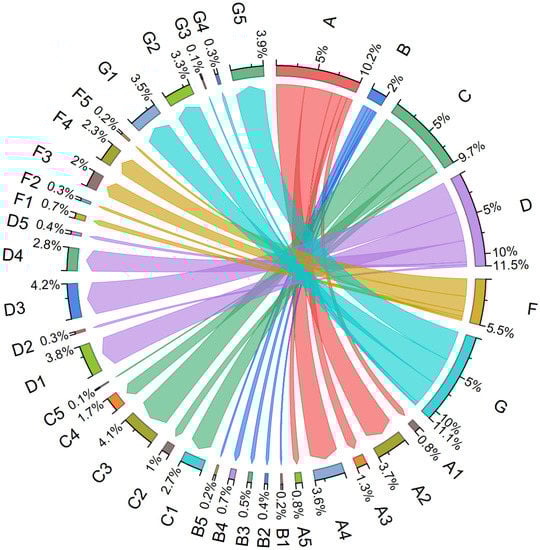
Figure 2.
Chord diagram of the six dimensions and the weight coefficients of the drivers. A, B, C, D, F, and G represent science and technology input, educational conditions, economic environment, technology level, trade level, and city nature, respectively.
3.1.3. Combined Score of The Influencing Factors
The joint entropy assignment method and TOPSIS method (entropy-TOPSIS model) are based on the representativeness, scientific and accessibility of data [80,81]. This study evaluated the composite scores of the drivers of 51 different countries or regions in Xinjiang and the countries that have signed the Belt and Road cooperation agreement from 2013 to 2018. There were variable results for the statistical analysis of the composite scores of the drivers of each country that are shown in Figure 3. The ranking of the mean value of statistical analysis indicated that the top 10 countries in Xinjiang international S&T cooperation that drive effectiveness are Singapore, Germany, Russia, Ireland, the UK, Brazil, The Netherlands, Sweden, The Netherlands, and Italy. This indicated that the driving effectiveness of the same driving factor for international S&T cooperation in Singapore, Germany, and Russia was significantly higher than that of other sample countries, while the driving effectiveness of Armenia was the lowest. In terms of the interannual variation characteristics of the driving efficacy, there were temporal variations in driving efficacy across countries from 2013 to 2018, but they had relatively little overall variation.
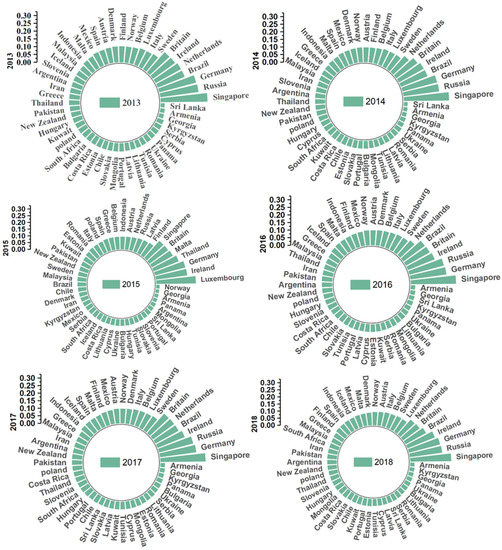
Figure 3.
Radial diagram of the composite score of the factors that influence international science and technology cooperation in Xinjiang.
3.2. Analysis of the Driving Effectiveness of International Science and Technology Cooperation Based on the STIRPAT Model
3.2.1. Model Variable Selection and Data Description
Based on the “Analysis of the Drivers of International S&T Cooperation in Xinjiang,” the representativeness and redundancy of the data were considered, and the weight of R&D expenditure to GDP (A1), total research expenditure (A2), and total R&D personnel (A4) in S&T investment; the number of R&D personnel per 1000 labor force (A5) in educational conditions; the weight of government educational expenditure to total government expenditure (B4) in economic environment; the weight of medium and high technology value added to manufacturing value added (C3) in S&T; the weight of medium and high technology value added to manufacturing value added (B4) in economic environment; the weight of medium and high technology value added to manufacturing value added (C3) in S&T, the weight of government expenditure on education to total government expenditure (B4); GDP (C1), total savings (C3) in economic environment; value added of medium and high technology to manufacturing value added weight in S&T (D5); exports of goods and services (F3), exports of ICT services (F4) at the trade level; urban land area (G1), and total urban population (G2), urban. The STIRPAT model enabled the quantitative analysis of the driving gravity model of international S&T cooperation in Xinjiang, which was constructed, and that of the driving effectiveness of international S&T cooperation in Xinjiang under the context of “One Belt One Road.”
3.2.2. Ridge Regression and Model Fitting
Given the prominent problem of multicollinearity among the drivers of international S&T cooperation in Xinjiang, a ridge regression approach was chosen to quantify the effectiveness of international S&T cooperation between Xinjiang and the sample countries during the study period based on the STIRPAT model [82,83]. Figure 4 shows the ridge trace plot of the mean values of the driving data over the years through which the value of the regression coefficient “K” was determined. The K value was chosen as the minimum K value when the standardized regression coefficient of each independent variable tended to be stable. In general, a smaller K value indicates a smaller deviation, and the model fits better. As shown in Figure 4, the regression coefficients of the mean values of 13 driving factors in six dimensions tended to stabilize overall at K = 0.166, and the result of the significance test (F test) of the equation among the 13 driving factors in its six dimensions was F = 61.999 (0.000 ***). This indicated that there was a highly significant correlation between the explanatory variables and the explained variables of the driving factor equation of international S&T cooperation constructed by the model. In addition, the goodness-of-fit of the model R2 is 0.955, which indicated relatively good performance of the model. Thus, the model fit had a good overall effect. In summary, the analysis showed that the construction of the model driven by international S&T cooperation between Xinjiang and the sample countries was more reasonable. This indicated that this should be the best-fit point of the model [84].
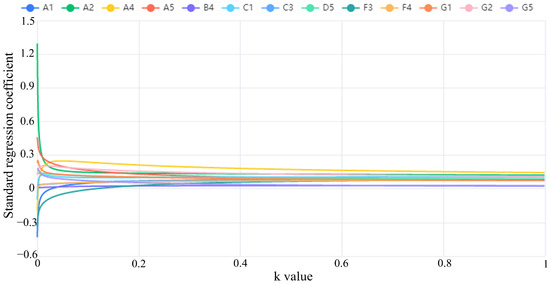
Figure 4.
Ridge traces of the driving factors for 51 sample countries (regions) from 2013 to 2018.
The results of econometric analysis of the STIRPAT model based on ridge regression of the mean values of the historical drive data are detailed in Equation (14):
D4 = 0.166 × A10.127A20.126A40.233A50.278B40.128C10.093C30.111 D50.295F30.024F40.063G10.094G20.178G50.081
Equation (14) and the definition of parameters indicated that the weight of R&D expenditure to GDP, total research expenditure, total R&D personnel, number of R&D personnel per 1000 workforce, weight of government educational expenditure to total government expenditure, GDP, total savings, value added in medium and high technology to value added in manufacturing, exports of goods and services, exports of ICT services, urban land area, total urban population, and urban population density of the elasticity coefficients were 0.127, 0.126, 0.233, 0.278, 0.128, 0.093, 0.111, 0.295, 0.024, 0.063, 0.094, 0.178, and 0.081, respectively, which indicated that when each of the driving factors increased by 1%, the number of scientific and technical articles increased by 0.127%, 0.126%, 0.233%, 0.278%, 0.128%, 0.093%, 0.111%, 0.295%, 0.024%, 0.063%, 0.094%, 0.178%, and 0.081%, respectively. In summary, the analysis showed that S&T investment and the level of S&T development were the two driving dimensions with the highest driving effectiveness of international S&T cooperation in the sample countries [85,86].
3.2.3. Comparative Analysis of the Driving Effect over the Years
The STIRPAT extended model was used to systematically analyze the driving effectiveness of international scientific and technological cooperation for each year during the period from 2013 to 2018. The analytical results of applying the ridge regression method to fit the STIRPAT model of international S&T cooperation showed that the coefficients of the ridge regressions of 2013, 2014, 2015, 2016, 2017, and 2018 were 0.181, 0.16, 0.17, 0.176, 0.179, and 0.181, respectively, when the coefficients of the ridge regressions were in the order of 0.181, 0.17, 0.176, 0.179, and 0.181, and the ridge traces among the drivers tended to be smooth. The measurement equations of the STIRPAT model for the drivers of cooperation are detailed in Equations (15)–(20).
2013 STIRPAT Drive Model: D4 = 0.181 × A10.157 A20.13 A40.217 A50.299 B40.157C10.133 C30.064 D50.207 F30.033F40.062 G10.077 G20.168 G50.08
2014 STIRPAT Drive Model: D4 = 0.16 × A10.072 A20.125 A40.242 A50.338 B40.126C10.128 C30.061 D50.284 F30.032F40.076 G10.082 G20.165 G50.074
2015 STIRPAT Drive Model: D4 = 0.17 × A10.155 A20.132 A40.219 A50.267 B40.072C10.12 C30.067 D50.294 F30.028 F40.075 G10.087 G20.175 G50.07
2016 STIRPAT Drive Model: D4 = 0.176 × A10.095 A20.125 A40.248 A50.272 B40.05C10.108 C30.056 D50.243 F30.035 F40.071 G10.097 G20.174 G50.079
2017 STIRPAT Drive Model: D4 = 0.179 × A10.162 A20.125 A40.23 A50.189 B40.188C10.098 C30.059 D50.324 F30.033 F40.057 G10.1 G20.179 G50.078
2018 STIRPAT Drive Model: D4 = 0.181 × A10.164 A20.128 A40.24 A50113 B40.194C10.093 C30.073 D50.338 F30.023 F40.06 G10.101 G20.183 G50.077
A radar plot of the elasticity coefficients of the drivers of international S&T cooperation in the sample countries over the years was drawn to visualize the magnitude of the elasticity coefficients of the drivers and their interannual trends (Figure 5) [87,88]. Figure 5 shows that the relationship between the magnitude of the elasticity coefficients of the 13 drivers in 2013 is as follows: A5 (R&D personnel per 1000 workforce) > B4 (government education expenditure as a weight of total government expenditure) > D5 (value added in medium and high technology as a weight of value added in manufacturing) > G2 (total urban population) > A1 (R&D expenditure as a weight of GDP) > B4 (government education expenditure as a weight of total government expenditure) > C1 (GDP) > A2 (total research funding) > G5 (urban population density) > G1 (land area) > C3 (total savings) > F4 (ICT service exports) > F3 (exports of goods and services as a weight of total exports). The decreasing order of elasticity coefficients of each driver in 2014 was as follows: A5 > D5 > A4 > G2 > C1 > B4 > A2 > G1 > F4 > G5 > A1. The decreasing order of the elasticity coefficients of the drivers in 2015 was as follows: D5 > A5 > A4 > G2 > A1 > A2 > C1 > G1 > F4 > B4 > G5 > C3 > F3, while those in 2016 were as follows: A5 > A4 > D5 > G2 > A2 > C1 > G1 > A1 > G5 > F4 > C3 > B4 > F3. The decreasing order of elasticity coefficients of each driver in 2017 was as follows: D5 > A4 > A5 > B4 > G2 > A1 > A2 > G1 > C1 > G5 > C3 > F4 > F3. The decreasing order of elasticity coefficients of each driver in 2018 was as follows: D5 > A4 > B4 > G2 > A1 > A2 > A5 > G1 > C1 > G5 > C3 > F4 > F3. In 2013~2018, the decreasing order of the average elasticity coefficients of each driver was D5 > A5 > A4 > G2 > B4 > A1 > A2 > C1 > G1 > G5 > F4 > F3.
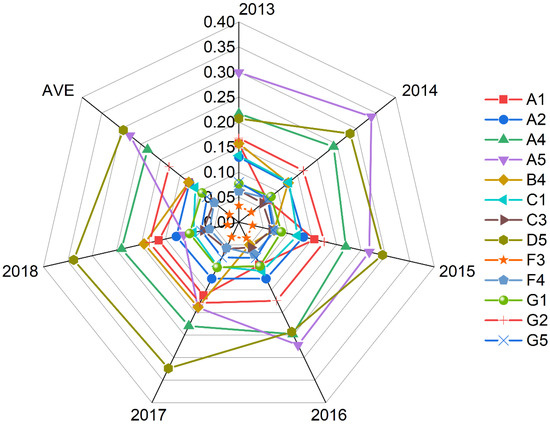
Figure 5.
Radar plot of the elasticity coefficients of the drivers of international scientific and technological cooperation from 2013 to 2018.
The interannual ranking of the driver effectiveness shows that there were some differences in the driver effectiveness of the same driver for different years. From the interannual variation characteristics of the elasticity coefficients of each driver, the top 3 drivers in terms of elasticity coefficient size among the above 13 drivers were the number of R&D personnel per 1000 workforce (A5), the weight of value added of medium and high technology in manufacturing value added (D5), and the total number of R&D personnel (A4), among which the number of R&D personnel per 1000 workforce and the weight of value added of medium and high technology in manufacturing value added in 2013–2018 were the top two drivers with the largest changes in the three drivers described above. The degree of contribution of total R&D personnel to international S&T cooperation in the sample countries remained basically constant throughout the study period, which indicated that the overall magnitude of the contribution of total R&D personnel to S&T cooperation in the sample countries varied less with the time series. For example, in aggregate, the total R&D personnel in countries can usually be regarded as a stabilizer of international S&T cooperation. Moreover, exports of goods and services (F3), exports of ICT services (F4), and urban land area (G1) were the three least effective drivers of international S&T cooperation in the sample countries, and their elasticity coefficients were generally less variable throughout the study period. This indicated that these three drivers had a relatively small impact on the overall international S&T cooperation between Xinjiang and the sample countries along the Belt and Road, and there was generally a small interannual variation in their driving effectiveness. In summary, the radar chart has a unique advantage in showing the magnitude of the elasticity coefficients of the drivers of international S&T cooperation between Xinjiang and the sample countries of “One Belt One Road” and their interannual trends in variation.
This discussion has clearly shown that there are interannual differences in the magnitude of the driving effectiveness of the same driver for international S&T cooperation between Xinjiang and the sample countries of the “Belt and Road.” The results of the descriptive statistical analysis of the elasticity coefficients of the drivers of international S&T cooperation showed that the magnitude of the coefficient of variation (CV) of the above 13 drivers during 2013-2018 was as follows: B4 (0.457) > A5 (0.331) > A1 (0.298) > D5 (0.175) > C1 (0.144) = F3 (0.144) > F4 (0.122) > G1 (0.111) > C3 (0.096) > A4 (0.055) > G5 (0.049) > G2 (0.038) > A2 (0.024). As shown by the grading criteria of the coefficient of variation, B4, A5, and A1 were in the medium level of variation, i.e., these three drivers drove the effectiveness. In addition, there was relatively low interannual variation in the driving efficacy of the 10 remaining factors.
4. Discussion
The Chinese government is committed to building a new type of international relationship and strengthening the sense of a community of human destiny [89]. In view of this, the “Belt and Road” initiative has been joined by new countries/regions since it was proposed in 2013, and its cooperation has generated significant economic and social benefits [90]. In this paper, we use the entropy-TOPSIS and STIRPAT models to comprehensively assess the drivers and effects of international S&T cooperation in “One Belt One Road” countries/regions. The interannual variation in the weight coefficients of the drivers shows a significant interannual variation in the weight of foreign direct investment and economic growth. This is mainly associated with cooperating countries’ efforts to alleviate their economic pressure by canceling some of their cross-border contracts during economic downturns [91]. However, the results of Gao and Yu [22] showed that the effect of economic power on S&T cooperation was weak. This may be related to the significant economic differences between them and the weakening influence of finance. In terms of the driving dimensions, the level of S&T is the largest contributor to international S&T cooperation among the six driving dimensions. However, educational conditions contribute the least to international S&T cooperation, which does not seem to be quite in line with our common sense. Our analysis of the source data included in the education conditions reveals that its data fluctuate less, but the entropy method assigns weights to them based on the variance drive of the data. This may be the main reason why the calculated results do not quite match our expectations. Singapore, Germany, and Russia are the top three countries in terms of the overall score of the driving effect. Among them, Singapore benefits from its geographical proximity and cultural similarity with China and has gained good economic and social benefits bilaterally through S&T cooperation. Germany is an economy with a high stock of knowledge and innovation and a strong cultural heritage, and the pragmatic trade policy signed with China is the basis for increasing cooperation in scientific and technological projects and people-to-people contacts between the two countries. The long-standing stable and friendly bilateral relations between Russia and China, which share a border and are rich in natural resources, are the basis for deepening cooperation between the two countries in many fields. The above findings are generally consistent with the S&T cooperation in countries and regions along the “Belt and Road” in Shaanxi, China [92]. In terms of the elasticity coefficients of the driving factors, changes in the total number of R&D personnel and the number of R&D personnel per 1000 workforce are the main variables that cause changes in the output of international S&T cooperation. Overall, bilateral or multilateral S&T cooperation usually generates a 1 + 1 > 2 spillover effect, which helps promote the S&T development of the cooperating parties [93,94].
Although this paper uses a combination of multi-source data and multi-methods to construct an assessment system of the drivers of international S&T cooperation and its effects in Xinjiang from multiple dimensions based on previous studies, because the driving mechanism of international S&T and its influencing factors are too complex, this paper inevitably causes a loss of focus in the construction of its assessment system, which eventually leads to biased assessment results. Ferdinand [95] systematically explained that China is gradually strengthening its S&T and economic ties with Belt and Road countries and regions to balance its potentially conflicting relationship with the USA. Gao and Yu [22] reviewed the knowledge structure of the Belt and Road S&T literature for the period 2013–2019 and found that geopolitics is an important influencing factor for international S&T cooperation. It has been reported that the Belt and Road will eventually affect about 80% of the world’s population, with an estimated cost of about USD 2.1 trillion [96]. This would be much higher than the previous record investments made by the United States or the Soviet Union in geopolitical jockeying [97]. However, this paper did not include geopolitics in the assessment system, considering that panel data on long-term quantifiable geopolitics are difficult to obtain. This is also an important reason for the bias in the assessment results. In addition, the Chinese official vision of the Belt and Road Initiative has been assigned to the development of the Five Links (policy communication, facility connection, trade flow, financial integration, and people-to-people contact), and its research areas cover more than 100 disciplines in the Web of Science database, and its impact on international relations, economics, and political science is undoubtedly enormous [98,99]. This requires subsequent studies on the international S&T cooperation of the Belt and Road to be conducted from multiple dimensions and perspectives in order to make the assessment results more informative.
5. Conclusions and Suggestions
Based on the existing research base, 30 evaluation indicators were studied on the drivers of S&T cooperation between Xinjiang and the countries along the “Belt and Road” in six dimensions (S&T investment, educational conditions, economic environment, S&T level, trade level, and city nature), and the overall weight coefficients of the drivers of international S&T cooperation in Xinjiang were found to vary significantly over the years (the coefficients of variation of the drivers ranged from 0.883 to 0.906). There was large overall variation in the weight coefficients of the drivers of international S&T cooperation in Xinjiang (the coefficient of variation of the drivers ranged from 0.883 to 0.906, showing a very high degree of variation), but the weight coefficients of the same drivers did not vary significantly from year to year. Science and technology, city nature, and S&T investment were found to be the most important drivers of international S&T cooperation in Xinjiang.
From the results of the econometric analysis of the STIRPAT model based on the mean values of the ridge regression of the historical driving data, S&T investment and the level of S&T development were the two driving dimensions that were the most effective at driving international S&T cooperation in the sample countries. From the characteristics of interannual changes in the elasticity coefficients of each driver, the top 3 drivers in the size of elasticity coefficients among the above 13 drivers were the number of R&D personnel per 1000 workforce (A5), the weight of medium and high technology value added in manufacturing value added (D5), and the total number of R&D personnel (A4), among which was the number of R&D personnel per 1000 workforce. The weight of medium and high technology value added in manufacturing value in 2013–2018 were the two drivers with the largest changes in the three drivers shown above, while the degree of contribution of total R&D personnel to international S&T cooperation in the sample countries remained basically constant throughout the study period. This indicated that the overall magnitude of the contribution of total R&D personnel to S&T cooperation in the sample countries varied less with the time series, i.e., taken together, total R&D personnel can usually be regarded as a stabilizer in the international S&T cooperation.
Since the S&T cooperation between Xinjiang and countries along the “Belt and Road” has entered a critical period of advancement, to comprehensively improve the level and effectiveness of cooperation and help construct the Silk Road Economic Belt core area, the following points should be achieved. First, China should continue to grow its circle of friends and establish a closer and wider cooperation network and continue to increase S&T, urban construction, and investment in S&T to increase the endogenous power of cooperation. Secondly, for the top-ranking countries in terms of effectiveness of international S&T cooperation with Xinjiang, China should continue to strengthen cooperation, expand cooperation areas, and strive for greater results. Simultaneously, the cooperation effectiveness of the lower countries should also be consistent with the needs of both sides to conduct fruitful cooperation characteristics and form a multi-level, all-round three-dimensional pattern of foreign cooperation. Third, for countries with high volatility of cooperation effectiveness, we should rely on the national diplomatic strategy, use legal and patent protection and other means to try to avoid cooperation risks, and continue to conduct cooperation that is beneficial to both sides. Fourth, China should increase the training support and service guarantee for Xinjiang R&D personnel so that they can stabilize their minds and concentrate on research and foreign cooperation without distractions, and talents will become the stabilizer and power source of international S&T cooperation between Xinjiang and the “Belt and Road” countries.
Author Contributions
Conceptualization, Z.D. and J.D.; methodology, F.W., Z.D. and J.D.; software, F.W. and Z.D.; validation, Z.D. and J.D.; formal analysis, F.W. and Z.D.; data curation, Z.D. and J.D.; writing—original draft preparation, F.W. and Z.D.; writing—review and editing, Z.D. and J.D.; supervision, Z.D. and J.D. All authors have read and agreed to the published version of the manuscript.
Funding
This research was funded by the National Natural Science Foundation of China (72004214; 71850014; 71974180).
Institutional Review Board Statement
Not applicable.
Informed Consent Statement
Not applicable.
Data Availability Statement
Data will be available upon request to the corresponding author.
Acknowledgments
We want to thank the editor and anonymous reviewers for their valuable comments and suggestions to this paper.
Conflicts of Interest
The authors declare that they have no conflict of interest.
References
- Lu, Y.; Zhang, Y.; Cao, X.; Wang, C.; Wang, Y.; Zhang, M.; Ferrier, R.C.; Jenkins, A.; Yuan, J.; Bailey, M.J. Forty years of reform and opening up: China’s progress toward a sustainable path. Sci. Adv. 2019, 5, eaau9413. [Google Scholar] [CrossRef]
- Ullah, A.; Pinglu, C.; Ullah, S.; Hashmi, S.H. Nexus of regional integration, socioeconomic determinants and sustainable development in belt and road initiative countries. PloS ONE 2021, 16, e0254298. [Google Scholar] [CrossRef]
- Chen, Z.; Wang, H. Research on the impact of the Belt and Road Initiative on the sustainability of the resource-based economy of participating countries. Environ. Sci. Pollut. Res. 2022, 29, 91139–91154. [Google Scholar] [CrossRef]
- Li, Z.; Shi, H.; Liu, H. Research on the concentration, potential and mission of science and technology innovation in China. PloS ONE 2021, 16, e0257636. [Google Scholar] [CrossRef]
- Chen, J.; Cheng, J.; Dai, S. Regional eco-innovation in China: An analysis of eco-innovation levels and influencing factors. J. Clean. Prod. 2017, 153, 1–14. [Google Scholar] [CrossRef]
- Harlan, T. Green development or greenwashing? A political ecology perspective on China’s green Belt and Road. Eurasian Geogr. Econ. 2021, 62, 202–226. [Google Scholar] [CrossRef]
- Li, J.; Liu, G.; Ma, Z. RD internationalization, domestic technology alliance, and innovation in emerging market. PloS ONE 2021, 16, e0252669. [Google Scholar] [CrossRef]
- Peng, Y.; Yu, A. Innovative competitiveness evaluation of typical cities of China: A study of factor analysis. In Energy and Environment; CRC Press: Boca Raton, FL, USA, 2015; pp. 101–106. [Google Scholar]
- Gong, C.; Wan, Y. A Study of Fiscal Expenditure Structure and Green Economic Growth Effects: A Sample from Asian Economies. J. Environ. Public Health 2022, 2022, 2180532. [Google Scholar] [CrossRef]
- Lam, J.S.L.; Cullinane, K.P.B.; Lee, P.T.-W. The 21st-century Maritime Silk Road: Challenges and opportunities for transport management and practice. Transp. Rev. 2018, 38, 413–415. [Google Scholar] [CrossRef]
- Yan, Y.; Jiang, L.; He, X.; Hu, Y.; Li, J. Spatio-temporal evolution and influencing factors of scientific and technological innovation level: A multidimensional proximity perspective. Front. Psychol. 2022, 13, 920033. [Google Scholar] [CrossRef]
- Liu, Y.; Yang, Y.; Zheng, S.; Xiao, L.; Gao, H.; Lu, H. Dynamic Impact of Technology and Finance on Green Technology Innovation Efficiency: Empirical Evidence from China’s Provinces. Int. J. Environ. Res. Public Health 2022, 19, 4764. [Google Scholar] [CrossRef] [PubMed]
- Teece, D.J. Competition, cooperation, and innovation: Organizational arrangements for regimes of rapid technological progress. J. Econ. Behav. Organ. 1992, 18, 1–25. [Google Scholar] [CrossRef]
- Marginson, S. What drives global science? The four competing narratives. Stud. High. Educ. 2022, 47, 1566–1584. [Google Scholar] [CrossRef]
- Shen, Z.; Siraj, A.; Jiang, H.; Zhu, Y.; Li, J. Chinese-style innovation and its international repercussions in the new economic times. Sustainability 2020, 12, 1859. [Google Scholar] [CrossRef]
- He, S.; Yao, H.; Ji, Z. Direct and Indirect Effects of Business Environment on BRI Countries’ Global Value Chain Upgrading. Int. J. Environ. Res. Public Health 2021, 18, 12492. [Google Scholar] [CrossRef]
- Xue, H.; Lan, X.; Zhang, Q.; Liang, H.; He, Z. Assessment of the green development level for participating countries in the Belt and Road initiative. Ann. Oper. Res. 2021, 29, 91139–91154. [Google Scholar] [CrossRef]
- Liu, Y.; Suk, S. Influencing Factors of Azerbaijan and China’s Sustainable Tourism Development Strategy under the One Belt One Road Initiative. Sustainability 2021, 14, 187. [Google Scholar] [CrossRef]
- Morgan, S.; Pfaff, A.; Wolfersberger, J. Environmental Policies Benefit Economic Development: Implications of Economic Geography. Annu. Rev. Resour. Econ. 2022, 14, 427–446. [Google Scholar] [CrossRef]
- Kwiek, M. What large-scale publication and citation data tell us about international research collaboration in Europe: Changing national patterns in global contexts. Stud. High. Educ. 2021, 46, 2629–2649. [Google Scholar] [CrossRef]
- Guo, J.; Zhang, B.; Guo, Y.; Li, F. Expectation or risk aversion when outward foreign direct investment firms invest in the belt and road: Evidence from China. Res. Int. Bus. Financ. 2022, 62, 101728. [Google Scholar] [CrossRef]
- Gao, J.; Yu, X. Factors Affecting the Evolution of Technical Cooperation among “Belt and Road Initiative” Countries Based on TERGMs and ERGMs. Sustainability 2022, 14, 1760. [Google Scholar] [CrossRef]
- Huan, Y.; Liang, T.; Li, H.; Zhang, C. A systematic method for assessing progress of achieving sustainable development goals: A case study of 15 countries. Sci. Total Environ. 2021, 752, 141875. [Google Scholar] [CrossRef] [PubMed]
- Li, Y.; Zhang, Y.; Lee, C.-C.; Li, J. Structural characteristics and determinants of an international green technological collaboration network. J. Clean. Prod. 2021, 324, 129258. [Google Scholar] [CrossRef]
- Beaver, D.; Rosen, R. Studies in scientific collaboration Part III. Professionalization and the natural history of modern scientific co-authorship. Scientometrics 1979, 1, 231–245. [Google Scholar] [CrossRef]
- Chen, K.; Zhang, Y.; Fu, X. International research collaboration: An emerging domain of innovation studies? Res. Policy 2018, 48, 149–168. [Google Scholar] [CrossRef]
- Wang, F.; Dong, Z.; Dong, J.-c. Can international cooperation base for science and technology drive cooperation ability? Evidence from Xinjiang China. Int. Rev. Econ. Financ. 2022, 82, 699–706. [Google Scholar] [CrossRef]
- Wang, Y.; Luo, J.; Zhou, X. Evolution of Science and Technology Cooperation among China and Countries in the Belt and Road Initiative Area over the Past 40 Years. Sci. Technol. Prog. Policy 2016, 33, 1–8. [Google Scholar]
- Zhang, C.; Ouyang, D. The Determinants of China’s International Research Cooperation under “The Belt and Road” Strategy —An Empirical Analysis based on Web of Science Database. J. Int. Trade 2017, 4, 74–82. [Google Scholar]
- Li, W.; Zhu, C. Evolution of China’s Role and Status in International Science and Technology Cooperation Network: An Empirical Study Based on the Data of International Patent Cooperation from 2000 to 2015. Sci. Technol. Manag. Res. 2019, 39, 44–50. [Google Scholar]
- Guerrero Bote, V.P.; Olmeda-Gómez, C.; de Moya-Anegón, F. Quantifying the benefits of international scientific collaboration. J. Am. Soc. Inf. Sci. Technol. 2013, 64, 392–404. [Google Scholar] [CrossRef]
- Bonilla, K.; Salles-Filho, S.; Bin, A. Building Science, Technology, and Research Capacity in Developing Countries: Evidence from student mobility and international cooperation between Korea and Guatemala. STI Policy Rev. 2018, 9, 99–132. [Google Scholar]
- Kotsemir, M.; Kuznetsova, T.; Nasybulina, E.; Pikalova, A. Identifying directions for Russia’s science and technology cooperation. Φopcaŭm 2015, 9, 54–72. [Google Scholar]
- Park, S.-I. Institutional Evolution of Korea’s International Cooperation of Science and Technology from the Viewpoint of the Historical Institutionalism. J. Korea Technol. Innov. Soc. 2011, 14, 516–551. [Google Scholar]
- Kong, Q.; Chen, A.; Shen, C.; Wong, Z. Has the Belt and Road Initiative improved the quality of economic growth in China’s cities? Int. Rev. Econ. Financ. 2021, 76, 870–883. [Google Scholar] [CrossRef]
- Saif-Alyousfi, A.Y. Do FDI inflows affect the off-balance sheet activities of banks in GCC economies? China Financ. Rev. Int. 2020, 11, 201–229. [Google Scholar] [CrossRef]
- Wang, L.; Pei, R.; Yang, M.; Wang, J.; Li, H. Evolution and Impact of International Cooperation Networks: A Comparison between CAS and MPG. Manag. Rev. 2021, 33, 89–96. [Google Scholar]
- Zhang, X.Y.; Zhang, L.; Chen, Z.; Zhang, X.; Zhou, Z. Design and Implementation of “One Belt, One Road” Cooperation Country Portrait Index System Based on Multi-Source Data Fusion. In Proceedings of the 2019 4th IEEE International Conference on Cybernetics (Cybconf), Beijing, China, 5–7 July 2019; IEEE: Piscataway, NJ, USA, 2019; pp. 1–6. [Google Scholar]
- Wang, F.; Liu, J.; Qiao, X. An Empirical Study on the Relationship between Scientific Collaboration and Knowledge Production of the Countries along the Belt and Road. Sustainability 2022, 14, 14489. [Google Scholar] [CrossRef]
- Montobbio, F.; Sterzi, V. The globalization of technology in emerging markets: A gravity model on the determinants of international patent collaborations. World Dev. 2013, 44, 281–299. [Google Scholar] [CrossRef]
- Long, R.; Yang, R.; Song, M.; Ma, L. Measurement and calculation of carbon intensity based on ImPACT model and scenario analysis: A case of three regions of Jiangsu province. Ecol. Indic. 2015, 51, 180–190. [Google Scholar] [CrossRef]
- Jiang, Q.; Ma, X.; Wang, Y. How does the one belt one road initiative affect the green economic growth? Energy Econ. 2021, 101, 105429. [Google Scholar] [CrossRef]
- Wei, Y.; Wang, C.; Qi, Y.; Wang, H.; Li, F.; Chen, F. Dynamic evaluation of the influence of drafting units in China’s air quality standards network. J. Clean. Prod. 2020, 252, 119834. [Google Scholar] [CrossRef]
- York, R.; Rosa, E.A.; Dietz, T. STIRPAT, IPAT and ImPACT: Analytic tools for unpacking the driving forces of environmental impacts. Ecol. Econ. 2003, 46, 351–365. [Google Scholar] [CrossRef]
- Wang, L.; Zhao, Z.; Wang, X.; Xue, X. Transportation de-carbonization pathways and effect in China: A systematic analysis using STIRPAT-SD model. J. Clean. Prod. 2021, 288, 125574. [Google Scholar] [CrossRef]
- Kardon, I.B.; Kennedy, C.M.; Dutton, P.A. China Maritime Report No. 7: Gwadar: China’s Potential Strategic Strongpoint in Pakistan; U.S. Naval War College: Newport, RI, USA, 2020. [Google Scholar]
- Wang, F.; Dong, Z.; Dong, J.-C. An Analysis of the Construction Effectiveness of International Science and Technology Cooperation Bases and Cooperation Capacity of International Science and Technology in Xinjiang Province of China. SSRN 2021, 3994452. Available online: https://ssrn.com/abstract=3994452 (accessed on 1 August 2022). [CrossRef]
- Cieślik, E. Cross-Sectoral Inter-Country Linkages under the Belt and Road Initiative: Chinese ICT Services Value Added Inflows to Manufacturing Exports in the New Eurasian Land Bridge Economies. Sustainability 2020, 12, 8675. [Google Scholar] [CrossRef]
- Yang, J. An Empirical Study Evaluating the Symbiotic Efficiency of China’s Provinces and the Innovation Ecosystem in the High-Tech Industry. Complexity 2022, 2022, 1391415. [Google Scholar] [CrossRef]
- Cao, J.; Zhang, Y.; Wei, T.; Sun, H. Temporal–Spatial Evolution and Influencing Factors of Coordinated Development of the Population, Resources, Economy and Environment (PREE) System: Evidence from 31 Provinces in China. Int. J. Environ. Res. Public Health 2021, 18, 13049. [Google Scholar] [CrossRef]
- Zheng, C.; Zhuo, C.; Deng, F. Coordination of IFDI and OFDI, government innovation support, and China’s industrial green transformation. Environ. Sci. Pollut. Res. 2022, 29, 82199–82217. [Google Scholar] [CrossRef]
- Sun, L.-y.; Miao, C.-l.; Yang, L. Ecological-economic efficiency evaluation of green technology innovation in strategic emerging industries based on entropy weighted TOPSIS method. Ecol. Indic. 2017, 73, 554–558. [Google Scholar] [CrossRef]
- Yin, S.; Zhang, N.; Li, B. Enhancing the competitiveness of multi-agent cooperation for green manufacturing in China: An empirical study of the measure of green technology innovation capabilities and their influencing factors. Sustain. Prod. Consum. 2020, 23, 63–76. [Google Scholar] [CrossRef]
- Chen, Q.; Chen, S.; Shi, C.; Pang, Q.; Li, A. Evaluation of Agricultural Investment Environment in Countries around the Black Sea under the Background of the Belt and Road; Natural Resources Forum; Wiley Online Library: New York, NY, USA, 2021; pp. 464–483. [Google Scholar]
- Tzeng, G.-H.; Huang, J.-J. Multiple Attribute Decision Making: Methods and Applications; CRC Press: Boca Raton, FL, USA, 2011. [Google Scholar]
- Hottenroth, H.; Sutardhio, C.; Weidlich, A.; Tietze, I.; Simon, S.; Hauser, W.; Naegler, T.; Becker, L.; Buchgeister, J.; Junne, T. Beyond climate change. Multi-attribute decision making for a sustainability assessment of energy system transformation pathways. Renew. Sustain. Energy Rev. 2022, 156, 111996. [Google Scholar] [CrossRef]
- Liu, L.; Wan, X.; Li, J.; Wang, W.; Gao, Z. An Improved Entropy-Weighted Topsis Method for Decision-Level Fusion Evaluation System of Multi-Source Data. Sensors 2022, 22, 6391. [Google Scholar] [CrossRef] [PubMed]
- Sun, C.; Miao, B. Performance Evaluation of Reducing Consumption of Energy in the Yangtze River Delta under the Background of Low-Carbon Economy. J. Math. 2022, 2022, 3235776. [Google Scholar] [CrossRef]
- Ngoduy, D. Noise-induced instability of a class of stochastic higher order continuum traffic models. Transp. Res. Part B Methodol. 2021, 150, 260–278. [Google Scholar] [CrossRef]
- Sun, Q.; Yang, G.; Zhou, A. An entropy-based self-adaptive node importance evaluation method for complex networks. Complexity 2020, 2020, 4529429. [Google Scholar] [CrossRef]
- Zhao, D.-Y.; Ma, Y.-Y.; Lin, H.-L. Using the Entropy and TOPSIS Models to Evaluate Sustainable Development of Islands: A Case in China. Sustainability 2022, 14, 3707. [Google Scholar] [CrossRef]
- Li, Z.; Luo, Z.; Wang, Y.; Fan, G.; Zhang, J. Suitability evaluation system for the shallow geothermal energy implementation in region by Entropy Weight Method and TOPSIS method. Renew. Energy 2022, 184, 564–576. [Google Scholar] [CrossRef]
- Li, X. TOPSIS model with entropy weight for eco geological environmental carrying capacity assessment. Microprocess. Microsyst. 2021, 82, 103805. [Google Scholar] [CrossRef]
- Rao, C.; Gao, Y. Evaluation mechanism design for the development level of urban-rural integration based on an improved TOPSIS method. Mathematics 2022, 10, 380. [Google Scholar] [CrossRef]
- Wang, Y.; Yu, X.; Zhao, B.; Xiong, X.; Li, Y.; Zhang, M. Evaluation of ecological carrying capacity in Yangtze River Economic Belt and analysis of its spatial pattern evolution. Ecol. Indic. 2022, 144, 109535. [Google Scholar] [CrossRef]
- Wang, Y.; Liu, P.; Yao, Y. BMW-TOPSIS: A generalized TOPSIS model based on three-way decision. Inf. Sci. 2022, 607, 799–818. [Google Scholar] [CrossRef]
- Petchrompo, S.; Wannakrairot, A.; Parlikad, A.K. Pruning Pareto optimal solutions for multi-objective portfolio asset management. Eur. J. Oper. Res. 2022, 297, 203–220. [Google Scholar] [CrossRef]
- Abdo, A.L.B.; Bin, L.; Zhang, X.; Saeed, M.; Qahtan, A.S.A.; Ghallab, H.M.H. Spatial analysis of financial development’s effect on the ecological footprint of belt and road initiative countries: Mitigation options through renewable energy consumption and institutional quality. J. Clean. Prod. 2022, 366, 132696. [Google Scholar]
- Yang, B.; Usman, M. Do industrialization, economic growth and globalization processes influence the ecological footprint and healthcare expenditures? Fresh insights based on the STIRPAT model for countries with the highest healthcare expenditures. Sustain. Prod. Consum. 2021, 28, 893–910. [Google Scholar] [CrossRef]
- Lohwasser, J.; Schaffer, A.; Brieden, A. The role of demographic and economic drivers on the environment in traditional and standardized STIRPAT analysis. Ecol. Econ. 2020, 178, 106811. [Google Scholar] [CrossRef]
- Ma, H.; Liu, Y.; Li, Z.; Wang, Q. Influencing factors and multi-scenario prediction of China’s ecological footprint based on the STIRPAT model. Ecol. Inform. 2022, 69, 101664. [Google Scholar] [CrossRef]
- Xie, P.; Liao, J.; Pan, X.; Sun, F. Will China’s carbon intensity achieve its policy goals by 2030? Dynamic scenario analysis based on STIRPAT-PLS framework. Sci. Total Environ. 2022, 832, 155060. [Google Scholar] [CrossRef]
- Lv, T.; Hu, H.; Xie, H.; Zhang, X.; Wang, L.; Shen, X. An empirical relationship between urbanization and carbon emissions in an ecological civilization demonstration area of China based on the STIRPAT model. Environ. Dev. Sustain. 2022, 1–22. [Google Scholar] [CrossRef]
- Xu, F.; Huang, Q.; Yue, H.; He, C.; Wang, C.; Zhang, H. Reexamining the relationship between urbanization and pollutant emissions in China based on the STIRPAT model. J. Environ. Manag. 2020, 273, 111134. [Google Scholar] [CrossRef]
- Qin, B.; Zeng, D.; Gao, A. Convergence effect of the Belt and Road Initiative on income disparity: Evidence from China. Humanit. Soc. Sci. Commun. 2022, 9, 1–16. [Google Scholar] [CrossRef]
- Grančay, M.; Dudáš, T.; Mura, L. Revealed comparative advantages in academic publishing of “old” and “new” European Union Member States 1998–2018. Scientometrics 2022, 127, 1247–1271. [Google Scholar] [CrossRef]
- Cao, Y.H.; You, J.X.; Shi, Y.J.; Hu, W. Research on the Allocation Efficiency and Influencing Factors of Scientific and Technological Resources in the Yangtze River Delta City Group. Sustainability 2021, 13, 7951. [Google Scholar] [CrossRef]
- Yang, G.; Gong, G.; Luo, Y.; Yang, Y.; Gui, Q. Spatiotemporal Characteristics and Influencing Factors of Tourism–Urbanization–Technology–Ecological Environment on the Yunnan–Guizhou–Sichuan Region: An Uncoordinated Coupling Perspective. Int. J. Environ. Res. Public Health 2022, 19, 8885. [Google Scholar] [CrossRef] [PubMed]
- Ke, H.; Dai, S.; Fan, F. Does innovation efficiency inhibit the ecological footprint? An empirical study of China’s provincial regions. Technol. Anal. Strateg. Manag. 2021, 34, 1369–1383. [Google Scholar] [CrossRef]
- Xue, Y.; Li, Y. Cohesion of Agricultural Crowdfunding Risk Prevention under Sustainable Development Based on Gray–Rough Set and FAHP-TOPSIS. Sustainability 2022, 14, 12709. [Google Scholar] [CrossRef]
- Han, Z.; Ma, H. Adaptability Assessment and Analysis of Temporal and Spatial Differences of Water-Energy-Food System in Yangtze River Delta in China. Sustainability 2021, 13, 13543. [Google Scholar] [CrossRef]
- Hoerl, A.E.; Kennard, R.W. Ridge regression: Biased estimation for nonorthogonal problems. Technometrics 1970, 12, 55–67. [Google Scholar] [CrossRef]
- Eledum, H.; Awadallah, H.H. A Monte Carlo Study for Dealing with Multicollinearity and Autocorrelation Problems in Linear Regression Using Two Stage Ridge Regression Method. Statistics 2021, 9, 630–638. [Google Scholar] [CrossRef]
- McCarthy, R.V.; McCarthy, M.M.; Ceccucci, W. Predictive models using regression. In Applying Predictive Analytics; Springer: Berlin/Heidelberg, Germany, 2022; pp. 87–121. [Google Scholar]
- Wang, X.; Xu, L. The Impact of Technological Innovation on Economic Growth: Evidence from China. In Proceedings of the 2021 3rd International Conference on Economic Management and Cultural Industry (ICEMCI 2021), Guangzhou, China, 22–24 October 2021; Atlantis Press: Amsterdam, The Netherlands, 2021; pp. 1911–1916. [Google Scholar]
- Zhang, F.; Deng, X.; Phillips, F.; Fang, C.; Wang, C. Impacts of industrial structure and technical progress on carbon emission intensity: Evidence from 281 cities in China. Technol. Forecast. Soc. Chang. 2020, 154, 119949. [Google Scholar] [CrossRef]
- Yu, B.; Fang, D.; Kleit, A.N.; Xiao, K. Exploring the driving mechanism and the evolution of the low-carbon economy transition: Lessons from OECD developed countries. World Econ. 2022, 45, 2766–2795. [Google Scholar] [CrossRef]
- Liu, Y.; Zuo, R.; Dong, Y. Analysis of temporal and spatial characteristics of urban expansion in Xiaonan District from 1990 to 2020 using time series Landsat imagery. Remote Sens. 2021, 13, 4299. [Google Scholar] [CrossRef]
- Chun, Z. The Belt and Road Initiative and global governance in transition. China Q. Int. Strateg. Stud. 2017, 3, 175–191. [Google Scholar] [CrossRef]
- Yin, Y.; Liu, Y. Investment Suitability Assessment Based on B&R Symbiotic System Theory: Location Choice of China’s OFDI. Systems 2022, 10, 195. [Google Scholar]
- Moser, H. Reshoring Was at Record Levels in 2018 IS IT ENOUGH? Ind. Week 2019, 268, 28–31. [Google Scholar]
- Yan, S. Research on the Mode of Science and Technology Cooperation between Shaanxi Province and Countries along the “the Belt and Road”. Master’s Thesis, Xi’an University of Technology, Xi’an, China, 2021. [Google Scholar]
- Dey, B.L.; Babu, M.M.; Rahman, M.; Dora, M.; Mishra, N. Technology upgrading through co-creation of value in developing societies: Analysis of the mobile telephone industry in Bangladesh. Technol. Forecast. Soc. Chang. 2019, 145, 413–425. [Google Scholar] [CrossRef]
- Geroski, P.A. Models of technology diffusion. Res. Policy 2000, 29, 603–625. [Google Scholar] [CrossRef]
- Ferdinand, P. Westward ho—The China dream and ‘one belt, one road’: Chinese foreign policy under Xi Jinping. Int. Aff. 2016, 92, 941–957. [Google Scholar] [CrossRef]
- Ahmad, F.; Draz, M.U.; Su, L.; Ozturk, I.; Rauf, A. Tourism and environmental pollution: Evidence from the one belt one road provinces of Western China. Sustainability 2018, 10, 3520. [Google Scholar] [CrossRef]
- Cao, M.; Alon, I. Intellectual structure of the belt and road initiative research: A scientometric analysis and suggestions for a future research agenda. Sustainability 2020, 12, 6901. [Google Scholar] [CrossRef]
- Buckley, P.J. China’s belt and road initiative: Changing the rules of globalization. J. Int. Bus. Stud. 2020, 51, 279–281. [Google Scholar] [CrossRef]
- Gülseven, Y. China’s Belt and Road Initiative and South-South Cooperation. J. Balk. Near East. Stud. 2022, 1–16. [Google Scholar] [CrossRef]


Disclaimer/Publisher’s Note: The statements, opinions and data contained in all publications are solely those of the individual author(s) and contributor(s) and not of MDPI and/or the editor(s). MDPI and/or the editor(s) disclaim responsibility for any injury to people or property resulting from any ideas, methods, instructions or products referred to in the content. |
© 2023 by the authors. Licensee MDPI, Basel, Switzerland. This article is an open access article distributed under the terms and conditions of the Creative Commons Attribution (CC BY) license (https://creativecommons.org/licenses/by/4.0/).