Article

Characteristic of Molecular Weight-Fractions of Soil Organic Matter from Calcareous Soil and Yellow Soil

1
School of Resources and Environmental Engineering, Guizhou Institute of Technology, Guiyang 550003, China
2
State Key Laboratory of Environmental Geochemistry, Institute of Geochemistry, Chinese Academy of Sciences, Guiyang 550002, China
3
University of Chinese Academy of Sciences, Beijing 100049, China
*
Author to whom correspondence should be addressed.
Sustainability 2023, 15(2), 1537; https://doi.org/10.3390/su15021537
Submission received: 4 November 2022 / Revised: 12 December 2022 / Accepted: 13 December 2022 / Published: 13 January 2023
(This article belongs to the Special Issue Soil Carbon Cycle and the Response to Global Change)

Abstract

:
Soil organic matter (SOM), along with the rock weathering, originating from the residues of animals, plants and microorganisms involved in soil formation and evolution. The stability of SOM could directly produce an effect on carbon sequestration. To elucidate the stability characteristics of SOM in karst areas at the molecular structure level, in this study, the humic acids (HA), as the major proxy of SOM, were extracted, purified, and ultra-filtrated. The HA from calcareous soil were fractionated into five size fractions, while the HA from yellow soil were separated into eight size fractions. Via the analysis of potentiometric titration, FTIR, and CPMAS 13C NMR, the results showed some common features, whereby compared with the bigger size fractions, the smaller size fractions have much lower contents of aliphatic carbon, but have higher contents of aromatic carbon, carboxyl groups, ketonic groups, phenolic hydroxyl groups, and total acidity, which indicates that the smaller size fractions are more soluble as well as more degradable than the bigger ones. It was distinct that, in the size fractions of HA from calcareous soil, negative correlations between the acidic functional groups’ contents and the oxygen contents were found, suggesting that the oxygen was mainly located in the hydroxyl group of carbohydrates instead of carboxyl and hydroxyl groups in aromatic rings, and confirming that the bigger size fractions have much higher contents of carbohydrate subunits. According to the analysis, comparing with the HA in yellow soil, we presumed that the HA from calcareous soil were more polar and degradable. However HA from calcareous soil had a larger molecular size than that of HA from yellow soil, as well as, calcareous soil had a higher content of SOM than that of the same layer of yellow soil which suggests that the conservation mechanism of HA in calcareous is not only the organic molecular structure resistance but also the chemical protection from forming complexes with calcium or/and physical protection from enclosing by hypergene CaCO3 precipitation.

1. Introduction

Soil organic matter (SOM) is a major component of soil, which mainly comes from the residues of animals, plants, and microorganisms. It is an organic assembly with a complex composition and structure characteristics formed by partial decomposition and abiotic transformation of microorganisms [1]. Globally, soil (1 m deep) organic carbon storage is about 1500 Pg, almost two times that of atmospheric carbon storage and three times that of the terrestrial vegetation carbon storage [2]. The changes in the soil organic carbon pool may profoundly impact the atmospheric CO2 concentration and global carbon balance [3], which are controlled by the persistence of soil organic carbon [4]. The persistence, in other words the stabilization of SOM, refers to the ability of SOM to resist degradation by microorganisms and maintain a relatively high level [5].
The stabilization mechanism of SOM mainly includes soil organic molecular structure resistance, physical protection from soil aggregates, and chemical protection from the interaction with soil inorganic minerals [6]. To reveal the underlying mechanisms of SOM sequestration, it is critical to have insight on the SOM features at the molecular scale [7]. Lignin and its derivatives had not been as persistent as previously deemed because it could be degraded quickly in suitable ambient conditions [8,9]. On the contrary, polysaccharides, carbohydrates, amino sugars, and long-chain alkanes were proven to have a long residence time under some circumstances [10,11,12,13]. Lehmann et al. attempted to propose a conceptual model to illustrate the significance of molecular species diversity in controlling SOM persistence [14]. In general, SOM mineralization is restricted at high molecular species diversity because the greater the molecular species diversity of an available substance, the greater the cost–benefit ratio of energy with their decomposition by microorganisms [14,15]. However, it is not completely known how to quantify SOM molecular species diversity to control the degradation and persistence of SOM [14]. Therefore, more studies are required to unravel the importance of molecular species in the stabilization of SOM, especially from the molecular structure perspective and under various ecosystems.
Calcareous soil is a kind of non-zonal soil in karst areas, developed in the carbonate rock. The CO2 in calcareous soil produced by the degradation of SOM is an important driving force of karstification, which circulates and exchanges with adjacent layers of an epikarst system [16]. Briefly, the stability of SOM in calcareous soil is related to the dynamics of the soil carbon pool, and profoundly affects the carbon sink intensity of karst geological processes. Therefore, it is significant to elucidate the stability of the SOM in calcareous soil, mainly from the molecular level. Over the last decades, although the definition of humic substances (HS) and the process of humification have been questioned [17,18,19,20,21,22], the alkaline extraction experimental technique is still being utilized due to its easy operation, standardization and for traditional reasons, making it possible to systematically study SOM characteristics [23].
HS is the major component of SOM and is operationally divided into three subcomponents by solubility: (1) fulvic acid (FA), which is easily dissolved in aqueous solution at any pH, (2) humic acid (HA), which is dissolved in alkaline and weak acidic solutions of pH > 2 but is deposited in strongly acidic solutions of pH < 2, and (3) humin (HM), which is insoluble in acidic and alkaline solutions [24]. In some circumstances, especially in this work, HS is referred to as the humic acid (HA), which, comparatively, is a more appropriate candidate for the SOM development, not only because HA is the major part of SOM [24,25], but also because fulvic acids are more easily mobile and usually show little change along soil profiles [26], while humin is too stable for continuous soil microenvironment changes. As an experimentally defined HS fraction, HA is still a complex mixture of different organic molecules with a very wide range of molecular weight distributions [24,27,28], which may mask the molecular structure difference of HA from soils.
Ultrafiltration could further separate HA into relatively homogeneous subgroups according to their molecular size. For example, Tonelli et al. and Francioso et al. used ultrafiltration to divided dissolved organic matter and humic acids into different fractions and study the chemical characteristics of each group [29,30]. Li et al. employed ultrafiltration to separated and analyze the subgroups of the humic acids extracted from Pahokee peat, and the results manifested that different HA fractions could consist of two major subunits, aliphatic and aromatic, with varied proportions, and suggested that ultrafiltration is an effective technique to fractionate the complex humic acids into relatively homogeneous fractions and help to show the development of HA in sediment [31,32].
In our previous research, we discussed the elemental composition differences in the size fractions of HA from calcareous soil via ultrafiltration and elemental analysis [33]. In that paper, we proposed that a high calcium concentration in calcareous soils could play an important part in SOM sequestration via complexation reaction of calcium with HA and/or enclosing SOM with CaCO3 precipitation. The aims of this study were to further unveil the SOM structure characteristics in calcareous soil and illustrate the stabilization mechanism from a micro-perspective via potentiometric titration, Fourier transform infrared spectroscopy, and nuclear magnetic resonance. For comparison, the HA from yellow soil, which is the main zonal soil in the karst area, was also studied in this work.

2. Materials and Methods

2.1. The Extraction and Purification of HA

The details of the calcareous soil and the yellow soil sample were described elsewhere [33]. The extraction and purification of HA named LSBHA1 from the upper layer of calcareous soil and YSBHA1 from the upper layer of yellow soil using a modified standard procedure recommended by the International Humic Substance Society, which was detailed elsewhere [33].

2.2. Fractionation of HA by Ultrafiltration

The size fractions of HA from calcareous soil were fractioned by ultrafiltration, as detailed elsewhere [33]. In brief, the bulk HA (LSBHA1) were divided into 5 subgroups with different molecular sizes by a mini-Pellicon ultrafiltration device from Millipore (Billerica, MA01821, USA), utilizing 4 cassettes equipped with Biomax membranes with nominal molecular weight cutoffs of 50 k, 100 k, 300 k, and 500 k Dalton (500 kD). Under a nitrogen atmosphere, about 40 g of LSBHA1 solid powder was dissolved in 8 L of the diluted sodium hydroxide solution with pH 11, containing 100 mg/L of NaN3 to obtain the initial LSBHA1 solution (5000 mg/L). By following a combined diafiltration and concentration mode detailed elsewhere [32,34], under N2 gas protection and with a flow rate of 200 mL/min, this LSBHA1 solution was then ultra-filtrated into 5 fractions, named LSHA1-F1 (NMW > 500 kD), LSHA1-F2 (300 kD < NMW < 500 kD), LSHA1-F3 (100 kD < NMW < 300 kD), LSHA1-F4 (50 kD < NMW < 100 kD), and LSHA1-F5 (NMW < 50 kD). The bulk HA (YSBHA1) was ultra-filtrated using the same operation, except using 7 cassettes with nominal molecular weight cutoffs of 5 k, 10 k, 30 k, 50 k, 100 k, 300 k, and 500 k Dalton, and separated into 8 size fractions, named YSHA1-F1 (MW > 500 kD), YSHA1-F2 (300 kD < MW < 500 kD), YSHA1-F3 (100 kD < MW < 300 kD), YSHA1-F4 (50 kD < MW < 100 kD), YSHA1-F5 (30 kD < MW < 50 kD), YSHA1-F6 (10 kD < MW < 30 kD), YSHA1-F7 (5 kD < MW < 10 kD), and YSHA1-F8 (MW < 5 kD).

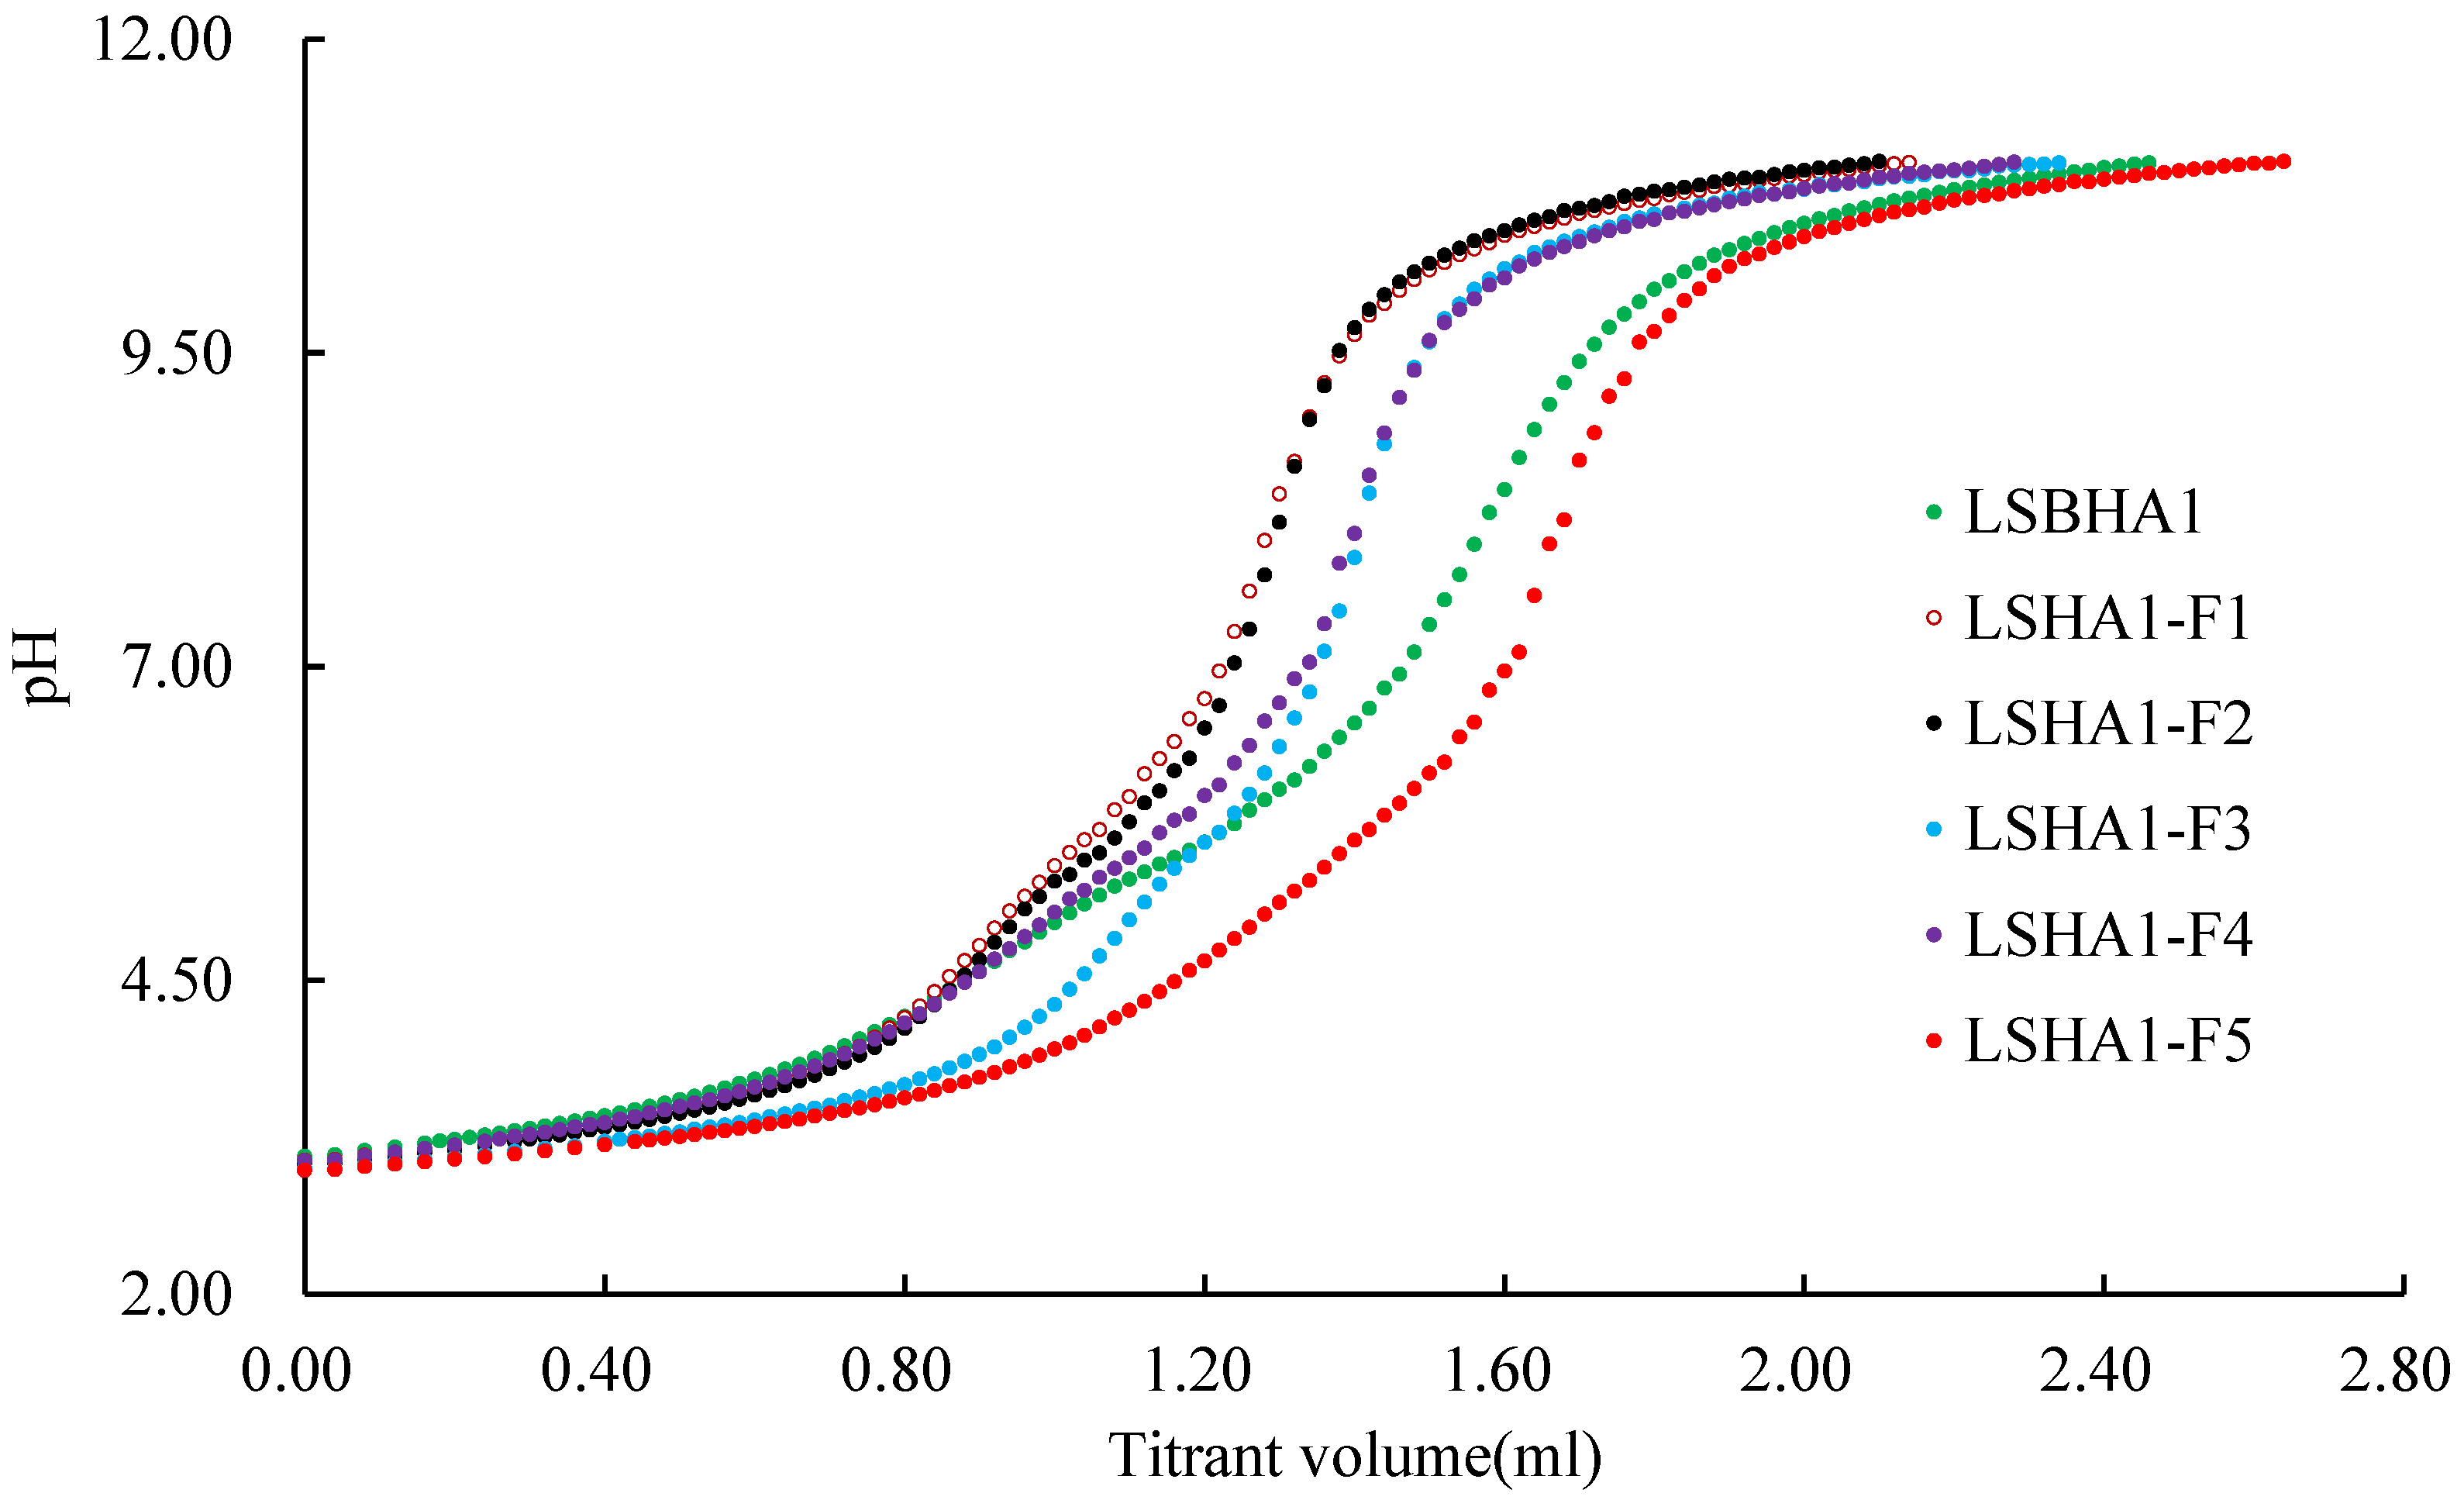
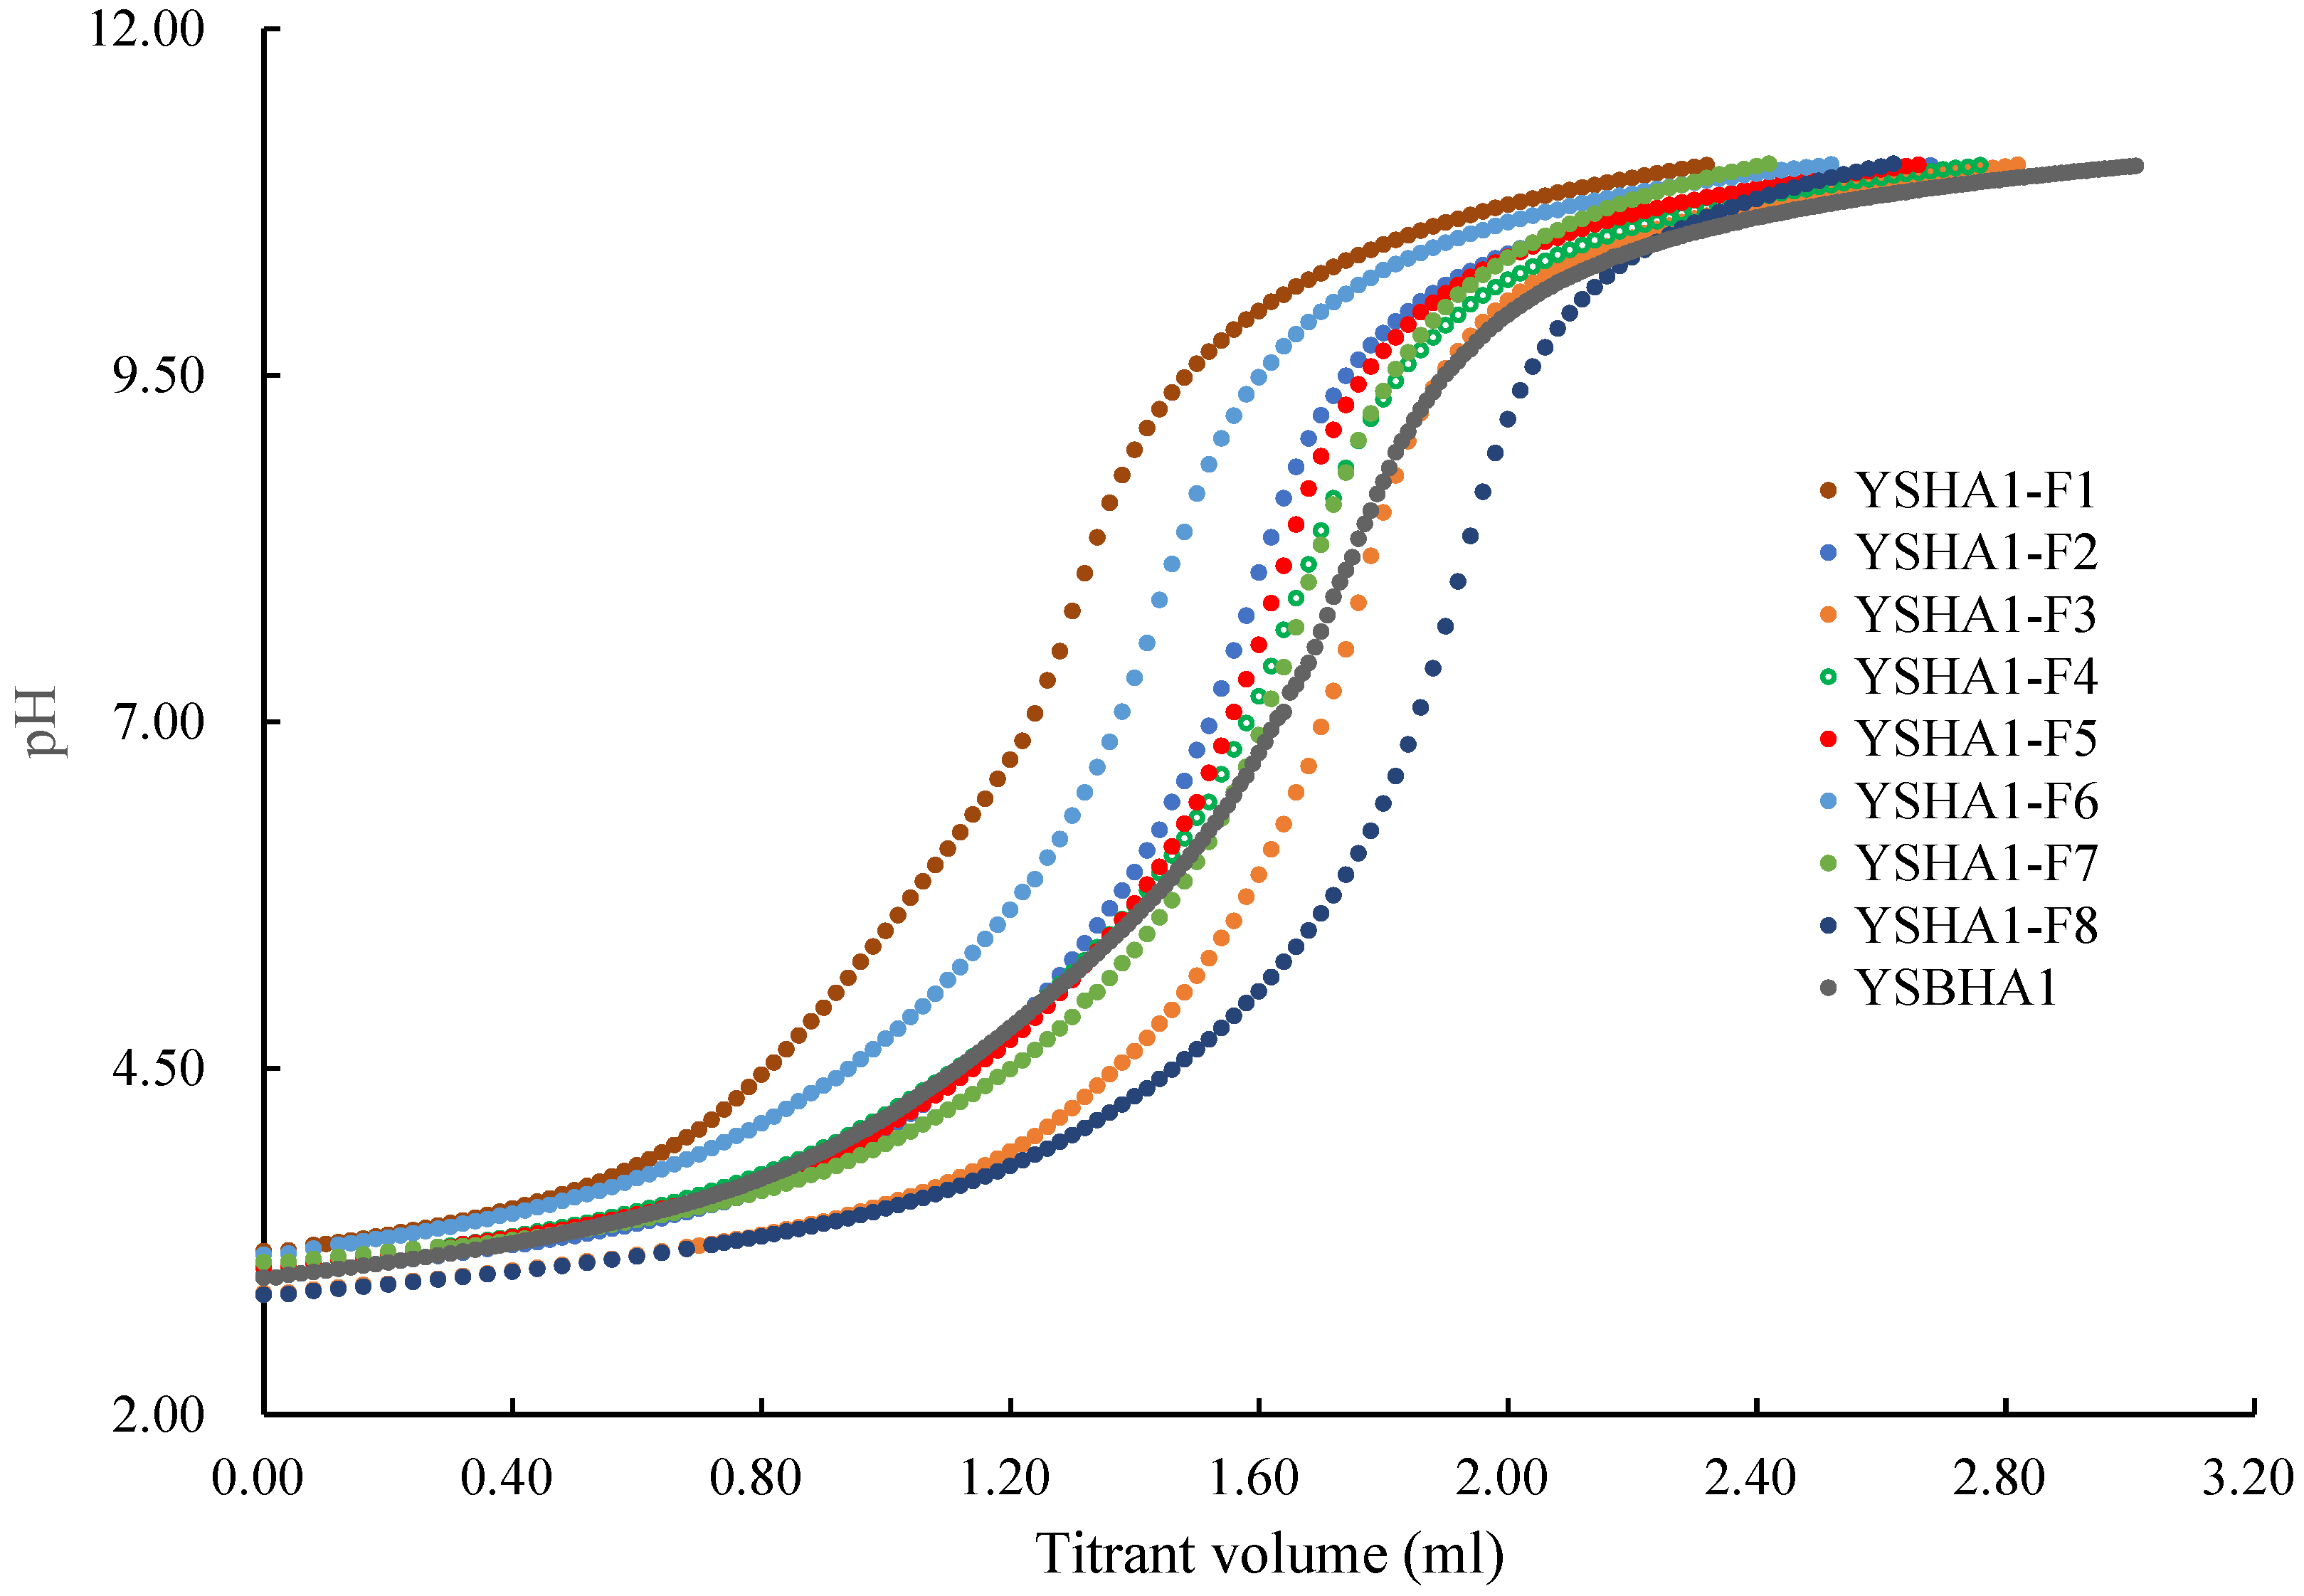
2.3. Titration of the Size Fractions of HAs and the Bulk HA

The acidic functional groups (carboxyl group, phenolic hydroxyl group) of HAs were analyzed by potential titration [35,36,37,38]. Briefly, 50 mg of HAs samples were weighed within an accuracy of 0.01 mg and then dissolved in 10 mL of 1 mol/L NaOH solution under N2 gas protection. After diluting with 20 mL of ultrapure water, the solution was acidified with 11 mL of 1 mol/L HCl and prepared with ultrapure water in the 100 mL volumetric flask to obtain a solution with pH < 3.0. Under N2 gas protection, 20 mL of the solution was diluted to 40 mL with ultrapure water and titrated with the standard alkaline solution with a concentration of 0.05 mol/L added and controlled by the auto-titrator (METTLER TOLEDO T50, Zurich, Switzerland).

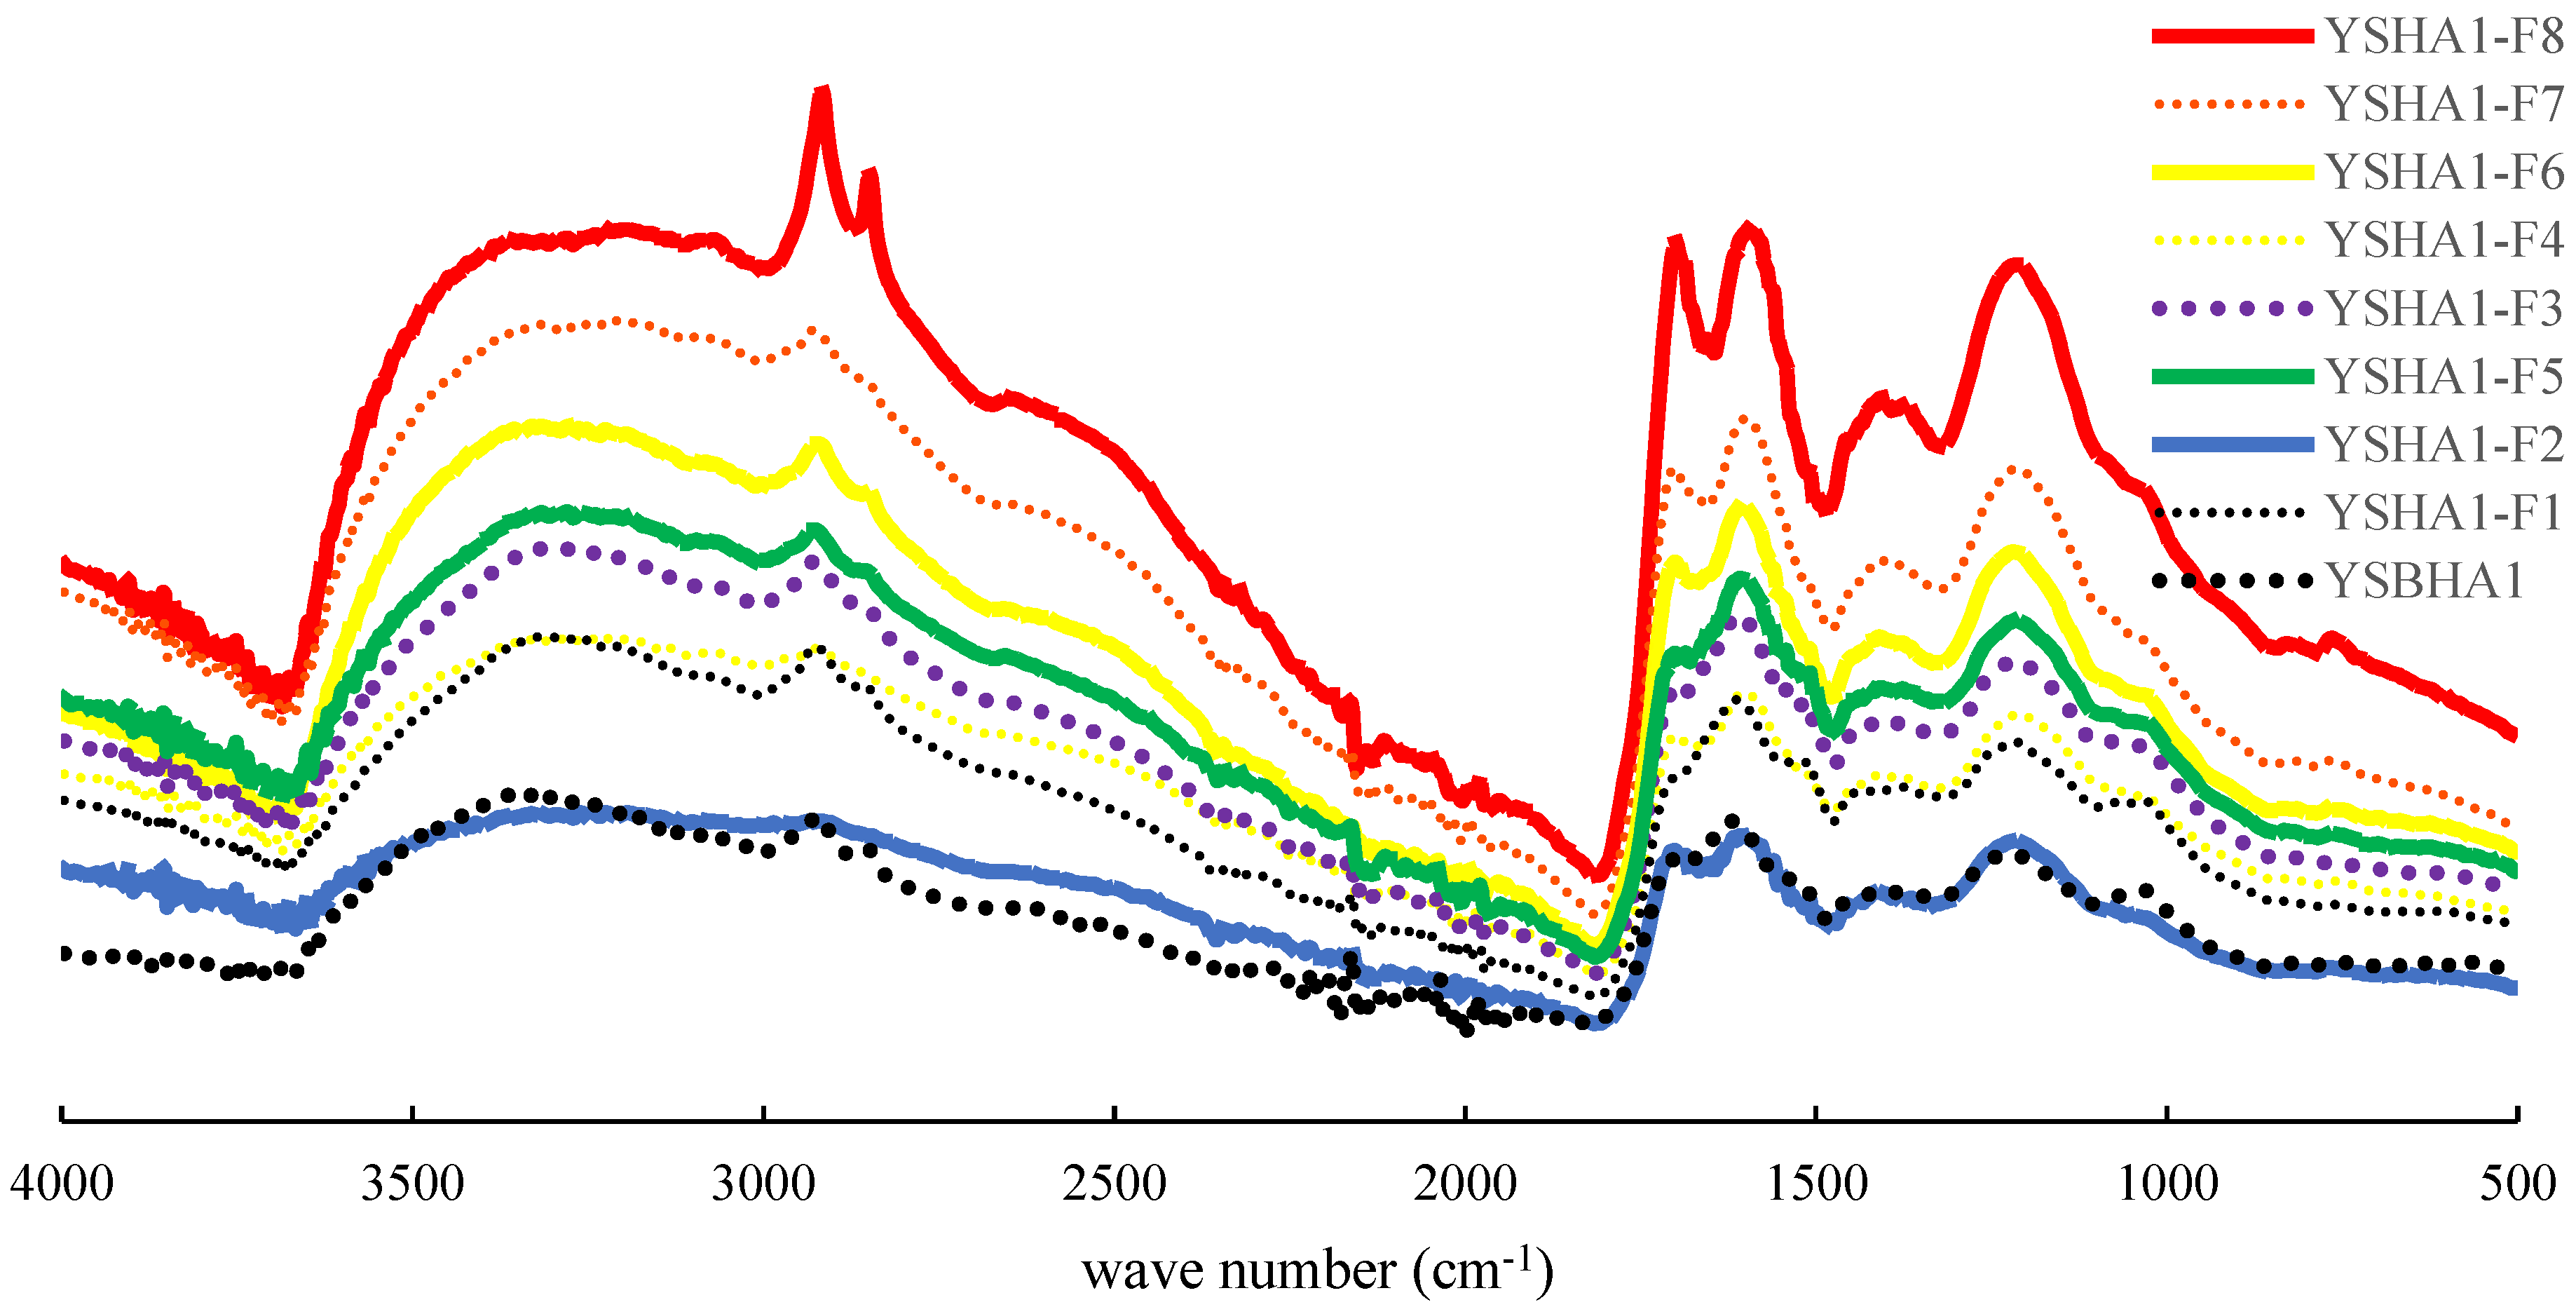
2.4. The Fourier Transform Infrared (FTIR) Spectroscopy of the Size Fractions of HAs and the Bulk HA

The infrared absorption curve of HAs with different molecular size and the bulk humic acids were scanned by the Fourier transform infrared spectroscopy (Bruker VERTEX 70 Ettlingen, Germany) with attenuated total reflectance (ATR) mode. A small amount of freeze-dried solid sample was simply placed on the crystal plane of the horizontal ATR kit equipped with a spectrometer. Spectral were scanned in the range of 500–4000 cm−1 with a resolution ratio of 4 cm−1.

2.5. The Solid 13C-NMR of the Size Fractions of HAs and the Bulk HA

The standard cross-polarized magic angle spin (CP MAS) resonance probe was used in the tests. About 100 mg of solid sample was loaded and compressed in the 4 mm-diameter ZrO2 rotor with a Kel-F cap, then placed on the probe of the Bruker AscendTM 600 WB spectrometer (Fllanden, Switzerland). The spectra were obtained on the spectrometer operating at 150.9 MHz for the 13C nucleus with a MAS rate of 8 kHz, a CP contact time of 2 ms, a relaxation delay time of 6.5 µs, and 3000 scans. Each spectrum was comprised of 2400 data points and the chemical shifts were normalized externally to glycine (176.03 ppm).

3. Results and Discussion

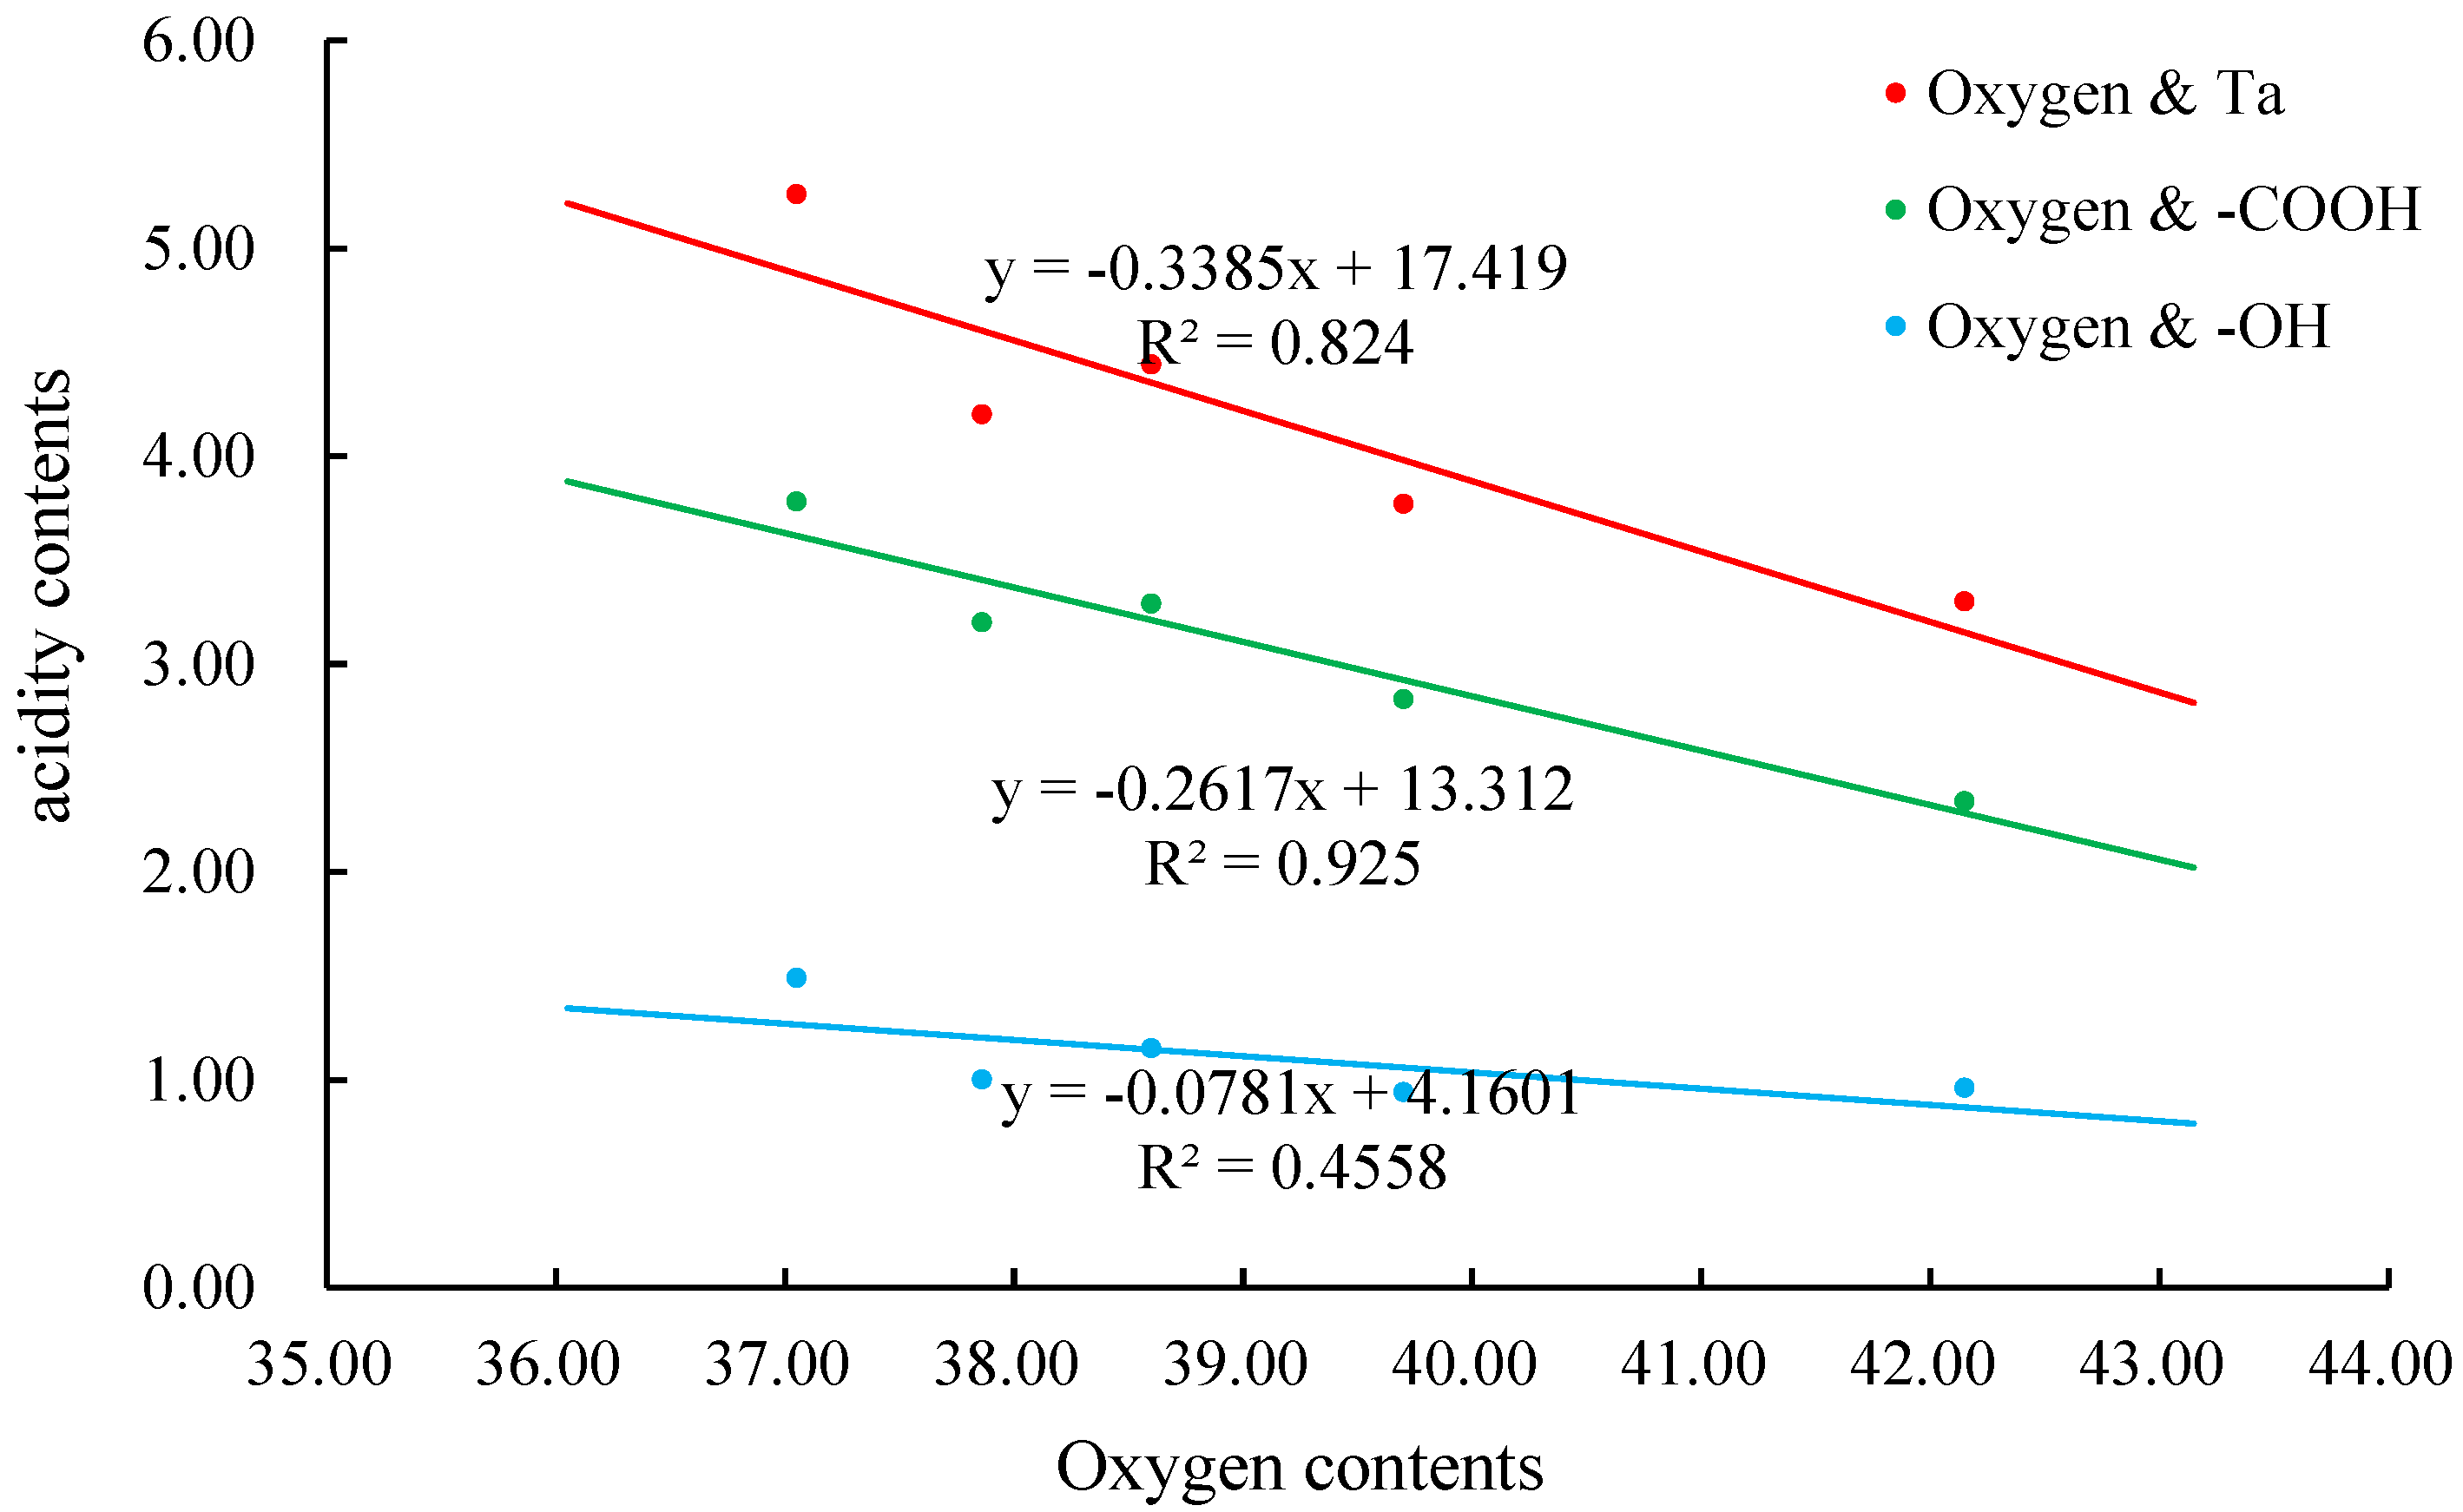
3.1. The Acidic Functional Groups

Figure 1 and Figure 2 present the titration curves of the size fractions of HA and the bulk HA of calcareous soil and yellow soil, respectively, which exhibit somewhat similar sigmoidal curves and indicate that there are two weakly acidic functional groups in HA. The contents of the total weakly acidic functional groups of HAs were calculated from the pH values at the beginning (pHVS) and the final endpoints (pHVE) of the titrations of the humic acids by applying the linear titration plots derived by McCallum and Midgley combined with Gran’s plots [39,40]. The values of pH at the apparent neutralization points (pHVN) were derived and the total acidic functional groups can be divided into weakly acidic and very weakly acidic functional groups, which refers to the carboxyl groups (-COOH) and the phenolic hydroxyl (Ph-OH) groups in HA, by using the method documented elsewhere [36]. By drawing the Henderson–Hasselbalch plot in Figure 3, the two acidic functional groups’ dissociation constants were determined.
The results calculated in the titration section are summarized in Table 1. For calcareous soil HA and its size fractions, the pH values at the titration’s beginning, neutralization, and endpoints were in the vicinity of 4.1, 8.1, and 10.0. Table 1 shows that the pKα values of the carboxyl groups (pKα, α1 = 0.5) varied from 5.41 to 5.70 and the pKα2 (α2 = 0.5) values of the phenolic hydroxyl groups were found to be in the range of 9.22 to 9.59.
Comparatively, for yellow soil HA and the size fractions, the pH values at the titration’s beginning, neutralization, and endpoints were near to 4.0, 7.5, and 9.6. The pKα1 (α1 = 0.5) values of the carboxyl groups ranged from 5.24 to 5.70 and the pKα2 (α2 = 0.5) values of the phenolic hydroxyl groups were found to be in the range of 8.73 to 8.90. This value difference means the acidic functional groups’ distribution differences are too large to be ignored between the HAs from the two soils and the others [36]. For size fractions of HA from calcareous soil, the content of total acidity, carboxyl groups, and the phenolic hydroxyl groups varied from 3.30 to 5.26 mol/kg, 2.34 to 3.78 mol/kg, and 0.96 to 1.49 mol/kg, suggesting that the solubility increased as the molecular size decreased. For size fractions of HA from yellow soil, the content of total acidity and carboxyl groups varied from 3.04 to 4.54 mol/kg and 2.11 to 3.67 mol/kg, and the phenolic hydroxyl groups were near to 0.85 mol/kg, which also indicates that the solubility increased as the molecular size decreased. Despite having the same contents of phenolic hydroxyl groups, the total acidity and the contents of carboxyl groups of the size fraction of HAs from the two soils were almost higher than those in Takamatsu and Yoshida’s work, which may be the result of the different extraction and purification procedures [36]. However, these value differences between HAs from the two soils, despite using the same pretreatment procedure, suggest that the HA from calcareous soil were distinctive. As the known molecular structure of HA, the oxygen is mainly located in the hydroxyl of carbohydrate components or in the carboxyl groups, the phenolic hydroxyl groups, and the ketone groups on the aromatic ring [24]. Therefore, there is some relationship between the acidic functional groups’ contents and the oxygen contents in HA. According to the elemental analysis presented elsewhere [33], the correlation graphs between the total acidity, carboxyl contents, and phenolic hydroxyl contents with the oxygen contents of the size fractions of HA are plotted in Figure 4 and Figure 5.
Figure 4 shows that the total acidity, carboxyl and phenolic hydroxyl contents of size fractions of HA from calcareous soil decreased as a function of the oxygen contents. Regression of the weakly acidic functional groups’ contents against the oxygen contents resulted in three linear correlations with R2 > 0.45. However, Figure 5 indicates that the total acidity and carboxyl contents of size fractions of HA from yellow soil increased as a function of the oxygen contents with linear correlations of R2 > 0.79, while no correlation between phenolic hydroxyl contents and the oxygen contents were found, with linear correlation of R approximately equal to 0. The negative linear correlations between the acidic functional groups’ contents and oxygen contents of the five size fractions of HA from calcareous soil in Figure 4 indicate that for HA from calcareous soil, the hydroxyl of the carbohydrate components, not the carboxyl and phenolic hydroxyl on the aromatic ring, is the main oxygen-containing group, suggesting that carbohydrate components were the main subunit of HA from calcareous soil. However, the positive linear correlation between acidic functional groups’ contents and the oxygen contents of the eight size fractions of HA from yellow soil in Figure 5 indicates that for HA from yellow soil, the carboxyl and phenolic hydroxyl on the aromatic ring, not the hydroxyl of the carbohydrate components, is the main oxygen-containing groups, suggesting that carbohydrate components were not the main subunit of HA from yellow soil. From the molecular size analysis, HA from calcareous soil had a larger molecular size than that of HA from yellow soil, as well as, calcareous soil had a higher content of SOM than that of the same layer of yellow soil [33]. The titration analysis confirm that it is not only the molecular structure resistance of SOM, but also the molecular diversity or the interaction between soil minerals with organic matter that are the key factors of SOM retention mechanism [14,33,41]

3.2. Fourier Transform Infrared Spectra

Figure 6 and Figure 7 present the infrared spectra for the size fractions of HA from calcareous soil and yellow soil. All fractions showed similar infrared absorption features, which were a strong and wide absorption at 3500 to 2500 cm−1 for vibrations of H-bonded -OH in water molecules, a sharp absorption from 3000 to 2800 cm−1 for aliphatic C-H stretching, and a group of absorption peaks between 1800 and 1000 cm−1 which are the carboxyl vibration absorption at 1710 cm−1, the stretching adjoining C=O or C=C of carbonyl absorption at 1630 cm−1, bending vibration absorption of aliphatic C–H at 1450 cm−1, stretching vibration absorption of C-O of the carboxyl at 1225 cm−1, and stretching vibration absorption of C-O of the hydroxyl at 1070 cm−1 [24]. Inspection of the infrared absorption spectrum of Figure 6 shows that the intensity of 2920 and 2950 cm−1 (aliphatic C-H stretching) looks the same, and so does the deformation vibration of the aliphatic C-H groups at 1450 cm−1, indicating the same content of aliphatic C in HA molecular structures. The carboxyl (-COOH) absorption at 1710 and 1225 cm−1 gradually increased from LSHA1-F1 to LSHA1-F5, suggesting that the smaller size fractions had higher contents of carboxyl groups. This observation is consistent with the variations in the contents of carboxylic (-COOH) and phenolic (Ph-OH) functional groups among the size fractions from titration analysis.
Conversely, the stretching vibration absorption of C-O of the hydroxyl at 1070 cm−1 decreased from LSHA1-F1 to LSHA1-F5, indicating less carbohydrates in smaller size fractions of HA from calcareous soil, which could account for the lower oxygen content of the smaller size fractions. The stretching adjoining C=O or C=C of carbonyl absorption at 1630 cm−1 gradually increased from LSHA1-F1 to LSHA1-F5, indicating the higher aromaticity of the smaller size fractions.
Surveying the spectra of Figure 7 showed little difference at 2920 and 2950 cm−1 (aliphatic C-H stretching absorption) from YSHA1-F1 to YSHA1-F7, but not YSHA1-F8. Likewise, at the 1070 cm−1 absorption peak, there were no obvious variations between the size fractions. The carboxyl absorption at 1710 and 1225 cm−1 gradually increased from YSHA1-F1 to YSHA1-F8, suggesting that the smaller size fractions had higher contents of carboxyl groups.
The stretching adjoining C=O or C=C of carbonyl absorption at 1630 cm−1 gradually increased from YSHA1-F1 to YSHA1-F8, indicating the increase in aromaticity of the smaller size fractions.

3.3. Carbon-13-Nuclear Resonance Spectra

The 13C NMR spectra of the bulk HA and their size fractions are plotted in Figure 8 and Figure 9. The peak selections and the calculated relative ratios of the peak areas are illustrated in Table 2. Generally, the spectra could be separated into six regions: alkyl C (0–45 ppm), alkoxyl C (45–63 ppm), oxygenated alkyl C (63–110 ppm), aromatic C (110–165 ppm), carboxyl C (165–187 ppm), and carbonyl C (187–220 ppm) [24,42,43].
It is not apparent from the Figure 8 and Figure 9 that the pattern of the 13C NMR spectra changed in the size fractions of HA because of the graphic magnification. However, the variations in the calculated relative percentages of the different carbon suggested significant differences of molecular structures among the humic acids’ size fractions. At the aliphatic carbon region (0–45 ppm), the relative percentages of the integral area progressively decreased from YSHA1-F1 to YSHA1-F6 through YSHA1-F8, indicating that the bigger size fractions had higher contents of aliphatic carbon, while there was no change among the size fractions of HA from calcareous soil (LSHA1), but in the neighborhood of 30 ppm of their spectra, the two peaks at 24 and 31 ppm, which can be assigned as -CH2- and amorphous-(CH2)n-, respectively, became progressively distinguishable. In the alkoxyl carbon region (45–63 ppm), one peak at 56 ppm, which can be assigned to methoxyl groups, was identified for all the HA fractions, and the relative percentages of the integral area gradually decreased from LSHA1-F1 to LSHA1-F5, as well as from YSHA1-F1 to YSHA1-F8, indicating that the bigger size fractions had higher contents of the methoxyl group, which originates mainly from lignin [31]. In the oxygenated alkyl carbon region (63–110 ppm), the relative percentages of the integral area gradually decreased from 30.9% for LSHA1-F1 to 19.6% for LSHA1-F5, suggesting that the bigger size fractions of HA from calcareous soil had higher contents of O-alkyl groups and di-oxygenated-alkyl groups, which originated from carbohydrate [31,44,45]. Nevertheless, the size fractions of HA from yellow soil (YSBHA1) had relatively lower and almost the same contents of the O-alkyl groups and di-oxygenated-alkyl groups, which confirmed the hypothesis of potentiometric titration. In the aromatic carbon region (110–165 ppm), the relative percentages of the integral area gradually increased from 18.3% for LSHA1-F1 to 29.4% for LSHA1-F5, and from 19.4% for YSHA1-F1 to 31.1% for YSHA1-F6 through YSHA1-F8. The aromaticity of an HA, that is, the ratio of the integral area over 110 to 160 ppm to that over 0 to 160 ppm [31], generally increased from 21% for LSHA1-F1 to 36% for LSHA1-F5, and from 23% for YSHA1-F1 to 38% for YSHA1-F5 through YSHA1-F8. These results suggest that the smaller size fractions of HA from the two soils had a much higher content of aromatic carbon and lower contents of aliphatic carbon. In the carboxyl C region (165–187 ppm) and carbonyl C region (187–220 ppm), comparing the bigger size fractions, the smaller size fractions had higher relative ratios of the integral area, which means the smaller size fractions of HA had higher contents of carboxyl groups and carbonyl groups, being consistent with the titration results and the more obvious absorption peaks at 1710 cm−1 in infrared spectra.

4. Conclusions

Via titration, FTIR, and 13C NMR, the results showed some common findings in that compared with the bigger size fractions, the smaller size fractions of HA had much lower contents of aliphatic carbon, but had higher contents of aromatic carbon, carboxyl groups, ketonic groups, phenolic hydroxyl groups, and total acidity, which suggests that the smaller size fractions are more soluble than that the bigger ones, and showed the distinct feature that the size fractions of HA from calcareous soil had much higher contents of carbohydrate subunits.
According to the above analytical results, we presumed that the HA from calcareous soil were more polar and soluble, more easily uptaken by microorganisms, and more degradable. However, From the molecular size analysis, HA from calcareous soil had a larger molecular size than that of HA from yellow soil, as well as, calcareous soil had a higher content of SOM than that of the same layer of yellow soil. This suggests that the conservation mechanism of HA is not only the molecular structure resistance but also the forming complexes with calcium and/or physical enclosing by hypergene CaCO3 precipitation. This study further confirmed the significance of calcium in calcareous soil to the stability of SOM from the microscale and provided a theoretical path for carbon sequestration by preventing calcium loss from calcareous soil.

Author Contributions

Formal analysis, L.M.; Investigation, L.M.; Data curation, L.M.; Writing—original draft, L.M.; Writing—review & editing, B.X.; Supervision, B.X.; Funding acquisition, L.M. All authors have read and agreed to the published version of the manuscript.

Funding

This research was supported by Guizhou Provincial Science and Technology Projects (Qiankehe Foundation (2019) No. 1417 and Qiankehe Platform and Talent (2017) 5789-18).

Conflicts of Interest

The authors declare no conflict of interest.

References

  1. Macalady, D.L.; Ranville, J.F. The chemistry and geochemistry of natural organic matter. In Perspectives in Environmental Chemistry; Macalady, D.L., Ed.; Oxford University Press: New York, NY, USA, 1998; pp. 94–137. [Google Scholar]
  2. Lal, R. Soil carbon sequestration impacts on global climate change and food security. Science 2004, 304, 1623–1627. [Google Scholar] [CrossRef] [PubMed] [Green Version]
  3. Davidson, E.A.; Janssens, I.A. temperature sensitivity of soil carbon decomposition and feedbacks to climate change. Nature 2006, 440, 65–173. [Google Scholar] [CrossRef] [PubMed] [Green Version]
  4. Basile-Doelsch, I.; Balesdent, J.; Pellerin, S. The mechanisms underlying carbon storage. Biogeosciences 2020, 17, 5223–5242. [Google Scholar] [CrossRef]
  5. Wang, J.; Xu, Y.; Ding, F.; Gao, X.; Li, S.; Sun, L.; An, T.; Pei, J.; Li, M.; Wang, Y.; et al. Process of Plant Residue Transforming into Soil Organic Matter and Mechanism of Its Stabilization: A Review. Acta Pedol. Sin. 2019, 56, 528–540. (In Chinese) [Google Scholar]
  6. Six, J.; Conant, R.T.; Paul, E.A.; Paustian, K. Stabilization mechanisms of soil organic matter: Implications for C saturation of soils. Plant Soil 2002, 241, 155–176. [Google Scholar] [CrossRef]
  7. Kogel-Knabner, I. The macromolecular organic composition of plant and microbial residues as inputs to soil organic matter: Fourteen years on. Soil Biol. Biochem. 2017, 105, A3–A8. [Google Scholar] [CrossRef]
  8. Schmidt, M.W.I.; Torn, M.S.; Abiven, S.; Dittmar, T.; Guggenberger, G.; Janssens, I.A.; Kleber, M.; Kögel-Knabner, I.; Lehmann, J.; Manning, D.A.C.; et al. Persistence of soil organic matter as an ecosystem property. Nature 2011, 478, 49–56. [Google Scholar] [CrossRef] [Green Version]
  9. Thevenot, M.; Dignac, M.-F.F.; Rumpel, C. Fate of lignins in soils: A review. Soil Biol. Biochem. 2010, 42, 1200–1211. [Google Scholar] [CrossRef]
  10. Gunina, A.; Kuzyakov, Y. Sugars in soil and sweets for microorganisms: Review of origin, content, composition and fate. Soil Biol. Biochem. 2015, 90, 87–100. [Google Scholar] [CrossRef]
  11. Jansen, B.; Wiesenberg, G.L.B. Opportunities and limitations related to the application of plant-derived lipid molecular proxies in soil science. Soil 2017, 3, 211–234. [Google Scholar] [CrossRef] [Green Version]
  12. Joergensen, R.G. Amino sugars as specific indices for fungal and bacterial residues in soil. Biol. Fertil. Soils 2018, 54, 559–568. [Google Scholar] [CrossRef]
  13. Tonneijck, F.H.; Jansen, B.; Nierop, K.G.J.; Verstraten, J.M.; Sevink, J.; De Lange, L. Towards understanding of carbon stocks and stabilization in volcanic ash soils in natural Andean ecosystems of northern Ecuador. Eur. J. Soil Sci. 2010, 61, 392–405. [Google Scholar] [CrossRef]
  14. Lehmann, J.; Hansel, C.M.; Kaiser, C.; Kleber, M.; Maher, K.; Manzoni, S.; Nunan, N.; Reichstein, M.; Schimel, J.P.; Torn, M.S.; et al. Persistence of soil organic carbon caused by functional complexity. Nat. Geosci. 2020, 13, 529–534. [Google Scholar] [CrossRef]
  15. Cotrufo, M.F.; Wallenstein, M.D.; Boot, C.M.; Denef, K.; Paul, E. The Microbial Efciency-Matrix Stabilization (MEMS) framework integrates plant litter decomposition with soil organic matter stabilization: Do labile plant inputs form stable soil organic matter? Glob. Change Biol. 2013, 19, 988–995. [Google Scholar] [CrossRef] [PubMed] [Green Version]
  16. Pan, G.; Cao, J.; He, S.; Tao, Y.; Shun, Y.; Teng, Y. Soil carbon as dynamic mechanism for epikarstification in humid subtropical region: Evidence of carbon reservoirs and transfer in the system. J. Nanjing Agric. Univ. 1999, 22, 49–52. (In Chinese) [Google Scholar]
  17. Burdon, J. Are the traditional concepts of the structures of humic substances realistic? Soil Sci. 2001, 166, 752–769. [Google Scholar] [CrossRef]
  18. Han, L.; Sun, K.; Jin, J.; Xing, B. Some concepts of soil organic carbon characteristics and mineral interaction from a review of literature. Soil Biol. Biochem. 2016, 94, 107–121. [Google Scholar] [CrossRef]
  19. Kleber, M. What is recalcitrant soil organic matter? Environ. Chem. 2010, 7, 320–332. [Google Scholar] [CrossRef]
  20. Kleber, M.; Lehmann, J. Humic substances extracted by alkali are invalid proxies for the dynamics and functions of organic matter in terrestrial and aquatic ecosystems. J. Environ. Qual. 2019, 48, 207–216. [Google Scholar] [CrossRef]
  21. Lehmann, J.; Kleber, M. The contentious nature of soil organic matter. Nature 2015, 528, 60–68. [Google Scholar] [CrossRef]
  22. Piccolo, A. The supramolecular structure of humic substances: A novelunderstanding of humus chemistry and implications in soil science. Adv. Agron. 2002, 75, 57–134. [Google Scholar]
  23. 23. Galicia-Andrés, E.; Escalona, Y.; Oostenbrink, C.; Tunega, D.; Gerzabek, M.H. Soil organic matter stabilization at molecular scale: The role of metal cations and hydrogen bonds. Geoderma 2021, 401, 1–13. [Google Scholar] [CrossRef]
  24. Stevenson, F.J. Humus Chemistry: Genesis, Composition, Reactions; Wiley: New York, NY, USA, 1994. [Google Scholar]
  25. Hayes, M.H.B.; MacCarthy, P.; Malcolm, R.L.; Swift, R.S. Humic substances II. In Search of Structure; Wiley: New York, NY, USA, 1989. [Google Scholar]
  26. Agnelli, A.; Celi, L.; Corti, G.; Degl’Innocenti, A.; Ugolini, F.C. The changes with depth of humic and fulvic acids extracted from the fine earth and rock fragments of a forest soil. Soil Sci. 2002, 167, 524–538. [Google Scholar] [CrossRef]
  27. Swift, R.S.; Posner, A.M. Nitrogen, phosphorus and sulfur contents of humic acids fractionated with respect to molecular weight. J. Soil Sci. 1972, 23, 50–56. [Google Scholar] [CrossRef]
  28. Piccolo, A.; Mirabella, A. Molecular-weight distribution of peat humic substances extracted with different inorganic and organic solutions. Sci. Total Environ. 1987, 62, 39–46. [Google Scholar] [CrossRef]
  29. Tonelli, D.; Seeber, R.; Ciavatta, C.; Gessa, C. Extraction of humic acids from a natural matrix by alkaline pyrophosphate. Evaluation of the molecular weight of fractions obtained by ultrafiltration. Fresenius J. Ana.l Chem. 1997, 359, 555–560. [Google Scholar] [CrossRef]
  30. Francioso, O.; Sanchez-Cortes, S.; Casarini, D.; Garcia-Ramos, J.V.; Ciavatta, C.; Gessa, C. Spectroscopic study of humic acids fractionated by means of tangential ultrafiltration. J. Mol. Struct. 2002, 609, 137–147. [Google Scholar] [CrossRef]
  31. Li, L.; Huang, W.; Peng, P.; Sheng, G.; Fu, J. Chemical and molecular heterogeneity of humic acids repetitively extracted from a peat. Soil Sci. Soc. Am. J. 2003, 67, 740–746. [Google Scholar] [CrossRef]
  32. Li, L.; Zhao, Z.; Huang, W.; Peng, P.; Sheng, G.; Fu, J. Characterization of humic acids fractionated by ultrafiltration. Org. Geochem. 2004, 35, 1025–1037. [Google Scholar] [CrossRef]
  33. Ma, L.; Xiao, B.; Di, X.; Huang, W.; Wang, S. Characteristics and distributions of humic acids in two soil profiles of the southwest China Karst area. Acta Geochim. 2016, 35, 85–94. [Google Scholar] [CrossRef]
  34. Kilduff and Weber, Transport and separation of organic macromolecules in ultrafiltration processes. Environ. Sci. Technol. 1992, 26, 569–577. [CrossRef]
  35. Stevenson,1976, Stability-constants of Cu2+, Pb2+, and Cd2+ complexes with humic acids. Soil Sci. Soc. Am. J. 1976, 40, 665–672. [CrossRef]
  36. Takamatsu, T.; Yoshida, T. Determination of stability-constants of metal humic acid complexes by potentiometric titration and ion-selective electrodes. Soil Sci. 1978, 125, 377–386. [Google Scholar] [CrossRef]
  37. Aleixo, L.M.; Godinho, O.E.S.; da Costa, W.F. Potentiometric study of acid-base properties of humic-acid using linear functions for treatment of titration data. Anal. Chim. Acta 1992, 257, 35–39. [Google Scholar] [CrossRef]
  38. Barak, P.; Chen, Y.N. Equivalent radii of humic macromolecules from acid-base titration. Soil Sci. 1992, 154, 184–195. [Google Scholar] [CrossRef]
  39. McCallum, C.; Midgley, D. Linear titration plots for the potentiometric determiantion of mixtures of strong and weak acids. Anal. Chim. Acta 1975, 78, 171–181. [Google Scholar] [CrossRef]
  40. Gran, G. Determination of the equivalence point in potentiometric titrations. PartAnalist Lond. 1952, 77, 661–671. [Google Scholar] [CrossRef]
  41. Xu, Y.; Liu, K.; Yao, S.; Zhang, Y.; Zhang, X.; He, H.; Feng, W.; Ndzana, G.M.; Chenu, C.; Olk, D.C.; et al. Formation efficiency of soil organic matter from plant litter is governed by clay mineral type more than plant litter quality. Geoderma 2022, 412, 115727. [Google Scholar] [CrossRef]
  42. Preston, C.M. Application of NMR to soil organic matter analysis: History and prospects. Soil Sci. 1996, 161, 144–166. [Google Scholar] [CrossRef]
  43. Cook, R.L.; Langford, C.H. Structural characterization of a fulvic acid and a humic acid using solid-state ramp-CP-MAS 13C nuclear magnetic resonance. Environ. Sci. Technol. 1998, 32, 719–725. [Google Scholar] [CrossRef]
  44. Wilson, M.A. NMR Techniques and Applications in Geochemistry and Soil Chemistry; Pergamon: Oxford, UK, 1987. [Google Scholar]
  45. Mao, J.-D.; Xing, B.; Schmidt-Rohr, K. New structural information on a humic acid from two-dimensional 1H-13C correlation solid-state nuclear magnetic resonance. Environ. Sci. Technol. 2001, 35, 1928–1934. [Google Scholar] [CrossRef] [PubMed]
Figure 1. The titration curves of the size fractions of humic acids (HA) and the bulk HA from calcareous soil.
Sustainability 15 01537 g001
Figure 2. The titration curves of the size fractions of HA and the bulk HA from yellow soil.
Sustainability 15 01537 g002
Figure 3. The Henderson–Hasselbalch plots of the bulk HA (LSBHA1, A: the total acidity).
Sustainability 15 01537 g003
Figure 4. The correlation graphs between the acidic functional groups’ contents and the oxygen contents of size fractions of HA from calcareous soil.
Sustainability 15 01537 g004
Figure 5. The correlation graphs between the acidic functional groups’ contents and the oxygen contents of size fractions of HA from yellow soil.
Sustainability 15 01537 g005
Figure 6. The Fourier transform infrared (FTIR) spectra of the bulk HA and its size fractions from calcareous soil.
Sustainability 15 01537 g006
Figure 7. The FTIR of the bulk HA and its size fractions from yellow soil.
Sustainability 15 01537 g007
Figure 8. The 13C-nuclear magnetic resonance spectra of the bulk HA and its size fractions from calcareous soil.
Sustainability 15 01537 g008
Figure 9. The 13C-nuclear magnetic resonance spectra of the bulk HA and its size fractions from yellow soil.
Sustainability 15 01537 g009
Table 1. The titration results of the size fractions of HA and the bulk HA.
Sample
Name
pHVSpHVNpHVETa-COOH-OHpKα1
α1 = 0.5
pKα2
α2 = 0.5
mol/kg
LSHA1-F14.278.1510.083.302.340.965.709.59
LSHA1-F24.318.1510.053.772.830.945.569.40
LSHA1-F34.108.1610.064.203.201.005.479.40
LSHA1-F44.108.1810.064.443.291.155.419.54
LSHA1-F54.188.1210.125.263.781.495.599.49
LSBHA14.067.9010.003.842.561.285.509.22
YSHA1-F14.107.559.653.042.110.935.708.78
YSHA1-F24.057.609.673.312.500.815.538.85
YSHA1-F34.107.509.693.692.770.925.508.74
YSHA1-F44.057.599.674.023.200.825.408.74
YSHA1-F53.997.659.614.303.510.795.308.74
YSHA1-F64.097.539.644.543.650.895.358.73
YSHA1-F74.107.639.614.543.630.915.428.74
YSHA1-F83.977.599.614.423.670.855.318.71
YSBHA14.067.559.753.662.830.845.248.90
Ta: the content of the total acidic functional groups.
Table 2. Structural group assignments of solid-state CPMAS 13C-NMR spectra (%).
Shift/ppm0–4545–6363–110110–165165–187187–220Aromaticity
C TypeAlkyl CO-CH3 CO-alkyl CAromatic CCarboxyl CCarbonyl C
LSHA1-F122.413.630.918.311.63.00.21
LSHA1-F222.913.824.321.713.43.60.26
LSHA1-F322.513.822.723.313.83.70.28
LSHA1-F420.411.820.527.914.44.60.35
LSHA1-F523.59.119.629.413.74.50.36
LSBHA124.113.626.720.412.42.80.24
YSHA1-F134.411.620.519.610.53.10.23
YSHA1-F226.711.120.924.714.63.70.30
YSHA1-F323.910.921.427.616.14.30.33
YSHA1-F421.710.620.728.617.24.90.35
YSHA1-F520.19.920.130.518.15.40.38
YSHA1-F620.29.019.131.118.55.60.39
YSHA1-F721.59.019.231.418.25.10.39
YSHA1-F823.08.119.031.117.24.70.38
YSBHA129.610.319.724.312.13.90.29
Disclaimer/Publisher’s Note: The statements, opinions and data contained in all publications are solely those of the individual author(s) and contributor(s) and not of MDPI and/or the editor(s). MDPI and/or the editor(s) disclaim responsibility for any injury to people or property resulting from any ideas, methods, instructions or products referred to in the content.

