Abstract
Urban congestion has become a global problem with urbanization and motorization. The analysis of time-varying traffic congestion patterns is necessary to formulate effective management strategies. The existing studies have focused on traffic flow patterns developed by the volume, speed and density of road sections in a limited district, while the long-time analysis of congestion patterns of the macro road network at the city level is inadequate. This paper aims to recognize traffic congestion patterns of the urban road network based on the traffic performance index (TPI) of 699 days in 2018, 2019 and 2021 in Beijing. The self-organizing maps (SOM) method improved by an automatic clustering number determination algorithm is proposed to cluster congestion patterns based on time-varying TPI. The traffic congestion of the macro road network is clustered into Mondays, Fridays, ordinary weekdays, congested weekdays, weekdays of winter and summer vacation, Saturdays, Sundays and festivals patterns. Patterns of Mondays and congested weekdays have a prominent morning peak, while patterns of Fridays, ordinary weekdays, and weekdays of winter and summer vacation have a prominent evening peak. Saturdays, Sundays and festivals are less congested than weekday patterns. It is verified that the SOM method proposed in this paper clusters traffic congestion into more detailed and accurate patterns, and it is applicable to TPI clustering in different years. The degree of congestion in 2021 increases by 7.15% in peak hours and decreases by 7.50% in off-peak hours compared with that in 2019 due to COVID-19. This method is helpful for traffic management in terms of making decisions according to different congestion patterns.
1. Introduction
With the increase in motor vehicles, traffic congestion is becoming increasingly serious, which has caused problems such as a reduction in traffic efficiency and the increase in the incidence of traffic accidents. Scientific and quantitative evaluation of traffic congestion is the fundamental work for easing traffic congestion. To quantitatively evaluate the degree of urban congestion, most cities have established traffic monitoring systems. TPI is one of the crucial indicators of intelligent transportation systems and can effectively evaluate the traffic status on the road network in Beijing. Beijing had 21.89 million residents and 6.22 million motor vehicles in 2021. Beijing is the most congested city during peak hours. The congested sections during peak hours are mainly concentrated in the ring road and connecting road. TPI is widely used because of its important role in traffic management, such as assessment of transportation demand management policies and traffic congestion alleviation tasks.
Travelers tend to take into account travel mode and travel time more than travel path in the multimodal transportation system. The traffic congestion condition in the destination area or even the entire road network is important reference information for travelers. Affected by different travel purposes on weekdays, weekends and holidays, daily traffic congestion presents different characteristics. Dates with the same congestion change characteristics are defined as having the same traffic congestion pattern in this paper. Due to the travel regularity of residents, traffic congestion can be divided into typical limited patterns. The traffic congestion pattern can be identified by analyzing the time-varying rule of traffic congestion in the road network between different days. The traffic flow status in the urban road network is described efficiently with limited patterns. However, traffic flow patterns are mostly developed based on the flow, speed, density and other indicators of road sections on specific road type in the existing studies. Dynamic traffic flow and static road networks are not considered comprehensively. The overall traffic congestion situation of the complex macro road network cannot be accurately evaluated.
In order to comprehensively evaluate the traffic congestion of the macro road network and effectively describe the traffic flow status of the road network with typical limited patterns, the traffic congestion patterns of the macro road network based on TPI are studied in this paper. First, a clustering method based on the self-organizing maps (SOM) neural network is proposed. The method of automatically determining the clustering numbers is constructed to improve the disadvantage that SOM requires the manual determination of clustering number. Second, clustering indexes are developed such as characteristic indexes of traffic congestion, TPIs weighted by the time-varying coefficient, and time-varying TPIs. Third, the evaluation method of the clustering effect is proposed. Finally, differences of congestion patterns in different years are analyzed as the case study. The results of this paper will provide travel suggestions for travelers and help traffic managers to predict and prevent serious congestion dates and take targeted congestion control measures for different congestion situations.
2. Literature Review
Congestion has become a serious problem in China. Evaluation indexes of traffic conditions have been developed, such as the Travel Time Index (TTI) [1], the Roadway Congestion Index (RCI) [2], and TomTom’s Worldwide Congestion Index (CI) [3]. These indexes provided effective methods for characterizing traffic congestion patterns and their temporal variations at a macroscopic level, in which TPIs are widely used. One of the most important applications of TPI is to identify the characteristics of traffic congestion. Sun et al. [4] classified the traffic performance characteristics of urban trunk roads and identified frequent traffic jams based on TPI data. Sun et al. [5] identified traffic patterns of main trunk roads using TPI data. Wei et al. [6] explored the spatiotemporal pattern of traffic congestion performance in large cities by using TPI data, which varies substantially between cities and different days of the week. Wei et al. [7] proposed a framework to identify turn-level bottlenecks in large-scale road networks based on TPI data. TPI is also an important index for traffic management and planning. Cheng et al. [8] constructed a mixed-integer second-order cone programming model for electric vehicle charging stations considering traffic congestion based on TPI data. Yan et al. [9] presented a spatial-temporal electric vehicle charging load profile simulation method considering weather and traffic based on TPI data. The calculation and prediction methods of TPI have been further improved. Yu et al. [10] proposed a method to calculate the optimal TPI based on the macroscopic fundamental diagram (MFD). Cheng et al. [11] proposed a combination prediction model of the traffic congestion index on weekdays based on LightGBM-GRU, considering seasonal factors and weekly periodicity. Yi et al. [12] proposed a deep learning method using LSTM-RNN models for predicting TPI in highways. Above all, TPI plays a critical role in traffic congestion evaluation, traffic planning and management. The changing characteristics and patterns of TPIs need to be further studied to facilitate better traffic decision-making.
Existing studies have indicated that when classified properly into different categories, the traffic congestion patterns of different dates in each category have similar characteristics, which provides the possibility of predicting the future traffic conditions according to the categorized characteristics. Methods have been studied on the division of traffic congestion patterns, based on different data sources and research methods in existing studies, as shown in Table 1.

Table 1.
Literature on the division of traffic congestion patterns.
As shown in Table 1, classical clustering algorithms have been used to identify traffic congestion patterns in the existing studies, such as the hierarchical, k-means, and DBSCAN clustering method. The neural network algorithm is widely used because of its good performance. The SOM neural network clustering method is used in this paper to analyze traffic congestion patterns on the road network.
As a practical method of classifying patterns, the clustering method has been studied for decades [21,22]. Many studies divide traffic flow patterns based on clustering methods. Li et al. [23] established a regional congestion evaluation model by a clustering method based on congestion characteristics, which were divided into multiple mode, double peak mode and evening peak prolonged mode, and the prewarning criteria, including red alert, orange alert and yellow alert, were determined. Cheng et al. [24] developed a comprehensive classification indicator system including the ample degree of road network, traffic flow, speed and occupancy, which divided the traffic state into a fluent state, basic fluent state, slight congestion, moderate congestion, and severe congestion based on the improved FCM clustering method. Fu et al. [25] divided traffic statuses into serious congestion, moderate congestion, mild congestion, and no congestion based on the queuing time index (QTI), and the thresholds for different levels were obtained using the cluster analysis method to describe the traffic status of a signalized intersection. Neves et al. [26] proposed a method to divide traffic patterns of road mobility using biclustering, which combines speed limits, vehicle passage frequencies, and the spatial extent of congested road segments. Zhang et al. [27] proposed a fuzzy weighted c-means classification method based on volume, speed and occupancy, which divided the traffic state into free flow, synchronous flow and congested traffic flow. The link-based traffic flow, speed and occupancy indicators within a certain area have been mainly used in the existing studies, while few have been conducted on traffic congestion patterns for an entire traffic network.
Above all, this paper intends to identify traffic congestion patterns based on TPI data of macro road network using SOM clustering method.
3. Methodology
The difference in travel purpose on different days leads to different traffic congestion patterns. To recognize the typical patterns of congestion change with time, three clustering methods of TPI curves are constructed in this paper. First, the self-organizing map (SOM) neural network clustering algorithm was used to cluster TPIs in 2018 due to its good clustering performance in the traffic flow field. A method for automatically determining the optimal number of clusters is constructed to improve the disadvantage that SOM requires manual determination of the number of clusters. Second, three clustering systems are developed, including characteristic indexes of traffic congestion, TPIs weighted by time-varying coefficients, and time-varying TPI. Third, evaluation indexes of the clustering effect are proposed to select the optimal clustering method, including consistency within categories, differences between categories and coverage ratio. Finally, the congestion patterns of 2019 and 2021 are constructed as a case study. Differences in congestion patterns in different years are analyzed. The general methodology of this research is shown in Figure 1.
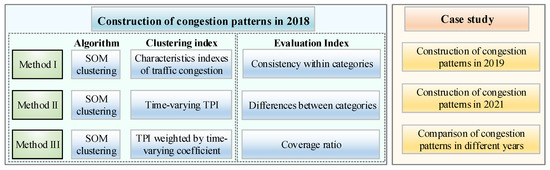
Figure 1.
Methodological design.
4. Data Preparation
The TPI is developed to evaluate the traffic condition of the urban road network, which quantifies the traveler’s perception of traffic congestion. To quantitatively evaluate the traffic congestion, the proportion of severe congestion mileage for the entire road network is converted to TPI (a number ranging from zero to ten). To help travelers intuitively understand road congestion through the TPI, the TPI is divided into five levels to represent different congestion conditions, namely, [0, 2), [2, 4), [4, 6), [6, 8) and [8, 10], corresponding to congestion levels of smooth traffic, no congestion, slight congestion, moderate congestion and severe congestion. The calculation method of the TPI is as follows, as shown in Figure 2.
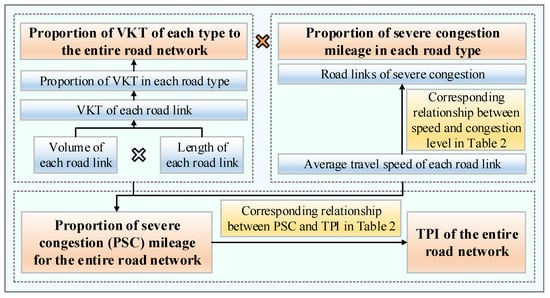
Figure 2.
Development flow of TPI.
Step 1: Calculate the congestion level of each road based on speed in different road types, as shown in Table 2.
Table 2.
Interval division of road type speed, the proportion of the congestion mileage and TPI corresponding traffic congestion level.
The road types include express roads, main roads, and secondary roads. The speed comes from the floating car data (FCD) system in Beijing.
Step 2: Calculate the percentage of vehicle kilometers of travel (VKT) of different types to the total VKT of all roads. VKT is the accumulation of mileage of all vehicles on the road, which is calculated by Equation (1).
where, i is the road type, including express road, main road and secondary road. is the (pcu*km) of road type i, is the number of road links in road type i, is the of road , is the number of vehicles passing road , and is the length of road . The percentage of to the total VKT of all roads is calculated by Equation (2).
Step 3: Calculate the proportion of severe congestion mileage for road type i, as shown in Equation (3).
where is the length of the road under the severe congestion of road type i, is the number of roads under severe congestion.
Step 4: Calculate the proportion of severe congestion mileage for the entire road network, as shown in Equation (4).
Step 5: Convert into TPI, as shown in Table 2.
Since travelers tend to have lower tolerance about severe congestion, which has a greater delay impact on the travel time, the proportion of the length of severely congested roads is used to determine the TPI in Beijing. Since roads with smooth traffic may have an offset effect on the level of congestion of the entire road network, using the proportion of severely congested roads can alleviate that effect and provide a more accurate evaluation of the congestion level. Notably, the development process or the specific calculation of the TPI is not the focus of this paper.
Based on the historical and real-time FCD, the TPI curve is formed by using the time as the horizontal axis and TPI as the vertical axis. TPI curves of a week and a day of National Day in 2021 are illustrated in Figure 3 as an example. There are significant differences such as the peak value and time of the morning and evening peak among the curves for different days. There are different patterns of congestion on different days.
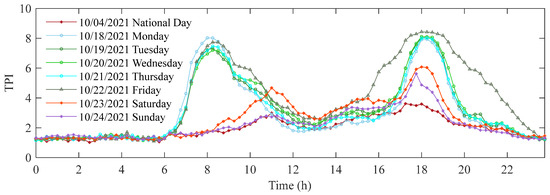
Figure 3.
Samples of TPI curves.
The TPI data at 15-min intervals of 365 days from January to December 2018 are used to develop clustering models. The TPI data of 212 days from January to September 2019 and 122 days from June to October 2021 are used as a case study to verify the adaptability of the model in different years and analyze the impact of COVID-19 on traffic congestion patterns. The data structure of the TPI of the entire network in Beijing includes date, time, week, holiday, weather and TPI, as shown in Table 3.
Table 3.
The data structure of the TPI of the entire network in Beijing.
5. Traffic Congestion Patterns Clustering Method
5.1. Clustering Algorithms
5.1.1. SOM Neural Network Clustering Algorithm
The SOM neural network was proposed by Professor Kohonen [28] and has been widely applied in different research fields [29,30,31,32]. The algorithm assumes that there are topological structures or orders in the input object, which can realize dimension reduction mapping from the input space to the output plane. The SOM network includes an input layer and output layer. The input layer corresponds to a high-dimensional input vector, and the output layer is composed of a series of ordered nodes organized on a two-dimensional grid. The input and output nodes are connected by weight vectors. In the learning process, SOM finds the output layer unit with the shortest distance to update it. The weights of adjacent regions are updated so that the output nodes maintain the topological characteristics of the input vector. It is proven that it has a good clustering effect in the field of traffic flow. SOM clustering requires the following steps [32]:
- Step 1: Initialize the network and assign the initial value to each node weight of the output layer.
- Step 2: Randomly select the input vector from the input samples to find the weight vector with the minimum distance from the input vector.
- Step 3: Define the winning unit, and adjust the weight in the adjacent area of the winning unit to make it close to the input vector.
- Step 4: Provide new samples and conduct training.
- Step 5: Shrink the neighborhood radius, reduce the learning rate, repeat until it is less than the allowable value, and output the clustering results.
5.1.2. Automatic Clustering Number Determination Algorithm
The number of clusters needs to be input in the SOM clustering process. A method to automatically determine the optimal number of clusters is proposed to improve the SOM algorithm. Based on the characteristics of the TPI curves in Beijing, the silhouette measure was adopted to determine the number of categories. The silhouette coefficients of different clustering numbers of TPI curves are automatically calculated based on the SOM algorithm. The optimal clustering number is determined when the profile coefficient reaches the maximum.
The silhouette measure Sil(a) is a number ranging within [−1, 1], as shown in Equation (5):
where aa is the minimum value of the mean distance between points Aa and Ac, K’ is a different category from K(a), |AaAc| is the distance between points Aa (in K(a)) and Ac (in K’), ba is the mean distance between points Aa and Ab, Ab∈K(a), K(a) is the category of point Aa, and |AaAb| is the distance between points Aa and Ab.
A higher value of Sil(a) theoretically means a better clustering result. For each clustering result of category number C, the mean silhouette value PC of all the M2 points needs to be calculated by Equation (6):
when PC reaches the maximum value, C is determined to be the optimal number of clustering categories.
5.2. Clustering Indexes
Clustering indexes are developed based on the characteristics of traffic congestion, the value of TPIs and the weight of the time variation coefficient.
5.2.1. Key Characteristic Indexes of Traffic Congestion
Characteristic indexes are designed based on traffic congestion characteristics at different times of the day, such as the central tendency and dispersion degree of TPIs at peak and trough hours. The characteristic indexes of congestion are shown in Table 4.
Table 4.
Characteristic indexes of traffic congestion.
The Pearson correlation coefficients are calculated to reduce the correlation among characteristic indexes of traffic congestion. The redundant indexes with Pearson correlation above 0.8 are eliminated, and only one key index that can reflect the congestion characteristics is retained. Indexes of X3, X4, X5, X6, X7, X11, X13, X14, and X16 are selected as key indexes, which reflect characteristics of traffic congestion at morning peak, evening peak, night, trough hours and off-peak.
5.2.2. Time-Varying TPI
The time-varying TPI directly reflect the characteristics of congestion at different moments. TPIs of 15-min granularity in 24 h are selected as clustering indexes.
5.2.3. TPI Weighted by Time-Varying Coefficient
The weight is assigned to the clustering index to represent the different unit lengths for different dimensions. The axes are lengthened or shortened according to the weights. Therefore, the weight assignment significantly impacts the clustering result.
The coefficient of variation of the TPI at each time point was used as the weight in this paper. The coefficient of variation is a parameter used to measure the variation degree of the sample data. For the TPI at a specific time point with a higher variation degree, the difference in its congestion pattern is also greater; therefore, it should be assigned a higher weight, and vice versa. The coefficient of variation is shown in Equation (7):
where is the mean value of the TPI.
5.3. Evaluation Indexes of the Clustering Results
Indexes are used to evaluate clustering results, including consistency within categories, differences between categories, coverage ratio and silhouette.
5.3.1. Consistency within Categories
A strong consistency is requested within a category. The coefficient of variation of the TPI is used to measure the consistency. The calculation method of the coefficient of variation within-category is shown in Equation (8). Let CVI be the coefficient of variation within a category; then,
where n is the number of categories, CVk I is the mean value of the coefficient of variation for all time points in a day, l is the number of time intervals in a day, and CVk i is the coefficient of variation of the TPI at time i in category k.
The degree of consistency rises when the value of the CVI decreases.
5.3.2. Differences between Categories
Greater differences among clustering categories generally indicate a better clustering result. Therefore, the coefficient of variation of the mean values of all categories is proposed as the index to measure the differences between categories, as shown in Equation (9). Let CVII be the coefficient of variation between categories; then,
where l is the number of time intervals in a day, and CVII,i is the coefficient of variation of of all categories, as shown in Equation (10).
where TPIk i is the mean TPI of time i in category k, TPIk j,i is the TPI of time i in day j in category k, and m is the number of days in a category.
The differences increase when the CVII rises.
5.3.3. Coverage Ratio
In terms of clustering the daily traffic patterns, it is ideal to classify all the dates into limited categories. However, days might be classified into incorrect categories because of the existence of inclement weather, incidents, important events, and an imperfect clustering method. The proportion of days correctly classified is defined as the coverage ratio, the average Pearson correlation coefficient of which with other variables of the same category is greater than 0.9, as shown in Equation (11).
where D1 is the number of correctly classified days and D is the number of all days.
The result of the clustering improves when the value of the coverage ratio becomes greater.
5.4. Discussion of Results
The SOM neural network clustering algorithm improved by the method of automatically determining the optimal clustering number are used to cluster the TPIs of 2018 under three clustering indexes. TPIs in 2018 are clustered into eght categories. The morning peak of weekend and festival patterns appears at 10:00–12:00, which is later than weekday patterns at 7:00–9:00. The evening peak of weekend and festival patterns appears at 16:00–18:00, which is earlier than weekday patterns at 17:00–19:00. The optimal clustering method is determined by comparing different clustering evaluation indexes.
5.4.1. Clustering Results of Key Characteristic Indexes of Traffic Congestion
The TPI curves and average trend curves of patterns based on key characteristic indexes of traffic congestion are shown in Figure 4.
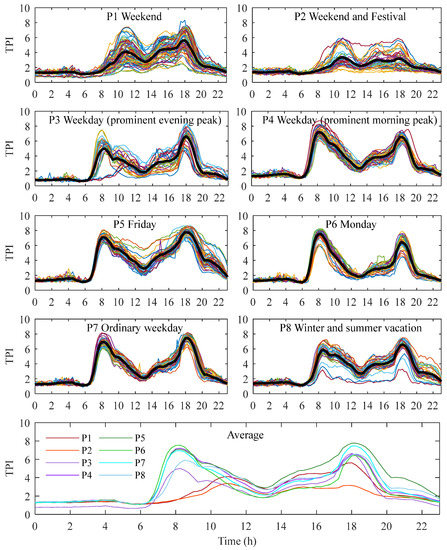
Figure 4.
TPI and average curves of patterns based on key characteristic indexes of congestion.
As shown in Figure 4, TPI curves are clustered into eight categories based on key characteristic indexes of traffic congestion, including weekends, weekends and festivals, weekdays with prominent evening peaks, weekdays with prominent morning peaks, Fridays, Mondays, ordinary weekdays, and weekdays of winter and summer vacation patterns. The time-varying trend of TPI curves in each pattern is relatively consistent. The characteristics of weekdays are well described, while the characteristics of the patterns of weekends, weekends and festivals are not well extracted and distinguished. The absolute values of TPIs in some patterns differ greatly, such as pattern 1, pattern 2, pattern 3, and pattern 8. There are multiple curves in pattern 3 classified unreasonably.
The statistical characteristics of each pattern are shown in Table 5.
Table 5.
Characteristics of patterns based on key characteristic indexes of traffic congestion.
The following conclusions can be obtained from Table 5:
- Pattern 1 and pattern 2 are holiday patterns. Pattern 1 is more congested than pattern 2. There are 75 samples in pattern 1, 73 of which are weekends. The maximum TPI of the evening peak is 36.74% higher than that of the morning peak in pattern 1. Pattern 2 has 39 samples, 22 of which are festivals, including the Spring Festival, International Labour Day, Dragon Boat Festival and National Day.
- Pattern 3, pattern 5, pattern 7 and pattern 8 are weekday patterns with prominent evening peaks, in which the maximum TPI of the evening peak is 33.27%, 10.70%, 11.67%, and 11.34% higher than that of the morning peak, respectively. Pattern 3 has the morning peak with the lowest congestion due to the presence of unreasonably classified samples. Pattern 5 has 44 working day samples, 29 of which are Fridays. The congestion degree of the morning and evening peaks is the highest in pattern 5. Pattern 8 has 37 working day samples of winter and summer vacation, which has a lower degree of congestion due to the lack of students commuting to school. Pattern 7 has 47 working day samples, which is defined as the ordinary weekday pattern.
- Pattern 4 and pattern 6 are weekday patterns with prominent morning peaks, in which the maximum TPI of the morning peak is 10.09% and 17.29% higher than that of the evening peak, respectively. Pattern 4 has 61 weekday samples without Fridays. Pattern 6 has 33 weekday samples, 25 of which are Mondays. The morning peak congestion is the highest in pattern 6.
5.4.2. Clustering Results of the Time-Varying TPI
TPI curves and average trend curves of patterns based on the time-varying TPI are shown in Figure 5.
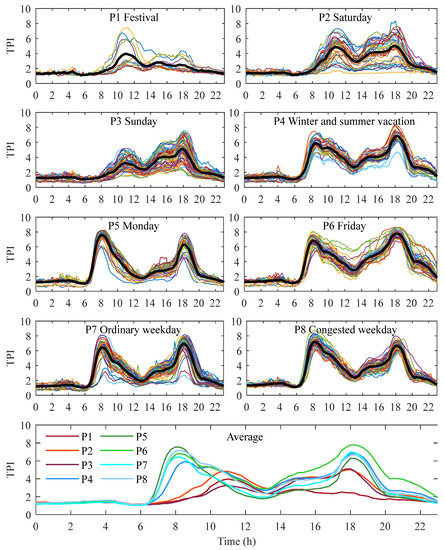
Figure 5.
TPI curves and average trend curves of patterns based on time-varying TPI.
As shown in Figure 5, TPI curves are clustered into eight categories based on time-varying TPI, including festivals, Saturdays, Sundays, weekdays of winter and summer vacation, Mondays, Fridays, ordinary weekdays, and congested weekdays. There are three patterns for holidays and five patterns for weekdays. The time-varying trend of TPI curves in each pattern based on time-varying TPI is more consistent based on key characteristic indexes of traffic congestion. The weekday and holiday curves are all divided into detailed patterns, the characteristics of which are well described.
The statistical characteristics of each pattern are shown in Table 6.
Table 6.
Characteristics of patterns based on the time-varying TPI.
The following conclusions can be obtained from Table 6:
- Pattern 1, pattern 2 and pattern 3 are holiday patterns. There are 12 festival samples in pattern 1, which has no evening peak. Pattern 2 has 38 samples, 26 of which are Saturdays. The maximum TPI of the morning and evening peaks are similar in pattern 2. There are 67 weekend and festival samples in pattern 3, 43 of which are Sundays. The maximum TPI of the evening peak is 56.92% higher than that of the morning peak in pattern 3.
- Pattern 4, pattern 6, and pattern 7 are weekday patterns with prominent evening peaks, in which the maximum TPI of the evening peak is 16.92%, 14.54%, and 8.55% higher than that of the morning peak, respectively. Pattern 6 has 47 working day samples, 34 of which are Fridays. The congestion degree of the evening peak is the highest in pattern 6. The samples of pattern 4 are weekdays in winter and summer vacation, which has a lower degree of congestion due to the lack of students commuting to school. Pattern 7 has 57 working day samples, which is defined as the ordinary weekday pattern.
- Pattern 5 and pattern 8 are weekday patterns with prominent morning peaks, in which the maximum TPI of the morning peak is 19.84% and 7.969% higher than that of the evening peak, respectively. Pattern 5 has 33 weekday samples, 27 of which are Mondays. The maximum TPI of the morning peak of pattern 5 is the highest in all patterns. Pattern 8 has 74 weekday samples, which is more congested than pattern 7, which is defined as the congested weekday pattern.
5.4.3. Clustering Results of TPI Weighted by Time-Varying Coefficient
TPI curves and average trend curves of patterns based on TPI weighted by the time-varying coefficient are shown in Figure 6.
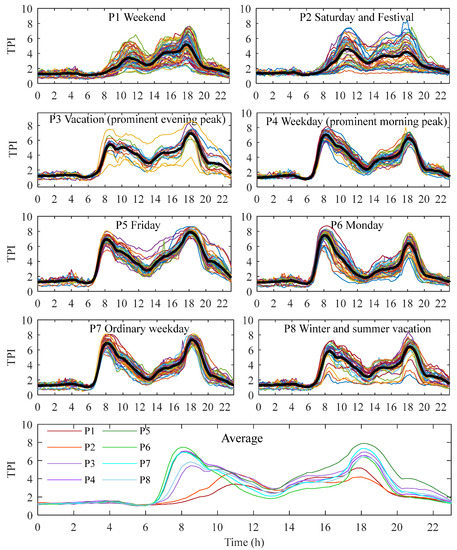
Figure 6.
TPI curves and average trend curves of patterns based on TPI weighted by the time-varying coefficient.
As shown in Figure 6, TPI curves are clustered into eight categories based on the time-varying TPI, including weekends, Saturdays and festivals, vacation weekdays with prominent evening peak, weekdays with prominent morning peak, Fridays, Mondays, ordinary weekdays, and weekdays of winter and summer vacation. There are two patterns for holidays and six patterns for weekdays. This index overemphasizes the characteristics of morning and evening peak traffic flow. The pattern of vacation weekdays with prominent evening peak is identified, the consistency of curves in which is low. The absolute values of TPIs in some patterns differ greatly, such as pattern 2, pattern 3, and pattern 8.
The statistical characteristics of each pattern are shown in Table 7.
Table 7.
Characteristics of patterns based on TPI weighted by time-varying coefficient.
The following conclusions can be obtained from Table 7:
- Pattern 1 and pattern 2 are holiday patterns. There are 73 weekend and festival samples in pattern 1, 68 of which are weekends. The maximum TPI of the evening peak is 51.46% higher than that of the morning peak in pattern 1. There are 43 weekend and festival samples in pattern 2. The maximum TPI of the morning peak is 9.31% higher than that of the evening peak in pattern 2.
- Pattern 3, pattern 5, pattern 7, and pattern 8 are weekday patterns with prominent evening peaks, in which the maximum TPI of the evening peak is 27.99%, 14.51%, 6.53%, and 9.90% higher than that of the morning peak, respectively. Pattern 5 has 40 working day samples, 30 of which are Fridays. The congestion degree of the evening peak is the highest in pattern 5. Pattern 8 has 35 working day samples of winter and summer vacation, which has a lower degree of congestion due to the lack of students commuting to school. Pattern 3 has 17 working day samples of winter and summer vacation, in which the degree of congestion in the evening peak is obviously higher than that in the morning peak. Pattern 7, the ordinary weekday pattern, has 53 working day samples.
- Pattern 4 and pattern 6 are weekday patterns with prominent morning peaks, in which the maximum TPI of the morning peak is 7.62% and 17.27% higher than that of the evening peak, respectively. Pattern 4 has 57 weekday samples, in which the degree of congestion in the morning peak is higher than that in the evening peak. Pattern 6 has 47 weekday samples, 34 of which are Mondays. The morning peak congestion is the highest in pattern 6.
5.4.4. Evaluation of Clustering Results of Different Indexes
The evaluation indexes are used to evaluate the clustering results of different indexes, including consistency within categories, differences between categories, coverage ratio and silhouette, as shown in Table 8.
Table 8.
Evaluation indexes values of the clustering results.
Ideal clustering results are expected to have higher CVII, , and silhouette and lower CVI. The following conclusions can be obtained from Table 8:
- (1)
- The clustering result of the time-varying TPI has the highest values of CVII, CR, silhouette and lower CVI, which is consistent with practical experience and is beneficial to practical application. The traffic congestion patterns constructed by this method effectively describe 90.73% of the traffic flow on urban roads.
- (2)
- The clustering result of key characteristic indexes of traffic congestion has the lowest CVI, CVII, CR, and silhouette, which has a low proportion of reasonably classified samples.
- (3)
- The clustering result of the TPI index weighted by the time-varying coefficient has the highest values of CVI, and silhouette and higher CVII and CR, which overemphasizes the influence of morning and evening peaks by the time-varying coefficient.Above all, TPIs are most effectively clustered based on the SOM clustering method improved by automatically determining the algorithm of the optimal clustering number, using the time-varying TPI.
Traffic congestion pattern recognition method of this paper is compared with Li. et al. [20]. Li et al. [20] proposed a K-means clustering method improved by the coefficient of variation weight to identify traffic congestion patterns. MTW pattern (Monday, Tuesday, and Wednesday), TF pattern (Thursday and Friday) and H pattern (working days within 3 days before and after holidays) are developed based on TPIs from January to December 2017 of six districts in Beijing [20]. The silhouette coefficient of Haidian, Fengtai, Shijingshan, Chaoyang, Dongcheng, and Xicheng are respectively 0.26, 0.35, 0.16, 0.34, 0.30, and 0.29, and the average silhouette coefficient of all congestion patterns is 0.28 [20]. This paper proposed an SOM clustering method improved by the algorithm of automatically determining the clustering numbers. More detailed congestion patterns are developed such as festivals, Saturdays, Sundays, weekdays of winter and summer vacation, Mondays, Fridays, ordinary weekdays, and congested weekdays in this paper. The silhouette coefficient of congestion patterns in this paper is 0.94, which is higher than the reference of Li et al. [20]. The closer the value of the silhouette coefficient is to 1, the better the clustering results. The clustering accuracy of traffic congestion patterns is improved by the SOM clustering method proposed in this paper.
6. Case Study
The TPIs in 2019 and 2021 are clustered as a case study based on the time-varying TPI to verify the rationality of the clustering method. The clustering results in different years are compared to study the impact of COVID-19 on congestion patterns.
6.1. Clustering Results of TPIs in 2019
The TPIs of 212 days from January to September 2019 are clustered into eight categories based on the time-varying TPI, including weekends with prominent evening peaks, Saturdays and festivals, Sundays, weekdays of winter and summer vacation, Mondays, Fridays, ordinary weekdays, and weekdays with prominent evening peaks. The TPI curves and average trend curve of each pattern are shown in Figure 7.
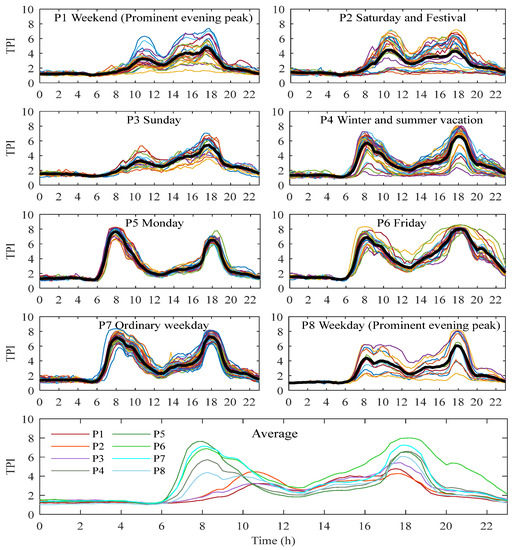
Figure 7.
TPI curves and average trend curves of different patterns in 2019.
As shown in Figure 7, there are three patterns for holidays and five patterns for weekdays. Pattern 1, pattern 2 and pattern 3 are weekends and festivals, and the other patterns are weekdays. The characteristics of each pattern are shown in Table 9.
Table 9.
Characteristics of different patterns in 2019.
The following conclusions can be obtained from Table 9:
- Pattern 1, pattern 2, and pattern 3 are holiday patterns. There are 24 samples in pattern 1, 22 of which are weekends. The maximum TPI of the evening peak is 47.84% higher than that of the morning peak in pattern 1. There are 25 weekend and festival samples in pattern 2. The maximum TPI of the morning peak is 4.45% higher than that of the evening peak in pattern 2. There are 17 weekend samples in pattern 3, 13 of which are Sundays. The maximum TPI of the evening peak is 66.56% higher than that of the morning peak in pattern 3.
- Pattern 4, pattern 6, pattern 7, and pattern 8 are weekday patterns with prominent evening peaks, in which the maximum TPI of the evening peak is 15.18%, 16.11%, 1.40% and 36.90% higher than that of the morning peak, respectively. Pattern 6 has 19 working day samples, 14 of which are Fridays. The congestion degree of the evening peak is the highest in pattern 6. Pattern 4 has 39 working day samples of winter and summer vacation, which has a lower degree of congestion due to the lack of students commuting to school. Pattern 7 has 50 weekday samples, in which the degree of congestion in the morning peak is close to that in the evening peak. Pattern 8 has 10 working day samples, in which the degree of congestion in the evening peak is obviously higher than that in the morning peak.
- Pattern 5 is a weekday pattern with a prominent morning peak, in which the maximum TPI of the morning peak is 17.15% higher than that of the evening peak. Pattern 5 has 25 weekday samples, 16 of which are Mondays. The morning peak congestion is the highest in pattern 5.
6.2. Clustering Results of TPIs in 2021
The TPIs of 122 days from June to October 2021 are clustered into eight categories based on the time-varying TPI, including Saturdays and festivals, Sundays and festivals, weekdays with prominent evening peak, weekdays of winter and summer vacation, weekdays with prominent off-peak, Fridays, ordinary weekdays, and congested weekdays. The TPI curves and average trend curve of each pattern are shown in Figure 8.
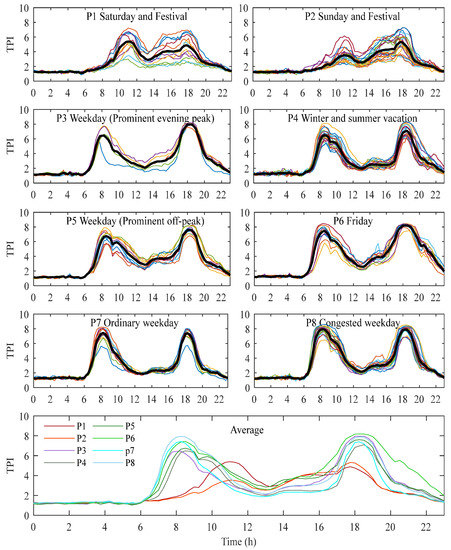
Figure 8.
TPI curves and average trend curves of different patterns in 2021.
As shown in Figure 8, there are two patterns for holidays and six patterns for weekdays. Pattern 1 and pattern 2 are weekends and festivals, and the other patterns are weekdays. The morning peak of weekend and festival patterns appears at 10:00–12:00, which is later than weekday patterns at 7:00–9:00. The evening peak of weekend and festival patterns appears at 16:00–18:00, which is earlier than weekday patterns at 17:00–19:00. The characteristics of each pattern are shown in Table 10.
Table 10.
Characteristics of different patterns in 2021.
The following conclusions can be obtained from Table 10:
- Pattern 1 and pattern 2 are holiday patterns. There are 11 weekend and festival samples in pattern 1, 9 of which are Saturdays. The maximum TPI of the evening peak is 10.43% higher than that of the morning peak in pattern 1. There are 24 weekend and festival samples in pattern 2, 13 of which are Saturdays. The maximum TPI of the morning peak is 50.14% higher than that of the evening peak in pattern 2.
- Pattern 3, pattern 4, pattern 5, and pattern 6 are weekday patterns with prominent evening peaks, and the maximum TPI of the evening peak is 23.37%, 9.40%, 12.74%, and 9.93%, respectively, higher than that of the morning peak. The difference in congestion degree between morning and evening peaks is the most obvious in pattern 3. Pattern 5 has 11 weekday samples, 10 of which are Fridays. The traffic flows at the morning peak and evening peak are moderate congestion and severe congestion, respectively, in Pattern 5. Pattern 4 has 22 weekday samples of winter and summer vacation, which has a lower degree of congestion due to the lack of students commuting to school. The level of traffic congestion during the off-peak hours is higher than that in other patterns.
- Pattern 7 and pattern 8 have small differences in the traffic congestion degree between the morning and evening peaks, and the maximum TPI of the morning peak is 0.68% and 0.76%, respectively, higher than that of the evening peak. The traffic flows at the morning peak and evening peak are all moderate congestion in pattern 7 and pattern 8. Pattern 8 is a more congested weekday pattern than pattern 7.
6.3. Comparison of Clustering Results in Different Years
The change rules of traffic congestion in different years have certain similarities and differences. There are some common traffic congestion patterns between different years, such as weekdays of winter and summer vacation, ordinary weekdays, Fridays, and weekends and festivals patterns. Traffic congestion patterns in different years also have different characteristics. For example, a congested weekday pattern exists in 2018 and 2021, but not in 2019; a Monday pattern exists in 2018 and 2019, but not in 2021. To analyze the applicability of the model constructed in this paper in different years and the impact of COVID-19 on congestion, the average trend curves of different patterns in 2018, 2019 and 2021 are compared in Figure 9.
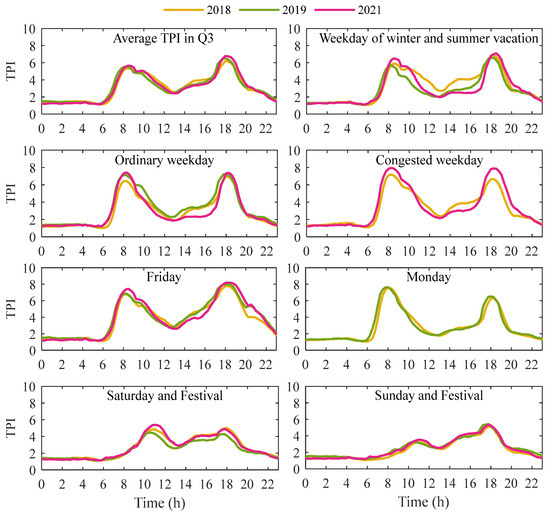
Figure 9.
TPI curves of different patterns in 2018, 2019, and 2021.
The following conclusions can be drawn from Table 11:
Table 11.
Average TPI of morning peak, evening peak, and off-peak hours of different patterns in 2018, 2019, and 2021.
- (1)
- Congestion during peak hours in 2019 shows an increasing trend compared with that in 2018. The maximum TPI of peak hours of different patterns in 2019 is higher by 3.94% on average than that in 2018, except for weekdays of winter and summer vacation and Saturdays and festivals. The average TPI between 10:00 and 12:00 in 2019 was lower by 13.68% on average than that in 2018.
- (2)
- The congestion of peak hours in 2021 shows an increasing trend compared with that in 2018 and 2019. The maximum TPI of peak hours of different patterns in 2021 increases by 8.35% and 7.15% on average compared with that of 2018 and 2019, respectively. The average TPI between 10:00 and 12:00 of weekday patterns in 2021 is lower by 13.10% and 7.50% on average, respectively, compared with that of 2018 and 2019.
- (3)
- The degree of congestion in the morning and evening peak increases in 2021 after COVID-19. The travel modes of some commuters are shifted from public transport to cars, considering health factors. Thus, the degree of road traffic congestion in the morning and evening peak commuting hours in 2021 is higher than that in 2019. The degree of congestion in off-peak hours decreases in 2021, indicating that travel activities in off-peak hours have decreased due to COVID-19.
7. Conclusions and Recommendations
Traffic congestion in large cities has become one of the most significant sustainability problems. It is necessary to study the traffic congestion patterns on the road network. The traffic congestion pattern recognition method is proposed in this paper based on the large amount of the TPI data. First, the SOM clustering method improved by the algorithm of automatically determining the optimal number of clusters is proposed. Second, cluster indexes and evaluation indexes are constructed. Third, the clustering results in different years are compared to analyze the impact of COVID-19 on congestion patterns as a case study. This paper provides a reference for other cities to develop the localized traffic congestion patterns. The main findings of this paper are summarized as follows:
- (1)
- TPIs are most effectively clustered based on the SOM clustering method improved by the automatically determining algorithm of the optimal clustering number, using the time-varying TPI. The traffic congestion patterns developed by this method describe 90.73% of the traffic flow on urban roads. Compared with the K-means method used in the existing research of Li et al. [20], the SOM clustering method has higher accuracy in the identification of traffic congestion patterns and effectively improves the silhouette coefficient. The SOM clustering method clusters TPI curves into more detailed traffic congestion patterns, which can describe the characteristics of traffic flow well.
- (2)
- TPIs on the road network can be generally clustered into weekend and festival patterns (Saturdays and festivals, Sundays and festivals) and different weekday patterns (Mondays, Fridays, ordinary weekdays, congested weekday, and weekdays of winter and summer vacation). The level of congestion on weekends and festivals is lower than that on weekdays. The morning peak of weekend and festival patterns appears at 10:00–12:00, which is later than weekday patterns at 7:00–9:00. The evening peak of weekend and festival patterns appears at 16:00–18:00, which is earlier than weekday patterns at 17:00–19:00.
- (3)
- Monday and congested weekday patterns are weekday patterns with prominent morning peaks, and the maximum TPI of the morning peak is 18.50% and 4.36%, respectively, higher than that of the evening peak. Fridays, ordinary weekdays, and weekdays of winter and summer vacation patterns are weekday patterns with prominent evening peaks, and the maximum TPI of the evening peak is 13.53%, 3.09%, and 13.83%, respectively, higher than that of the morning peak.
- (4)
- The degree of congestion in 2021 increases by 7.15% in peak hours and decreases by 7.50% in off-peak hours compared to in 2019. The proportion of travel modes in peak hours has shifted from public transport to cars, and the amount of travel activities in off-peak hours has decreased due to COVID-19.
The traffic congestion patterns in Beijing are studied based on TPIs in this paper. The application effect of the method proposed in this paper in other cities needs to be further studied, and the congestion patterns in different cities should be analyzed in the future.
Author Contributions
This work is the result of collaboration among J.Z., P.J., S.L., X.Z., G.S. and L.Y. All authors have equally contributed, reviewed, and improved the manuscript. All authors have revised the final manuscript. All authors have read and agreed to the published version of the manuscript.
Funding
This research was supported by the Fundamental Research Funds for the Universities of Beijing (No. X21063), the Natural Science Foundation of China (NSFC) (No. 52172301, 51678045) and the Major Program of the National Social Science Foundation of China (No. 21ZDA029).
Institutional Review Board Statement
Not applicable.
Informed Consent Statement
Not applicable.
Data Availability Statement
Some or all data and models that support the findings of this study are available from the corresponding author upon reasonable request.
Acknowledgments
This research is supported by the Fundamental Research Funds for the Universities of Beijing (X21063), the Natural Science Foundation of China (NSFC) (No. 52172301 and 51678045) and Major Program of the National Social Science Foundation of China (21ZDA029).
Conflicts of Interest
The authors declare no conflict of interest.
References
- Al-Rubaee, R.H.; Al-Etabi, N.D.; Alsaffar, J.I.; Al-Fadhili, S.B. Effects of checkpoints on urban travel time. IOP Conf. Ser. Mater. Sci. Eng. 2018, 1, 012020. Available online: https://iopscience.iop.org/article/10.1088/1757-899X/433/1/012020/pdf (accessed on 15 November 2022). [CrossRef]
- Magalhes, M.T.Q. Spatial coverage index for assessing national and regional transportation infrastructures. J. Transp. Geogr. 2016, 56, 53–61. [Google Scholar] [CrossRef]
- Matt, L. TomTom’s Congestion Index Report. 2013. Available online: http://transportblog.co.nz/2013/11/07/tomtoms-congestion-index-report (accessed on 15 November 2022).
- Sun, Q.; Zhang, Y.; Sun, L.; Li, Q.; Gao, P.; He, H. Spatial–temporal differences in operational performance of urban trunk roads based on TPI data: The case of Qingdao. Phys. A Stat. Mech. Its Appl. 2020, 568, 125696. [Google Scholar] [CrossRef]
- Sun, Q.; Chu, G.; Li, Q.; Zhang, Y. Identification of recurrent congestion in main trunk road based on grid and analysis on influencing factors. J. Adv. Transp. 2022, 2022, 4729017. [Google Scholar] [CrossRef]
- Wei, X.; Ren, Y.; Shen, L.; Shu, T. Exploring the spatiotemporal pattern of traffic congestion performance of large cities in China: A real-time data based investigation. Environ. Impact Assess. Rev. 2022, 95, 106808. [Google Scholar] [CrossRef]
- Wei, L.; Chen, P.; Mei, Y.; Wang, Y. Turn-level network traffic bottleneck identification using vehicle trajectory data. Transp. Res. Part C Emerg. Technol. 2022, 140, 103707. [Google Scholar] [CrossRef]
- Cheng, J.; Luo, D.; Chen, H.; Xiong, X.; Ma, Z.; Du, X. An electric vehicle charging station planning method considering traffic congestion. In Proceedings of the 2022 5th International Conference on Energy, Electrical and Power Engineering (CEEPE), Chongqing, China, 22–24 April 2022; pp. 1115–1125. [Google Scholar] [CrossRef]
- Yan, J.; Zhang, J.; Liu, Y.; Lv, G.; Han, S.; Alfonzo, I.E.G. EV charging load simulation and forecasting considering traffic jam and weather to support the integration of renewables and EVs. Renew. Energy 2020, 159, 623–641. [Google Scholar] [CrossRef]
- Yu, L.; Zhu, H.; Guo, J.; Zhang, X.; Sun, J.; Lei, X.; Song, G. A MFD-based calculation method of optimal traffic performance index: A case study of Beijing. J. Beijing Jiaotong Univ. 2022, 3, 26–33. [Google Scholar]
- Cheng, W.; Li, J.L.; Xiao, H.C.; Ji, L.N. Combination predicting model of traffic congestion index in weekdays based on Light GBM-GRU. Sci. Rep. 2022, 12, 2912. Available online: https://www.nature.com/articles/s41598-022-06975-1 (accessed on 15 November 2022). [CrossRef]
- Yi, H.; Bui, K.H.N. An automated hyperparameter search-based deep learning model for highway traffic prediction. IEEE Trans. Intell. Transp. Syst. 2020, 22, 5486–5495. [Google Scholar] [CrossRef]
- Wen, H.; Sun, J.; Zhang, X. Study on traffic congestion patterns of large city in China taking Beijing as an example. Procedia Soc. Behav. Sci. 2014, 138, 482–491. [Google Scholar] [CrossRef]
- Calafate, C.T.; Soler, D.; Cano, J.C.; Manzoni, P. Traffic management as a service: The traffic flow pattern classification problem. Math. Probl. Eng. 2015, 21, 716598. [Google Scholar] [CrossRef]
- Sun, Q.; Sun, Y.; Sun, L.; Li, Q.; Zhao, J.; Zhang, Y. Research on traffic congestion characteristics of city business circles based on TPI data: The case of Qingdao, China. Phys. A Stat. Mech. Its Appl. 2019, 534, 122214. [Google Scholar] [CrossRef]
- Nguyen, T.T.; Krishnakumari, P.; Calvert, S.C.; Vu, H.L.; Van Lint, H. Feature extraction and clustering analysis of highway congestion. Transp. Res. Part C Emerg. Technol. 2019, 100, 238–258. [Google Scholar] [CrossRef]
- Toshniwal, D.; Chaturvedi, N.; Parida, M.; Garg, A.; Choudhary, Y. Application of clustering algorithms for spatio-temporal analysis of urban traffic data. Transp. Res. Procedia 2020, 48, 1046–1059. [Google Scholar] [CrossRef]
- Loo, B.; Huang, Z. Delineating traffic congestion zones in cities: An effective approach based on GIS. J. Transp. Geogr. 2021, 94, 103108. [Google Scholar] [CrossRef]
- Behara, K.; Bhaskar, A.; Chung, E. A DBSCAN-based framework to mine travel patterns from origin-destination matrices: Proof-of-concept on proxy static OD from Brisbane. Transp. Res. Part C Emerg. Technol. 2021, 131, 103370. [Google Scholar] [CrossRef]
- Li, X.; Gui, J.; Liu, J. Data-driven traffic congestion patterns analysis: A case of Beijing. J. Ambient. Intell. Humaniz. Comput. 2022, 1–14. [Google Scholar] [CrossRef]
- Corrado, S.J.; Puranik, T.G.; Fischer, O.P.; Mavris, D.N. A clustering-based quantitative analysis of the interdependent relationship between spatial and energy anomalies in ads-b trajectory data. Transp. Res. Part C Emerg. Technol. 2021, 131, 103331. [Google Scholar] [CrossRef]
- Salama, M.; Srinivas, S. Joint optimization of customer location clustering and drone-based routing for last-mile deliveries. Transp. Res. Part C Emerg. Technol. 2020, 114, 620–642. [Google Scholar] [CrossRef]
- Li, Z.; Di, X.; Weng, J.; Wang, J. Regional classification and evaluation method based on congestion temporal-spatial characteristics. J. Highw. Transp. Res. Dev. 2019, 2, 121–127. [Google Scholar]
- Cheng, Z.; Wang, W.; Lu, J.; Xing, X. Classifying the traffic state of urban expressways: A machine-learning approach. Transp. Res. Part A Policy Pract. 2020, 137, 411–428. [Google Scholar] [CrossRef]
- Fu, J.; Fu, Q.; Hu, J. Traffic congestion status evaluation for signal-controlled intersection based on Queuing Time Index. J. Transp. Inf. Saf. 2020, 6, 80–86. [Google Scholar]
- Neves, F.; Finamore, A.C.; Madeira, S.C.; Rui, H. Mining actionable patterns of road mobility from heterogeneous traffic data using biclustering. IEEE Trans. Intell. Transp. Syst. 2021, 99, 6430–6445. [Google Scholar] [CrossRef]
- Zhang, L.; Jia, Y.; Sun, D.; Yang, Y. A fuzzy weighted c-means classification method for traffic flow state division. Mod. Phys. Lett. B 2021, 35, 20. [Google Scholar] [CrossRef]
- Kohonen, T. Self-Organizing Maps. Springer-Verl. 2001, 30, 501. [Google Scholar]
- Pd, A.; Ldg, B.; Rm, A. Smoothed self-organizing map for robust clustering—Sciencedirect. Inf. Sci. 2020, 512, 381–401. [Google Scholar] [CrossRef]
- Siami, M.; Naderpour, M.; Lu, J. A mobile telematics pattern recognition framework for driving behavior extraction. IEEE Trans. Intell. Transp. Syst. 2020, 99, 1459–1472. [Google Scholar] [CrossRef]
- Amiri, V.; Nakagawa, K. Using a linear discriminant analysis (lda)-based nomenclature system and self-organizing maps (som) for spatiotemporal assessment of groundwater quality in a coastal aquifer. J. Hydrol. 2021, 603, 127082. [Google Scholar] [CrossRef]
- Pham, M.H.; Bernhard, D.; Diallo, G.; Messai, R.; Simonet, M. SOM-based clustering of multilingual documents using an ontology. In Data Mining with Ontologies: Implementations, Findings, and Frameworks; Nigro, H., Gonzalez Cisaro, S., Xodo, D., Eds.; IGI Global: Hershey, PA, USA, 2008; pp. 65–82. [Google Scholar] [CrossRef]


Disclaimer/Publisher’s Note: The statements, opinions and data contained in all publications are solely those of the individual author(s) and contributor(s) and not of MDPI and/or the editor(s). MDPI and/or the editor(s) disclaim responsibility for any injury to people or property resulting from any ideas, methods, instructions or products referred to in the content. |
© 2023 by the authors. Licensee MDPI, Basel, Switzerland. This article is an open access article distributed under the terms and conditions of the Creative Commons Attribution (CC BY) license (https://creativecommons.org/licenses/by/4.0/).