Article

Flood Risk Assessment Based on a Cloud Model in Sichuan Province, China

1
Aerospace Information Research Institute, Chinese Academy of Sciences, Beijing 100094, China
2
International Research Center of Big Data for Sustainable Development Goals, Beijing 100094, China
3
National Disaster Reduction Center, Ministry of Emergency Management, Beijing 100124, China
*
Author to whom correspondence should be addressed.
Sustainability 2023, 15(20), 14714; https://doi.org/10.3390/su152014714
Submission received: 27 August 2023 / Revised: 28 September 2023 / Accepted: 9 October 2023 / Published: 10 October 2023
(This article belongs to the Special Issue Geographic Information Science for the Sustainable Development)

Abstract

:
Floods are serious threats to the safety of people’s lives and property. This paper systematically introduces the basic theories and methods of flood risk assessment, takes Sichuan Province as the study area, and establishes a flood risk assessment index system with 14 indicators in four aspects—disaster-causing factors, disaster-forming environment, disaster-bearing body, and regional disaster resilience capacity—from the causes of disaster losses and flood formation mechanisms. Furthermore, this paper constructs a flood disaster risk assessment model for Sichuan Province based on a cloud model, entropy value, and GIS technology. The model is validated by taking the July–August 2023 flood disaster as an example, and the results show that the distribution of the disaster was consistent with the flood risk assessment results of this paper, which verifies that the selected indicators are appropriate and the model is accurate and valid.

1. Introduction

Flooding is the rapid rise of the water level of rivers, lakes, and oceans in a short period of time caused by prolonged rainfall, storms, flash floods (resulting from torrential rains), and dam failures. Flood disasters occur with serious consequences and can have a great impact, threatening both human life and the safety of property. Flood risk assessment is the basic work of flood management, and it is a research hotspot for disaster experts and scholars to study, as such assessments often prove difficult.
A clear definition of risk is the basis for flood studies, and according to the United Nations humanitarian agencies, risk is the expected loss (in terms of lives lost, people injured, property damaged, and economic activity disrupted) due to a particular hazard for a given area and reference period [1]. Although there can be different types of risks, as defined by the IPCC, risk is often expressed as the probability of the occurrence of hazardous events or trends multiplied by the consequences of their occurrence [2]. Natural hazard risk results from a combination of the natural hazard, the exposure of people or assets to that hazard, and the vulnerability and coping capacity of each person or asset to that hazard [3].
Flood risk is neither the phenomenon of flooding per se, nor is it the same as flood damage or flood losses, but rather the probability of the occurrence of floods of different intensities and the losses they may cause. In 1997, Crichton et al. developed the conceptual model of the “flood risk triangle” from the definition of a natural hazard, which considers that flood disaster risk is determined by the combination of three elements: flood hazard, exposure to disaster-bearing bodies, and vulnerability. The three risk elements form a flood risk triangle, and the increase or decrease in any one side affects the size of the triangle, i.e., the size of the flood risk [4]. Floods are the result of the interaction and mutual influence of the disaster-causing factors, the disaster-causing environment, and the disaster-bearing body, and the corresponding flood risk should be the synthesis of the risk factors above.
The United Nations’ International Strategy for Disaster Reduction (ISDR) defines disaster risk assessment as a qualitative or quantitative approach to determine the nature and extent of disaster risk by analyzing potential hazards and evaluating existing conditions of exposure and vulnerability that, together, could result in harm to people, property, services, livelihoods, and the environment on which they depend [5]. Flood risk assessment refers to the use of various methods and models to synthesize individual risk indicators from the various influencing factors of flood risk into a composite risk indicator value, which is used to express the risk probability of flooding and the degree of loss in different risk areas after completing the baseline of flood risk analysis, and also to determine the risk levels of different areas based on certain classification criteria. Timely and accurate flood disaster risk assessment is the basis for the construction of a flood prevention and mitigation system, which can make the flood disaster response work more scientific and effective and has important practical significance.
Sichuan Province in China has always been a province of frequent floods and serious disasters due to the rivers running through the province, which is known as the “Province of a Thousand Rivers”. The rich water system of the province has nourished this unique land for a long time, but the frequent extreme weather events, numerous rivers, and the topography of Sichuan have greatly increased the chances of flooding as time has gone by. Flooding is now one of the most frequent, widespread, and severe disasters in Sichuan, causing the greatest casualties and economic losses due to its widespread, sudden, rapid, and destructive nature. According to statistics, in the flood season of 2021–2022, localized floods and geological disasters were frequent and severe, affecting a total of 11.59 million people in 180 counties (cities and districts) in 21 cities, with direct economic losses of 26.65 billion CNY [6,7]. In recent years, under the dual impacts of climate change and human activities, extreme flood events have become increasingly sudden and frequent. Therefore, there is a rising need to conduct flood risk assessment scientifically and accurately.
This study takes Sichuan as the study area for its flood risk assessment research. The results of the flood risk assessment carried out will support the development of an appropriate early flood disaster warning system, improve the effectiveness of the use of flood control resources, and at the same time, provide a reference for the study of flood disaster risk in other areas.

2. Related Work

When we consider the process of flood formation, flood risk is formed by the interaction between the disaster-causing factors, the disaster-conceiving environment, and the disaster-bearing body. The level of flood risk depends on the degree of the hazard of the disaster-causing factors and the disaster-conceiving environment, the exposure and vulnerability to disaster-bearing bodies within the scope of the disaster, and the effectiveness of the response through the defense activities of mankind. Flood risk assessment methods include historical disaster statistics methods, multi-criteria indicator system methods, remote sensing and GIS (geographic information system) coupling methods, scenario simulation evaluation methods, and machine learning methods [8,9]. The multi-criteria indicator system, which is the most widely used method at present, is unique in that it does not rely on historical disaster data, and it can be used in conjunction with spatial analysis of the GIS.
The flood risk assessment method based on the indicator system consists of the following four steps: first, constructing a flood risk assessment indicator system by considering the social and natural conditions of the study area; second, calculating the weights of each assessment indicator by using different weighting methods; third, proposing a feasible and effective method for comprehensively assessing the flood risk level; and finally, determining the flood risk level [10].
Flood risk assessment is based on its constituent elements, and certain principles must be determined on how to select the corresponding representative indicators, quantify the indicators, and then use specific mathematical models to obtain the risk value. Commonly used mathematical models include the analytical hierarchy process, cloud model, grey clustering method, data envelopment analysis, artificial neural network method, etc. [11,12,13,14]. Combined with the spatial analysis and mapping of GIS, the indicators representing each level of analysis are quantified and processed, appropriate research units and sizes are selected, values are assigned to the created layers of indicators, and a mathematical model is then realized through the functions of superposition analysis. This enables researchers to calculate the disaster risk as well as obtain a visual expression of how the distribution of the disaster risk map forms [15,16,17].
Indicator weights are directly related to the evaluation results and determine the deviation between the evaluation results and the actual results, so the reasonable allocation of indicator weights is an important part of the construction of the indicator evaluation system. The hierarchical analysis method (AHP) and entropy weighting method (EW) are typical representatives of subjective and objective weighting methods, respectively. AHP compares the importance of each indicator through expert scores, constructs judgment matrices, obtains an evaluation of the importance of each indicator, and calculates the weight value of each indicator. EW can be used to objectively determine the weights of indicators based on the dispersion of each indicator value, which is less affected by subjective factors than AHP [18,19].
Flood disaster analysis and risk assessment must fully take into account uncertainty and its complexity in natural disaster systems. Accordingly, in the process of evolving from qualitative to quantitative analysis, flood risk analysis has gradually begun to adopt theoretical methods such as uncertainty computation, fuzzy sets, and probability theory. Fuzzy integrated assessment methods have been successfully applied to flood risk assessment [9,14,20]. However, these strategies are limited by their inability to account for the randomness and uncertainty of the indices.
The concept of the cloud model was first proposed in 1995 by Prof. Deyi Li, an academician of the Chinese Academy of Engineering, and it was based on probability theory and fuzzy mathematics. The cloud model can comprehensively consider randomness and fuzziness; realize the mutual transformation between numerical features and linguistic values; and simulate randomness, fuzziness, and correlation between the two by using a cloud generator [21,22]. Based on uncertainty analysis, the cloud generator can describe the stochasticity of the disaster-causing factors, the disaster-bearing environment, the disaster-bearing body, the regional disaster response capacity, and the fuzziness of the information expression, and the cloud model has been widely used in the evaluation of indicators in many fields [23,24,25,26,27], including regional-scale water resource carrying capacity assessment, flood resource utilization risk assessment, drought assessment, and fire risk assessment. Applying the cloud model to the evaluation of flood disaster risk levels can enable the uncertainty mapping of the quantitative values of each assessment indicator to a qualitative evaluation level.
In 2014, Liu et al. developed an urban flood risk assessment model based on an RBF artificial neural network and a cloud model based on nonlinear, stochastic, and fuzzy characteristics of flooding [28]. In 2020, Li et al. analyzed flood vulnerability from the perspective of disaster-causing factors and disaster-inducing environments, and they constructed a flood vulnerability assessment model based on cloud modeling by measuring seven indicators [29]. In 2021, Wu et al. introduced the energy evaluation theory of ecological economics and the cloud model into flood risk assessment, used energy evaluation to convert flood risk factors into measurable energy units, established a flood risk assessment scale, and built a cloud flood risk assessment model [30]. In 2022, Fu et al. constructed an index-based flood risk assessment method based on the pressure–state–response conceptual model of game theory and cloud model (PSR-GT-CM), which was applied to the flood risk assessment of urban cultural heritage sites [18]. In 2023, Jiang et al. proposed a set-pair cloud model based on cloud theory, which was applied to assess the risk level of tunnel flooding, to provide guidance for predicting and preventing flooding in karst tunnels [31]. Among the various flood disaster risk evaluation methods, the cloud model, as an advanced mathematical model, reveals the intrinsic relationship between randomness and ambiguity, and the application of the cloud model to flood disaster risk evaluation can thus enable researchers to accurately predict the flood disaster risk.
In this article, we adopt the indicator system combined with GIS, take the Sichuan Province of China as the study area, and establish a flood disaster risk level assessment indicator system by comprehensively considering the influencing factors of floods and their secondary disasters. Furthermore, this article presents our flood risk assessment of Sichuan Province watersheds based on the cloud model combined with the entropy weighting method. Additionally, our work is outlined to analyze and evaluate the contents of flood risks at various levels combined with the spatial analysis and mapping function of GIS to provide technical support for the management of flood disasters in the study area.

3. Materials and Methods

3.1. An Overview of the Study Area

Sichuan Province is located in the southwest of China, with most of the basin belonging to the upper and middle reaches of the Yangtze River and a small part belonging to the upper reaches of the Yellow River, with latitudes and longitudes ranging from 92°21′ to 108°12′ E and 26°03′ to 34°19′ N. Sichuan Province has a length of 1075 km from east to west, a width of more than 900 km from north to south, and a total area of 485,000 square kilometers, as shown in Figure 1.
Sichuan Province has a complex and varied terrain, comprising mountainous, hilly, and plateauing regions; occasionally other landforms; the bottom of the basin; the flat hills; and the Western Sichuan plains. Most of the areas of elevation difference reach more than 500 m. The lowest elevation of the basin is about 70 m, and the highest point, Gongga Mountain, reaches more than 7400 m in height.
According to the 2022 National Sample Survey on Population Changes, the annual birth population of Sichuan Province was 535,000, and the province’s household population at the end of the year was 90.7 million. In 2022, the province’s gross domestic product (GDP) was 567.5 billion CNY, per capita GDP was 67.8 million CNY, and the annual per capita disposable income of the whole population was 30,679 CNY [32].
Sichuan is influenced by the distribution of land and sea and the Tibetan Plateau. Its overall climate is diverse, not only changing from one area to another but also changing with altitude due to large terrain differences. According to the differences in the distribution of water, heat, and light, the province can be roughly divided into three major climate zones: the Sichuan Basin in the subtropical humid climate zone, the Southwest Sichuan mountainous subtropical semi-humid climate zone, and the Northwest Sichuan alpine plateau climate zone.
The precipitation in Sichuan Province gradually decreases from southeast to northwest. The higher terrain in the west exacerbates the east–west difference in precipitation distribution. The Sichuan Basin has abundant precipitation, with annual precipitation of 1000 to 1200 mm in most areas and more than 1200 mm in the rainy areas. The basin edge of the Tianquan to Emei area is where the province receives the most rainfall, with annual precipitation generally reaching more than 1400 mm. In the basin west of the Qionglai Mountains, a vertical change in precipitation can be observed on the eastern slope. At an altitude of 2100~2300 m, annual precipitation can reach 2000~2500 mm. There are also rainy areas in the northwestern and northeastern mountains of the Sichuan Basin. When the seasons are considered, winter (December to February) precipitation is the lowest, accounting for only 3 to 4% of the year; meanwhile, it is in the summery half of the year (May to October) when more than 80% of the annual precipitation falls.
Sichuan Province is densely populated by rivers, the vast majority of which belong to the Yangtze River system, while only a few belong to the Yellow River system. The area of the Yangtze River basin in Sichuan is 468,500 km², accounting for about 97% of the province’s total area, while the area of the Yellow River basin is only 16,800 km², accounting for about 3% of province’s total area. There are 2473 small watersheds in the province, most of which have an area of less than 200 km², though some of them have an area of 200–400 km² due to the need to consider the integrity of the region. The flood hazards in the watersheds are mainly distributed in the mountainous areas of Western Sichuan, the Wumeng Mountains of Southwestern Sichuan, and the mountainous areas on the edge of the basin, i.e., Ganzi, Aba, Liangshan, Ya’an, Luzhou, Dazhou, and other areas.

3.2. The Establishment of the Sichuan River Basin Flood Evaluation Indicator System

The first task when conducting flood disaster risk evaluation research is to establish appropriate evaluation indicators. Risk has uncertainty and ambiguity. By stratifying, categorizing, and screening the many complicated risk indicators, the main risk factors can be identified, so as to build a reasonable risk indicator system.
Generally speaking, there are three main conditions for the formation of a flood disaster: first, the hazardous factors that cause the disaster, namely disaster-causing factors, including natural and man-made factors; second, the environment in which the disaster is formed, namely the disaster-conceiving environment, including the natural and social environment; and, third, the flood area, including human habitation or the distribution of social property—that is, the disaster-bearing body. The level of flood risk depends on the hazardousness of the natural flood environment formed by the disaster-causing factors and the disaster-conceiving environment, the exposure to the disaster-bearing bodies within the disaster area, and the response effectiveness of human defense activities.

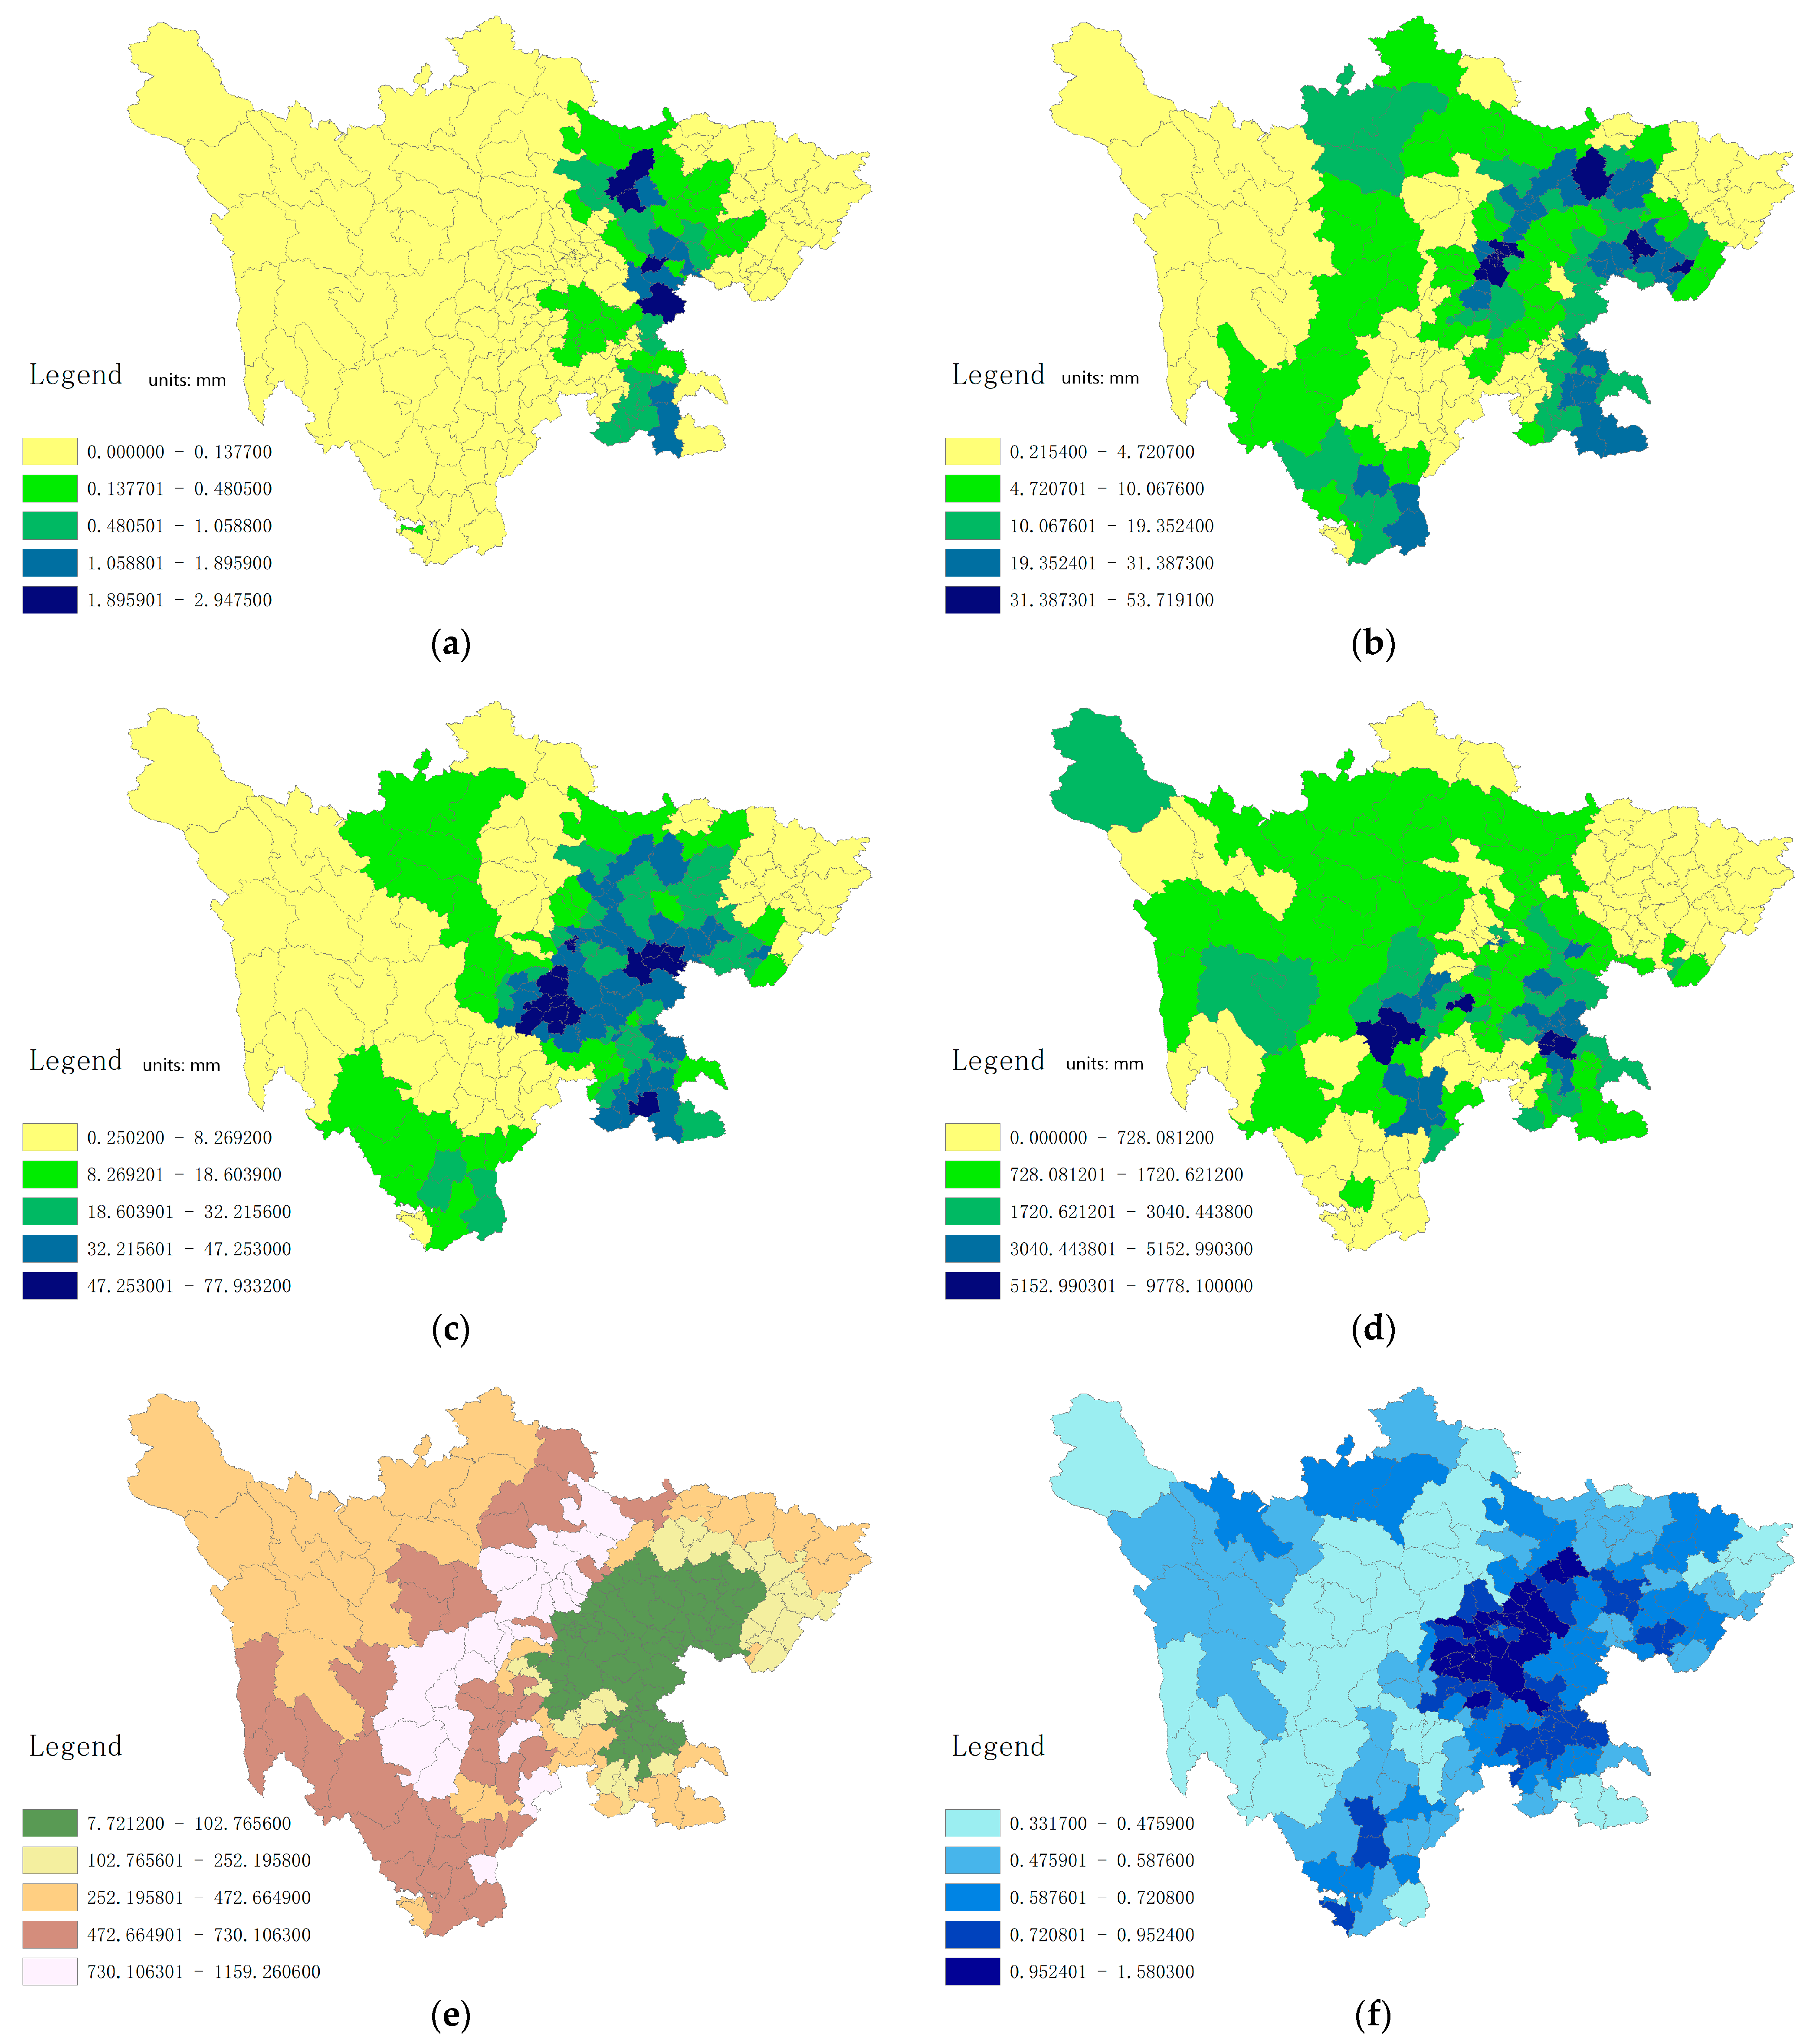
3.2.1. Hazard Indicators of Disaster-Causing Factors

Heavy rainfall is the most important factor causing floods. It is estimated that more than 90% of flood disasters in China in recent years were caused by heavy rainfall. In this study, the regional-scale precipitation level was evaluated from the following aspects:
(1)
Precipitation in the past 1 h
This is a direct indicator of rainfall intensity and a direct reflection of the intensity of flood-causing rainfall. Large amounts of rainfall in a short period of time can leave the ground unable to absorb water quickly enough, resulting in rapid runoff, which can lead to flooding.
(2)
Precipitation for the previous 12 and 24 h
These are the two indicators that increase the weight of rainfall. Only these rainfall indicators are time sensitive. This study is oriented toward daily real-time flood risk analysis, which improves the timeliness of flood risk assessment results by adding these rainfall indicators.
(3)
Precipitation for the past 5 days
This is an indicator of the intensity of continuous rainfall in a region, where prolonged or heavy rainfall can lead to soil saturation and rising river levels, which, in turn, can trigger flooding.

3.2.2. Indicators of the Disaster-Conceiving Environment

The environment of a flood disaster mainly includes the water system, topography, geomorphology, soil, vegetation, climate, and other geographical factors, as well as the impact of human socio-economic activities on the natural environment.
Flood hazards are related to the aggregation of water flow and the rise in the water level in a catchment area with low relative elevation and gentle terrain, with direct correlates being the surface of the river water system and the topographic slope and indirect correlates being the interception effect of vegetation on precipitation and the water storage effect of soil, etc. The latter has particular relevance for mudslides and landslides, which are related to unstable soil bodies. Therefore, this study determined the indicators of disaster-prone environments in terms of the river water system surface, topographic factors, and secondary geological hazards.
(1)
River network density
The river system is a direct influencing factor of floods, including different grades of rivers, lakes, reservoirs, ditches, etc., within the region (reflecting the location area directly related to the occurrence of floods). Therefore, it needs to be considered a priority. The greater the density of the river network in the area, the less stable the soil in the area will be over the years, increasing the risk in the area.
(2)
Topographic factors
The standard deviation of elevation is a measure of the change in terrain elevation. In areas with flat terrain and little undulation, runoff tends to pool and often forms flood disasters; in areas with high terrain and large undulation, water flows quickly and can be drained quickly, but it is prone to causing landslides, mudslides, and other disasters.
(3)
Factors of secondary geological disasters
The vast majority of landslide and mudslide disasters that occurred in China’s mountainous regions in recent years were related to rainfall, and landslides and other disasters are highly likely to occur when heavy rainfall occurs. Therefore, the number of flash flood hazard areas is selected as an indicator of regional geological hazard vulnerability.

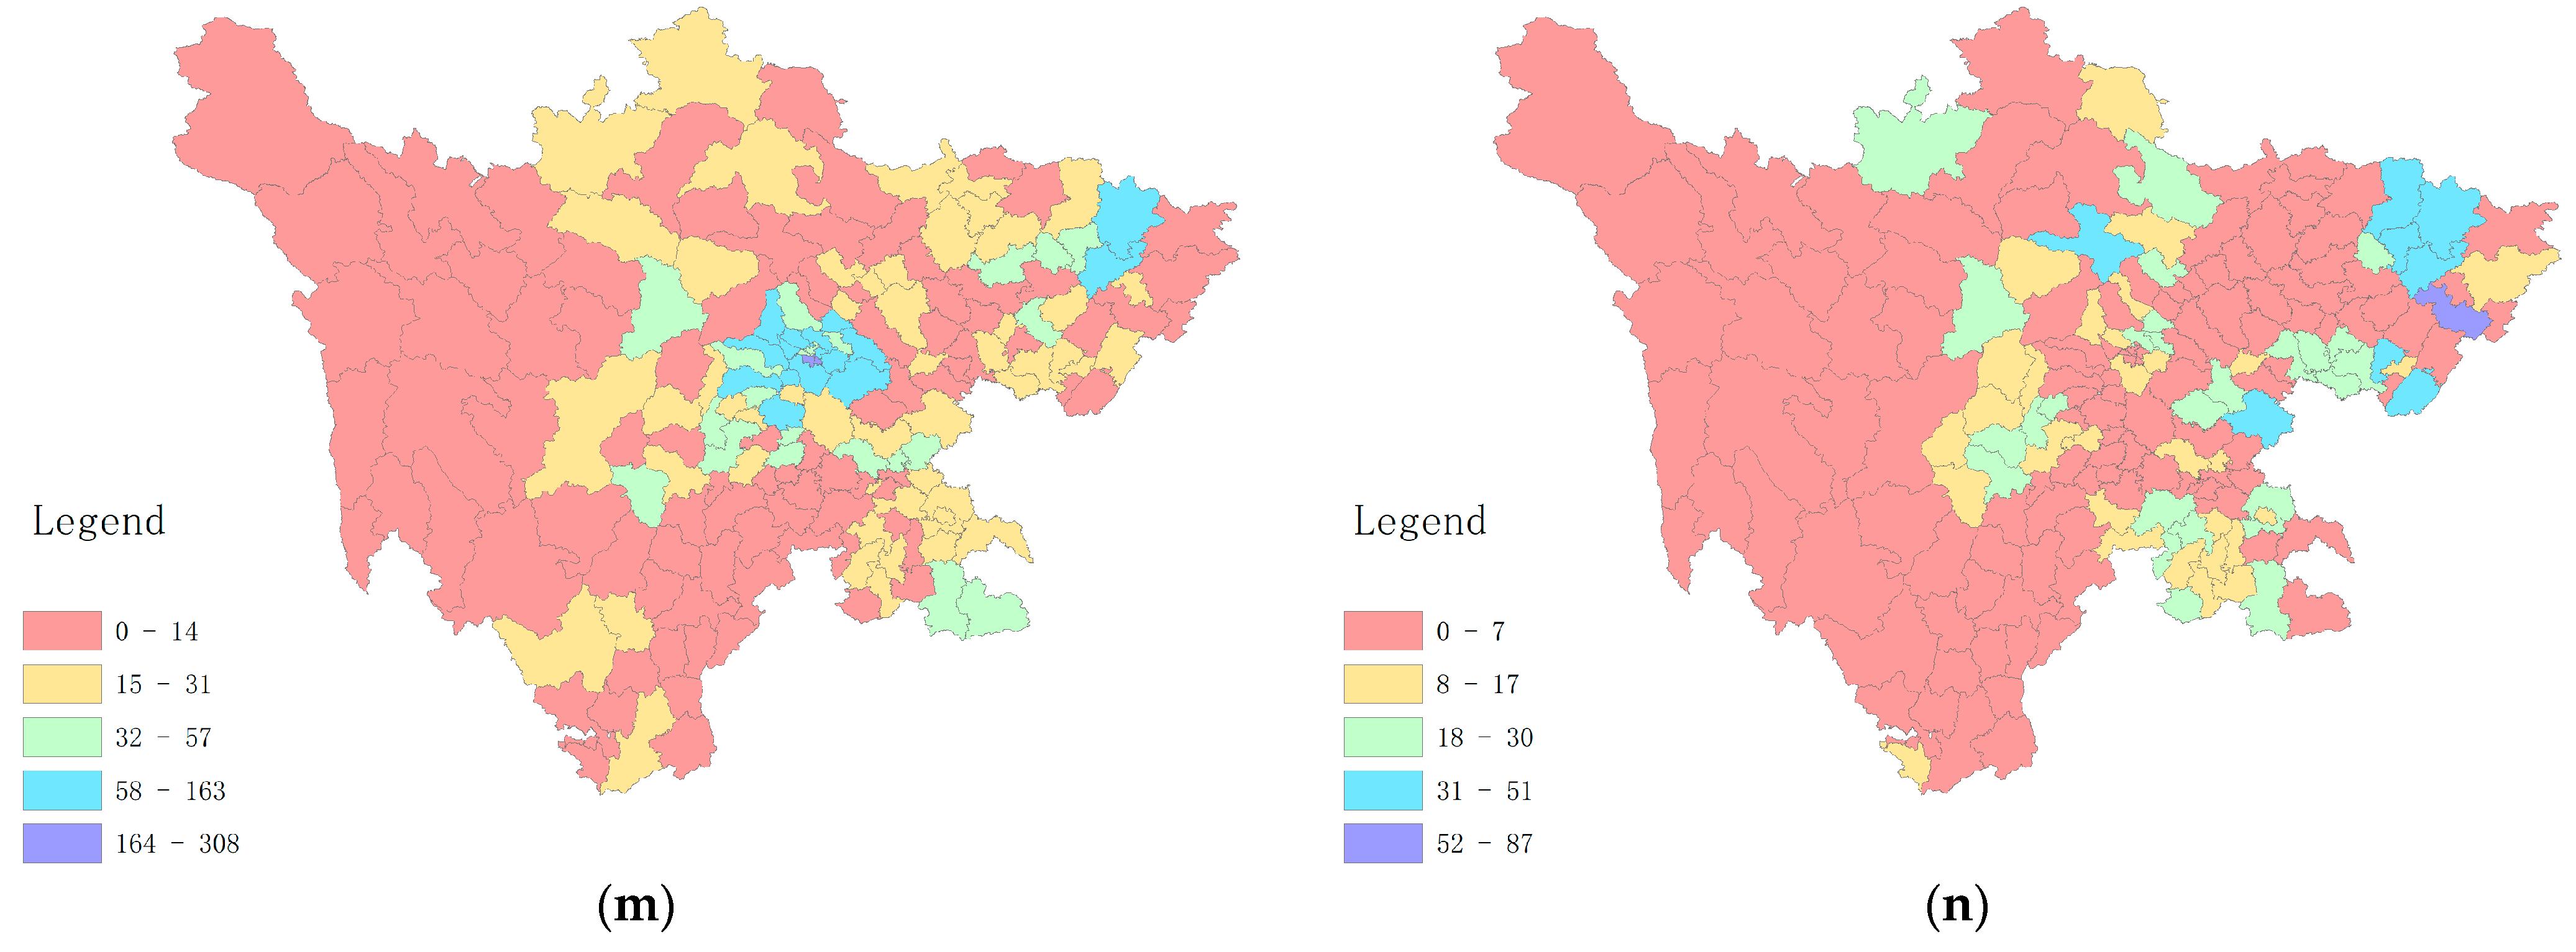
3.2.3. Indicators of Exposure to Disaster-Bearing Bodies

The exposure to disaster-bearing bodies refers to the number and distribution of disaster-bearing bodies under the influence of disaster-causing factors, which is a necessary condition for disaster risk. There is no risk of loss in areas with zero exposure, and there is no risk of loss in areas not involved in disasters.
(1)
Population density and distribution
The more populous and denser the area, the easier it is for disasters to cause casualties and losses, especially for villages with complicated terrain and inconvenient transportation. The inability to evacuate people from a danger zone in time when a disaster occurs is the main reason for casualties caused by floods.
(2)
GDP density and distribution
GDP is directly impacted by disasters. Its vulnerability can be described by the value of the GDP per unit area.
(3)
Facilities and assets such as roads
The terrain of vast mountainous areas is complex, and roads are important for people’s lives and the development of socio-economic activities. Roads are divided into highways, national highways, provincial highways, county roads, township roads, and village roads. It is intuitive and effective to use the construction cost to measure the exposure of assets such as roads and other such facilities.
(4)
Hazardous chemical enterprises.
There are a large number of hazardous substances in chemical plants, and flood disasters may cause environmental pollution, epidemics, and other hazards if these substances are disturbed.

3.2.4. Indicators of Regional Disaster Resilience

The regional disaster resilience capacity is a subjective factor derived from the initiative of local people. It describes the strength of basic and special defense measures taken by the people in the region to ensure that the disaster-bearing bodies are protected from or are at a low level of threat from a certain disaster. The amount of disaster damage is largely determined by a population’s disaster resistance capacity. It must be calculated based on complex factors, including disaster prevention engineering construction, rescue and relief planning and deployment, post-disaster reconstruction, and many other aspects, which makes it very difficult to assess and quantify.
Based on the principles of objectivity, quantification, and accessibility, this study selected the number of rescue teams and the number of material warehouses as indicators of regional disaster resilience. These two indicators provide an insight into human and material resources at the regional level, reflecting the government’s emergency management capacity and disaster response speed.

3.3. Data Collection and Processing

This study established a flood risk evaluation indicator system for Sichuan in terms of counties. Its 14 indicators of the flood formation mechanism and causes of disaster loss were considered to cover four categories: disaster-causing factors, disaster-conceiving environment, disaster-bearing body, and regional disaster resilience capacity, as shown in Table 1.
The data used in this study mainly include basic geographic data, topographic elevation data, meteorological data, and socio-economic data.
  • The basic geographic data, including river network and water system data, administrative divisions, etc., were obtained from the National Catalogue Service for Geographic Information (NCSGI) of China, in which the final river data used were obtained via DEM correction based on vector river data.
  • Elevation data were 12.5 m resolution DEM data downloaded from the U.S. Geological Survey (USGS).
  • Meteorological data on precipitation were obtained from the China Meteorological Data Sharing Service Network.
  • Socio-economic data were obtained from the Sichuan Statistical Yearbook of the Sichuan Provincial Bureau of Statistics.
The indicators were processed according to the calculation method in Table 1, and a visualization of each indicator is shown in Figure 2.

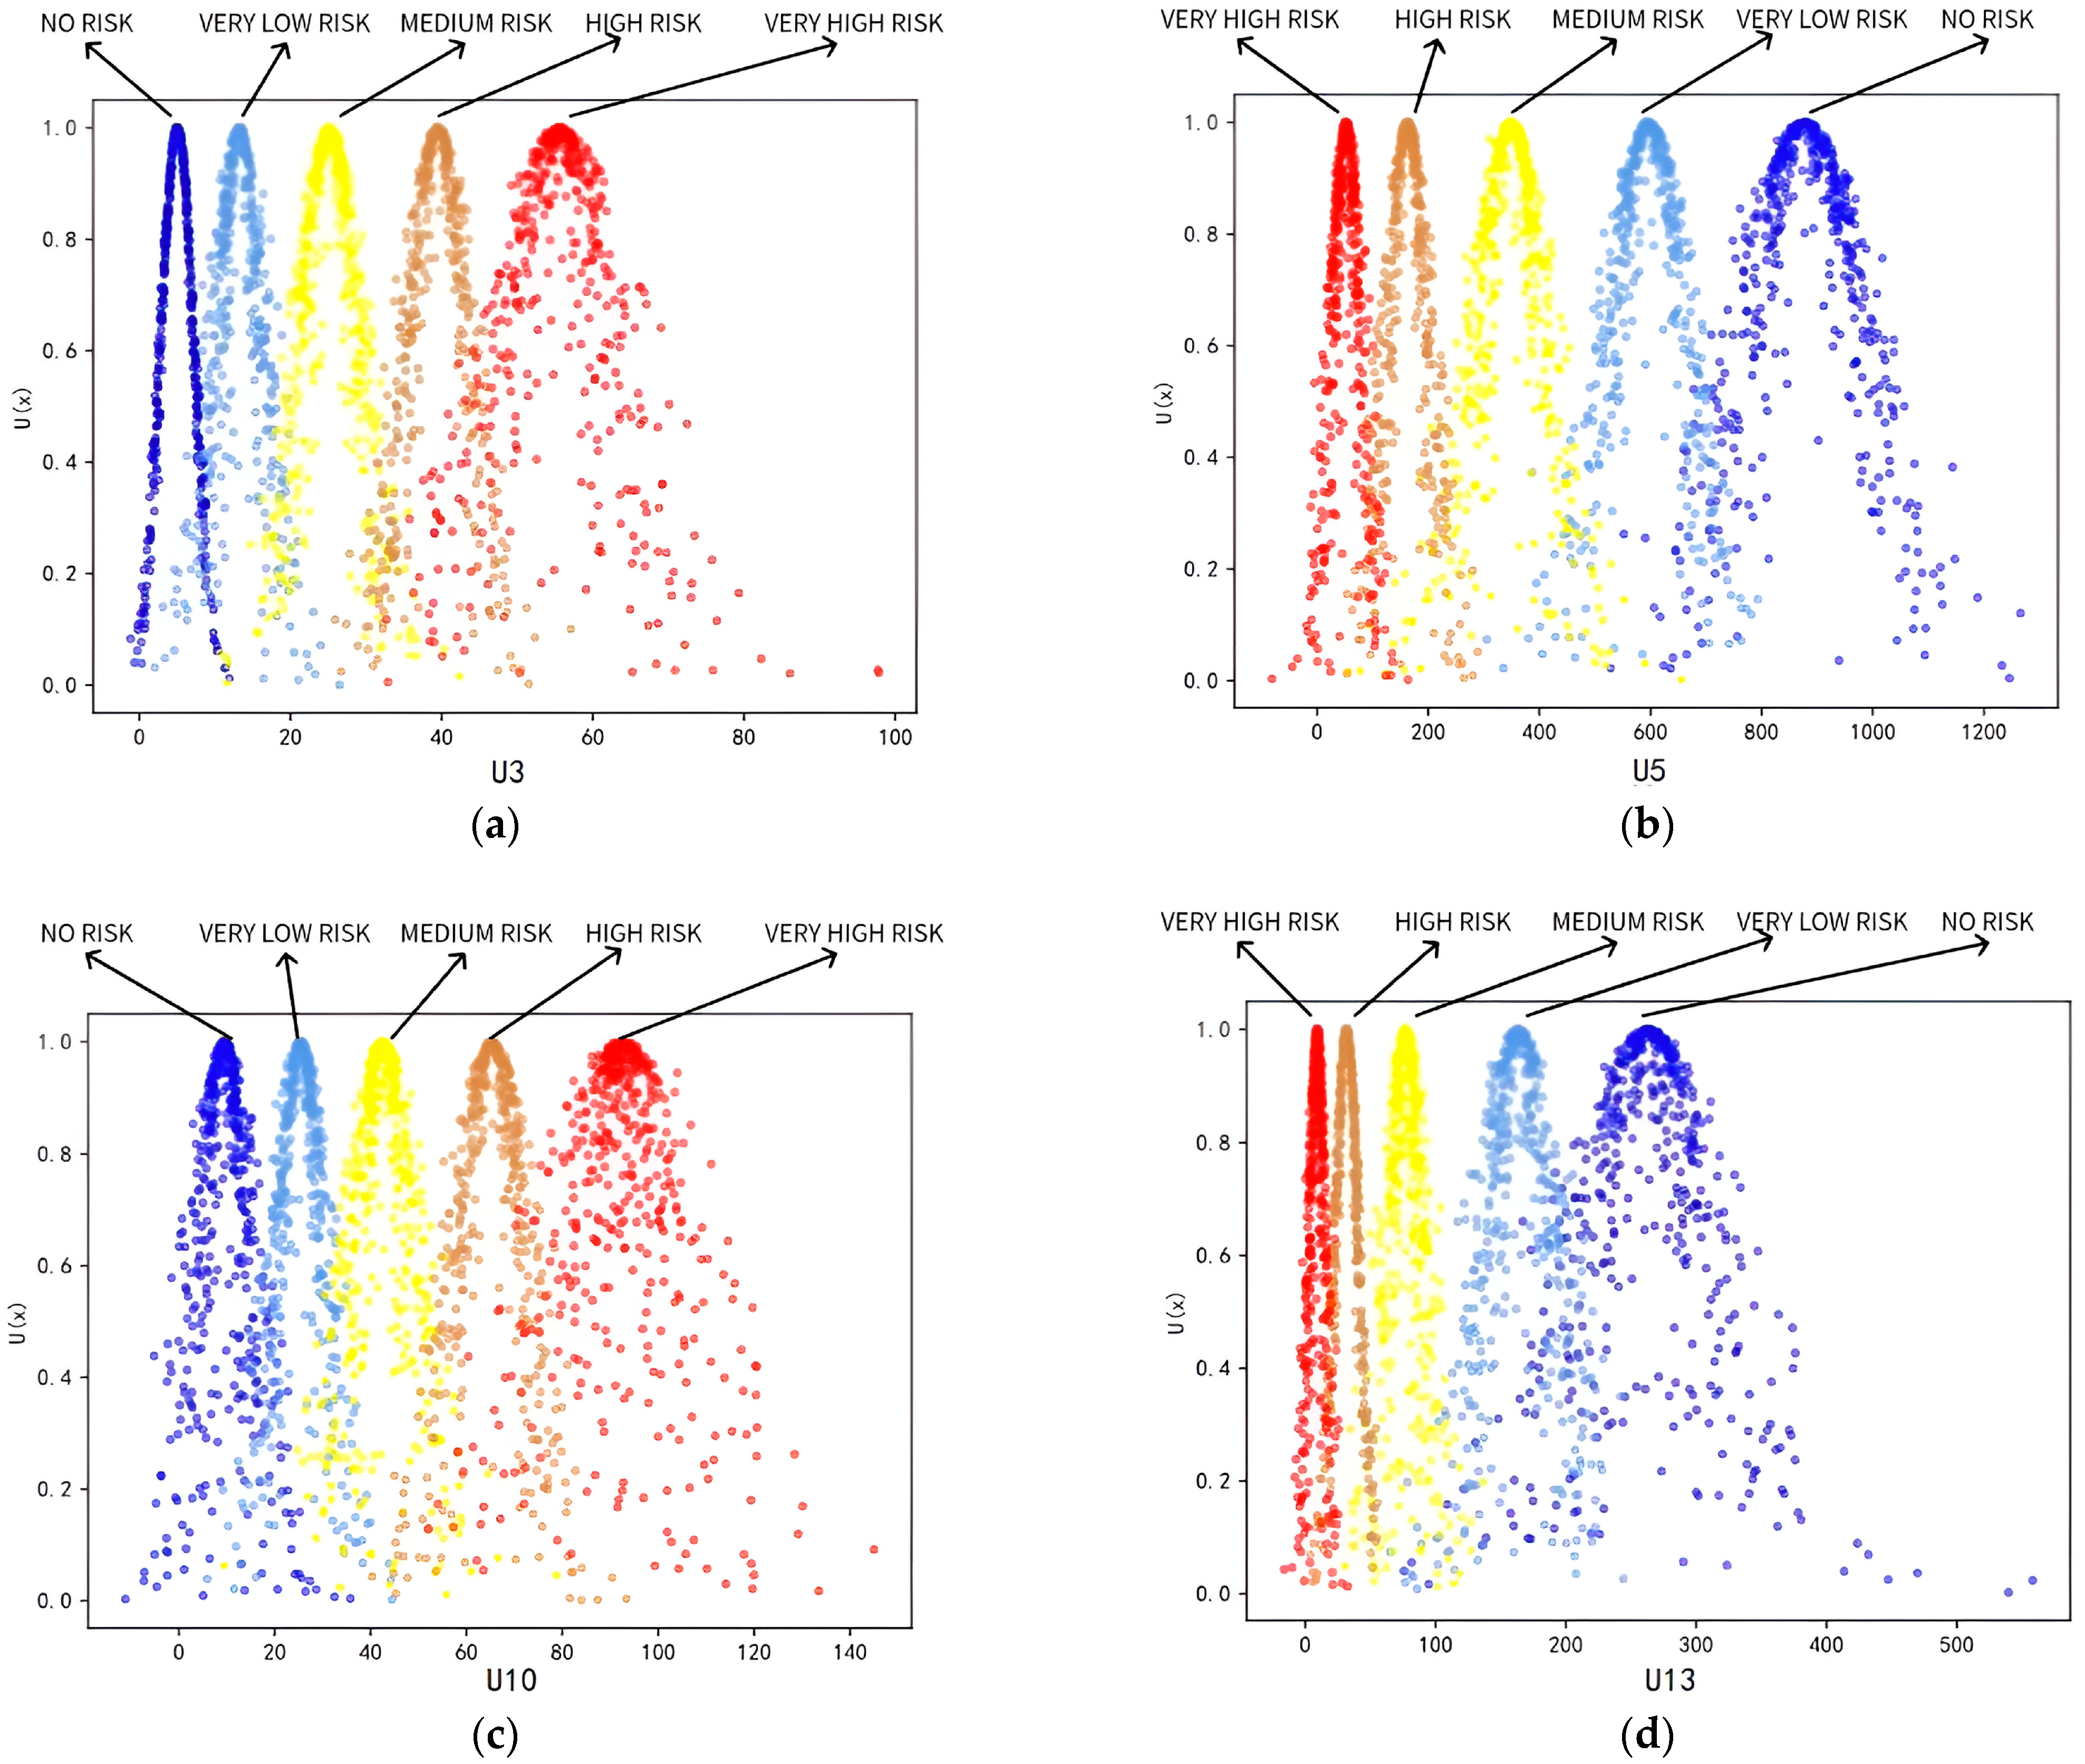
3.4. A Quantitative Assessment of Flood Risk Based on Cloud Modeling and the Entropy Weighting Method

The cloud model is a kind of qualitative–quantitative mutual transformation model, which can determine the numerical state from the fuzzy data description and can also abstract the precise numerical value into a proper qualitative description. In such ways, it can resolve the ambiguity and uncertainty in the process of obtaining the indicator weights and evaluating the indicators.
The numerical properties of the cloud model are characterized by Expectation (Ex), Entropy (En), and Hyper-entropy (He), which reflect the overall quantitative properties of the qualitative concepts. Ex refers to the expectation of the variable values in the random sampling, which is the most representative point in the qualitative concepts; En reflects the uncertainty of the qualitative concepts, and usually, the higher the entropy, the more difficult the deterministic quantification; and He reflects the entropy uncertainty.
The cloud generator is an algorithm that can convert between qualitative and quantitative data. It is generally divided into two types: forward cloud generator and reverse cloud generator. The mapping from qualitative concept to quantitative data is mainly conducted with the forward cloud generator. The conversion from quantitative data to qualitative concepts is mainly realized using the reverse cloud generator. In this study, the forward cloud generator was used to calculate the membership degree of each indicator. By using the entropy weighting method to determine the weights of the indicators, an evaluation model of the flood disaster risk level in Sichuan Province was established based on the normal cloud model. The steps were as follows:
(1)
Set the factor area and comment area of the evaluation object
Take the data in the flood risk assessment indicator system and set the factor domain of the evaluation object U = {u1, u2, ..., un}; classify the flood risk level into five levels from low risk to high risk and set the comment domain V = {v1, v2, ..., vm}.
(2)
Calculate expectation, entropy, and super entropy
Single-factor evaluation is performed between the factor domain U and the comment domain V of the evaluation object, and the fuzzy relation matrix R is constructed. The element Rij in R represents the membership degree of the i-th factor (represented by ui) in the factor domain U, which corresponds to the j-th level (represented by vj) in the comment domain V. The membership degree of the evaluation factors is calculated using the normal cloud model. Let the upper and lower boundary values of the level j (j = 1, 2, ... m) corresponding to the factor i (I = 1, 2, ... n) be   x 1 ij , x 2 ij ; then, the qualitative concept of the rank j corresponding to the factor i can be expressed with the normal cloud model, which is used to find the expectation (Exij), entropy (Enij), and super entropy (Heij) in the flood disaster risk level evaluation model, respectively, where
Ex ij =   x   ¯ = 1 n i = 1 n x ij En ij = π 2 * 1 n * i = 1 n x ij Ex ij He ij = 1 n 1 * i = 1 n x ij Ex ij 2 En ij 2
(3)
Calculate indicator membership degree
According to the indicator values in the flood disaster risk level evaluation model, the forward cloud generator is used to determine the cloud model membership matrix Z = (zij)n×m for the corresponding level of each indicator. The membership matrix derived from the cloud model is different from the membership matrix in traditional fuzzy mathematics and has randomness. Therefore, to improve the credibility of the assessment, it is necessary to repeat running the forward cloud generator N times to calculate the average composite assessment value in different membership cases:
z ij = 1 N k = 1 N z k ij
(4)
Using entropy weight method to determine the weights of indicators
① Indicator standardization
Construct the evaluation matrix with m evaluation objects and n evaluation indicators, where rij indicates the value of the j-th (j = 1, 2, n) evaluation indicator of the i-th (i = 1, 2, m) evaluation object, so as to construct the normalization matrix (rij) m×n.
Positive indicator calculation formula:
r ij = x i min x 1 ,   x 2 , ,   x n max x 1 ,   x 2 , ,   x n min x 1 ,   x 2 , ,   x n
Inverse indicator calculation formula:
r ij = max x 1 ,   x 2 , ,   x n x i max x 1 ,   x 2 , ,   x n min x 1 ,   x 2 , ,   x n
In the formula, rij is the standardized value of the indicator data; xi is the actual data value.
② Calculate the entropy value of each indicator
Set the entropy value of the j-th indicator as Hj, and the calculation method of Hj is as follows:
H j = 1 lnm i = 1 m f ij lnf ij f ij = 1 + r ij i = 1 m r ij
③ Calculate the entropy weight of the j-th assessment indicator
w j = 1 H i j = 1 n 1 H i
In the formula, Wj is the weight set of each assessment indicator; n is the number of evaluation indicators.
(5)
Calculate fuzzy subsets
The fuzzy subset B of the evaluation set V is obtained with fuzzy transformation between the weight set W and the membership matrix Z; that is, according to the weight set of the assessment indicator and the membership matrix of the five levels corresponding to each indicator, the membership degree of the assessment indicator factor domain to the risk level comment domain is obtained:
B = W Z = b 1 , b 1 , b m
b j = i = 1 n w i z ij j = 1 , 2 , m denotes the membership degree of the object to be evaluated to the j-th comment; m is the number of the comment domain V; i is the i-th factor in the factor domain U; and j is the j-th comment in the comment domain.

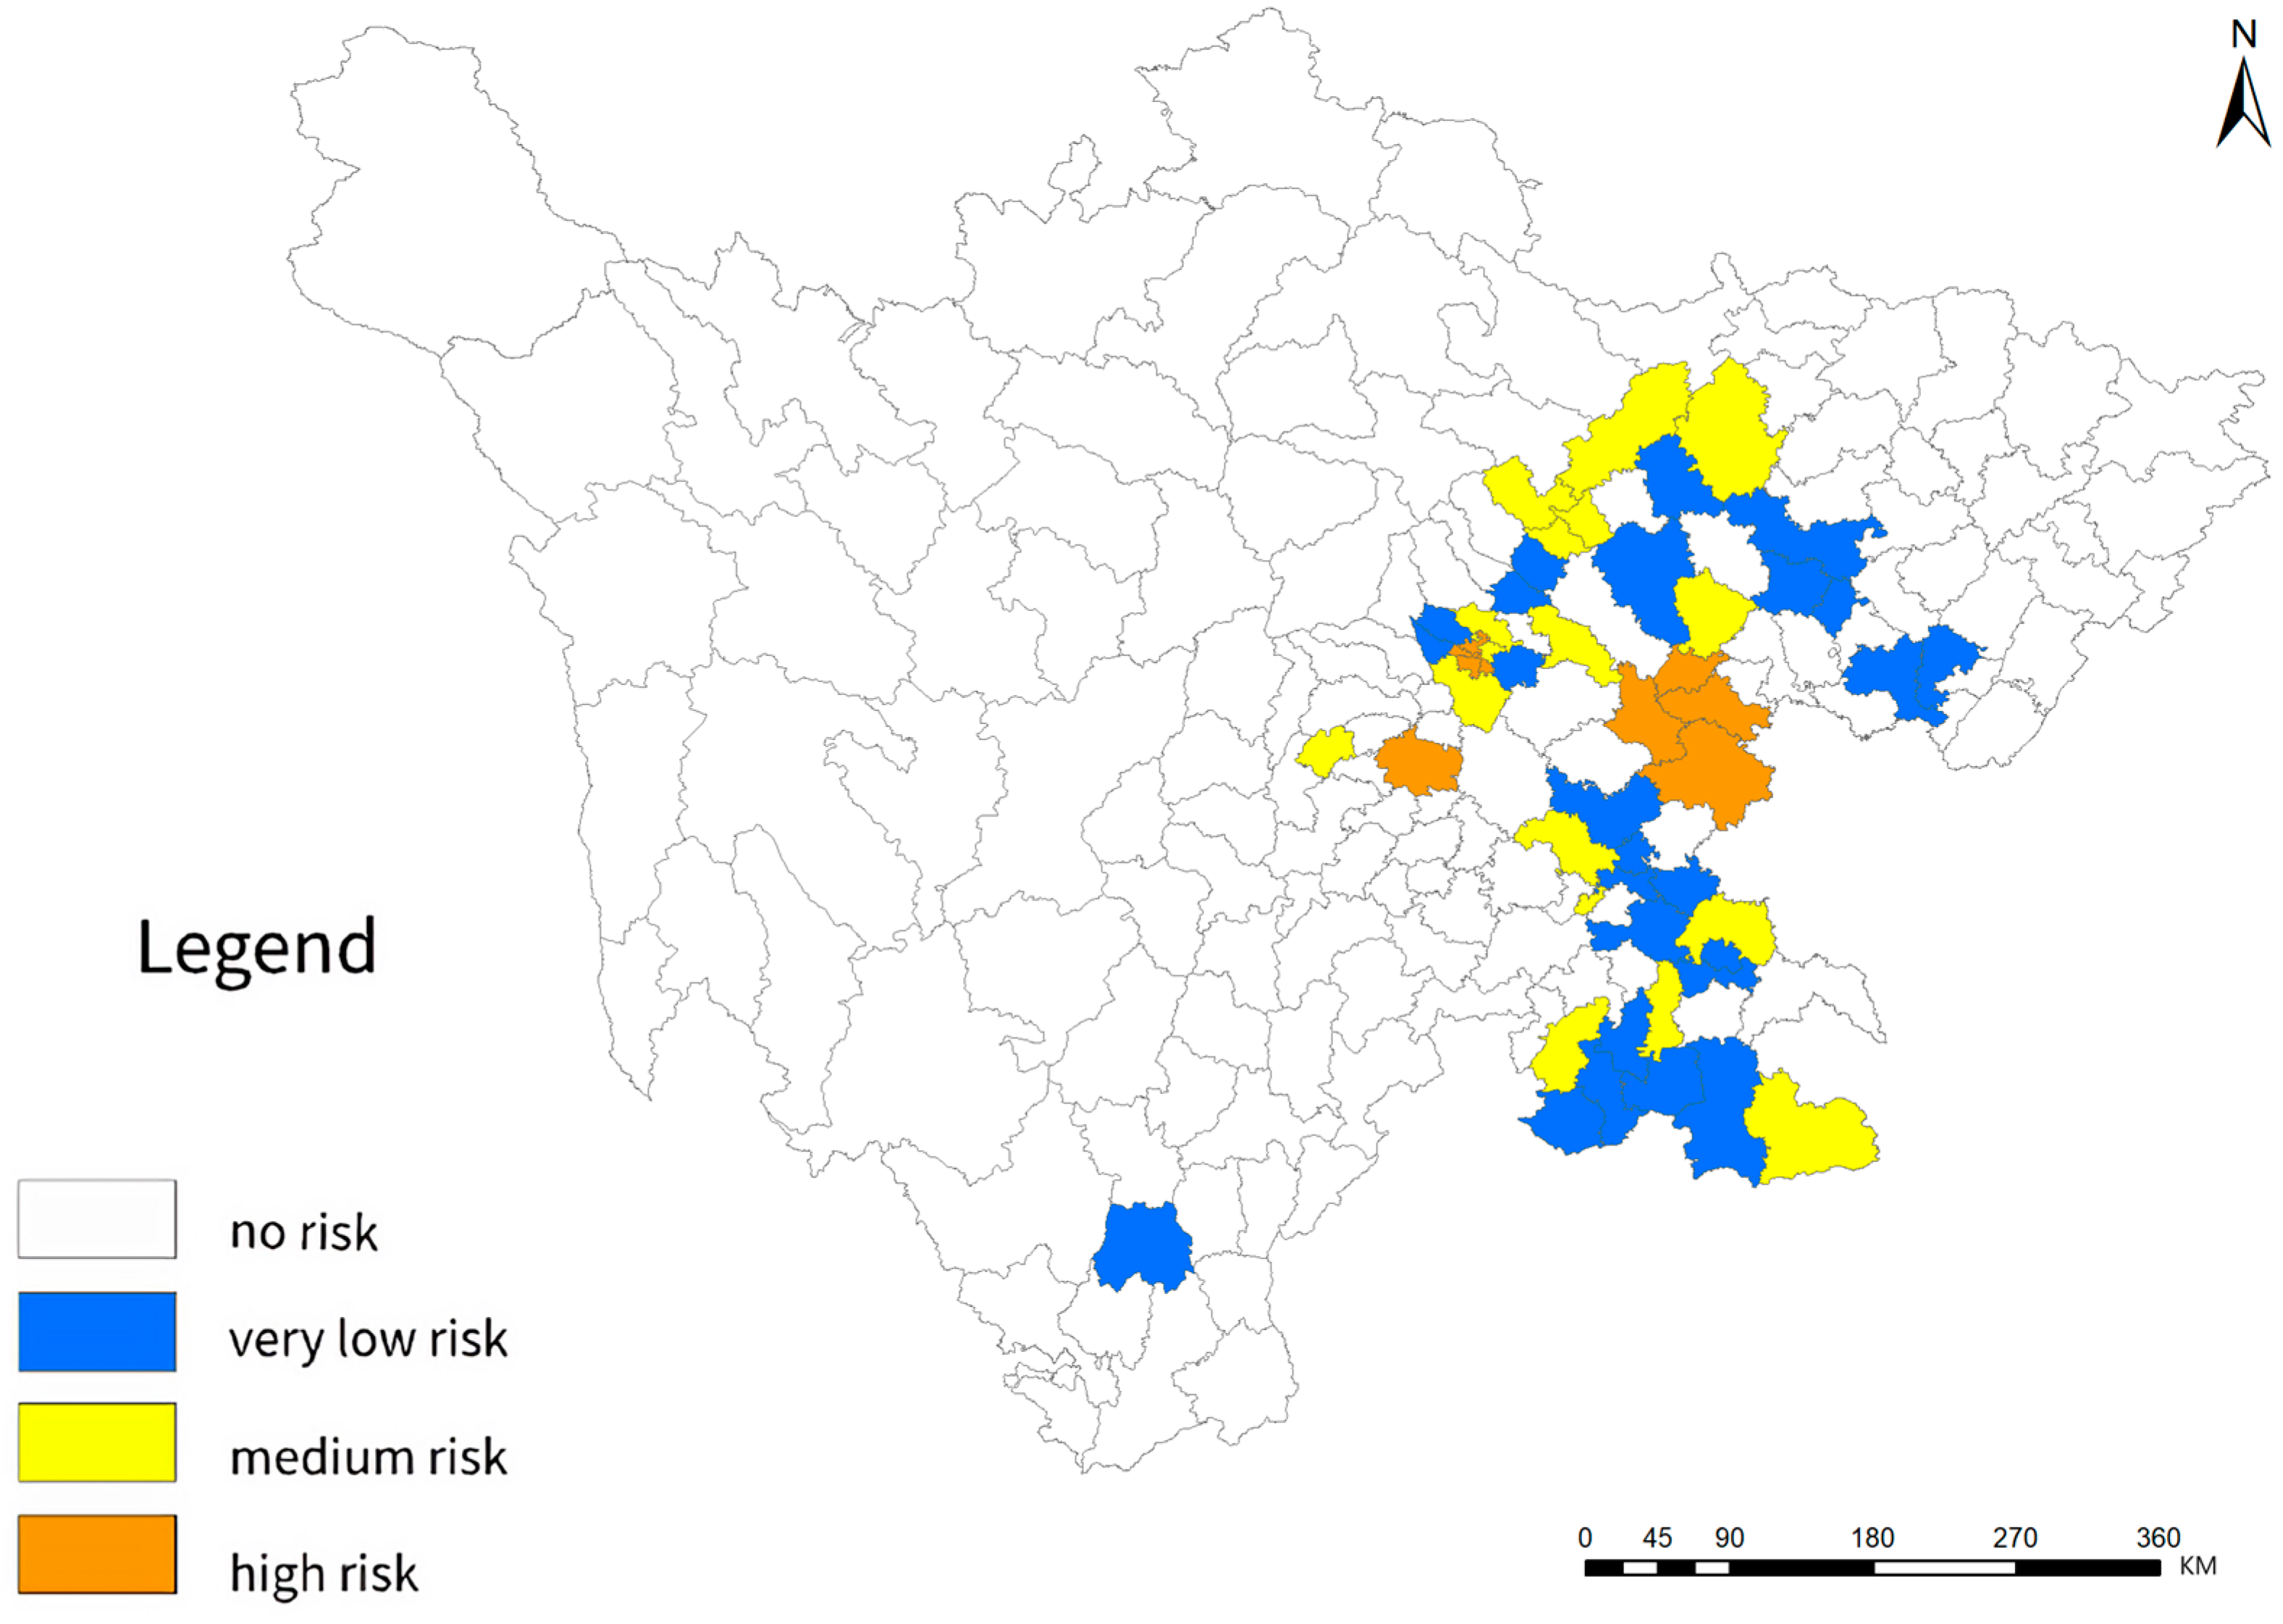
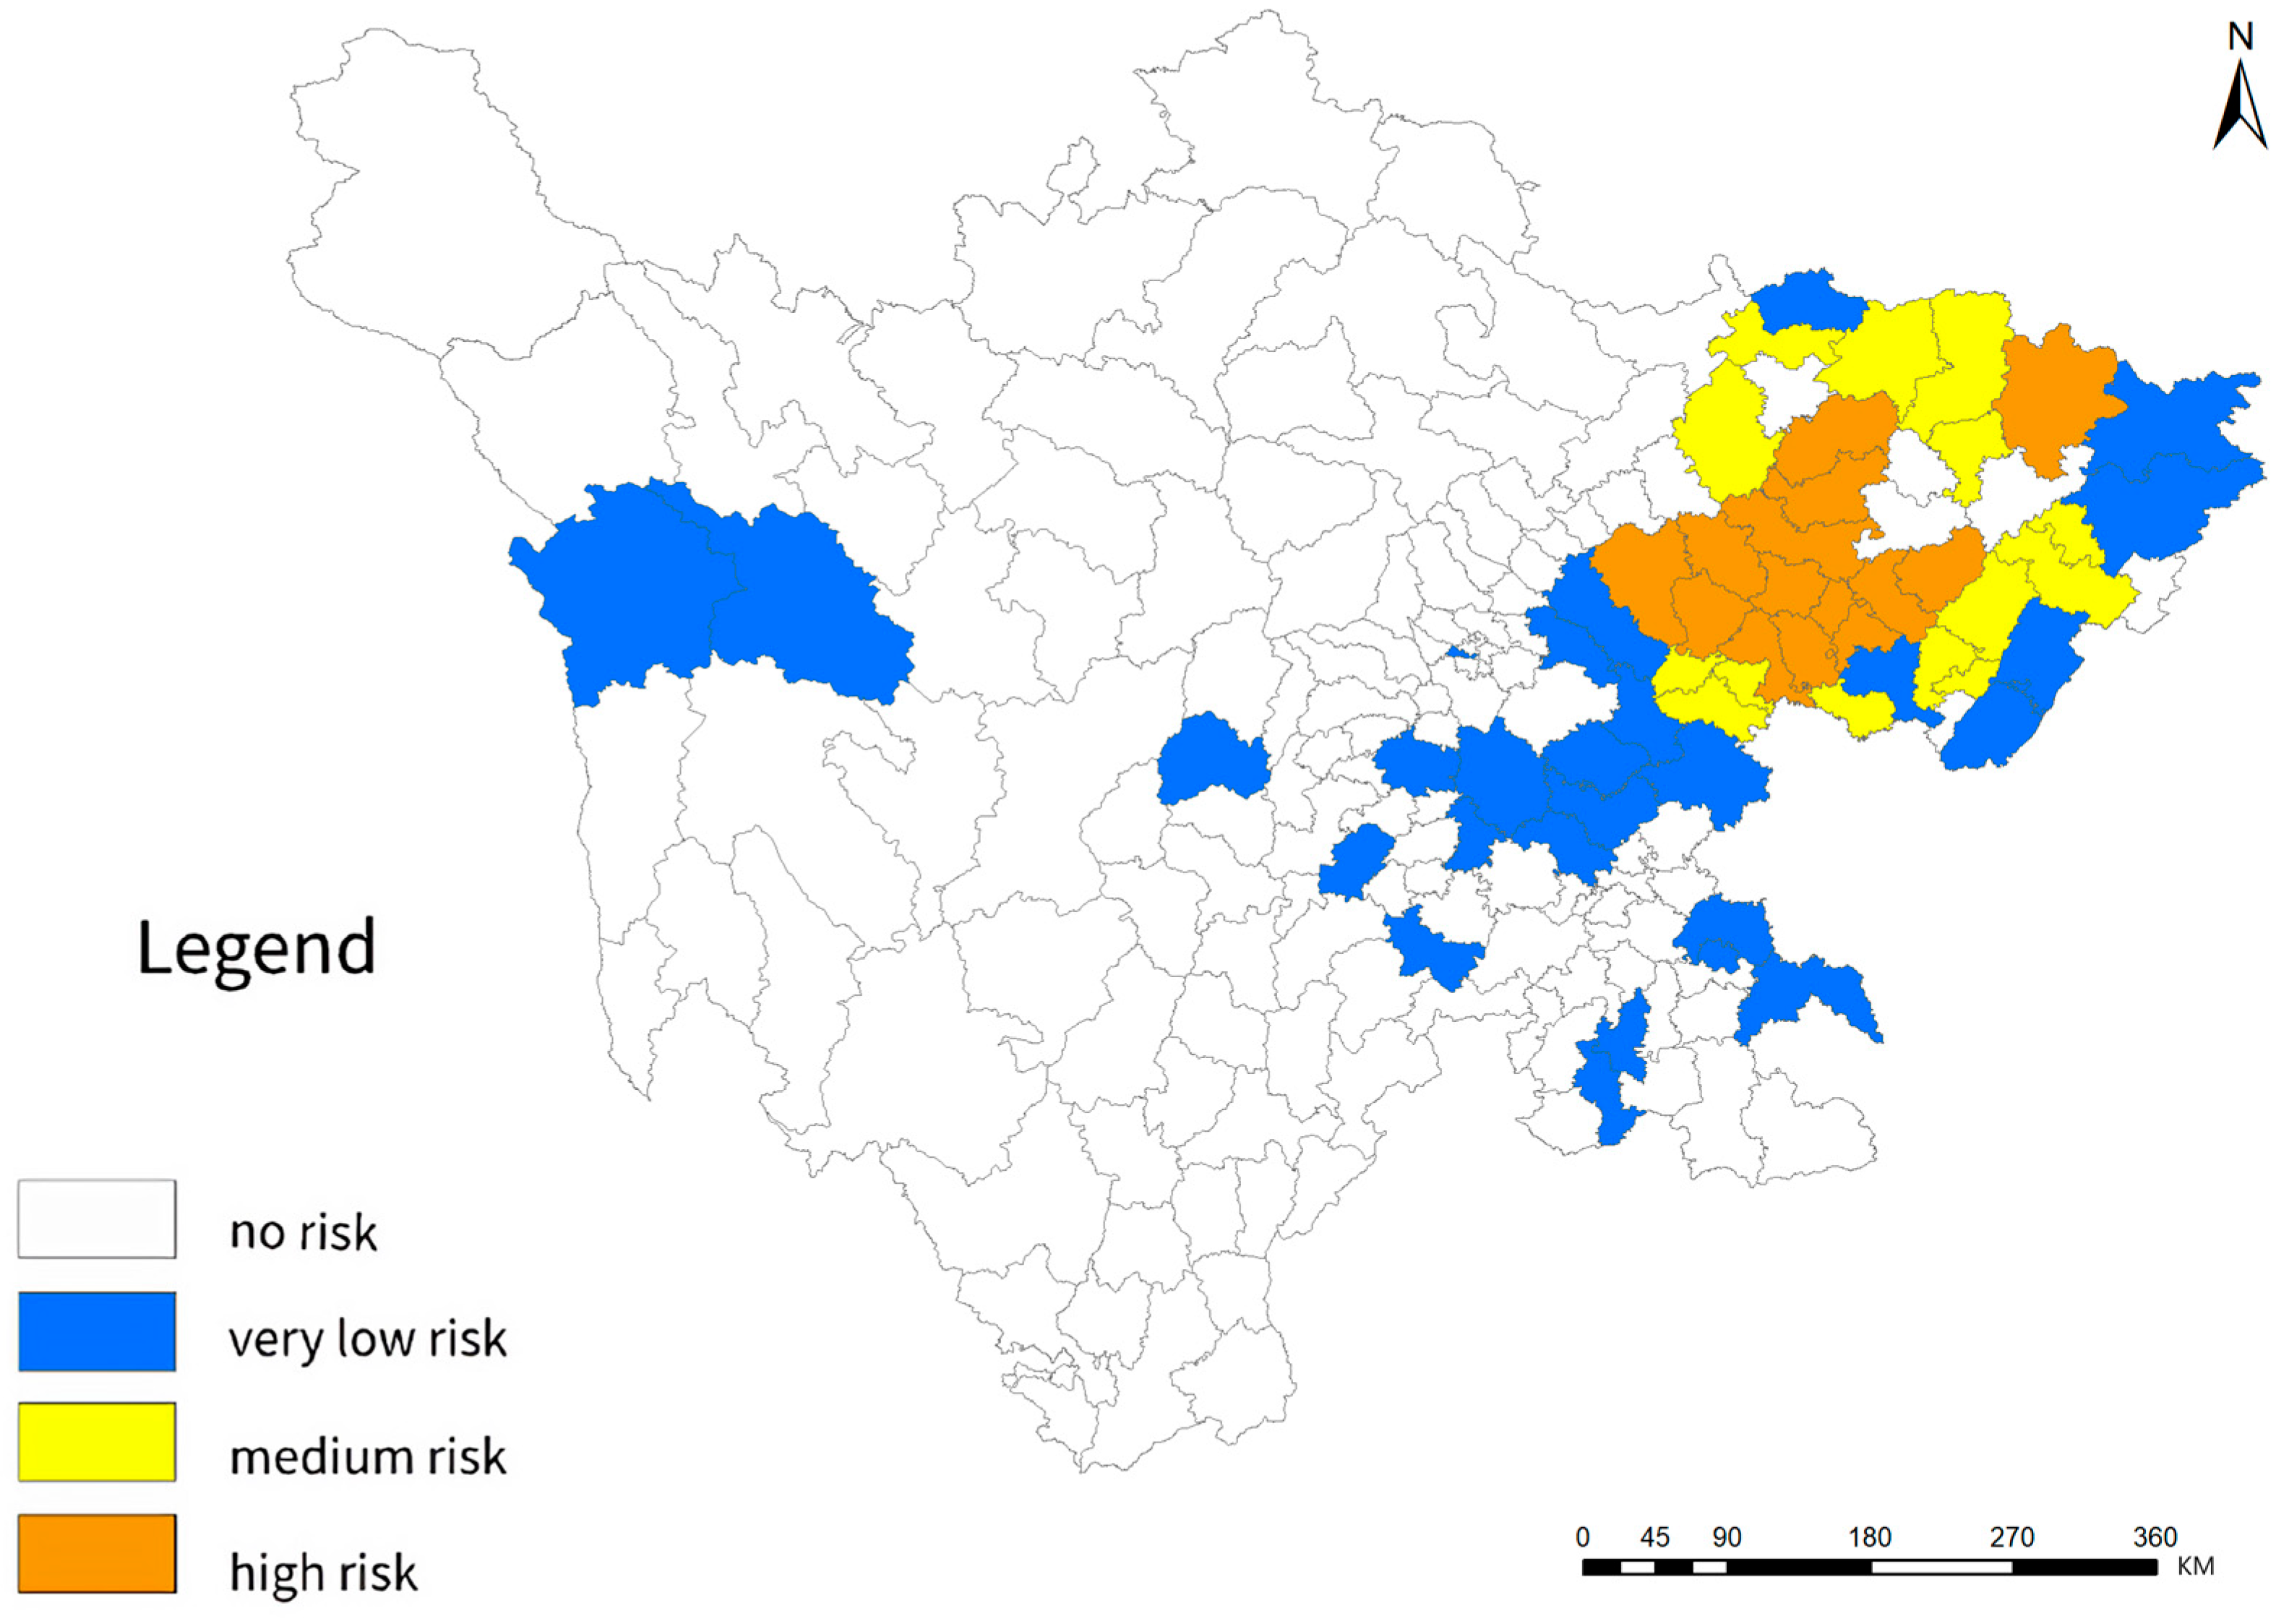
4. Case Studies and Results

July 27 was the date with the highest rainfall in July–August 2023 in Sichuan Province. Therefore, in this section, 27 July 2023, is used as an example to demonstrate the risk assessment process.
The indicators were processed according to the calculation method in Table 1, and the values of flood risk level evaluation indicators were obtained for 183 districts and counties in Sichuan Province. Based on the values of the risk assessment indicators, the natural breakpoint method was applied to grade the indicators and establish the factor domain U (assessment indicator) of the evaluation object. The risk level of flood disaster in Sichuan Province was divided into five levels: high risk, higher risk, medium risk, lower risk, and low risk, and the comment domain V (assessment level) was constructed, as shown in Table 2.
Based on the values of the indicators in each district and county, the expected value (Ex), entropy value (En), and super-entropy value (He) of the cloud model were calculated according to Formula (1) combined with Table 2, as shown in Table 3.
Taking the U3, U5, U10, and U13 indicators as examples, the normal cloud membership functions corresponding to different levels of each were obtained by repeating the calculation 1000 times using the normal cloud generator, as shown in Figure 3. The normal distribution characteristics of the indicators are obvious, which verifies that applying the cloud model to evaluate the flood disaster risk level can achieve uncertainty mapping from the quantitative value of each indicator to the qualitative assessment level.
We calculated the flood disaster risk membership of each district and county in Sichuan Province on 27 July 2023, and taking Jiange County as an example, the membership for each indicator is shown in Table 4.
According to Formula (5), the entropy value of each indicator was calculated, and according to Formula (6), the entropy weight of each indicator was then calculated. The results are shown in Table 5.
According to Formula (7), based on the principle of maximum membership, the rank corresponding to the maximum membership was selected as the comprehensive assessment result of the evaluated object, and the comprehensive risk rank of the 27 July 2023 flood disaster in Sichuan Province was generated. The results of districts and counties at risk are shown in Figure 4.
Based on the calculation process above, the flood risk level assessment was then performed for two heavy rainfalls events on 12 August and 25 August 2023, and the results are shown in Figure 5 and Figure 6.

5. Discussion

5.1. Analysis of the Results

Let us take the results of the flood risk assessment of the July 27th rainfall in Sichuan Province as an example. The high-risk regions all reached the heavy rain level. Among them, Jinjiang District, Qingyang District, Jinniu District, and Wuhou District of Chengdu City—because of their flat terrain, high populations, and GDP density—were found to be easily at risk of flood disasters resulting from heavy rain. Meanwhile, in Anju District of Suining City, Da Ying County, and in Dongpo District of Meishan City, Da Ying County and Anyue County, we found that flood disasters could easily arise due to heavy rain due to the flat terrain and the large numbers of villages and towns along the riverbanks paired with weak rescue forces (although the population and GDP indicators did not reach the high-risk level). The areas evaluated as medium risk generally had moderate rainfall. Xindu District of Chengdu Municipality, Jintang County, Shuangliu County, Ziliujing District, Lu County, and Luojiang County were evaluated as medium risk due to their flat terrain, high river network densities, and high population densities. Jiangyou City, Jiange County, Shehong County, Weiyuan County, Jiang’an County, and Gao County were evaluated as medium risk due to the numbers of villages and towns along the riverbanks and the presence of hazardous chemical enterprises. An County and Gulin County were evaluated as medium risk due to the high numbers of flash flood hazard zones in the jurisdictions, which reached the high risk level. Among the areas evaluated as being at no risk, Funashan District of Suining City, Shizhong District of Leshan City, Wutongqiao District of Leshan City, Jingyan County, Jiejiang County, Emeishan City, Pengshan District, and Qingshen County were evaluated as having no risk because the exposure indicators for the disaster-bearing bodies were at the no-risk level or lower, although the areas received torrential rain. The flood risk assessment results are consistent with the scope of the yellow warning of flooding (22nd in 2023) issued by the Sichuan Provincial Water Resources Department [33], though the assessment results from this study are more detailed, with the county level as the calculation unit. Furthermore, based on the same calculation process, the flood risk level assessment results for the two heavy days of rainfall on 12 August and 25 August 2023, are also consistent with the scope of the yellow warnings for flooding (31st and 38th in 2023) [34,35]. Finally, the results of the risk assessments are consistent with the reported disaster, indicating that the flood risk is within predictable limits and justifying the choice of indicators.

5.2. Advantages and Limitations

Indicators are the independent variables of flood risk assessment. Each risk factor in the risk indicator system has its own status and importance, and their contributions to the final assessment results are different. In view of the complexity, uncertainty, and dynamics of floods, this study systematically and comprehensively analyzed and identified the indicators affecting flood risk, and we constructed a flood risk assessment indicator system for Sichuan Province at the county level, including four categories and 14 indicators. In terms of the exposure of disaster-bearing bodies, two traditional indicators, population density (U8) and GDP density (U9), were retained, with weights of 0.0576 and 0.0467, respectively. In order to further consider the impact of floods on people, the number of villages and towns along the river (U10) and the number of villages and towns affected by flash floods (U11) were two newly added indicators, with weights of 0.0822 and 0.0793, respectively, which were higher than the weights of population density and GDP density. The addition of these two indicators improved the reliability of the model. When conducting a flood risk assessment, precipitation is the one indicator that directly reflects the intensity of rainfall among all the indicators, and only the precipitation indicator is time sensitive. This indicator has been subject to change, while the other indicators have been relatively unchanged. The purpose of this study was to obtain the daily real-time flood risk of Sichuan Province at the county level. In terms of disaster-causing factors, four indicators of precipitation were constructed—namely, precipitation for the previous 1 hour (U1), 12 h (U2), 24 h (U3), and 5 days (U4)—and the combined weight of precipitation reached 0.4086. By adding these indicators, the weight of precipitation was increased, and the timeliness and reliability of the flood risk assessment results were strengthened. Compared with similar studies [10,18,30], the indicator system constructed in this study was more complete, reliable, and timely.
Usually, risk assessment adopts a hierarchical analysis method, which decomposes each major risk factor layer by layer, constructs a multilevel indicator factor system, and then makes a comprehensive assessment of the degree of flood risk based on a fuzzy comprehensive evaluation model. Although this process fully accounts for uncertainty, it ignores the randomness and discrete nature of the risk. Cloud modeling provides a new way of thinking about flood disaster risk assessment. The application of the cloud model membership function helps to determine the degree of membership of the flood risk, thus minimizing the uncertainty in the assessment process. The results of the comprehensive risk assessment are presented in the form of a cloud model, including three numerical features—namely, expectation, entropy, and hyper-entropy—and this method integrates the central value, ambiguity, and randomness of the assessment results, which improves the robustness of the risk assessment. In this study, the entropy weight method was used to determine the weights of the indicators. The entropy weight method determines the objective weights according to the degree of change in each indicator, which helps solve the problem that the assessment factors are easily affected by experts’ personal experience and subjective factors. The cloud model is used to calculate the flood risk affiliation degree of each county and district, and based on the principle of the maximum affiliation degree, we derive the flood disaster risk level of each region. Furthermore, the cloud model can describe the uncertainty of the formation mechanism of the flood disaster, and it overcomes the problem of the general method not being able to clearly define the evaluation level. Combined with the GIS spatial analysis and mapping function, the data can be refined and expressed.
Nonetheless, although the method used in this paper can comprehensively and accurately predict flood risk, a low spatial and temporal resolution of data and a lack of data pose great difficulties in this research area. For example, a lack of hydrological river station data, or infrastructural data such as those concerning buildings and roads increases the uncertainty of flood risk assessment. The objective of the follow-up work is to further refine the regional risk and thus identify high-risk zones via simulation and extrapolation of the inundation process under different scenarios, as well as propose countermeasures. In future studies, the kilometer-scale grid will be used as the computational unit instead of county-level administrative divisions, and remote sensing data such as land cover and evapotranspiration data will be added to disaster-related environmental indicators to improve the accuracy of the assessment.

6. Conclusions and Future Work

This study systematically introduces the basic theories and methods of flood risk assessment and carries out quantitative flood risk assessment with Sichuan Province as the study area. The major contributions of this study are as follows:
(1)
We comprehensively considered the causes of disaster losses and the formation mechanisms of floods; we analyzed the disaster-causing factors, disaster-conceiving environments, disaster-bearing bodies, and the regional disaster response capacity; and we established a flood risk level assessment indicator system. A more complete, reliable and timely indicator system was constructed by increasing the indicators of human impact indicators and increasing the weight of rainfall indicators, which could realize the real-time risk assessment of daily flooding.
(2)
A comprehensive assessment model based on cloud modeling, entropy value, and GIS technology was constructed. The entropy weighting method could objectively evaluate the weights of the indicators, and the cloud model could realize the uncertainty mapping from the quantitative value of each indicator to the qualitative assessment level, which could be used to quantitatively predict and assess the risk of continuous flooding.
The results showed that the distribution of the disaster situation was largely consistent with the results of the flood disaster risk assessment in this study, which verified the rationality of the selected indicators and the accuracy of the results. By using the model in this paper, the daily real-time flood risk of Sichuan Province at the county level can be calculated, and the corresponding risk level map can be output to the disaster prevention and mitigation departments. Based on the evaluation results, decision makers can propose medium- and high-risk areas in which to strengthen engineering and non-engineering measures to prevent flooding.
In our future work, we will continue our research in the following areas:
(1)
Since remote sensing data products can provide input parameters for distributed hydrologic models, future studies will use the kilometer-scale grid as the unit of calculation instead of county-level administrative divisions, and remote sensing data products such as land cover and evapotranspiration data will be added to disaster-conceiving environmental indicators to further improve the accuracy of the assessment.
(2)
We will further identify high-risk areas and propose countermeasures by simulating and extrapolating the flood inundation process under different scenarios.
(3)
Since there are some emerging spatiotemporal models, such as machine learning models and social media data—such as Twitter data—which are used in other applications (e.g., land use suitability analysis, post-earthquake building usability assessment, estimation of local-scale domestic electricity energy consumption) [36,37,38], we will try to apply these emerging models to flood risk assessment in the future.

Author Contributions

This study was completed through collaboration among all authors. Conceptualization and methodology, J.L. and X.F.; data curation, J.L. and K.W.; formal analysis, K.W. and S.L.; visualization, J.L., K.W. and H.H.; writing for the original draft, J.L.; writing for review and editing, J.L. and H.H. All authors have read and agreed to the published version of the manuscript.

Funding

This research is sponsored by National Key R&D Program of China (No. 2022YFC3800704).

Institutional Review Board Statement

Not applicable.

Informed Consent Statement

Informed consent was obtained from all subjects involved in the study.

Data Availability Statement

The data presented in this study are available in the article.

Acknowledgments

We thank the Department of Emergency Management of Sichuan Province for its support with this research.

Conflicts of Interest

The authors declare no conflict of interest.

References

  1. UN Department of Humanitarian Affairs. Internationally Agreed Glossary of Basic Terms Related to Disaster Management. Available online: https://reliefweb.int/report/world/internationally-agreed-glossary-basic-terms-related-disaster-management (accessed on 26 August 2023).
  2. IPCC. Climate Change 2014: Impacts, Adaptation, and Vulnerability. Part A: Global and Sectoral Aspects; Contribution of Working Group II to the Fifth Assessment Report of the Intergovernmental Panel on Climate Change; Cambridge University Press: Cambridge, UK; New York, NY, USA, 2014. [Google Scholar]
  3. de León, J.C.V.; Bogardi, J.; Dannenmann, S.; Basher, R. Early warning systems in the context of disaster risk management. Entwickl. Ländlichen Raums 2006, 2, 23–25. [Google Scholar]
  4. Crichton, D.; Mounsey, C. How the Insurance Industry will use its flood research. In Proceedings of the Third MAFF Conference of Coastal and River Engineers, Keele, UK, 2–4 July 1997; pp. 131–134. [Google Scholar]
  5. United Nations Office for Disaster Risk Reduction (UNDRR). Disaster risk Assessment. Available online: https://www.undrr.org/terminology/disaster-risk-assessment (accessed on 26 August 2023).
  6. Department of Emergency Management of Sichuan Province. Sichuan Emergency Management Department Releases Basic Situation of Natural Disasters in the Province in 2022. Available online: https://yjt.sc.gov.cn/scyjt/juecegongkai/2023/2/7/3b72e16f55a040a48dd32c9fc30957f1.shtml (accessed on 26 August 2023).
  7. Department of Emergency Management of Sichuan Province. Sichuan Emergency Management Department Releases Basic Situation of Natural Disasters in the Province in 2021. Available online: https://yjt.sc.gov.cn/scyjt/juecegongkai/2022/3/3/6d03f936612249958b95bdb0671cfd6e.shtml (accessed on 26 August 2023).
  8. Li, C.; Sun, N.; Lu, Y.; Guo, B.; Wang, Y.; Sun, X.; Yao, Y. Review on Urban Flood Risk Assessment. Sustainability 2023, 15, 765. [Google Scholar] [CrossRef]
  9. Wang, G.; Liu, Y.; Hu, Z.; Lyu, Y.; Zhang, G.; Liu, J.; Liu, Y.; Gu, Y.; Huang, X.; Zheng, H.; et al. Flood risk assessment based on fuzzy synthetic evaluation method in the Beijing-Tianjin-Hebei metropolitan area, China. Sustainability 2020, 12, 1451. [Google Scholar] [CrossRef]
  10. Zou, Q.; Liao, L.; Qin, H. Fast Comprehensive Flood Risk Assessment Based on Game Theory and Cloud Model Under Parallel Computation (P-GT-CM). Water Resour. Manag. 2020, 34, 1625–1648. [Google Scholar] [CrossRef]
  11. Maranzoni, A.; D’Oria, M.; Rizzo, C. Quantitative flood hazard assessment methods: A review. J. Flood Risk Manag. 2023, 16, e12855. [Google Scholar] [CrossRef]
  12. Quang, M.P.; Tallam, K. Predicting Flood Hazards in the Vietnam Central Region: An Artificial Neural Network Approach. Sustainability 2022, 14, 11861. [Google Scholar] [CrossRef]
  13. Kaur, M.; Kaur, P.D.; Sood, S.K. ANFIS-based flood detection and vulnerability assessment framework. Hydrol. Sci. J. 2022, 67, 2310–2326. [Google Scholar] [CrossRef]
  14. Wang, X.; Yu, X.; Yu, X. Flood Disaster Risk Assessment Based on DEA Model in Southeast Asia along “The Belt and Road”. Sustainability 2022, 14, 13145. [Google Scholar] [CrossRef]
  15. Cai, T.; Li, X.; Ding, X.; Wang, J.; Zhan, J. Flood risk assessment based on hydrodynamic model and fuzzy comprehensive evaluation with GIS technique. Int. J. Disaster Risk Reduct. 2019, 35, 101077. [Google Scholar] [CrossRef]
  16. Peleg, N.; Ban, N.; Gibson, M.J.; Chen, A.S.; Paschalis, A.; Burlando, P.; Leitão, J.P. Mapping storm spatial profiles for flood impact assessments. Adv. Water Resour. 2022, 166, 104258. [Google Scholar] [CrossRef]
  17. Karymbalis, E.; Andreou, M.; Batzakis, D.-V.; Tsanakas, K.; Karalis, S. Integration of GIS-Based Multicriteria Decision Analysis and Analytic Hierarchy Process for Flood-Hazard Assessment in the Megalo Rema River Catchment (East Attica, Greece). Sustainability 2021, 13, 10232. [Google Scholar] [CrossRef]
  18. Fu, L.; Ding, M.; Zhang, Q. Flood risk assessment of urban cultural heritage based on PSR conceptual model with game theory and cloud model–A case study of Nanjing. J. Cult. Herit. 2022, 58, 1–11. [Google Scholar] [CrossRef]
  19. Guo, W.S.; Wang, Q.; Liu, H.Y.; Liang, F.W.; Zhang, X.Y.; Liu, H. Virtual power plant operation based on entropy-weight-improved cloud risk assessment model. Pol. J. Environ. Stud. 2023, 32, 3125–3144. [Google Scholar] [CrossRef] [PubMed]
  20. Ying, X.; Ni, T.; Lu, M.; Li, Z.; Lu, Y.; Bamisile, O.; Pelling, M. Sub-catchment-based urban flood risk assessment with a multi-index fuzzy evaluation approach: A case study of Jinjiang district, China. Geomat. Nat. Hazards Risk 2023, 14, 2182173. [Google Scholar] [CrossRef]
  21. Li, D.; Haijun, M.; Xuemei, S. Membership clouds and membership cloud generators. J. Comput. Res. Dev. 1995, 32, 15–20. [Google Scholar]
  22. Li, D.; Du, Y. Artificial Intelligence with Uncertainty; CRC Press: Boca Raton, FL, USA, 2017. [Google Scholar]
  23. Bai, X.; Wang, Y.; Jin, J.; Qi, X.; Wu, C. Precondition Cloud and Maximum Entropy Principle Coupling Model-Based Approach for the Comprehensive Assessment of Drought Risk. Sustainability 2018, 10, 3236. [Google Scholar] [CrossRef]
  24. Cheng, K.; Fu, Q.; Meng, J.; Li, T.X.; Pei, W. Analysis of the Spatial Variation and Identification of Factors Affecting the Water Resources Carrying Capacity Based on the Cloud Model. Water Resour. Manag. 2018, 32, 2767–2781. [Google Scholar] [CrossRef]
  25. Huang, X.; Li, W.; Chen, Y.; Fang, G.; Yan, W. Risk assessment of floodwater resources utilization in water transfer projects based on an improved cloud model. Water Supply 2019, 19, 2517–2532. [Google Scholar] [CrossRef]
  26. Zhang, Y.; Xue, W.; Wen, Y.; Wang, X. Sustainability Assessment of Water Resources Use in 31 Provinces in China: A Combination Method of Entropy Weight and Cloud Model. Int. J. Environ. Res. Public Health 2022, 19, 12870. [Google Scholar] [CrossRef]
  27. Niu, Q.; Yuan, Q.; Wang, Y.; Hu, Y. Fire Risk Assessment of Urban Utility Tunnels Based on Improved Cloud Model and Evidence Theory. Appl. Sci. 2023, 13, 2204. [Google Scholar] [CrossRef]
  28. Liu, D.; Wang, D.; Wu, J.; Wang, Y.; Wang, L.; Zou, X.; Chen, Y.; Chen, X. A risk assessment method based on RBF artificial neural network–Cloud model for urban water hazard. J. Intell. Fuzzy Syst. 2014, 27, 2409–2416. [Google Scholar] [CrossRef]
  29. Li, S.; Wang, Z.; Lai, C.; Lin, G. Quantitative assessment of the relative impacts of climate change and human activity on flood susceptibility based on a cloud model. J. Hydrol. 2020, 588, 125051. [Google Scholar] [CrossRef]
  30. Wu, Z.; Cui, Y.; Guo, Y. A Case Study of Flood Risk Evaluation Based on Emergy Theory and Cloud Model in Anyang Region, China. Water 2021, 13, 420. [Google Scholar] [CrossRef]
  31. Jiang, Y.L.; Cui, J.; Zhang, Y.L. Risk assessment model of karst tunnel flood based on distance discriminant weighting and set pair cloud. KSCE J. Civ. Eng. 2023, 27, 3219–3229. [Google Scholar] [CrossRef]
  32. Sichuan Provincial Bureau Statistics. Statistical Bulletin on National Economic and Social Development of Sichuan Province. 2022. Available online: http://tjj.sc.gov.cn/scstjj/c111701/2023/3/22/fe161b0109d64d588d62f3e0947b389d.shtml# (accessed on 26 August 2023).
  33. Sichuan Provincial Water Resources Department. Sichuan Province Issues Yellow Alert for Flash Floods (22nd of 2023). Available online: http://slt.sc.gov.cn/scsslt/ssyw/2023/7/27/44c80904ed524250aa4a4057a5074f11.shtml (accessed on 26 August 2023).
  34. Sichuan Provincial Water Resources Department. Sichuan Province Issues Yellow Alert for Flash Floods (31th of 2023). Available online: http://slt.sc.gov.cn/scsslt/ssyw/2023/8/11/ef10061f7da0464b98d667c6828bc950.shtml (accessed on 26 August 2023).
  35. Sichuan Provincial Water Resources Department. Sichuan Province Issues Yellow Alert for Flash Floods (38th of 2023). Available online: http://slt.sc.gov.cn/scsslt/ssyw/2023/8/25/a015cfd3956042ae86310b22e9fdd88b.shtml (accessed on 26 August 2023).
  36. Sotiropoulou, K.F.; Vavatsikos, A.P. A decision-making framework for spatial multicriteria suitability analysis using PROMETHEE II and k nearest neighbor machine learning models. J. Geovis. Spat. Anal. 2023, 7, 20. [Google Scholar] [CrossRef]
  37. Tocchi, G.; Misra, S.; Padgett, J.E.; Polese, M.; Di Ludovico, M. The use of machine-learning methods for post-earthquake building usability assessment: A predictive model for seismic-risk impact analyses. Int. J. Disast. Risk. Re. 2023, 97, 104033. [Google Scholar] [CrossRef]
  38. Sun, Y.; Wang, S.; Zhang, X.; Chan, T.O.; Wu, W. Estimating local-scale domestic electricity energy consumption using demographic, nighttime light imagery and Twitter data. Energy 2021, 226, 120351. [Google Scholar] [CrossRef]
Figure 1. Geographical location of the study area.
Sustainability 15 14714 g001
Figure 2. Distribution of the values of the indicators. (ad) U1–U4, precipitation in the previous 1 h, 12 h, 24 h, and 5 days before 8 a.m. on 27 July 2023; (e) U5, standard deviation of the topography in Sichuan Province; (f) U6, density of the river network; (g) U7, number of flash flood hazard zones; (h,i) U8 and U9, population density and GDP density; (jl) U10, U11, and U12, number of villages and towns along the river, number of villages and towns in the flash flood hazard zones, and number of factories with hazardous chemicals; (m,n) U13 and U14, number of rescue teams and number of warehouses for materials.
Sustainability 15 14714 g002aSustainability 15 14714 g002bSustainability 15 14714 g002c
Figure 3. Normal cloud membership function for indicators: (a) U3; (b) U5; (c) U10; (d) U13.
Sustainability 15 14714 g003
Figure 4. Distribution of comprehensive risk levels for flooding in Sichuan Province on 27 July 2023.
Sustainability 15 14714 g004
Figure 5. Distribution of comprehensive risk levels for flooding in Sichuan Province on 12 August 2023.
Sustainability 15 14714 g005
Figure 6. Distribution of comprehensive risk levels for flooding in Sichuan Province on 25 August 2023.
Sustainability 15 14714 g006
Table 1. Indicator system and calculation methodology.
CategoryIndicatorCalculation MethodCorrelationSerial Number
disaster-causing factorsPrecipitation for the previous
1 h
Precipitation for the previous
1 h/area
positiveU1
Precipitation for the previous 12 hPrecipitation for the previous
12 h/area
positiveU2
Precipitation for the previous 24 hPrecipitation for the previous
24 h/area
positiveU3
Precipitation for the previous
5 days
Precipitation for the previous 5 dayspositiveU4
disaster-conceiving environmentStandard deviation of elevation i = 1 n x i x ¯ 2 n 1 negativeU5
River network densityTotal river length/area positiveU6
Number of flash flood hazard zonesNumber of flash flood hazard zonespositiveU7
disaster-bearing bodyPopulation densityTotal population volume/areapositiveU8
GDP densityTotal GDP volume/areapositiveU9
Number of villages and towns along the riverNumber of villages and towns along the riverpositiveU10
Number of villages and towns affected by flash floodsNumber of villages and towns 1 km from flash flood hazardous areapositiveU11
Number of hazardous chemical plantsNumber of hazardous chemical plantspositiveU12
regional disaster resilience capacityNumber of rescue teamsNumber of rescue teamsnegativeU13
Number of material warehousesNumber of material warehousesnegativeU14
Table 2. Sichuan Province flood risk assessment indicator standards.
IndicatorNo RiskVery Low RiskMedium RiskHigh RiskVery High Risk
U10.0000–0.13770.1377–0.56240.5624–1.22691.2269–1.89581.8958~
U20.2154~6.63986.6398~15.924715.9247~27.162227.1622~40.629340.6293~
U30.2502~8.95468.9546~18.603818.6038~32.215632.2156~47.252947.2529~
U40.0000–671.5647671.5647–1675.81501675.8150–2987.68752987.6875–5022.21325022.2132~
U51159.2606–730.1063730.1063–472.6649472.6649–252.1958252.1958–102.7656102.7656~
U60.3317–0.52850.5285–0.71120.7112–0.93850.9385–1.19881.1988~
U70.0000–79.000079.0000–162.0000162.0000–278.0000278.0000–434.0000434.0000~
U84.4817–295.3065295.3065–943.1672943.1672–2653.94342653.9434–8644.58708644.5870~
U93.7109–3718.84623718.8462–12,817.4112,817.4100–24,847.990024,847.9900–89,061.240089,061.2400~
U101.0000–17.000017.0000–34.000034.0000–54.000054.0000–78.000078.0000~
U110.0000–83.000083.0000–176.0000176.0000–299.0000299.0000–454.0000454.0000~
U123.0000–16.000016.0000–35.000035.0000–59.000059.0000–102.0000102.0000~
U13308.0000–219.0000219.0000–109.0000109.0000–53.000053.0000–20.000020.0000~
U1487.0000–51.000051.0000–30.000030.0000–18.000018.0000–7.00007.0000~
Table 3. Numerical characterization of normal cloud models for flood risk assessment indicators in Sichuan Province.
IndicatorNo RiskVery Low RiskMedium RiskHigh RiskVery High Risk
U1(0.0135, 0.0259, 0.0146)(0.2993, 0.1204, 0.0418)(0.8556, 0.1924, 0.0373)(1.6119, 0.2436, 0.0619)(2.5953, 0.4018, 0.1264)
U2(2.8692, 2.0870, 0.8268)(10.5962, 3.2085, 1.4153)(21.5811, 2.8964, 0.7160)(32.8361, 4.0261, 1.2196)(48.6857, 5.5945, 2.1812)
U3(5.0197, 2.2360, 0.1818)(13.2427, 3.0634, 1.0714)(25.1203, 3.8477, 1.1188)(39.4833, 4.014, 1.1764)(55.6064, 7.0220, 3.1144)
U4(288.1342, 218.1925,
87.7172)
(1134.1979, 308.0468,
105.3966)
(2268.6742, 390.7631,
97.8993)
(3889.4457, 521.0995, 110.7841)(6870.6748, 1459.5093,
308.6206)
U5(876.9410, 107.5732, 35.0412)(595.5089, 71.1196, 20.7734)(348.4263, 62.7807, 22.3094)(162.5734, 37.9990, 10.7352)(52.2913, 26.2900, 9.1390)
U6(0.4593, 0.0457, 0.0054)(0.6169, 0.0494, 0.0178)(0.8064, 0.0693, 0.0260)(1.0731, 0.0740, 0.0199)(1.4087, 0.1519, 0.0637)
U7(42.1333, 28.3342, 11.5988)(117.9437, 24.6416, 8.6041)(209.2391, 32.7899, 10.6769)(363.4000, 47.0494, 16.9884)(535.0000, 78.2068, 40.6830)
U8(91.3559,
87.3037,
13.0714)
(504.2265,
149.7726,
2.5215)
(1563.4293, 523.8549, 182.7838)(5649.2651, 3754.0792, 2262.9975)(11,791.2108, 1883.9385,
210.9787)
U9(908.1125, 931.3529,
173.3850)
(7389.8493, 2788.6865, 1013.7188)(18,437.3508, 4325.8637, 1245.1571)(63,303.1645, 24,098.2071, 4986.6123)(124,642.8009, 29,729.9139, 15,463.0437)
U10(9.4828, 5.2100, 2.1490)(25.3600, 5.0494, 1.657)(42.5424, 6.1488, 2.6745)(65.2581, 7.3086, 2.3688)(92.4500, 9.6881, 7.4691)
U11(44.2264, 28.8552, 9.0176)(126.9306, 27.9733, 11.3466)(224.4222, 35.3230, 13.6335)(375.9231, 48.8718, 12.6156)(551.7500, 91.8053, 52.3261)
U12(8.1379, 3.6601, 1.1751)(24.8033, 5.7240, 1.3607)(45.7500, 6.5437, 1.8960)(71.8889, 12.7807, 3.2357)(391.0000, 362.2078, 218.3426)
U13(263.5000, 55.7725, 33.6202)(163.6667, 46.2334, 10.9834)(76.8889, 12.7033, 5.8454)(31.7447, 9.3252, 1.6515)(9.2966, 6.0090, 2.2095)
U14(69.0000, 22.5597, 13.5992)(37.8889, 5.6941, 1.7348)(22.56, 3.8943, 1.4280)(13.2500, 3.2551, 0.8612)(2.0252, 1.4591, 0.5312)
Table 4. Sichuan Province flood risk assessment membership for each indicator, taking Jiange County as an example.
IndicatorNo RiskVery Low RiskMedium RiskHigh RiskVery High Risk
U10.0000 0.4136 0.1220 0.0006 0.0003
U20.0000 0.0000 0.0006 0.7664 0.1054
U30.0000 0.0000 0.0270 0.7735 0.0820
U40.9329 0.0701 0.0003 0.0000 0.0008
U50.0000 0.0001 0.0554 0.9464 0.0021
U60.5797 0.1235 0.0052 0.0000 0.0004
U70.0017 0.0486 0.7391 0.0119 0.0085
U80.7787 0.0621 0.0586 0.3358 0.0000
U90.7966 0.0833 0.0036 0.0472 0.0122
U100.0000 0.0039 0.6945 0.0798 0.0179
U110.0472 0.9968 0.0603 0.0003 0.0095
U120.0000 0.0169 0.8847 0.1030 0.5288
U130.0230 0.0309 0.0219 0.9964 0.0162
U140.0702 0.0000 0.0006 0.0062 0.7135
Table 5. Entropy values and weights of indicators.
MetricsU1U2U3U4U5U6U7
Hj0.9978 0.9973 0.9972 0.9983 0.9979 0.9980 0.9979
Wj0.0960 0.1163 0.1218 0.0745 0.0922 0.0850 0.0906
MetricsU8U9U10U11U12U13U14
Hj0.9987 0.9989 0.9981 0.9982 0.9996 0.9996 0.9995
Wj0.0576 0.0467 0.0822 0.0793 0.0187 0.0164 0.0226
Disclaimer/Publisher’s Note: The statements, opinions and data contained in all publications are solely those of the individual author(s) and contributor(s) and not of MDPI and/or the editor(s). MDPI and/or the editor(s) disclaim responsibility for any injury to people or property resulting from any ideas, methods, instructions or products referred to in the content.

