Abstract
This study examines the determinants of online and offline shopping trip choices and their implications for urban transportation, the environment, and the economy in Tehran, Iran. A questionnaire survey was conducted to collect data from 1000 active e-commerce users who successfully placed orders through both online and offline services in districts 2 and 5 of Tehran during the last 20 days of 2021. A deep neural network model was applied to predict the type of shopping trips based on 10 variables including age, gender, car ownership, delivery cost, and product price. The model’s performance was evaluated against four other algorithms: MLP, decision tree, LSTM, and KNN. The results demonstrated that the deep neural network model achieved the highest accuracy, with a rate of 95.73%. The most important factors affecting the choice of shopping trips were delivery cost, delivery time, and product price. This study offers valuable insights for transportation planners, e-commerce managers, and policymakers. It aims to help them design effective strategies to reduce transportation costs, lower pollutant emissions, alleviate urban traffic congestion, and enhance user satisfaction all while promoting sustainable development.
1. Introduction
E-commerce has transformed the way companies operate, customer behavior and needs, and business transactions [1]. A recent report by Lipsman predicts that global e-commerce sales of retail goods will reach $6.5 trillion by 2023, indicating a significant increase in online shopping trips. The market share of e-commerce in the total retail market is expected to grow from 10.4% to 22% (with sales totaling approximately $2.4 trillion) from 2017 to 2023. This trend has a substantial impact on transportation management, and logistics, affecting both delivery times and costs for customers [2]. One of the primary challenges remains the choice between online and offline shopping trips. For instance, in Korea, major retail companies such as Shinsegae Group (i.e., E-mart, Shinsegae Department Store) and Lotte Group (i.e., Lotte Mart, Lotte Department Store), which dominate the retail industry, face fierce competition in the online shopping and have created offline stores. However, even though Lotte Mart (an offline store) and Lotte Mart Mall (an online store) operate in the same product sales category, they compete strongly in terms of product sales [3]. Online product buyers often require fast delivery, so their orders should be processed as soon as they are placed. All the operations required to deliver these orders to customers are compressed into a short time frame, encompassing order processing, pickup, long-distance shipping, and delivery [1]. In online shopping, orders vary in location based on the customers’ preferences within the logistics system. The most important issue is the delivery and travel time for products to reach the customers who are the furthest away, which sometimes causes customer dissatisfaction stemming from possible delays or failing to meet expected delivery times.
This issue poses numerous challenges for choosing between online and offline shopping trips. Online shopping offers several advantages for customers, such as saving time, reducing travel expenses, accessing product discounts, 24/7 availability, avoiding queues, escaping crowds in the stores, easily accessing the list of desired products with their specifications, and making informed purchasing decisions. However, online shopping also has some disadvantages, such as delayed delivery, the absence of physical product touch, delivery costs, and the lengthy process of returning the product, which often leads many buyers to prefer offline shopping at the nearest physical store. Naturally, both types of shopping, online and offline, require the evaluation of shopping trips. Therefore, it is necessary to predict the type of shopping trip that can be made by the customer (offline trips) or the companies offering online products (online trips) by measuring the factors influencing the customer’s choice between online and offline shopping. This demonstrates the importance and the need to conduct this research and using methods based on artificial intelligence and machine learning.
The travel decision-making process related to travel is of great importance in transportation planning, and its application, informed by effective information and detailed analysis can serve as a predictive indicator for future development. The significance of travel production within transportation demand management has led to extensive studies for different travel purposes. Daily trips undertaken by residents serve purposes such as work, shopping, education, and recreation. According to the studies conducted in Tehran, approximately 15% to 18% of trips are for shopping purposes [4], which shows the importance of this type of trip after work trips for the studies in question. By identifying and prioritizing the factors influencing the occurrence of online and offline shopping trips, we can significantly contribute to the reduction of transportation costs, pollutant emissions, urban traffic, user satisfaction congestion, and enhanced and sustainable development. According to surveys conducted in 24 countries including India, China, the USA, Germany, and Japan, it has been revealed that on average only 10% of daily trips are made for online shopping and 90% of trips are made for offline shopping in one day [4].
Tehran is the most populous city and the capital of Iran, with a population of over 9 million people. According to the 2018 estimate by the United Nations, it ranks as the 34th most populous city in the world and the most populous city in West Asia. Tehran metropolis is the second most populated metropolis in the Middle East. Due to the specific style of modern and traditional life in Tehran, the types of shopping trips in this city are diverse [5]. Table 1 shows the number of online and offline shopping trips in one day in Tehran [4].

Table 1.
Number of trips with the purpose of shopping in one day in Tehran [4].
Due to their high computational efficiency, deep learning algorithms are widely used in various fields of urban transportation, such as traffic monitoring, accident avoidance, traffic intersections, autonomous vehicles, and intelligent transportation systems, and have attracted the attention of experts and specialists in this field [6].
The type of shopping trip is an important factor that varies depending on whether the shopping is conducted online or offline. In the context of online shopping, the logistics system plays a crucial role in the product supply chain of Internet companies. The logistics system encompasses the transfer, movement, processing, and access to logistics information facilitating the integration of transportation, ordering, manufacturing processes, order changes, production scheduling, logistics planning, and warehousing operations. In the case of offline shopping, the choice of travel mode and the transportation system utilized by customers hold economic and environmental implications. Therefore, estimating the type of travel is the main topic of this paper. Due to the large volume of data associated with shopping trips in both online and offline shopping, it is necessary to adopt new methods based on artificial intelligence technologies and machine learning algorithms. The main objective of this paper is to leverage a machine learning approach, specifically deep learning, to develop a travel prediction model for online and offline shopping in Tehran, following the identification of the factors that influencing trip creation. The research questions that guide this paper are as follows:
- What are the main factors that influence the type of shopping trip in Tehran?
- How can a deep learning approach improve the accuracy and reliability of estimating the type of shopping trip in Tehran?
- How does the proposed model compare with other methods for estimating the type of shopping trip in Tehran?
This paper is structured as follows. Section 2 provides a review of the literature and previous research on estimating the type of shopping trip. Section 3 describes the research method, which comprises of a deep learning approach and its associated steps. Section 4 presents the results obtained by applying the proposed method and compares them with other methods. Section 5 is the discussion, and finally Section 6 concludes the paper by summarizing the main contributions and findings and suggesting future work directions. This paper makes the following contributions:
- A cost-effective method is presented to accurately estimate the type of shopping trip.
- Providing an effective alternative method for transportation decision-making and urban traffic resource allocation.
- Integration of decision models and machine learning methods in order to improve the travel type estimation system.
- Using a CNN-based approach to estimate shopping trips.
2. Literature Review
In recent years, various studies have examined customer behavior to determine the nature of shopping trips, particularly considering the increasing demand for e-commerce and online shopping. Contrarily, environmental concerns have also increased due to car emissions, which partly result from offline shopping trips. The literature review is divided into two subsections:
- Online and offline shopping behavior and the factors that influence it.
- Machine learning methods for predicting online and offline shopping trips.
2.1. Online and Offline Shopping Behavior and the Factors That Influence It
2.1.1. Shao et al. [7]
Shao et al. assessed the impacts of physical and virtual accessibility on e-commerce, considering the geographical location of buyers. They used a spatial autoregressive model (SAC) to analyze how physical and virtual accessibility influenced the spatial distribution of online shopping trips across 276 provincial-level cities in China. The results indicated that both physical access (measured factors such as the relative number of shopping centers and public transportation systems) and virtual access (measured by the percentage of broadband subscribers and the relative number of delivery points) enhance online shopping trips [7].
2.1.2. Xiong [8]
Xiong examined consumer behavior in online shopping in the context of artificial intelligence and the digital economy. The focus of this paper was on the factors that affected the online shopping trip intention within a day. Based on data collected through a questionnaire, the study found that online shopping trips were prevalent across all age groups in China, with a higher prevalence among young people [8].
2.1.3. Espinoza et al. [9]
Espinoza et al. examined consumer behavior in online and offline shopping trips in the context of the coronavirus pandemic. They collected primary data through a structured questionnaire and an online survey encompassing 200 diverse product types to investigate the factors influencing people’s purchasing choices. They found that the respondents’ skill level in using the Internet, among various technological factors, had a significant effect on their preference for the mode of shopping trips. They also found that factors such as easy access to product information, a wider product selection, competitive pricing, and discounts influenced customers to opt for online shopping trips. In contrast, faster delivery times and reliability and accuracy of product quality influenced consumers to choose offline shopping trips [9].
2.1.4. Shi et al. [10]
Shi et al. proposed an approach to improve support service decision-making by predicting offline shopping trip interactions and intentions in real time using historical time series data. They analyzed real-time consumer behavior data of offline customers. They confirmed that context-aware interaction could significantly enhance consumers’ shopping experience in the offline scenario [10].
2.2. Machine Learning Methods for Predicting Online and Offline Shopping Trips
2.2.1. Dong et al. [11]
Dong et al. applied a machine learning approach to estimate customer behavior for a large multipurpose online store between October and November 2019. They found that the pipeline and random forest algorithms had the highest performance with 96% accuracy. They also showed that the indicators of busyness and product price comparisons had the most significant impact on increasing the intention for online shopping trips [11].
2.2.2. Xiahou and Harada [12]
Xiahou and Harada explored the online and offline shopping behavior using machine learning techniques along with longitudinal and multidimensional data variables. They introduced a churn user prediction model by combining k-means customer segmentation with the support vector machine (SVM). The results indicated that the online shopping trip intention was higher than the offline one. They also found that the SVM method had higher accuracy than the logistic regression method [12].
2.2.3. Lee et al. [13]
Lee et al. applied and compared different machine learning algorithms to predict online shopping trip conversion using 374,749 online consumer behavior data from the Google product store. Their investigation identified the ensemble model of the incremental gradient method as the most suitable method for predicting online shopping trip conversion, and that oversampling was the best method to reduce the bias of data imbalance [13].
2.2.4. Chawla et al. [14]
Chawla et al. used artificial neural networks (ANN) to predict offline shopping trip demand for an American retail company. They developed a comparative forecasting mechanism utilizing both ANN and ANFIS techniques to address the trip demand forecasting challenges in fuzzy conditions. They evaluated the results and showed that the ANFIS method was more effective than the ANN structure in producing more reliable forecasts for their case study [14]. A summary of the literature review is presented in Table 2.
Table 2.
Summary of literature review.
Based on the literature review, we found that despite the high importance of the problem and the research that has been done in this field, most of them focused on customer behavior and demand estimation, and it seems that some aspects of this research have not received enough attention. Moreover, according to the research conducted, it seems that the choice between online and offline shopping has not been considered as a multi-criteria decision-making problem and has only been investigated and analyzed separately. Therefore, the contributions of this paper can be stated as follows:
- Using the deep learning approach to estimate online and offline shopping trips.
- Examining and prioritizing the factors that affect the generation of online and offline shopping trips.
3. Methodology
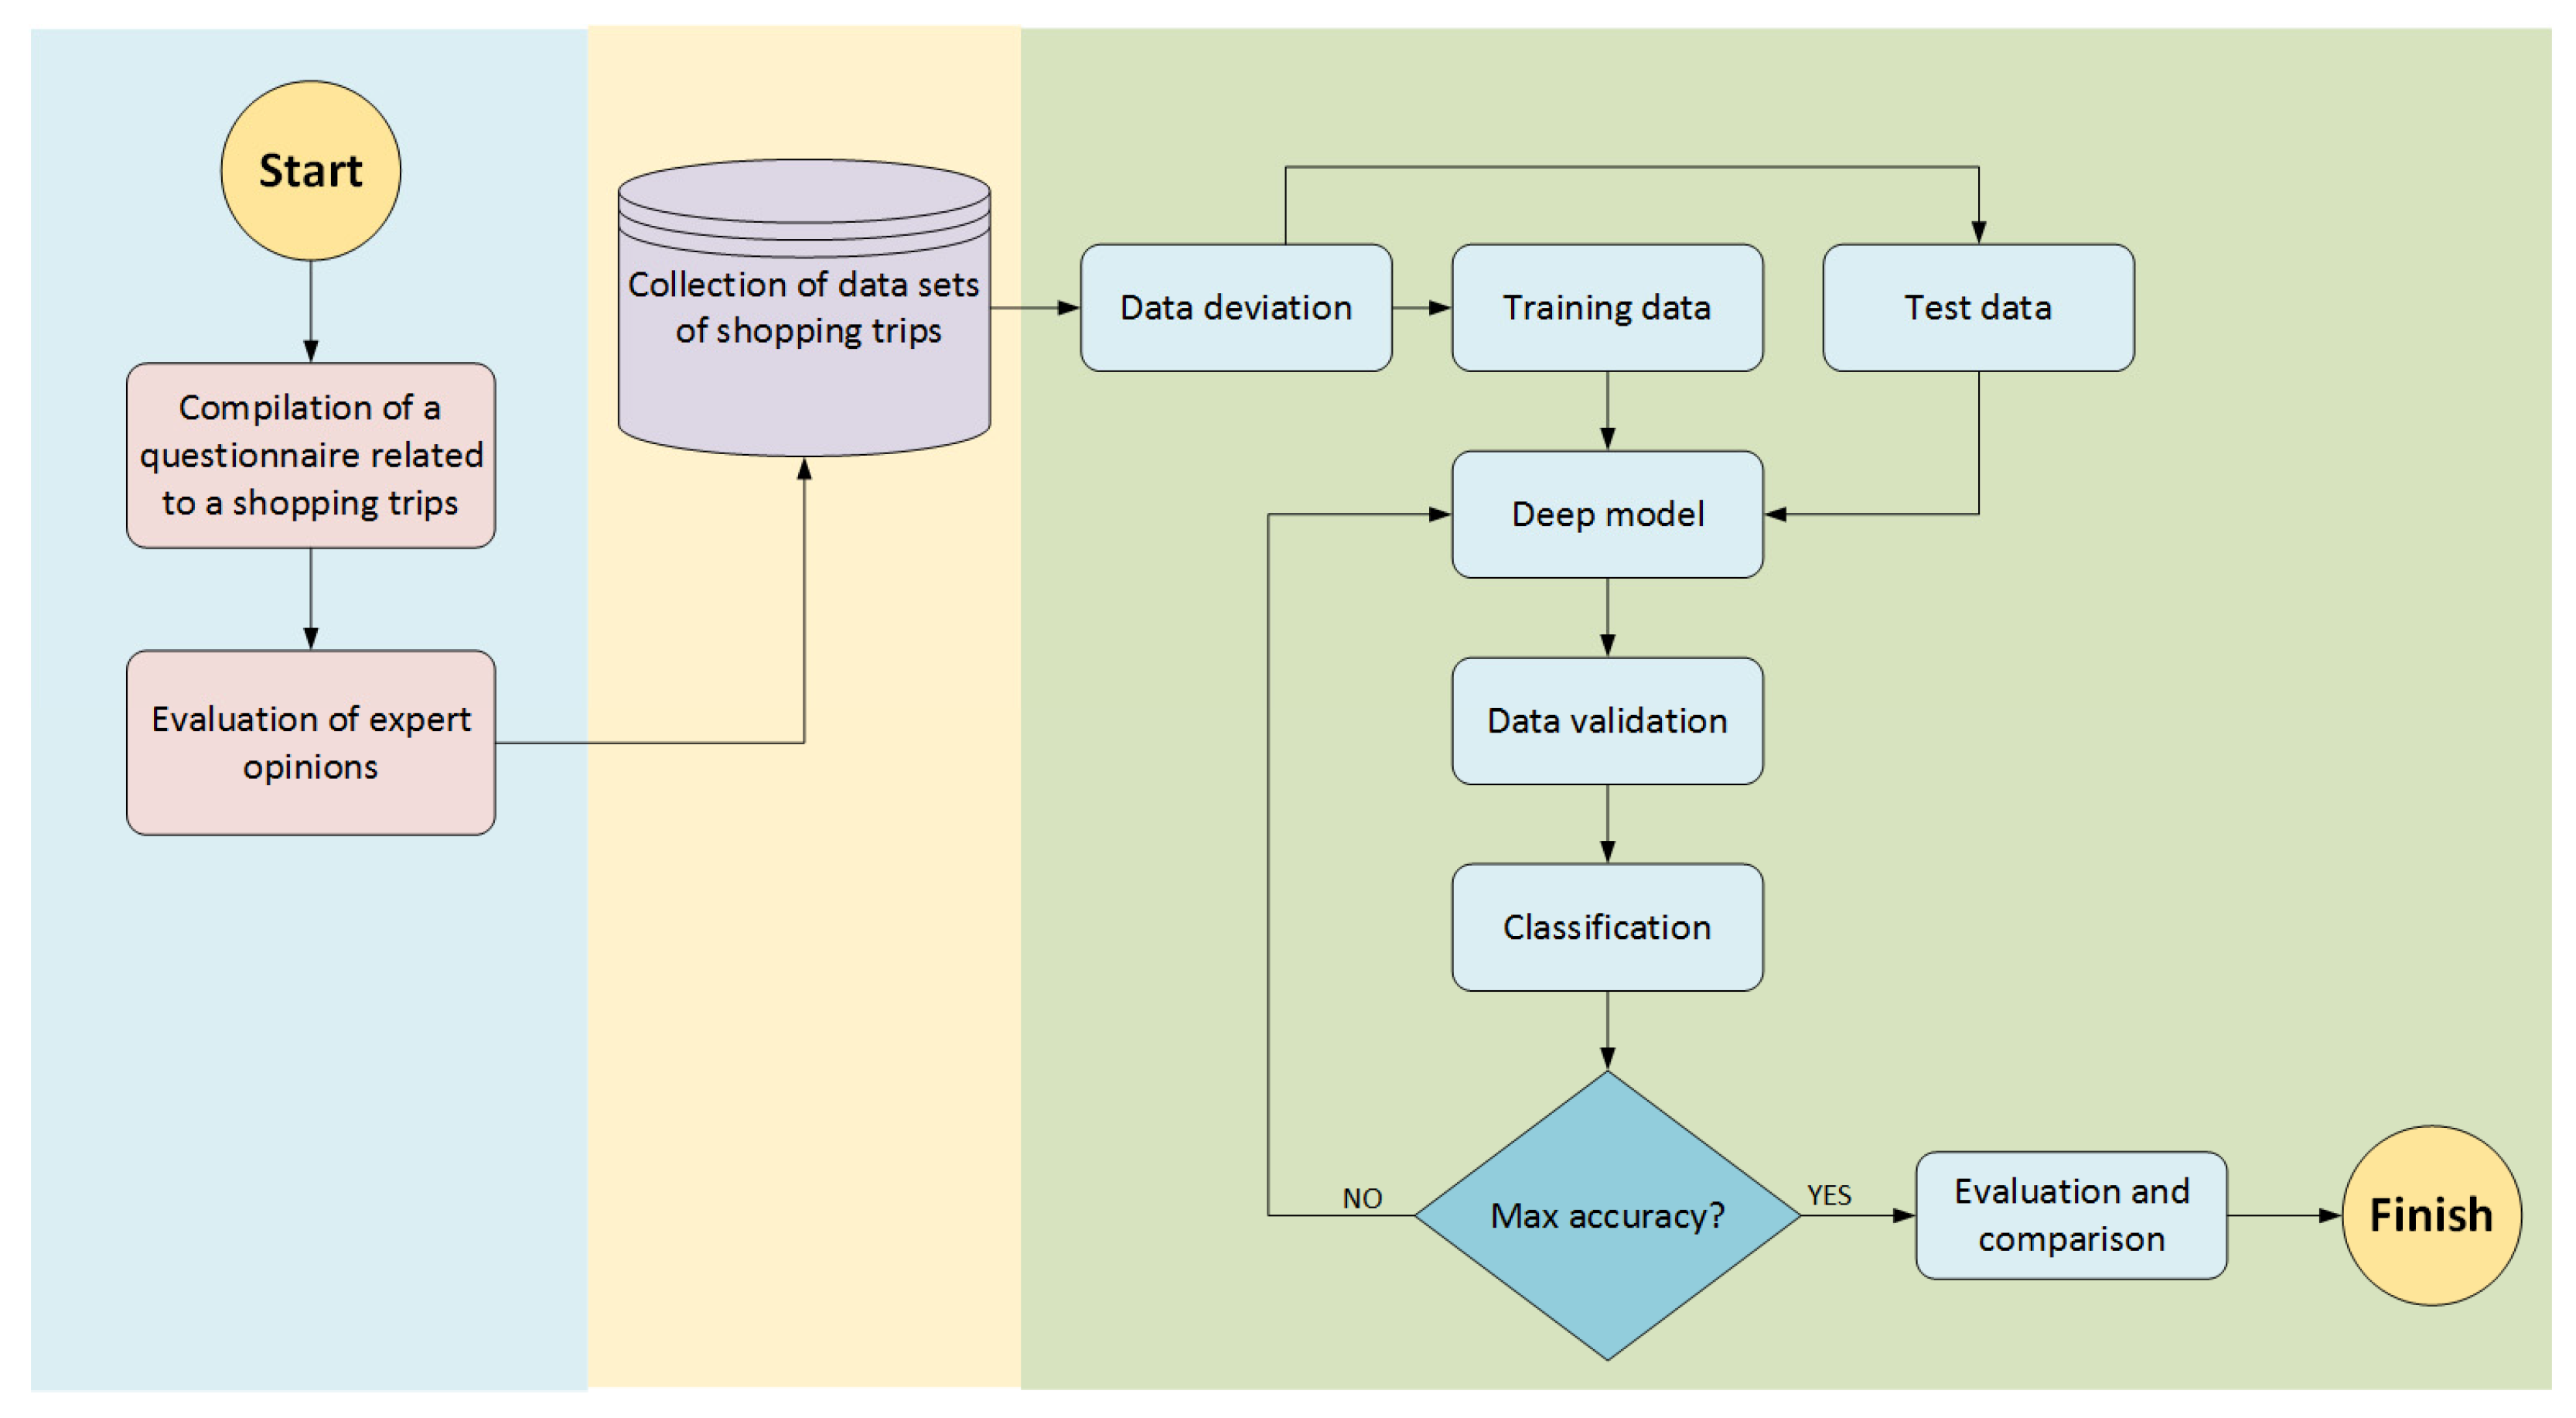
This research uses machine learning methods for analysis. The feature selection is done by using supervised machine learning algorithms, namely, deep networks. Figure 1 shows the general procedure of the proposed method as a flowchart.
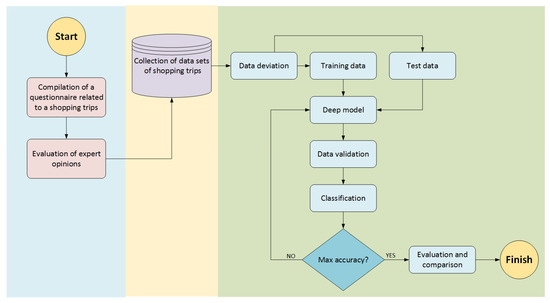
Figure 1.
Flowchart of the proposed method.
In the first step, we collected 500 questionnaires from online shopping trips through text messages and 500 questionnaires from offline shopping trips which were strategically placed within shopping centers in districts 2 and 5 of the Tehran metropolis, according to the data frequency and calculations using Cochran’s formula. The statistical population of this research consisted of 1000 active e-commerce users residing in districts 2 and 5 of Tehran who had successfully placed orders in the last 20 days of 2021 in online and offline services, therefore we used purposive sampling. All of these questionnaires included factors such as age, gender, marital status, car ownership, delivery cost, delivery time, product price, income, employment status, and level of education as the factors affecting the shopping trip. The questionnaire and additional information about it are available in the Appendix A section. Since the deep learning method requires numerical data, we converted the values obtained from the questionnaires into quantitative values using the following Table 3, so that they could be used as input for the deep network.
Table 3.
Changing qualitative data to quantitative.
In this paper, we used the Cronbach’s alpha method in Equation (1) to estimate the validity of the questionnaire [18]. We distributed 100 questionnaires to a random sample in a pre-test and calculated the Cronbach’s alpha coefficient using the SPSS 22 software.
is equal to Cronbach’s alpha coefficient, K is equal to the number of questionnaire questions, is the variance related to the i-th question, and is equal to the total variance of the test. The alpha coefficient indicates the extent to which the questions are consistent, and the respondents answered them with accuracy and knowledge. For research purposes, a reliability between 0.6 and 0.8 is considered appropriate. A questionnaire is reliable when the value of Cronbach’s alpha is greater than 0.7 and the closer this value is to 1, the questionnaire has higher reliability [19]. The results of validity of the questionnaire are provided in Table 4.
Table 4.
The validity of the questionnaire.
Table 4 shows that the Cronbach’s alpha coefficient for all indicators is above 0.7, indicating the reliability of the questionnaire.
After converting the qualitative data into quantitative data, we organized the data sets for input into the deep neural network. Then, we performed data preprocessing and determined the deep network architecture. We prepared the data for both the training and testing stages and presented the results. We sorted and labeled the data, and finally, we examined it. Table 5 shows a sample of data that is labeled.
Table 5.
Part of the data used in estimating the type of shopping trip.
4. Results
The first step is to present the descriptive statistics of the statistical population. Table 6 shows this information.
Table 6.
Demographics of obtained data.
Next, we discuss the estimation of shopping-oriented trip modes using deep learning. In this research, we utilize a convolutional neural network (CNN) as the main algorithm. Within the fully connected layer, we obtain the feature vector (using the activation command in MATLAB R2022a) and use it as a deep feature. We use the stochastic gradient descent (SGD) algorithm to train CNN. Table 7 shows the parameters used for the SGD algorithm. We also set the number of training epochs to 40 in the network.
Table 7.
Initial settings of the CNN model.
One thing that can be noted about the model’s performance is that the neural network work is based on training and testing data. In the system preprocessing, we used 70% of the data for training and 30% for testing. However, since the system randomly selects data for training and some others for testing in each run, the results may have a slight difference, which is insignificant. We also note that the results are based on the best outcomes after 15 runs of the neural network, which are directly related to the data selection and the system implementation. Upon executing the CNN model, we found that this model achieved F1. Score 96.15 for estimating the shopping trip mode. Figure 2 displays the correlation plot of the proposed CNN network, showcasing the distribution of training and testing data. As seen, the correlation of the results was R = 0.91934.
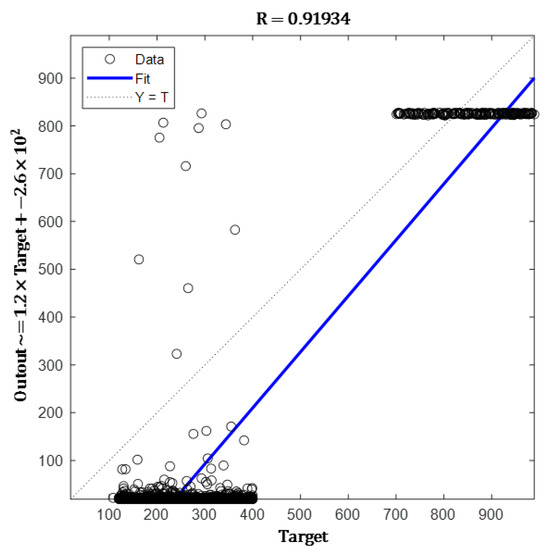
Figure 2.
Data correlation.
In the next step, we compared the results obtained by the deep learning algorithm with those obtained by other models, including K-nearest neighbor (KNN), decision tree (DT), multi-layer perceptron (MLP) neural network, and long short-term memory (LSTM). To compare the accuracy, precision, recall, F1-score, Mean Squared Error (MSE), and Root Mean Squared Error (RMSE) have been used as provided in Equation (2) to Equation (7) [20,21]. Table 8 and Figure 3 shows the result of this comparison.
Table 8.
Comparison of shopping type estimation.
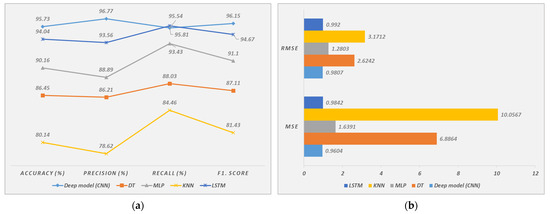
Figure 3.
Comparison of shopping type estimation. (a): Accuracy, Precision, Recall, and F1·Score. (b): MSE and RMSE.
5. Discussion
In today’s economic world, having accurate and timely information is invaluable for business owners, investors, creditors, and other stakeholders when making financial decisions. With the development of technology, the use of simple models for predicting customer behavior and shopping trip modes has become possible for all industries and manufacturing companies. The availability of simple and powerful tools to predict shopping trips can help owners to prevent bankruptcy and take necessary measures to improve the company’s condition based on the customers’ purchase or non-purchase. Predicting customer behavior and shopping trip modes holds paramount importance issues within decision-making in industries, considering the effects and consequences of this phenomenon at both micro and macro levels of society. There are various tools and models, each of which differs in the method or predictor variable. Also, it is obvious that for any type of shopping trip, whether online or offline, a logistics system must be adopted (shopping by private car or public transport for offline shopping and using a logistics fleet to deliver the product for online shopping). Depending on the type of online or offline shopping, the shopping trip mode is very important. The logistics system, encompassing the transmission, movement, processing, and access to logistics information for the seamless integration of transportation, ordering, manufacturing processes, order changes, production scheduling, logistics planning, and warehousing operations, is the most important part of the supply chain of companies. On the other hand, in offline shopping trips, the choice of travel mode and customer transportation systems by customers, in addition to economic issues, also involve environmental issues. Based on this, estimating the type of travel can be adopted as the main topic of this dissertation. Due to the large amount of data related to shopping-oriented trips that exist in both online and offline shopping, it is necessary to adopt new methods based on artificial intelligence and computing technologies.
6. Conclusions and Future Work
Based on this, in this research, we used machine learning techniques and specifically deep learning to evaluate the data results. In this research, considering the data frequency in areas 2 and 5 of the Tehran metropolis and calculations based on Cochran’s formula, we provided 1500 questionnaires to the people of these areas. Finally, we collected 1000 questionnaires from 1000 active e-commerce users living in areas 2 and 5 of Tehran who had successful orders in online and offline services in the last 20 days of 2021. The results of the descriptive statistics of the respondents showed that the largest share of people in the statistical population were single men in the age range of 18–35 years without owning a car and having a bachelor’s degree with an income level of 10–15. It was also found that most of these people were full-time employees. Also, based on the reviews conducted in the articles and consultation with experts, we used age, gender, marital status, car ownership, delivery cost, delivery time, product price, income, employment status, and education level as indicators affecting the type of shopping trip. In the next step, after determining the optimal architecture of the deep network, we evaluated the results and estimated the travel mode. To compare the proposed method with other methods, we used MLP, LSTM, DT, and KNN algorithms. The results showed that the deep model had the best performance with an accuracy of 95.73%. After the CNN algorithm, the LSTM algorithm is later with an accuracy of 94.04%. This means that the proposed approach has been able to improve the accuracy of LSTM in estimating the shopping-based trips by 1.69%. In future works, we will try to use new meta-heuristic approaches such as the gray wolf algorithm to first adjust the hyperparameters of the CNN algorithm, and then simultaneously with the selection of the feature by the CNN model, we will also perform the feature dimension reduction operation to improve the accuracy and time.
Author Contributions
Conceptualization, M.D., A.N. and T.A.; methodology, M.D., A.N. and T.A.; software, M.D.; validation, M.D., A.N. and T.A.; formal analysis, M.D.; investigation, M.D.; resources, M.D., A.N. and T.A.; data curation, M.D.; writing—original draft preparation, M.D.; writing—review and editing, M.D.; visualization, M.D.; supervision, A.N.; project administration, M.D.; funding acquisition, A.N. All authors have read and agreed to the published version of the manuscript.
Funding
This research received no external funding.
Institutional Review Board Statement
Not applicable.
Informed Consent Statement
Not applicable.
Data Availability Statement
Data available on request from the authors.
Conflicts of Interest
The authors declare no conflict of interest.
Appendix A
In this section, we describe the questionnaire in more detail, and you see the questionnaire in Figure A1.
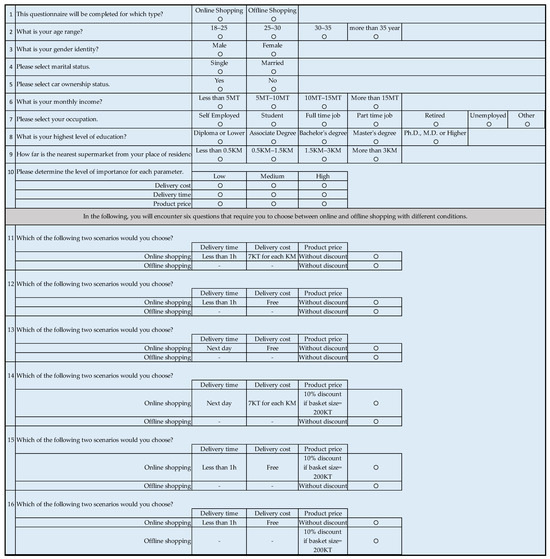
Figure A1.
Questionnaire.
Figure A1.
Questionnaire.
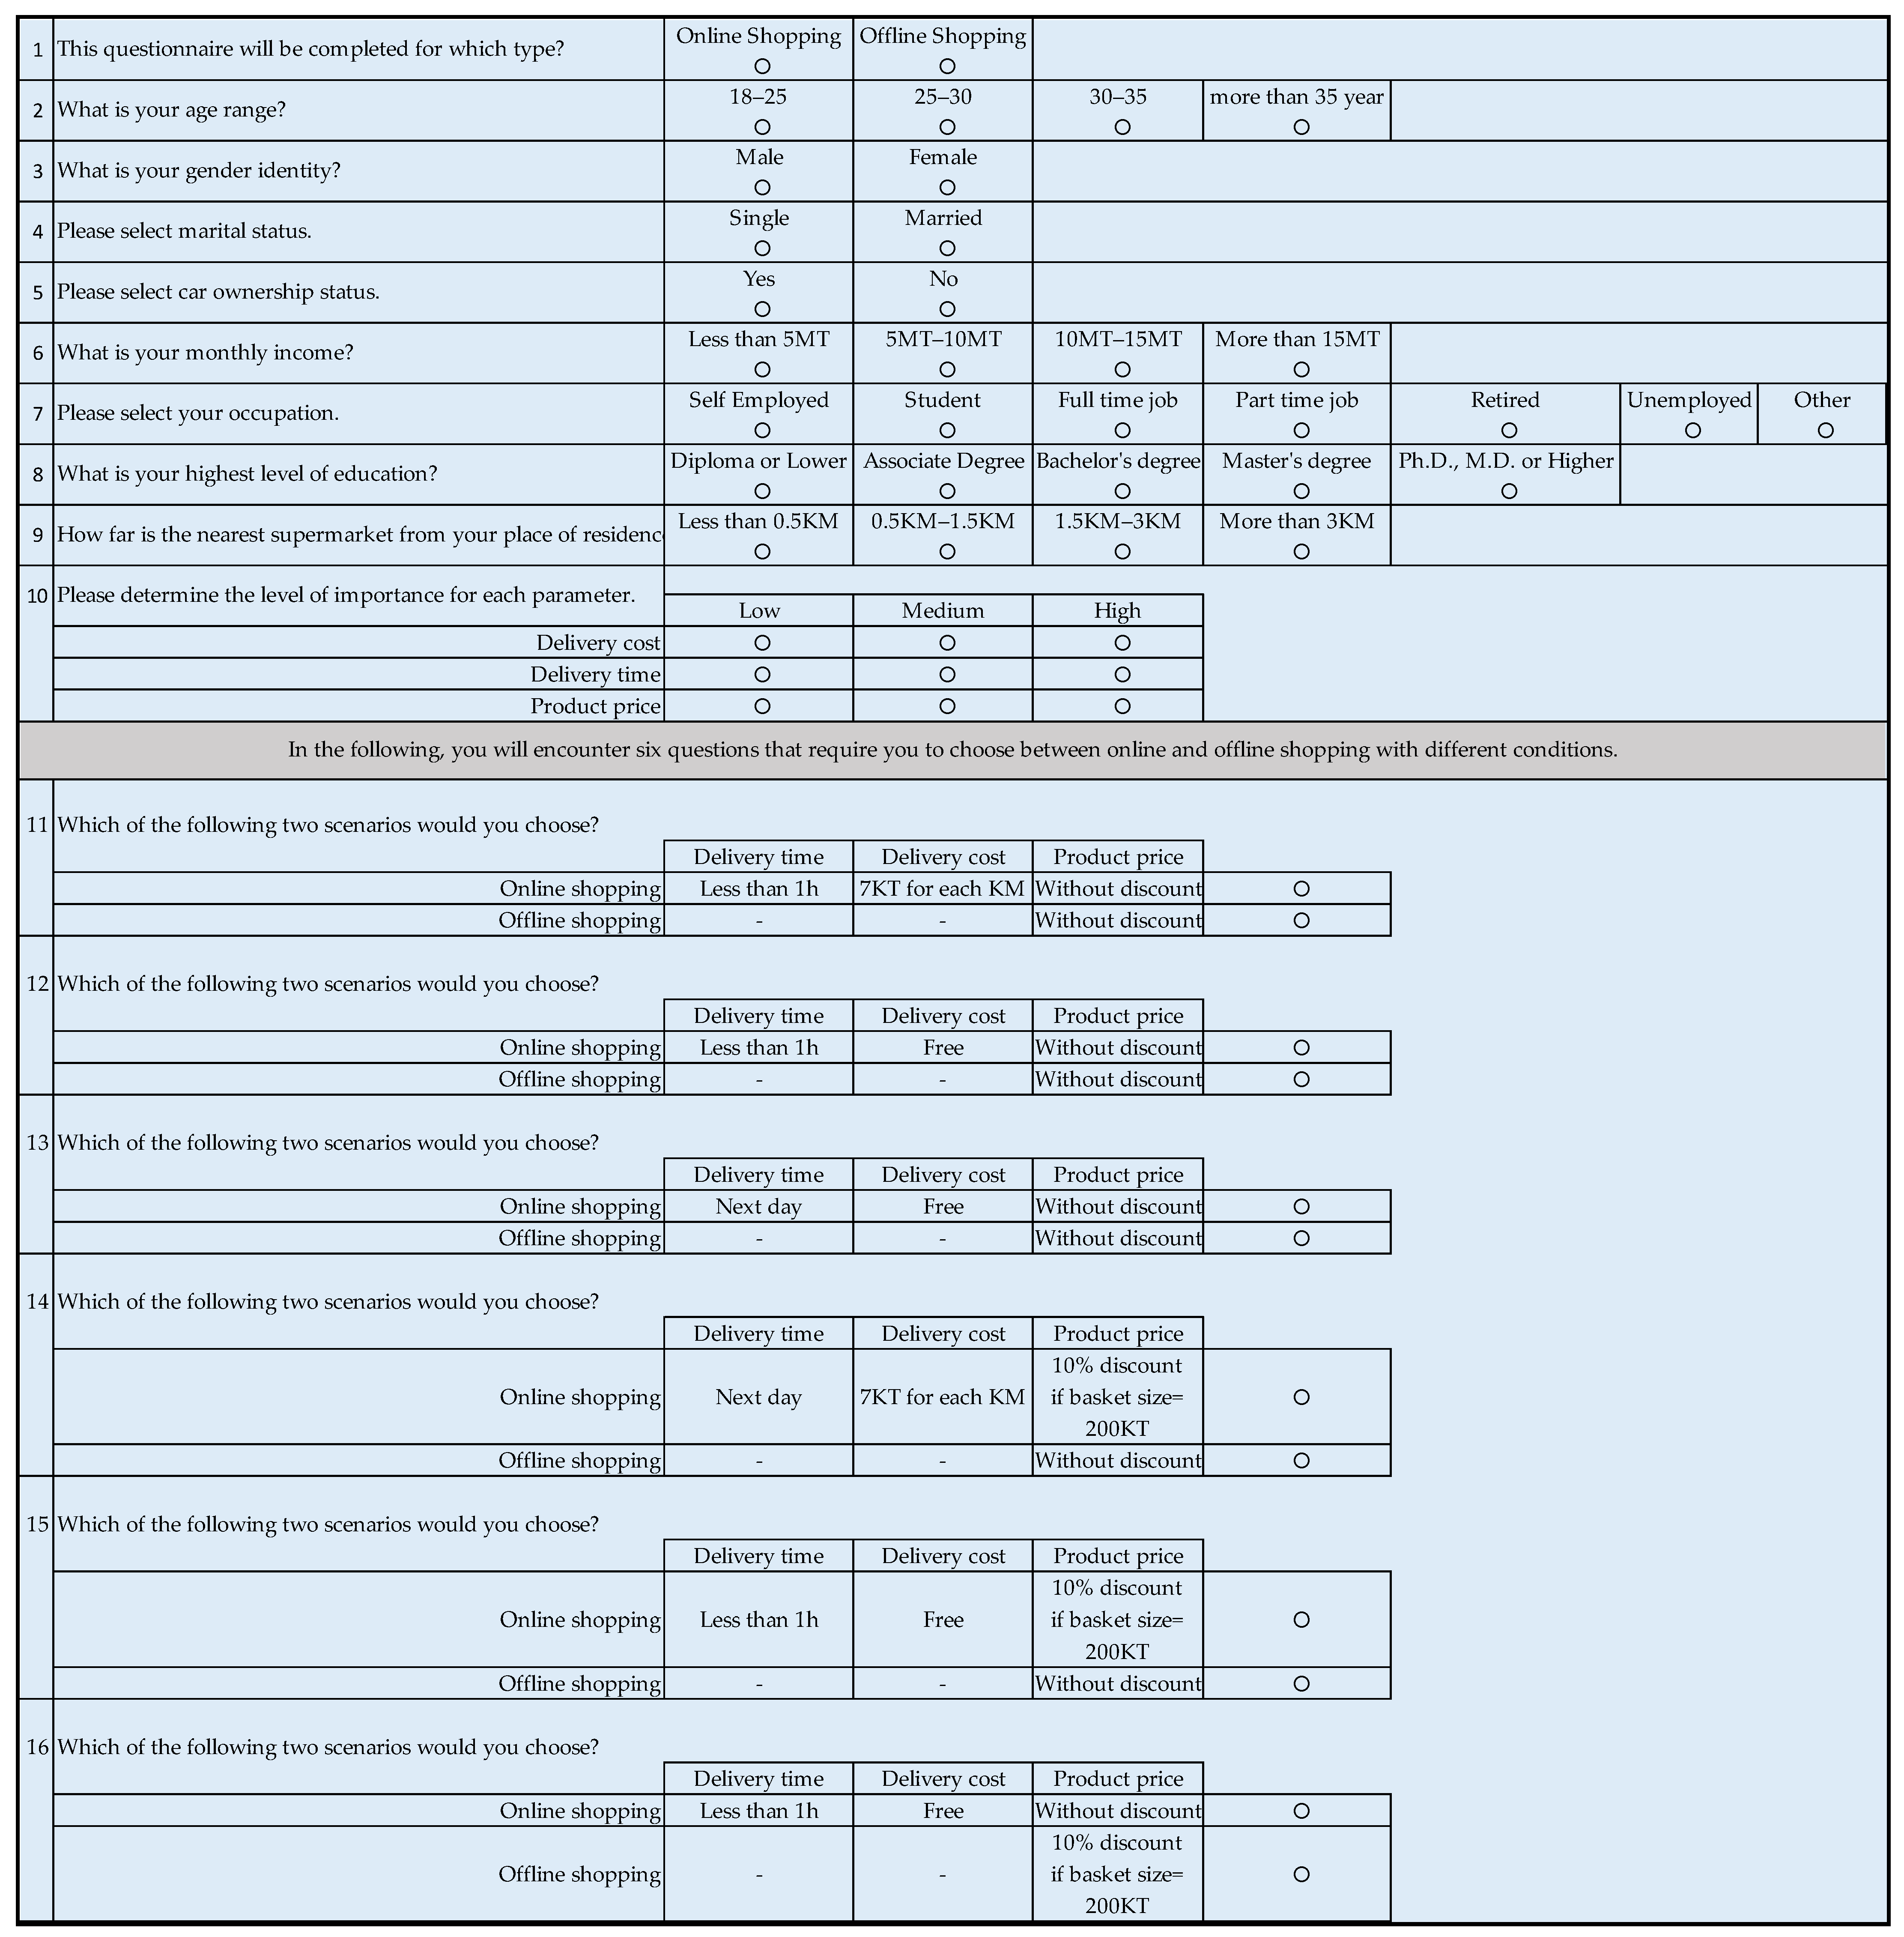
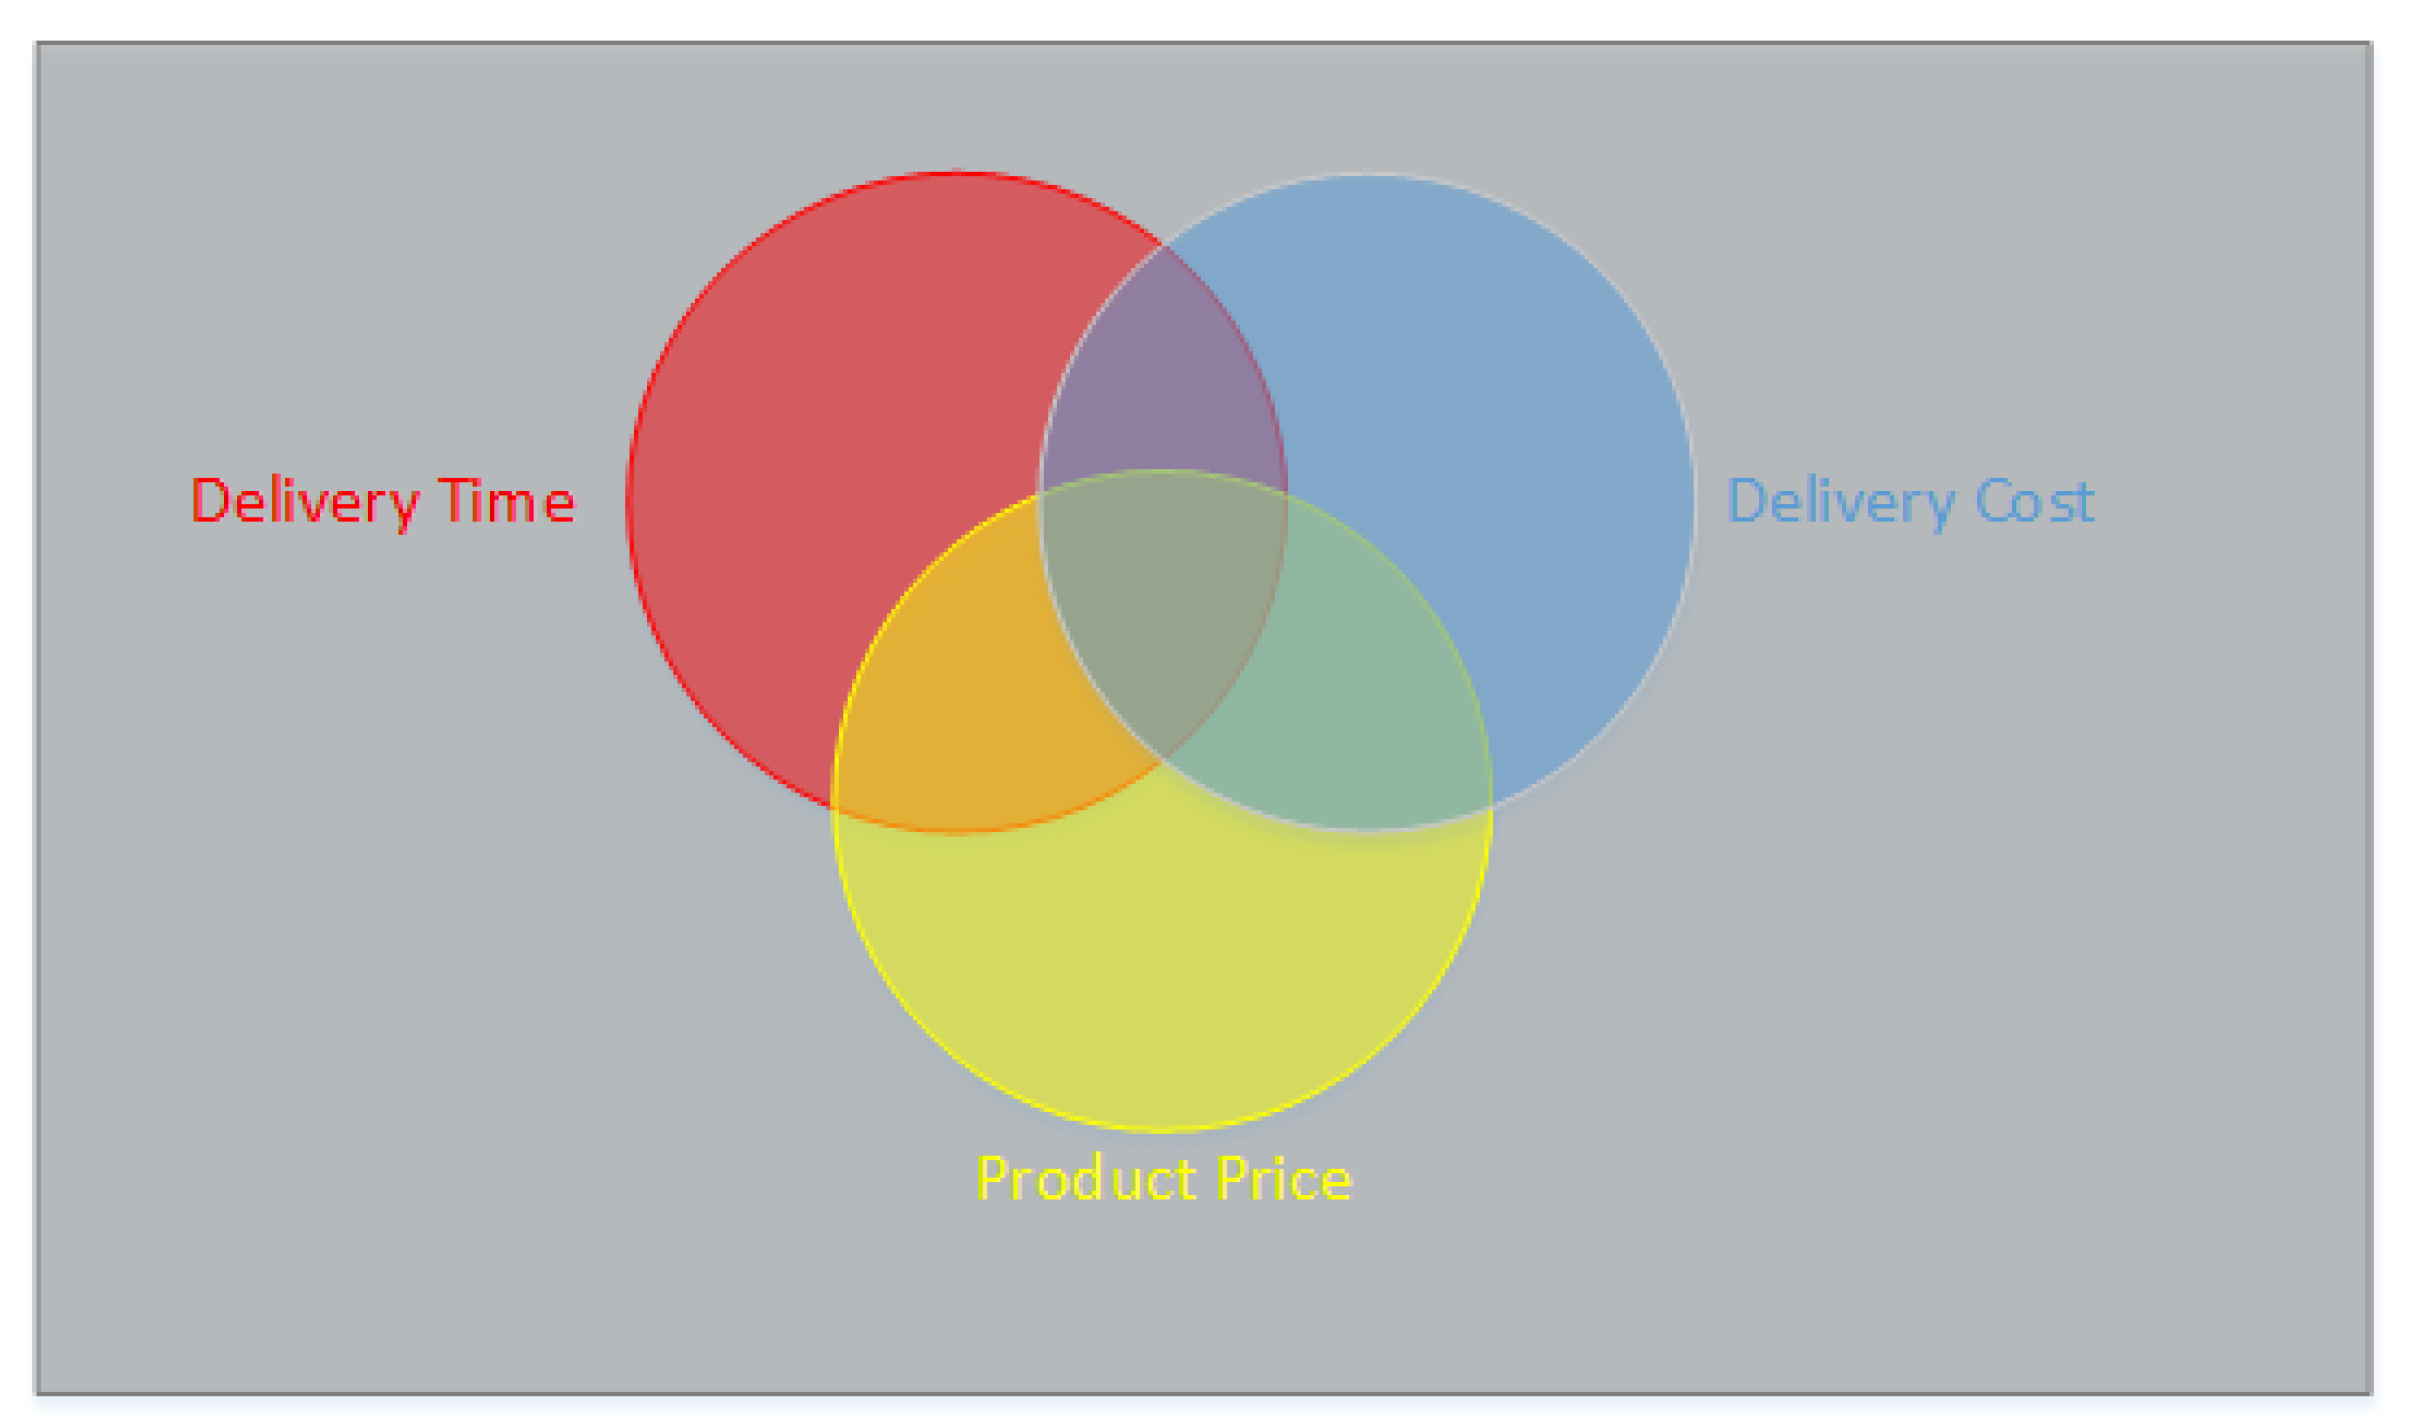
Figure A2 shows a three-circle Venn diagram that illustrates the importance of the decision between online shopping and offline shopping by delivery cost, delivery time, and product price. The circles represent the three factors that influence the customer’s choice of shopping mode. The overlapping regions represent the trade-offs or preferences that the customer has to consider. For example, the region where all three circles overlap represents the ideal situation where the customer can get low delivery cost, fast delivery time, and reasonable product price, regardless of whether they shop online or offline. The region where only delivery cost and delivery time overlap represents the situation where the customer values these two factors more than product price and may choose online shopping if it offers cheaper and faster delivery than offline shopping. The region where only product price and delivery time overlap represents the situation where the customer values these two factors more than delivery cost and may choose offline shopping if it offers better quality and availability of products than online shopping. The region where only delivery cost and product price overlap represents the situation where the customer values these two factors more than delivery time and may choose either online or offline shopping depending on their budget and needs. The regions where only one circle is present represent the situations where the customer values only one factor and may choose online or offline shopping based on that factor alone.

Figure A2.
A Venn diagram of customer decision factors for online and offline shopping.
Figure A2.
A Venn diagram of customer decision factors for online and offline shopping.
This questionnaire aims to simulate a situation for customers to select online or offline shopping. The questionnaire consists of six questions, each presenting a scenario where the customer has to choose between the following two options: online shopping or offline shopping. The options vary in terms of the three factors that influence the customer’s decision: delivery cost, delivery time, and product price. The customer has to indicate their preference for each option. The questionnaire is designed to collect data for training a CNN model that can learn the patterns and features of customer behavior and preferences. The CNN model can then be used to predict the customer’s choice of shopping mode for new scenarios or situations.
References
- Archetti, C.; Bertazzi, L. Recent challenges in Routing and Inventory Routing: E-commerce and last-mile delivery. Networks 2021, 77, 255–268. [Google Scholar] [CrossRef]
- Global Ecommerce. 2019. Available online: https://www.emarketer.com/content/global-ecommerce-2019 (accessed on 27 June 2019).
- Stocchi, L.; Michaelidou, N.; Pourazad, N.; Micevski, M. The rules of engagement: How to motivate consumers to engage with branded mobile apps. J. Mark. Manag. 2018, 34, 1196–1226. [Google Scholar] [CrossRef]
- Annual Report of Urban Traffic and Transportation Organization in Tehran City. 2020. Available online: https://www.ictte.ir/data/cnf1668321135/uploads/amar/1399.pdf (accessed on 20 January 2021).
- World Urbanization Prospects. United Nations. New York. 2019. Available online: https://population.un.org/wup/publications/Files/WUP2018-Highlights.pdf (accessed on 11 February 2020).
- Moshayedi, A.J.; Roy, A.S.; Taravet, A.; Liao, L.; Wu, J.; Gheisari, M. A secure traffic police remote sensing approach via a deep learning-based low-altitude vehicle speed detector through uavs in smart cites: Algorithm, implementation and evaluation. Future Transp. 2023, 3, 189–209. [Google Scholar] [CrossRef]
- Shao, R.; Derudder, B.; Witlox, F. The geography of e-shopping in China: On the role of physical and virtual accessibility. J. Retail. Consum. Serv. 2022, 64, 102753. [Google Scholar] [CrossRef]
- Xiong, Y. The Impact of Artificial Intelligence and Digital Economy Consumer Online Shopping Behavior on Market Changes. Discret. Dyn. Nat. Soc. 2022, 2022, 9772416. [Google Scholar] [CrossRef]
- Espinoza, M.C.; Ganatra, V.; Prasanth, K.; Sinha, R.; Montañez, C.E.O.; Sunil, K.M.; Kaakandikar, R. Consumer behavior analysis on online and offline shopping during pandemic situation. Int. J. Account. Financ. Asia Pac. 2021, 4, 75–87. [Google Scholar] [CrossRef]
- Shi, F.; Guegan, C.G. Adapted Decision Support Service Based on the Prediction of Offline Consumers’ Real-Time Intention and Devices Interactions. In Proceedings of the 42nd Annual Computer Software and Applications Conference (COMPSAC), Tokyo, Japan, 23–27 July 2018; IEEE: Piscataway, NJ, USA, 2018; Volume 2, pp. 266–271. [Google Scholar] [CrossRef]
- Dong, Y.; Tang, J.; Zhang, Z. Integrated Machine Learning Approaches for E-commerce Customer Behavior Prediction. In Proceedings of the 2022 7th International Conference on Financial Innovation and Economic Development (ICFIED 2022), Zhuhai, China, 14–16 January 2022; Atlantis Press: Amsterdam, The Netherlands, 2022; pp. 1008–1015. [Google Scholar] [CrossRef]
- Xiahou, X.; Harada, Y. B2C E-Commerce Customer Churn Prediction Based on K-Means and SVM. J. Theor. Appl. Electron. Commer. Res. 2022, 17, 458–475. [Google Scholar] [CrossRef]
- Lee, R.J.; Sener, I.N.; Mokhtarian, P.L.; Handy, S.L. Relationships between the online and in-store shopping frequency of Davis, California residents. Transp. Res. Part A Policy Pract. 2017, 100, 40–52. [Google Scholar] [CrossRef]
- Chawla, A.; Singh, A.; Lamba, A.; Gangwani, N.; Soni, U. Demand forecasting using artificial neural networks—A case study of American Retail Corporation. In Applications of Artificial Intelligence Techniques in Engineering; Springer: Singapore, 2019; pp. 79–89. [Google Scholar] [CrossRef]
- Jiang, H.; He, M.; Xi, Y.; Zeng, J. Machine-Learning-Based User Position Prediction and Behavior Analysis for Location Services. Information 2021, 12, 180. [Google Scholar] [CrossRef]
- Zubaidi, S.L.; Al-Bugharbee, H.; Ortega-Martorell, S.; Gharghan, S.K.; Olier, I.; Hashim, K.S.; Kot, P. A novel methodology for prediction urban water demand by wavelet denoising and adaptive neuro-fuzzy inference system approach. Water 2020, 12, 1628. [Google Scholar] [CrossRef]
- Punia, S.; Nikolopoulos, K.; Singh, S.P.; Madaan, J.K.; Litsiou, K. Deep learning with long short-term memory networks and random forests for demand forecasting in multi-channel retail. Int. J. Prod. Res. 2020, 58, 4964–4979. [Google Scholar] [CrossRef]
- Kennedy, I. Sample Size Determination in Test-Retest and Cronbach Alpha Reliability Estimates. Br. J. Contemp. Educ. 2022, 2, 17–29. [Google Scholar] [CrossRef]
- Collins, L.M. Research Design and Methods. In Encyclopedia of Gerontology; Elsevier: Amsterdam, The Netherlands, 2007; Volume 2, pp. 419–429. [Google Scholar] [CrossRef]
- Kamel, S.R.; YaghoubZadeh, R.; Kheirabadi, M. Improving the performance of support-vector machine by selecting the best features by Gray Wolf algorithm to increase the accuracy of diagnosis of breast cancer. J. Big Data 2019, 6, 90. [Google Scholar] [CrossRef]
- Dou, Z.; Sun, Y.; Zhu, J.; Zhou, Z. The Evaluation Prediction System for Urban Advanced Manufacturing Development. Systems 2023, 11, 392. [Google Scholar] [CrossRef]


Disclaimer/Publisher’s Note: The statements, opinions and data contained in all publications are solely those of the individual author(s) and contributor(s) and not of MDPI and/or the editor(s). MDPI and/or the editor(s) disclaim responsibility for any injury to people or property resulting from any ideas, methods, instructions or products referred to in the content. |
© 2023 by the authors. Licensee MDPI, Basel, Switzerland. This article is an open access article distributed under the terms and conditions of the Creative Commons Attribution (CC BY) license (https://creativecommons.org/licenses/by/4.0/).